the rise of the “redback” and china’s capital account ... account liberalization: an empirical...
TRANSCRIPT
The Rise of the “Redback” and China’s Capital Account Liberalization:
An Empirical Analysis of the Determinants of Invoicing Currencies
Hiro Ito Portland State University Menzie D. Chinn Univ. of Wisconsin, Madison and NBER G2 at GW 2013: U.S.-China Economic Relations and China’s Economic Development November 8, 2013
0
4
8
12
16
20
24
1998 2000 2002 2004 2006 2008 2010 2012 2014
CNY
CHF
JPYShare of
forex trading
(out of 200%)
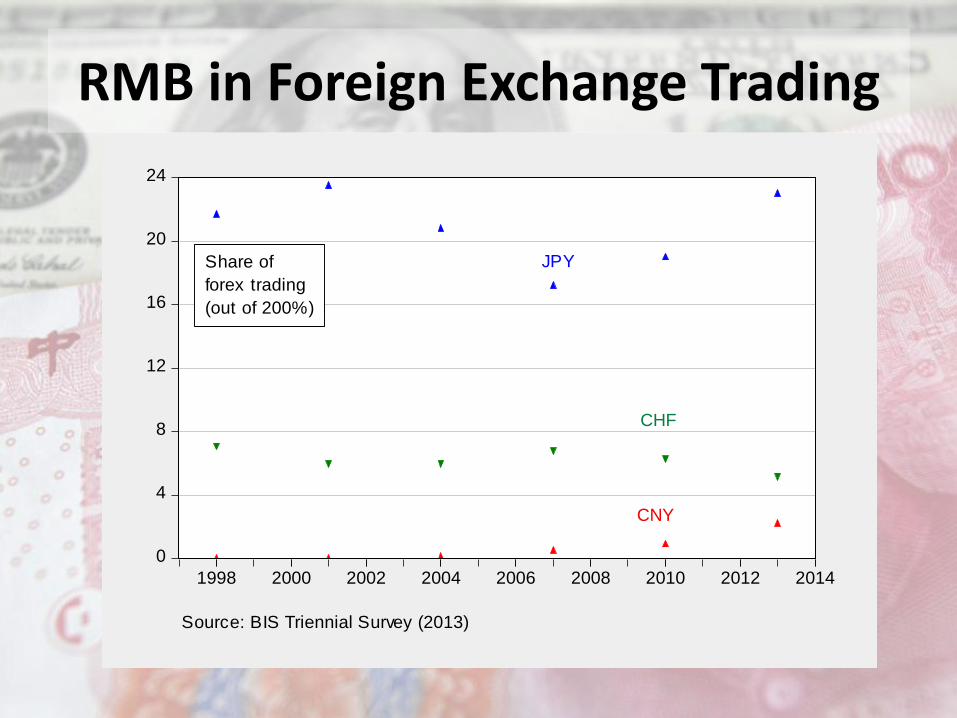
Source: BIS Triennial Survey (2013)
RMB in Foreign Exchange Trading
Roles of an International Currency
Table 1:
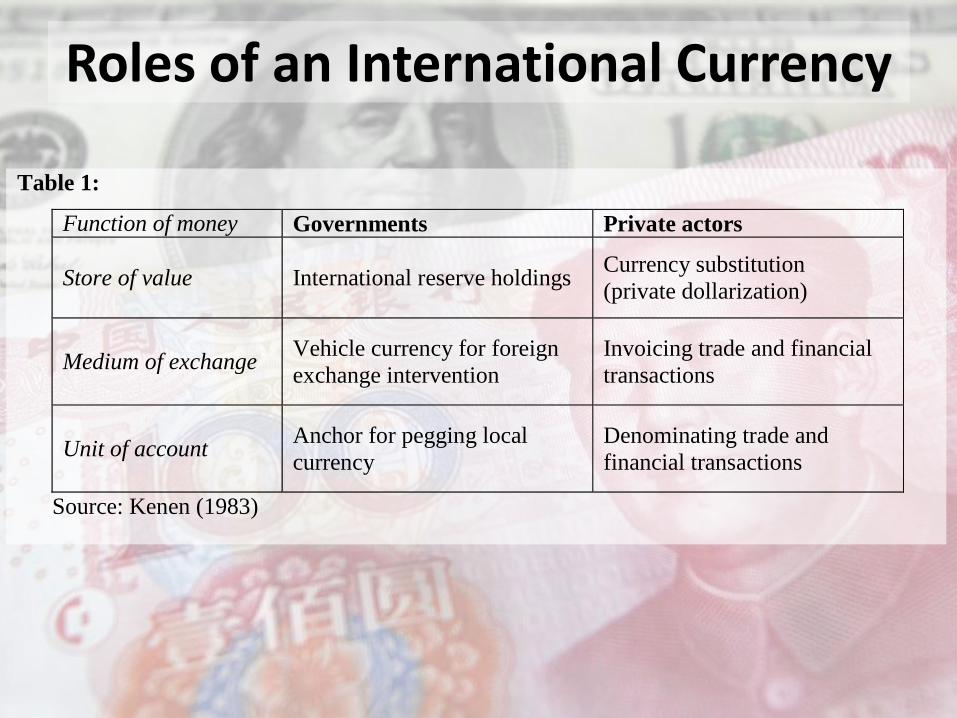
Function of money Governments Private actors
Store of value International reserve holdings Currency substitution
(private dollarization)
Medium of exchange Vehicle currency for foreign
exchange intervention
Invoicing trade and financial
transactions
Unit of account Anchor for pegging local
currency
Denominating trade and
financial transactions
Source: Kenen (1983)

The Role of RMB as an International Currency
14% of China’s trade is settled in RMB (as of 2012Q4)
$1.9 billion of “dim-sum” bonds are in circulation (as of 2013)
China accounts for 27% of the world’s money supply (2012) cf. 8% of the world’s GDP
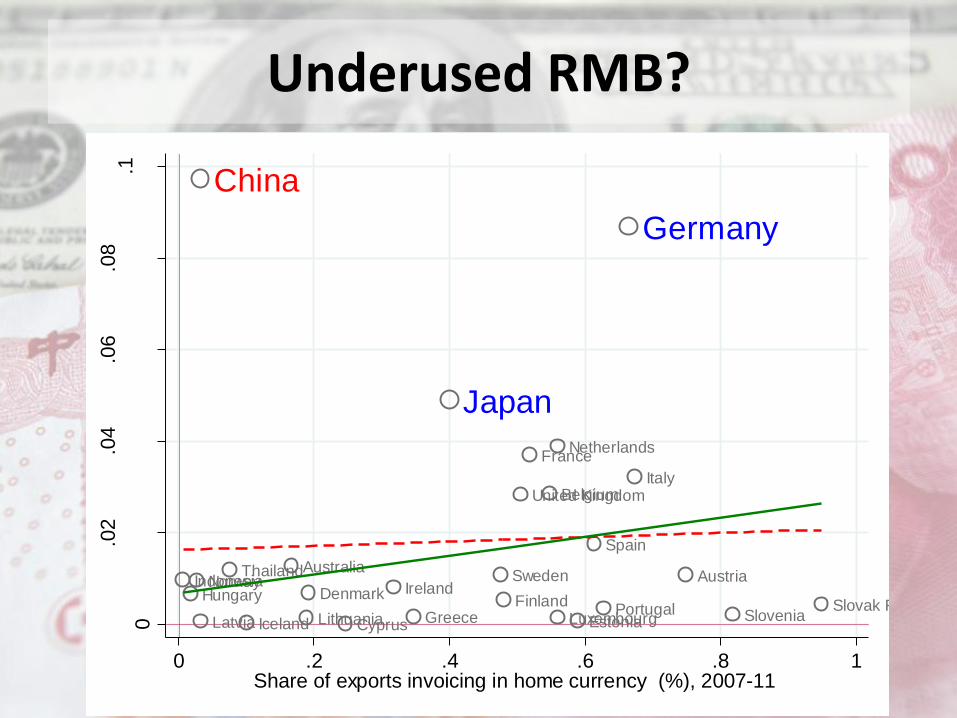
Underused RMB?
United Kingdom
Austria
Belgium
Denmark
France
Italy
Luxembourg
Netherlands
Norway Sweden
FinlandGreeceIceland
Ireland
Portugal
Spain
Australia
Cyprus
IndonesiaThailand
Slovak RepublicEstoniaLatvia
Hungary
Lithuania Slovenia
China
Germany
Japan
0
.02
.04
.06
.08
.1
Export
s s
hare
in t
he w
orld
(%),
20
07-1
1
0 .2 .4 .6 .8 1Share of exports invoicing in home currency (%), 2007-11
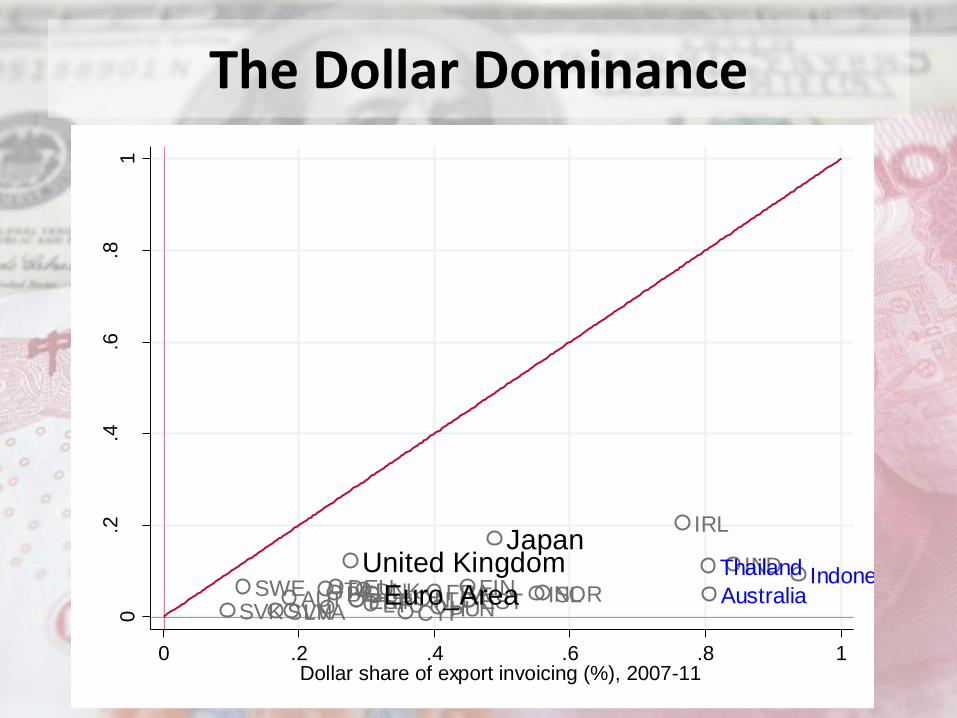
The Dollar Dominance
AUTBELDNK FRADEUITA NLD NORSWE FIN ISL
IRL
PRTESPCYP
IND
SVK ESTLVA HUNLTUSVN
AustraliaIndonesiaThailandUnited Kingdom
Euro_Area
Japan
0.2
.4.6
.81
Export
s to t
he U
nited
Sta
tes(%
), 2
007-1
1
0 .2 .4 .6 .8 1Dollar share of export invoicing (%), 2007-11
Is the arrival of the multipolar international currency system a long way off?
Whether and how fast the RMB becomes an international currency depends on:
Exchange rate reform – The currency needs to be able to convey market signals
Internal and external financial reforms – The transaction cost of acquiring or redeeming RMB-denominated assets must be low
Chinese authorities have been extremely cautious on these issues
In this paper,
We analyze the link between financial liberalization and the potential path for RMB’s internationalization
Particularly, we investigate how China’s liberalization efforts would affect the use of RMB invoicing
RMB’s becoming a major invoicing currency is not a sufficient condition for the RMB internationalization
But we focus on this issue because:
o Data are limited
o RMB’s becoming an invoicing currency is an important first step
Three Questions
1. What factors, including capital account liberalization, affect the use of currencies in terms of invoicing in international trade?
2. How does the RMB’s recent experience differ from that of other currencies in terms of their use for invoicing exports?
3. How would foreseeable capital account liberalization China may implement affect the level of use of the RMB in international trade?
Empirical Analysis
Investigate the determinants of the use of three currencies, the U.S. dollar, the Euro, and the home country’s currency for export invoicing by using the dataset that encompasses 50 countries
Show the implied share of RMB based on the model estimation
Predict the (out-of-period) path of RMB shares for different scenarios of CA liberalization
Data on the Shares of Currencies in Trade Invoicing
The empirical literature on trade invoicing is thin, esp. in terms of the cross-country analysis, due to data limitations
Exceptions: Goldberg and Tille (2008) and Kamps (2006)
We augment the Kamps dataset by resorting to past and recent papers and gov’t reports on trade invoicing We expand the data coverage from 43 countries for
1990s through 2004 to 50 countries for 1970s through 2012
Our dataset is probably the most comprehensive one
Some Observations of the Data
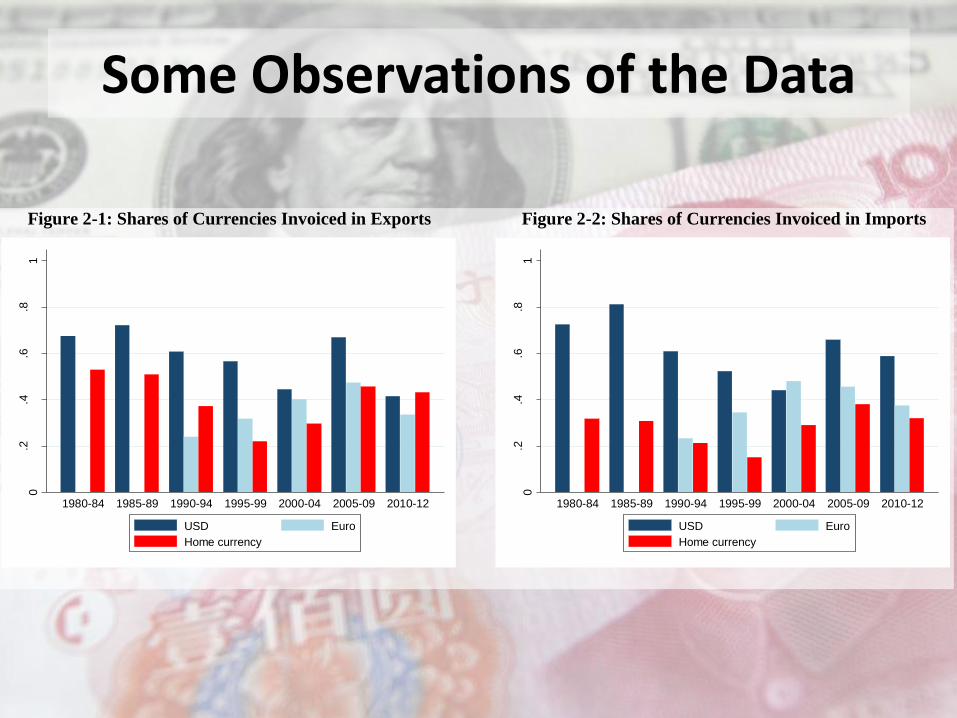
Figure 2-1: Shares of Currencies Invoiced in Exports
Figure 2-2: Shares of Currencies Invoiced in Imports
0.2
.4.6
.81
Share
s o
f curr
encie
s in e
xport
invoic
ing
1980-84 1985-89 1990-94 1995-99 2000-04 2005-09 2010-12
USD Euro
Home currency
0.2
.4.6
.81
Share
s o
f curr
encie
s in im
port
invoic
ing
1980-84 1985-89 1990-94 1995-99 2000-04 2005-09 2010-12
USD Euro
Home currency
Some Observations of the Data
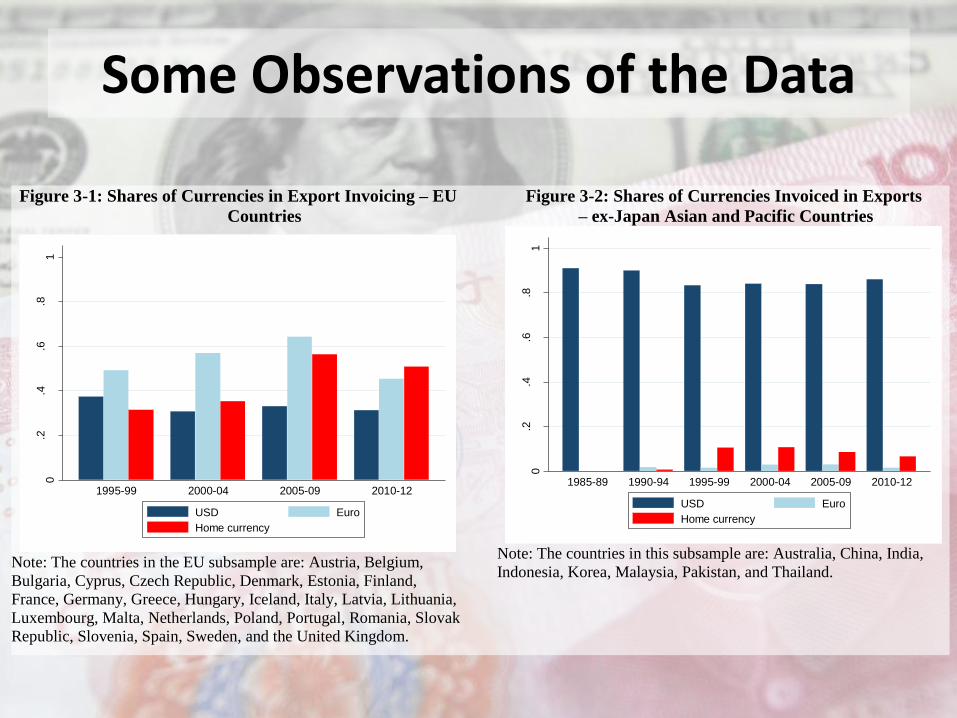
Figure 3-1: Shares of Currencies in Export Invoicing – EU
Countries
Note: The countries in the EU subsample are: Austria, Belgium,
Bulgaria, Cyprus, Czech Republic, Denmark, Estonia, Finland,
France, Germany, Greece, Hungary, Iceland, Italy, Latvia, Lithuania,
Luxembourg, Malta, Netherlands, Poland, Portugal, Romania, Slovak
Republic, Slovenia, Spain, Sweden, and the United Kingdom.
Figure 3-2: Shares of Currencies Invoiced in Exports
– ex-Japan Asian and Pacific Countries
Note: The countries in this subsample are: Australia, China, India,
Indonesia, Korea, Malaysia, Pakistan, and Thailand.
0.2
.4.6
.81
Share
s o
f curr
encie
s in e
xport
invoic
ing
1995-99 2000-04 2005-09 2010-12
USD Euro
Home currency0
.2.4
.6.8
1
Share
s o
f curr
encie
s in e
xport
invoic
ing
1985-89 1990-94 1995-99 2000-04 2005-09 2010-12
USD Euro
Home currency
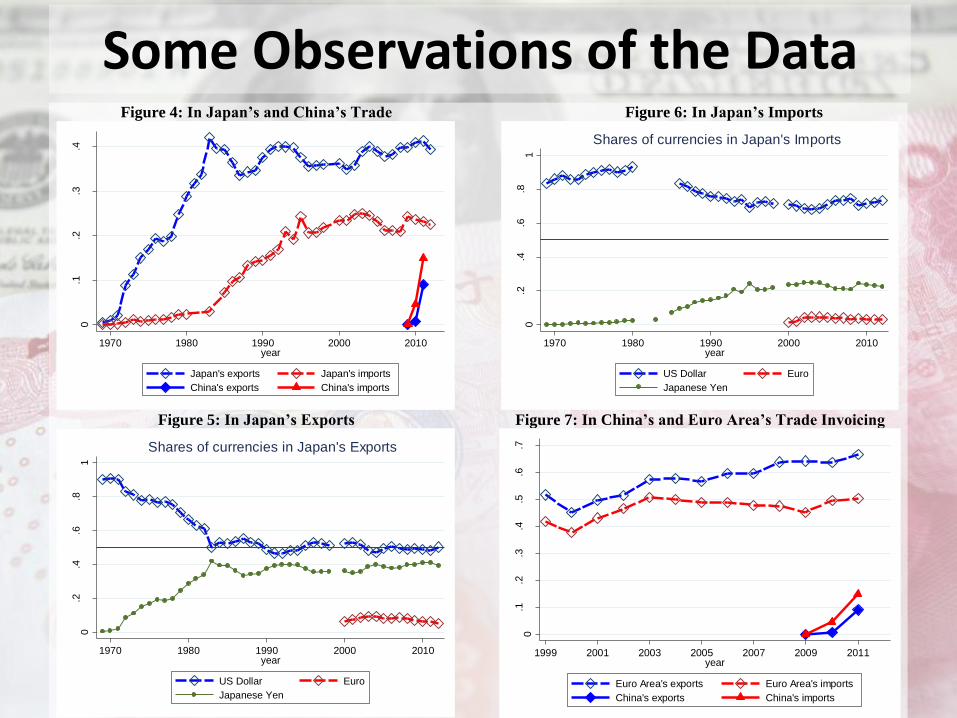
Some Observations of the Data Figure 4: In Japan’s and China’s Trade
Figure 5: In Japan’s Exports
Figure 6: In Japan’s Imports
Figure 7: In China’s and Euro Area’s Trade Invoicing
0.1
.2.3
.4
Share
s o
f hom
e c
urr
en
cy in
voic
ing
1970 1980 1990 2000 2010year
Japan's exports Japan's imports
China's exports China's imports
0.2
.4.6
.81
Share
s o
f curr
encie
s
1970 1980 1990 2000 2010year
US Dollar Euro
Japanese Yen
Shares of currencies in Japan's Exports
0.2
.4.6
.81
Share
s o
f curr
encie
s
1970 1980 1990 2000 2010year
US Dollar Euro
Japanese Yen
Shares of currencies in Japan's Imports
0.1
.2.3
.4.5
.6.7
Share
s o
f hom
e c
urr
en
cy in
voic
ing
1999 2001 2003 2005 2007 2009 2011year
Euro Area's exports Euro Area's imports
China's exports China's imports
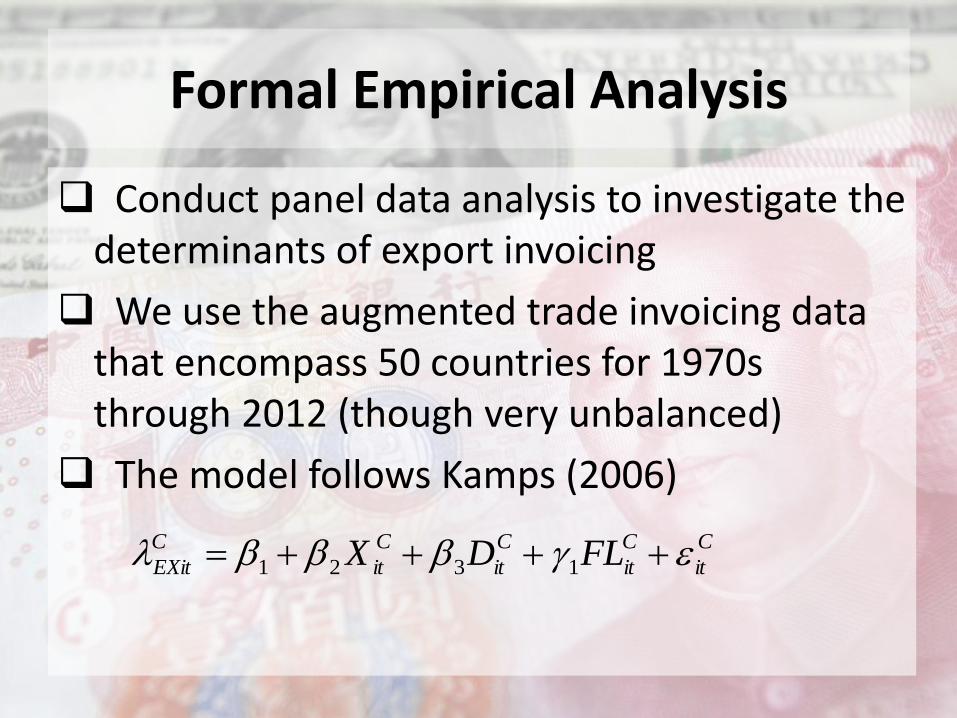
Formal Empirical Analysis
Conduct panel data analysis to investigate the determinants of export invoicing
We use the augmented trade invoicing data that encompass 50 countries for 1970s through 2012 (though very unbalanced)
The model follows Kamps (2006)
C
it
C
it
C
it
C
it
C
EXit FLDX 1321
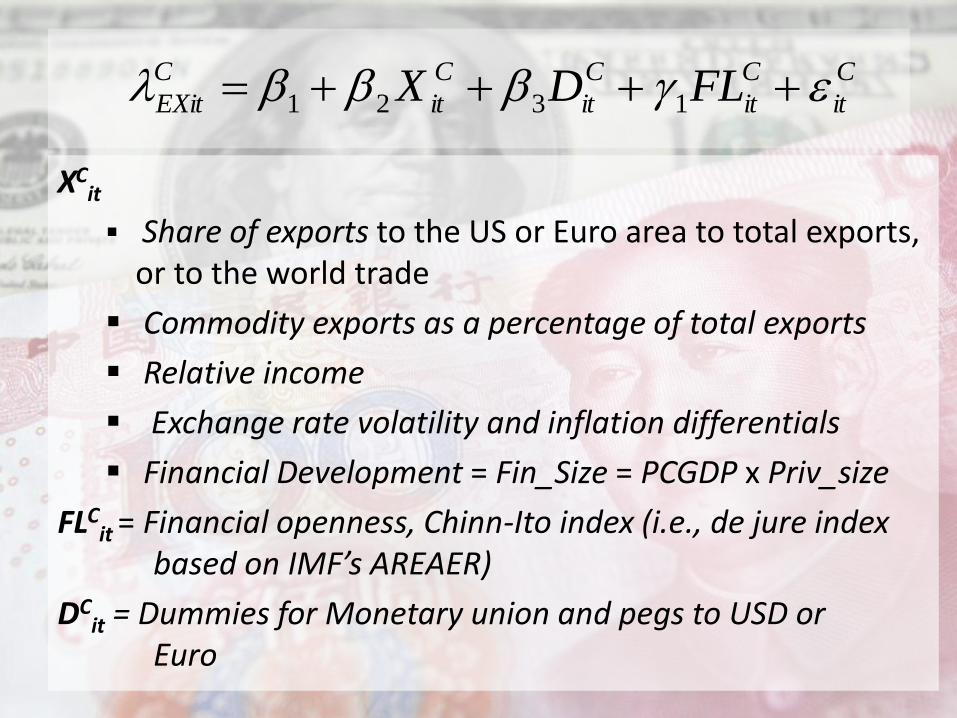
XCit
Share of exports to the US or Euro area to total exports, or to the world trade
Commodity exports as a percentage of total exports
Relative income
Exchange rate volatility and inflation differentials
Financial Development = Fin_Size = PCGDP x Priv_size
FLCit = Financial openness, Chinn-Ito index (i.e., de jure index
based on IMF’s AREAER)
DCit = Dummies for Monetary union and pegs to USD or
Euro
C
it
C
it
C
it
C
it
C
EXit FLDX 1321
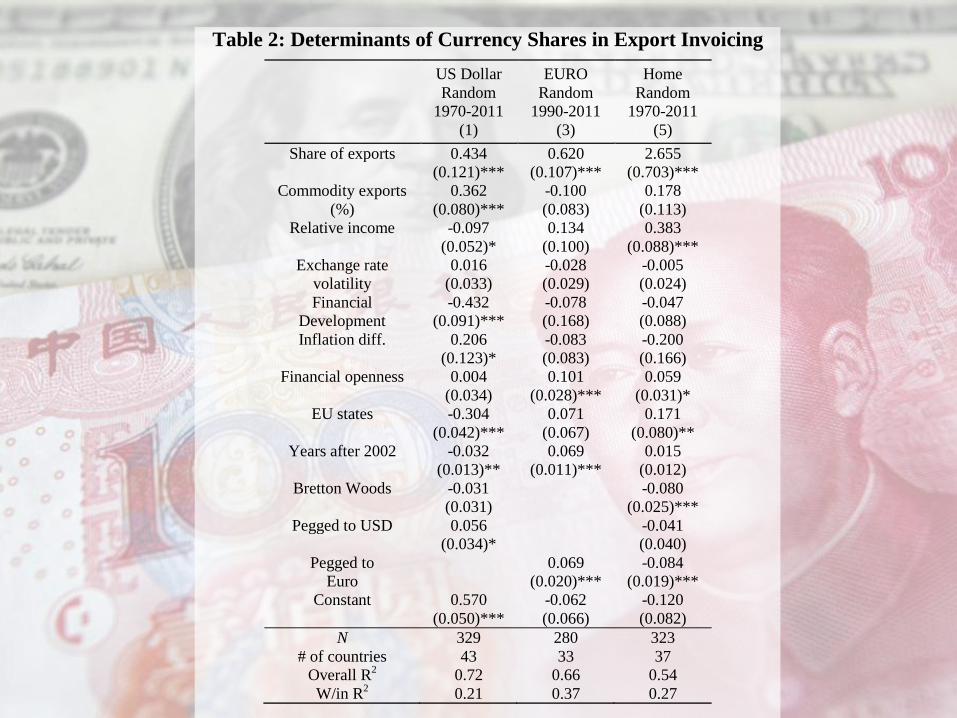
Table 2: Determinants of Currency Shares in Export Invoicing
US Dollar EURO Home
Random Random Random
1970-2011 1990-2011 1970-2011
(1) (3) (5)
Share of exports 0.434 0.620 2.655
(0.121)*** (0.107)*** (0.703)***
Commodity exports 0.362 -0.100 0.178
(%) (0.080)*** (0.083) (0.113)
Relative income -0.097 0.134 0.383
(0.052)* (0.100) (0.088)***
Exchange rate 0.016 -0.028 -0.005
volatility (0.033) (0.029) (0.024)
Financial -0.432 -0.078 -0.047
Development (0.091)*** (0.168) (0.088)
Inflation diff. 0.206 -0.083 -0.200
(0.123)* (0.083) (0.166)
Financial openness 0.004 0.101 0.059
(0.034) (0.028)*** (0.031)*
EU states -0.304 0.071 0.171
(0.042)*** (0.067) (0.080)**
Years after 2002 -0.032 0.069 0.015
(0.013)** (0.011)*** (0.012)
Bretton Woods -0.031 -0.080
(0.031) (0.025)***
Pegged to USD 0.056 -0.041
(0.034)* (0.040)
Pegged to 0.069 -0.084
Euro (0.020)*** (0.019)***
Constant 0.570 -0.062 -0.120
(0.050)*** (0.066) (0.082)
N 329 280 323
# of countries 43 33 37
Overall R2 0.72 0.66 0.54
W/in R2 0.21 0.37 0.27
Extended Analyses
What about the impact of legal development?
Use LEGAL = principal component of LAO, BQ, and CORRUPT
Insignificantly negative for the U.S. dollar share estimation, significantly negative for the Euro share estimation, and insignificantly positive for the home currency share estimation
Extended Analyses
What about financial crisis? We include the dummy for currency, banking, or debt crisis individually
Countries that experience a banking crisis tend to increase the share of the U.S. dollar for their export invoicing by 2.8 percentage points while they also tend to decrease the share of the Euro by 2.3 percentage points
The effect of banking crisis on the home currency share or that of other types of crises turn out to be insignificant
When we include a dummy for the GFC
Countries on average increase the share of dollar invoicing by 4.1 percentage points, although the crisis does not affect other currency shares

Extended Analyses
Do appreciation expectations of the home currency lead to more use of the currency for export invoicing? We include in the time trend of the exchange rate
Significantly positive for the U.S. dollar share estimation = Appreciation trend of the home currency leads to less use of the USD for export invoicing
Extended Analyses
Does net investment position matter? We include the NIP variable based on the Lane and Milesi-Ferretti dataset
Significantly positive for the home currency share estimation = Countries with better net investment positions tend to be able to invoice their exports in their own currency
Endogeneity issues?: Countries with int’l currencies often turn into debtor countries
Methodological Robustness Checks
Tobit estimation
Seemingly Unrelated Regression (SUR) Estimation
The estimates are mostly robust, including the financial openness variable
While financial development continues to be a negative contributor to USD invoicing, it also becomes a significantly negative contributor to home currency invoicing
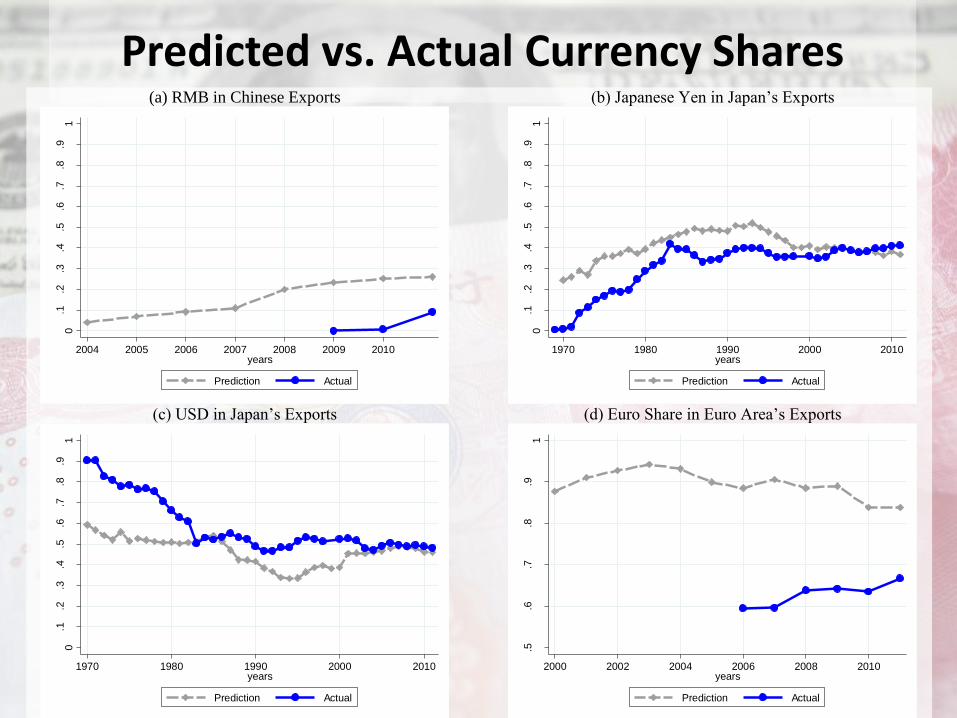
Predicted vs. Actual Currency Shares (a) RMB in Chinese Exports
(c) USD in Japan’s Exports
(b) Japanese Yen in Japan’s Exports
(d) Euro Share in Euro Area’s Exports
0.1
.2.3
.4.5
.6.7
.8.9
1
Share
of Y
uan e
xp
ort
in
vo
icin
g
2004 2005 2006 2007 2008 2009 2010years
Prediction Actual
0.1
.2.3
.4.5
.6.7
.8.9
1
Share
of U
SD
export
invoic
ing
1970 1980 1990 2000 2010years
Prediction Actual
0.1
.2.3
.4.5
.6.7
.8.9
1
Share
of Y
en e
xpo
rt invoic
ing1970 1980 1990 2000 2010
years
Prediction Actual
.5.6
.7.8
.91
Share
of E
uro
in e
xpo
rt invo
icin
g
2000 2002 2004 2006 2008 2010years
Prediction Actual
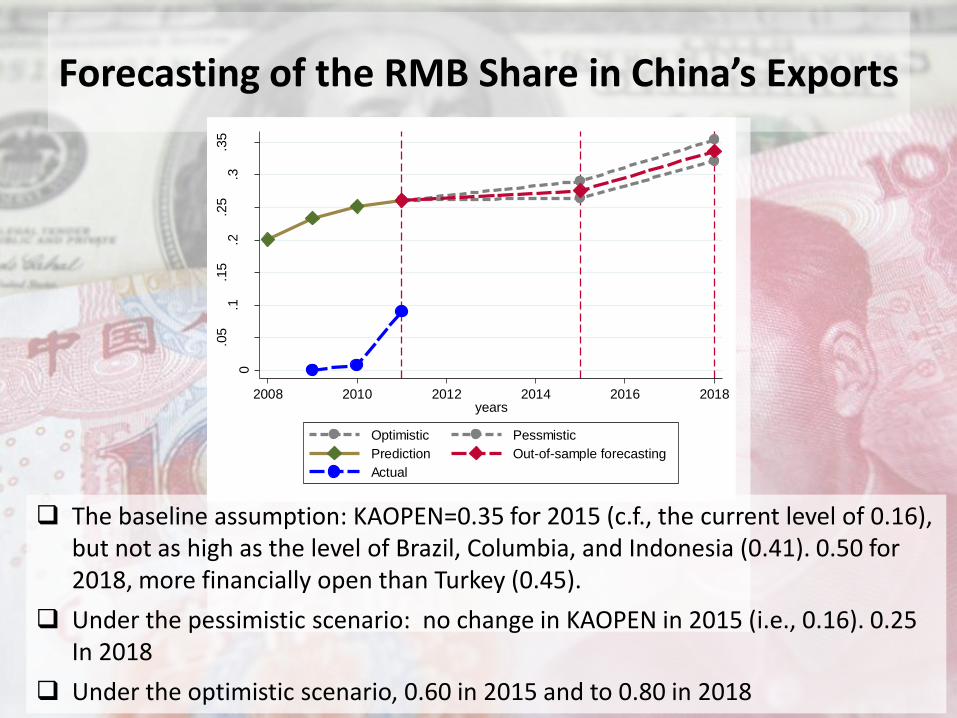
Forecasting of the RMB Share in China’s Exports
0
.05
.1.1
5.2
.25
.3.3
5
Share
of R
MB
in e
xport
invoic
ing
2008 2010 2012 2014 2016 2018years
Optimistic Pessmistic
Prediction Out-of-sample forecasting
Actual
The baseline assumption: KAOPEN=0.35 for 2015 (c.f., the current level of 0.16), but not as high as the level of Brazil, Columbia, and Indonesia (0.41). 0.50 for 2018, more financially open than Turkey (0.45).
Under the pessimistic scenario: no change in KAOPEN in 2015 (i.e., 0.16). 0.25 In 2018
Under the optimistic scenario, 0.60 in 2015 and to 0.80 in 2018
Concluding Remarks
The U.S. dollar still plays an important role as the vehicle currency
Asian countries in particular have relied heavily on the U.S. dollar
The share of the RMB use for trade transactions has been rapidly rising
Interestingly, the Chinese RMB has been more used for import invoicing rather than for export invoicing
Countries with more developed financial markets tend to invoice less in the U.S. dollar
Countries with a more open capital account tend to invoice in either the Euro or their home currency
Concluding Remarks
A currency with expected appreciation tends to be used for export invoicing
The use of the RMB in export invoicing should have been higher, around low to mid-20s as a percentage of total exports
The underperformance of the RMB export invoicing can be attributed to the inertia of the choice of currency for trade invoicing
The share of RMB invoicing for China’s exports may rise up to 27.5% in 2015 and 33.5% in 2018