the relationship between total compensation...
TRANSCRIPT
Psychology and Behavioral Sciences 2016; 5(1): 20-36
Published online February 19, 2016 (http://www.sciencepublishinggroup.com/j/pbs)
doi: 10.11648/j.pbs.20160501.14
ISSN: 2328-7837 (Print); ISSN: 2328-7845 (Online)
Research/Technical Note
The Relationship Between Total Compensation and Employee Performance in the Insurance Industry, Case of Mayfair Insurance Company Limited
Christopher Muthusi Nzyoka1, Bulah Hannah Orwa
2
1MSC Graduate, School of Business, Kenyatta University, Nairobi, Kenya 2Department of Business Administration, School of Business, Kenyatta University, Nairobi, Kenya
Email address: [email protected] (C. M. Nzyoka)
To cite this article: Christopher Muthusi Nzyoka, Bulah Hannah Orwa. The Relationship Between Total Compensation and Employee Performance in the
Insurance Industry, Case of Mayfair Insurance Company Limited. Psychology and Behavioral Sciences. Vol. 5, No. 1, 2016, pp. 20-36.
doi: 10.11648/j.pbs.20160501.14
Abstract: Today’s organizations are operating in a dynamic and highly competitive environment which requires constant
adjustment of competitive strategies to remain relevant. Total compensation is one of the ways an organization can built a
competitive strategy for attracting, retaining suitable employees as well as maintaining peak performance. Mayfair Insurance
Company Limited is an organization that offers both life and general insurance to both the individual and corporate clients. The
management has set up compensation system in the organization in pursuit of increased performance and the general growth to
ensure this is sustained. However, the relationship between the total compensation and employee performance at Mayfair
Insurance Company Limited has not yet been established. This study was done to establish the relationship between total
compensation and employee performance at Mayfair Insurance Company Limited. Specifically the study will try to establish the
relationship of various components of compensation including basis pay, incentives, benefits, non-financial rewards including
career development, flexi work schedules and recognition and appreciation. The study will adopt descriptive research design. A
sample size of 100 employees of the company was selected from 334 total employees using stratified random method. Data was
collected using questionnaires and descriptive statistics (frequency tables and percentages) has been used to present data. Data
was analysed using Statistical Package for Social Sciences (SPSS) computer package. Conclusions have been based on findings
that there is a positive significant relationship between Total compensation and employee performance at Mayfair Insurance
Company Limited and recommendations with benefits, recognition and appreciation being key factors in compensation. This
study found the need for comparative studies in other industries like manufacturing and use of varied factors to reach a
conclusive finding for generalised findings.
Keywords: Compensation, Employee Performance, Descriptive, Insurance Industry, Relationship
1. Background of the Study
Today’s reality in the global world is that people influence
important aspects of organizational performance in a
multitude of ways. People conceive and implement the
organizational strategy, while the mix of people and systems
mostly determine an organization’s capabilities.
Competencies are required to execute the strategy, and these
competencies are primarily a function of the skills and
knowledge of an organization’s human capital. Therefore, if
an organization is to treat its employees as its most important
asset, it has to be knowledgeable about what it is that
motivates people to reach their full potential (Lawler, 2003). It
is not easy though to know all the things that motivate people
in life or at work but an effort has to be made.
Compensation is one of the strategies used in Human
Resource Management for attracting and retaining useful
employees as well as facilitating them to improve their
performance through motivation. Employees seek
employment to earn a salary to satisfy their needs. On the
other hand, employers pay for services rendered and also to
sprout performance. It is only fair and just to compensate
employees for their efforts.
Employees seek employment to earn a salary to satisfy their
Psychology and Behavioral Sciences 2016; 5(1): 20-36 21
needs. On the other hand, employers pay for services rendered
and also to sprout performance. Different Human resource
theories and Models hold different views in regard to employee
pay composition and level. While the Michigan’s model of
Human Resource Management hold employees pay as a cost
just like any resource, the Harvard’s see it as a necessary
motivator to performance. Managers believe or hope that
compensation is a strong determinant of performance, attitudes,
motivation as well as organizational esteem.
But at what level and mix is compensation most effective in
determining level of performance. Opsal and Dunnette (1966)
provide evidence that yes compensation in its various forms
affect employee – Organization relationship. Most of the study
in this filed has been conducted in relation to the various forms
of compensation and performance. When high performance
results in pay increase, high performance is reinforced and
more likely to be repeated in future in line with expectancy
theories. Gerhert and Milkovich (1992) argue that there is
strong evidence that individual incentive, merit pay, bonuses
and gainsharing can contribute to higher performance under
the right circumstances. All these are reinforcers of past
performance. With the current trend of CEO’s pay sky
rocketing and presenting a big gap between them and other
workers, there is no evidence that this trend has ensured their
continued superior performance. In stressing economy of high
wages theory, Michael Armstrong (2006) states that firms will
pay more than market rate because they believe that high level
of pay level contribute to increase in productivity by
motivating superior performance and persuading workers that
they are being treated fairly.
Gerhert and Milkovich (1992) put it that despite
compensation being possible contributor of high performance,
we don’t know how pay characteristics affect employee
attitudes and behaviours and consequently performance. One
of such unknown characteristic is the amount of total direct
payment or compensation level that each employee is given in
exchange of labour provided. A number of factors affect
compensation level such as nature of work, experience
required, supervision level, authority attributes, tenure with
the organization, compensation policies e. tc. However still it
remains an empirical question as to effect of level of pay on
performance. Despite the widely accepted assumption that
high level of compensation results in superior performance
remains untested, there is no empirical evidence to provide
the link.
1.1. Theoretical Background
This study is based on Adam Stacy (1963) Equity Theory of
Motivation and Victor Vroom (1964) Expectancy Theory. The
Equity Theory states that employees expect fairness when
being rewarded for the work done. The theory was developed
from the Hertzberg’s job satisfaction theory and linked to the
reward system by Adam Stacy. An important factor in
employer’s motivation is whether individuals perceive the
reward structure as being fair. The Equity theory essentially
refers to an employee’s subjective judgment about the fairness
of the reward she/he got in comparison with the inputs (efforts,
time, education, and experience) when compared with others
in the organization. The Equity theory of motivation concerns
on the people’s perception and feelings on how they are
treated as compared with others (Armstrong, 2001). The
argument is that people work well in accordance to what they
regard as fair. Employees consider whether management has
treated them fairly, when they look at what they receive for the
effort they have made. Maicibi (2003) agrees with this that
employees expect rewards or outcomes to be broadly
proportional to their effort.
On the other hand, the Expectancy theory helped the study
to understand how individuals are drawn to make decisions as
regards various behavioural alternatives and perceptual
differences among people. It also suggests that motivation is
based on how much one wants something and how likely
he/she could get it (Bodden, 2008). This is because the
motivational force of every individual is influenced by his or
her expectancies, valances all of which depend on a personal
way of perception. The formal framework of expectancy
theory was developed by Victor Vroom (1964). This
framework states basically that motivation plus effort leads to
performance, which then leads to outcomes. According to this
theory, three conditions must be met for individuals to exhibit
motivated behaviour and these include: effort to performance
expectancy must be greater than zero, performance to
outcome expectancy must also be greater than zero, and that
the sum of the valances for all relevant outcomes must be
greater than zero.
The Expectancy theory explains that in any given situation,
the greater the number and variety of rewards that are
available to the employees (teachers), the greater is the
probability that extra effort will be exerted in attaining the set
goals or targets in the hope of getting the desired rewards
(Bodden, 2008). Gerald Cole (2004) agrees with this and
explains that Vroom focused especially on the factors that are
involved in stimulating an individual to put an effort in doing
something since this is the basis of motivation. The outcomes
are the consequence of behaviour which now results in
superior performance.
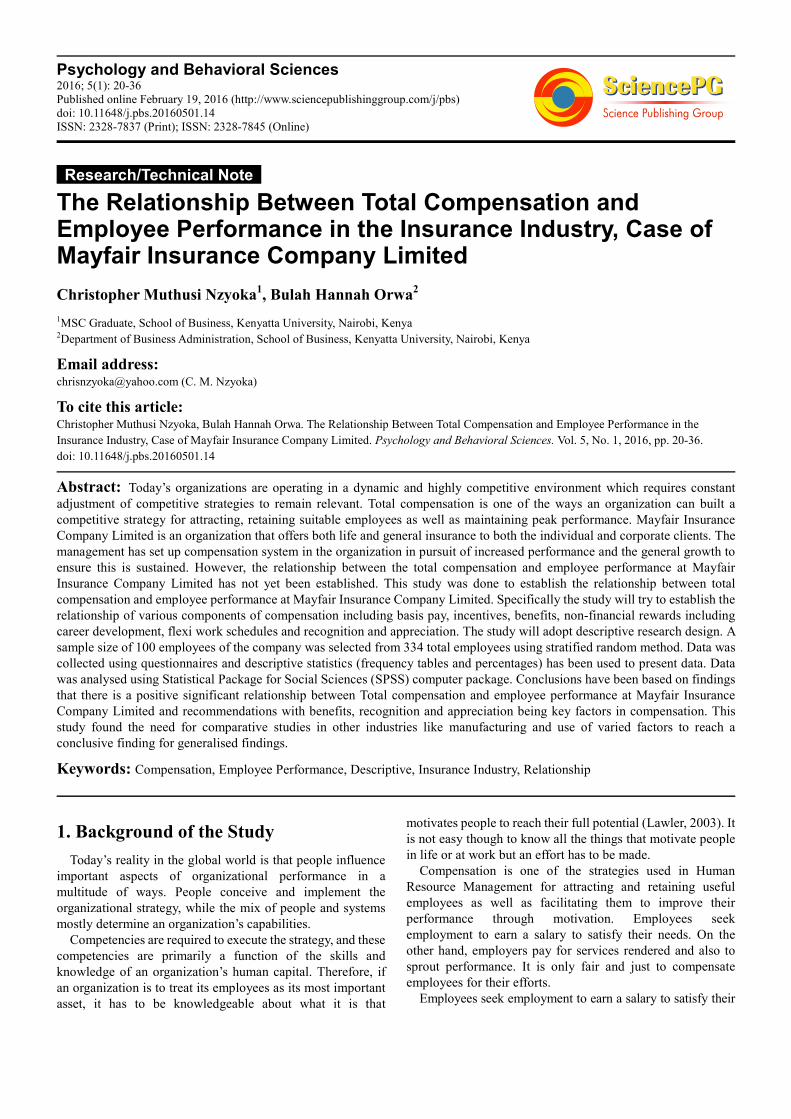
Adapted from Gerald Cole (2004).
Figure 1.1. Expectancy Theory Framework.
The above model developed by Vroom indicates the
components of effort that can lead to relevant performance and
the appropriate rewards. Vroom defines the anticipated
satisfaction an individual hopes to get from the outcome or
reward. According to Vroom, the three factors; Expectancy,
Instrumentality and Valence combine to create a driving force
which motivates an individual to put in effort and achieve a
level of performance to be rewarded in the end.
22 Christopher Muthusi Nzyoka and Bulah Hannah Orwa: The Relationship Between Total Compensation and
Employee Performance in the Insurance Industry, Case of Mayfair Insurance Company Limited
1.1.1. Conceptual Background
Total Compensation is used within organizations to spur
performance of employees through motivation. It has been
used to refer to rewards which Zigon (1998) defines as
something offered after an action to increase occurrence of the
same action which obviously points out to repeat of desired
performance. Another goal is to attract and retain best talents
within the organization. To achieve these goals, compensation
needs to be aligned to organizational strategies (Allen, Helms
2002). For example a company pursuing differentiation
strategy could use compensation to foster innovation among
the employees to provide unique products while a company
pursuing cost reduction could use compensation to foster
wastage reduction.
According to Zigon (1998) Managers have a wide variety of
rewards to offer to employees at various cost levels which
employees may find appealing. This requires understanding of
individual employee preferences since employees are
different. As well as monetary rewards, non-monetary rewards
can be a strategy of comprehensive performance improvement.
Employees appreciate being recognised by people they work
directly under (Nelson 2004). Allen and Helm (2002)
confirms the importance of regular expression of appreciation
by managers and leaders to encourage behaviour of employees
to attain set goals. Reward system is the degree to which
rewards are allocated according to employee’s performance in
contrast seniority, favouritism, or any other performance
criterion. According to Jacob (2005) organization reward
system should be perceived by employees as reinforcing the
notion that most employees are good performers and there
should be a linkage between reward and performance.
The definition Total compensation encompasses the overall
value proposition that the employer offers to the employee
according to Armstrong (2001), it is a total package that
includes base pay, incentives, benefits, career development.
We can say it is the total cost an employer pays for the
employee and on account of the employee. The system also
incorporates non-financial rewards such as recognition, praise
for achievement, responsibility, professional growth and
performance management process (Armstrong 2001). In other
words, employees perform better when they feel strongly
connected to and valued by the organization.
Performance refers to the results of an activity according to
Boddy (2008). Upon individual results, there are various
models of total compensation within the Insurance industry.
Among the commonest model is base pay with commission
based on performance. Targets are set and variable pay tied on
each target of achievement. This model is common for sales
people within the industry. The other model which comprises
of management staff is knowledge and skill based pay where
individual employees are compensated according to how their
skills and knowledge matches with the Job specification.
These skills are believed to increase performance Oden (2002).
Knowledge and skill based pay differs from merit pay in that it
provides clear guidelines on what is being evaluated. In most
job advertisement, Job specification is provided with a
statement that package will be competitive depending on skills
and knowledge. Another common compensation model
common in insurance industry is group periodic bonus which
is based on overall organizational performance. This may be
pegged on salary level or a flat rate for the various groups
eligible to the bonus.
1.1.2. Contextual Background
Mayfair Insurance Company Limited is a Limited Liability
Company providing General insurance to businesses and
individual in Kenya. It is one of the fastest growing companies
with a gross premium of more than 1.53 billion (Dec 2013)
and an ambitious vision of becoming the largest insurer in
Kenya. It was incorporated in 1995 and already has its
presence in Lusaka, Zambia. The mission incorporates
maximising shareholder and other stakeholders’ values,
employees are part of stakeholders and this makes it a good
choice for the study.
Just like any other insurance company, Mayfair
compensates employees using various forms of rewards with
basic salary and commissions being the preferred. It is very
important for the organization to develop and implement
compensation design that motivates its employees to achieve
their targets and for the organization to achieve its mission.
The management of Mayfair Insurance Company Limited
needs to understand what motivates their employees in terms
of Compensation components since motivation is understood
to be individual. They might be implementing their
compensation strategies and policies without understanding of
their employees’ needs. This problem can be overcome by
conducting this study to understand the relationship between
Total Compensation and Employee Performance. The study
would be appropriate to Mayfair Insurance Company Limited
because it will address challenges faced while implementing
compensation strategies taking employees perceptive hence
satisfaction and improvement of performance that will in turn
increase productivity and help the organization achieve its
ambitious mission.
1.2. Statement of the Problem
Taylor (1856 – 1915) and Gilbreth (1868 – 1924) believed
that employees don’t like to work, therefore they have to be
motivated in order to work. Organizations have been
implementing Compensation policies without knowledge of the
relationship of such compensation mix with the employee
performance. This study examines relationship between Total
compensation and Employee performance. Several studies have
been done in the field of rewards and employee performance
but empirical gaps have been identified from limitation of such
studies and the recommendations for further studies.
Njanja, Maina, Kibet, Njagi (2013) in their study Effects of
Reward on employee performance using correlation research
design, examined 84 employees of Kenya power and
Lightning Company Limited, Nakuru, Kenya, observing that
cash bonuses had no significant relationship with performance.
Those receiving cash bonuses and those not receiving
performed the same. It was perceived that cash bonuses have a
significant influence in motivating employees to performance;
Psychology and Behavioral Sciences 2016; 5(1): 20-36 23
however the relationship was significant only when it comes
to attendance.
The researchers recommended that organizations should
strive to understand their employees in developing pay
systems as there is no perfect system. Motivation is personal
and what motivates one employee may not motivate another.
They suggested further studies to examine relationship of
performance with other rewards.
Duberg, Mollen (2010) undertook study on reward systems
within the health and geriatric care sector. They examined how
reward systems in health and geriatric care are developed and
whether the current reward systems affect the care quality. The
methodology took a qualitative approach and interviewed six
leaders of the sector. Two were from geriatric care and four in
health care. The findings were that salary is an important
aspect in the rewards system; however other incentives like
bonus were seen to generate an enjoyable work place and
happy workers than motivating employees to be more efficient.
The researchers recommended that further studies should be
done to compare reward system and investigate its impact on
employee performance other than organizational performance.
Gohari, Ahmadloo, Boroujeni, Hosseinipour (2013) in their
study Relationship between Reward and employee
performance in Malaysian Tourism Companies using
backward multiple regression technique examined 77
employees of two companies. The research method was
quantitative using questionnaire as collection instruments.
Demographic factors were introduced into the study
concluding that although all reward types have a direct
positive relationship with employee performance, based on
correlation test intrinsic types lose their importance when they
are considered in a more comprehensive model including
other rewards. They recommended further studies on
compensation variables since they are numerous.
Gunu (2010) in the study influence of Compensation on
Performance of Sales Representatives of Pharmaceutical
Companies based in Ilorin Nigeria, employed Convenience
sampling design to select sample and questionnaire was used
as primary data collection tool. The study examined link
between reward and individual performance and the type of
rewards that elicit greater performance among sales people.
The research findings were that there was a significant
relationship between rewards and performance. The study
recommends that experience of sales people should be plank
to determine their compensation and salary should be
emphasized rather than combination of salary and commission
to enhance their performance. Further studies could be done
on other sectors or examine other employees besides sales
representatives.
The above empirical studies have addressed the element
rewards, concentrating more on the effects and process
without addressing the total compensation and the relationship
with employee performance. The current study will bridge this
gap and answer the question, “what is the relationship between
organizational Total compensation and employee performance
at Mayfair insurance Company Limited?”
1.3. Research Objectives
1.3.1. General Objectives
The General objective of the study is to determine the
relationship between total compensation and employee
performance at Mayfair Insurance Company Limited.
1.3.2. Specific Objectives
To identify the various types of compensation used at
Mayfair Insurance Company Limited and how each relates to
Employee performance.
1.4. Research Questions
The study will be guided by following questions:-
What are the components total compensation used at
Mayfair Insurance Company Limited?
What is the relationship between these components of
compensation and employee performance at Mayfair
Insurance Company Limited?
1.5. Significance of the Study
The study will contribute positively towards academic
scholarly as findings of the study will be available for future
references. Little empirical study has been done on the
Relationship between Total Compensation and Employee
Performance and this study shall add to such body of
knowledge.
Conceptually, this study will empirically verify relationship
between Total compensation and employee performance at
Mayfair Insurance Company Limited. This would form a basis
for future studies on other factors that affect performance of
employees at Mayfair Insurance Company Limited.
This study will be invaluable to Mayfair Insurance Company
Limited management in that it will provide an insight into
various components and mix of Compensation, and their
relationship with employee performance which is necessary for
policy formulation and decision making.
Furthermore, the findings and recommendations of this
research will not only be implemented in the Insurance
industry, but could also be applied in other industries. The
Government ministries and agencies will make use of this
study, as it will provide complimentary knowledge useful in
formulation of policy and regulatory framework especially in
labour management practices in view of Relationship
between Total compensation and employee performance.
2. Literature Review
2.1. Compensation
Compensation is made up of several components, base and
variable pay, equity, incentives and benefits. These elements
can be grouped into financial compensation and non-financial
compensation. A well designed compensation framework needs
to be developed and grown within the unique environment of
the organization (Wilson, 2003). A well designed compensation
framework rewards measurable changes in behaviour that
24 Christopher Muthusi Nzyoka and Bulah Hannah Orwa: The Relationship Between Total Compensation and
Employee Performance in the Insurance Industry, Case of Mayfair Insurance Company Limited
contribute to clearly defined goals. The challenge in
determining such program lies in what mix of rewards will
contribute to behaviour necessary to spur performance.
Management must decide what mix of these compensation
elements makes the most sense for each type of Job.
Increasing payroll costs in the global market have led
managers to search for ways to increase productivity by
linking compensation to employees’ performance (Brown,
Armstrong, 2000). A number of studies indicate that if pay is
pegged to performance, the employee produce a higher quality
and quantity of work (Lawler, 2000). Early evidence found in
Hammurabi code written in the 18th
Century B. C, have linked
use of minimum wage, fixed wage, and incentives rewards to
performance (Peach, Wren, 1992)
Rewards bridge the gap between organizational objectives
and individual expectations and aspirations. To be effective,
organizational total compensation systems should provide
four things: sufficient enough to fulfil basic needs, Equity with
external references, Equity with internal references, and
treatment of each member of the organization according to
their individual needs (Milkovich and Newman, 2005)
2.2. Total Compensation and Performance
Total Compensation encompasses more than the monetary
payment for work, it is the total of all the rewards provided to
an employee in return for their services (Monday, 2008). Total
compensation is the combination of four core elements: - pay
benefits, financial incentives and non-financial compensation.
Different names have been attributed “Total Pay” (Zingheim
and Schuster, 2008), “Compensation package” (Sturman,
2001), and “direct and indirect compensation” (Heneman and
Schwab, 1985). Compensation is the methods and practices of
maintaining balance between interests of operating the
company within the fiscal budget and attracting, developing,
retaining, and rewarding high quality staff through wages and
salaries which are competitive with the prevailing rates for
similar employment in the competitive market. It should be
noted level of compensation differs from increase in
compensation. In this study we are examining level of
compensation; total reward which Manus and Graham (2003),
defines as the all types of rewards indirect as well as direct,
and intrinsic as well as extrinsic. Total reward maximizes the
combined impact of a wide range of reward initiatives on
motivation, commitment and job engagement. O’Neal (1998)
has explains that total reward embraces everything that
employees value in the employment relationship and we could
assume this includes esteem. There is empirical evidence that
pay increase in line with expectancy theory increases
performance.
2.3. The Relationship Between Financial Rewards and
Employee Performance
Financial or extrinsic rewards are external to the job and
includes elements like basic pay, fringe benefits, promotions,
job security, private office space, merit pay, compensatory
time off (Mottaz, 1985; Mahaney, Lederer, 2006)
Extrinsic rewards are often paid for an organization to
demonstrate its seriousness in valuing performance or
employee contribution to organizational goal. Application of
extrinsic rewards is tightly related to performance and
motivates employees to be hungry for money and hence
destroy their intrinsic interests in the job (Balkin, Dolan,
1997). Giving rewards has become part and parcel of
organizational policies as it has shown to improve workers
performance. Extrinsic rewards drive workers morale and the
contribution of the rewards has existed in organizations
especially in accordance with performance evaluation
(Appelbaum, Schroeder, Cain, Mitroff, 2011). However,
according to Wood (1974), highly involved workers who are
more oriented to their occupations are dependent more on
intrinsic than extrinsic rewards.
2.3.1. The Relationship Between Pay and Performance
All businesses use pay, promotions, bonuses or other types of
rewards to motivate and encourage high-level performance of
employees. In motivating high performance, money is the
fundamental inducement; no other motivation technique has
been applied widely than pay due to its influential value. When
there is good performance measurers, performance pay can
enhance employee productivity and improve match quality
(Lemiux, MacLeod, W. B, Parent, D., 2009). However
performance pay is constrained by available performance
measurers.
Two extrinsic reward types, which include suitable earnings
(bonus and pay), and job security are the most important factors
in rewards (Kulkarni, 1983). Paying is a vital factor which
affects employees’ motivation (Kalim, Syed, Muahmmad 2010).
Rewarding is an initial step just like any other Human Resource
Operation especially when it confronts with salary, pay and
financial recompense. For pay to be effective to spur
performance, it has to be seen as fair. This means there has to be
openness with respect to information about how the reward
system operates and how the employees will be rewarded.
Employers’ plans on rewarding systems are based on their
employees’ efficiency and effectiveness in line with equity
theory and employees should be involved in designing the
reward system and its administration (Jenkins, 1992).
Standard pay techniques provide for minimum
compensation for a particular job, it does not reward
above-average nor does it penalize for below–average
performance and is meant to give employee some stable
income. Pay for performance correct this problem. Either plan
presents challenges owing to the fact that some jobs may be
easy to perform while others may be difficult to measure.
Similarly in group incentive, some members are performers
while others end up punishing the rest from their poor
performance (Luthans, 2005). Performance based pay
includes two types: individual performance based pay and
group performance based pay and includes pay, promotion
and other types of pay (Milkovich, Newman, 2009). Although
pay can be presented in different types, managers mostly use
common method of adding extra money to the base wage
(Chang, Hahn, 2006)
Psychology and Behavioral Sciences 2016; 5(1): 20-36 25
2.3.2. The Relationship Between Promotion and
Performance
Promotion is an important feature of employee’s lifestyle
and occupation, affecting other job experience levels (Blau,
DeVaro, 2007) and can have effects on satisfaction and
attachment levels. Firms can apply promotion as
compensation for highly performing employees, developing
and encouraging them to even superior performances.
According to Herzberg (1986), providing employees with
opportunities to advance in their company through internal
promotions acts as a motivator to work. Simon and Enz (1995)
and Wiley (1997) found that promotion and advancement
opportunity to be among the best tools to motivate employees.
Behaviour of employees in their workplace is related to
satisfaction in their careers (Riketta, Dick, 2005). Efforts by
management to establish promotion opportunities contribute
to employees’ job satisfaction and acts as a motivator for job
performance (Harrison, Novak, 2006).
2.3.3. The Relationship Between Bonus, Fringe Benefits and
Performance
Bonuses and fringe benefits are other forms of
compensation awarded to employees for good performance in
order to motivate them to even better performance. Bonuses
are used where employees have performed higher or exceeded
their set targets (Finkle, 2011). The amount of bonus is
determined by how much the employee has exceeded target.
Employees tend to decrease wages once several benefits such
as Medicare, bonus, and annual leave are offered to employees
after few years of employment (Baughman, 2003). Employees
view benefits and wages as substitutes, willing to give up
wages for more benefits (Woodbury, 1983). Powel and Wood
(1999) said some reasons cited for high turnover are low
compensation, inadequate fringe benefits among others.
2.4. The Relationship Between Non-financial Rewards and
Performance
Non-financial rewards include higher status, recognition,
more responsibility, positive feedback, and more assertiveness.
Recognition is one of the main rewards highly regarded by
employees. Being noticed and valued can be a majestic
motivator which encourages workers to stay with managers
and perform better (Frey, 1997)
Although extrinsic rewards enhance a subsistence level; the
intrinsic ones are strong motivators just as much. Staffs need
to be motivated by doing an effective job and feeling to do
something valuable and worthwhile. However both extrinsic
and intrinsic rewards stimulate the employee to have higher
level of performance and productivity (Reio, Callahon, 2004).
Overall, intrinsic motivation obtained from person or its
movement, impacts the performance and well-being feeling
(Ryan, Deci, 2000)
Other intrinsic rewards include subsidized membership,
free teas, flexible working hours, cinema tickets, birthday and
holiday presents. These benefit types are valued by employees
since they enhance work life. Intrinsic rewards exist within the
job itself. According to Ryan and Deci (1985), intrinsic
rewards like self-determination obtained from intrinsic
motivation, gives satisfaction to a person without any paying.
Franken, 2002, states that rewarding for having better
performance or behaviour is an external reward or motivation
while those rewards, similar to the viewpoint of reaching one’s
job height, develop an intrinsic motivation to do something
more. Then, the individual designs path or action plan to
realize that objective. In addition, the emotions role is to
enable individuals to develop one’s situation and view, and to
create steps for feelings of stimulation to perform better.
2.4.1. The Relationship Between Appreciation, Recognition
and Performance
Appreciation is a fundamental human need. Employees
respond to appreciation expressed through recognition of their
good work because it confirms their work is valued.
Psychological rewards such as recognition and appreciation
plays an important role in motivating employees raising their
performance. Relevantly, the employees’ commitment is
based on appreciation and rewards (Andrew, 2004). This is
built on trust relationship so that employees realize that
leaders (Managers) have their interest at heart. In this regard,
staff with good performance will predict that their significant
contributions will be realized and valued by the top managers
(Bowen, 2000). Alternatively, when employees are
appreciated and recognised, in response they feel indebted and
in response increase their performance.
2.4.2. The Relationship Between Delegation and
Performance
Delegation is a process of assigning tasks to subordinates,
giving responsibility to them for formal decision making and
raising the amount of allowed job related discretion to
subordinates. It involves authority to make decisions without
seeking approval from managers (Yukl and Flu, 1999).
Delegation puts emphasis on subordinate’s autonomy on
decision making (Leanna, 1986) and is different from
participation in that it includes decision making by individual
subordinate and not by subordinates as a group. Delegation is
a known necessary factor of effective management and raises
employees’ empowerment which in turn motivates them to
superior performance. Delegation has an advantage in that it
fulfils managers need for success and autonomy by
introducing stimulus for more entrepreneurial behaviour and
motivation (Mintzberg, 1979), It decreases work overload for
upper level managers (Yukl and Flu, 1999), It provides an area
for strategic training to confront challenges in upper levels in
future by exposing subordinates to decision making and
finally Subordinates are provide with an opportunity to prove
their speciality in particular problems, this would improve
quality of decisions employees makes (Ito, Person, 1986).
Delegation has job related consequences such as satisfaction
and subordinate performance (Johnstone, 2000)
2.4.3. The Relationship Between Empowerment and
Performance
Empowerment is the process of gaining control, feeling of
autonomy and not being controlled (Deci, Ryan, 2000). It is
the degree of authority enjoyed by a subordinate. Empowering
26 Christopher Muthusi Nzyoka and Bulah Hannah Orwa: The Relationship Between Total Compensation and
Employee Performance in the Insurance Industry, Case of Mayfair Insurance Company Limited
others is a leaders’ ability which allows them to reinforce and
develop their constituents by sharing power and giving
visibility and give credits to their employees (Kouzes and
Posner, 2002).
Empowerment has been in the forefront of productivity and
quality improvement effort (Sandbulte, 1992) and that it is a
good strategy to motivate employees in order to increase job
satisfaction and loyalty and thereby increase performance
(Lister, 2004, Payal, 2005). Empowerment works when
employees need the organization as much as it needs them
(Johnson, 1993) Empowerment of people is a major
contributor to the development of subordinates by allowing
them to do extremely well by investing in themselves, even at
the risk of making mistakes (Page, Wong, 2000). To reach the
level of empowerment, leaders should give protection,
instruction, advice, instruments and all other needed resources
to ensure knowledge and development is being managed. The
employee on the other hand, should have feeling and attitude
towards – I can do, and the leader must nature this feeling
instead of being quick to criticize. Leaders should train,
support and help employee’s nature and improve their
competencies. Emotionally, leaders should be responsible for
generating interest and hope. That emotion will cause intrinsic
motivation which will lead performance to soar in turn
(Goleman, Boyatzis, McKee, 2004).
2.5. Employee Performance
Employee performance is about employees achieving the
results, goals or standards as per the expectations set by the
organisation. Employees are rated on how well they do their
jobs compared to the performance standards set. In short, it is
the accomplishment of a given task measured against pre-set
standards of accuracy, completeness, cost, and speed, the
initiatives they take, their creativity in solving problems and
the resourcefulness in the way they utilise their resources, time
and energy (Rothman, Coetzer, 2003). Measuring
performance is of great importance to an incentive plan
because it communicates the importance of established
organizational goals. “What gets measured and rewarded gets
attention” (Bohlander, Snell, Sherman, 2001).
In discipline of human resource management, different
writers suggest the following indicators for measuring
employee performance and they include: quality that can be
measured by percentage of work output that must be redone or
is rejected; Customer satisfaction that can be measured by the
number of royal customers and customer feedback. Also,
timeliness, measured in terms of how fast work is performed by
the employee when given a certain task; absenteeism/tardiness
observed when employees absent themselves from work; and
achievement of objectives measured when an employee has
surpassed his/her set targets, he/she is then considered to have
performed well to achieve objectives (Hakala, 2008; Armstrong,
2006). Performance can as well be measured by the various
methods of performance appraisal including Management by
Objectives (MBOs), Behaviorally Anchored Rating Scales
(BARS), Assessment Centers, and Cost Accounting Method
among the modern ones.
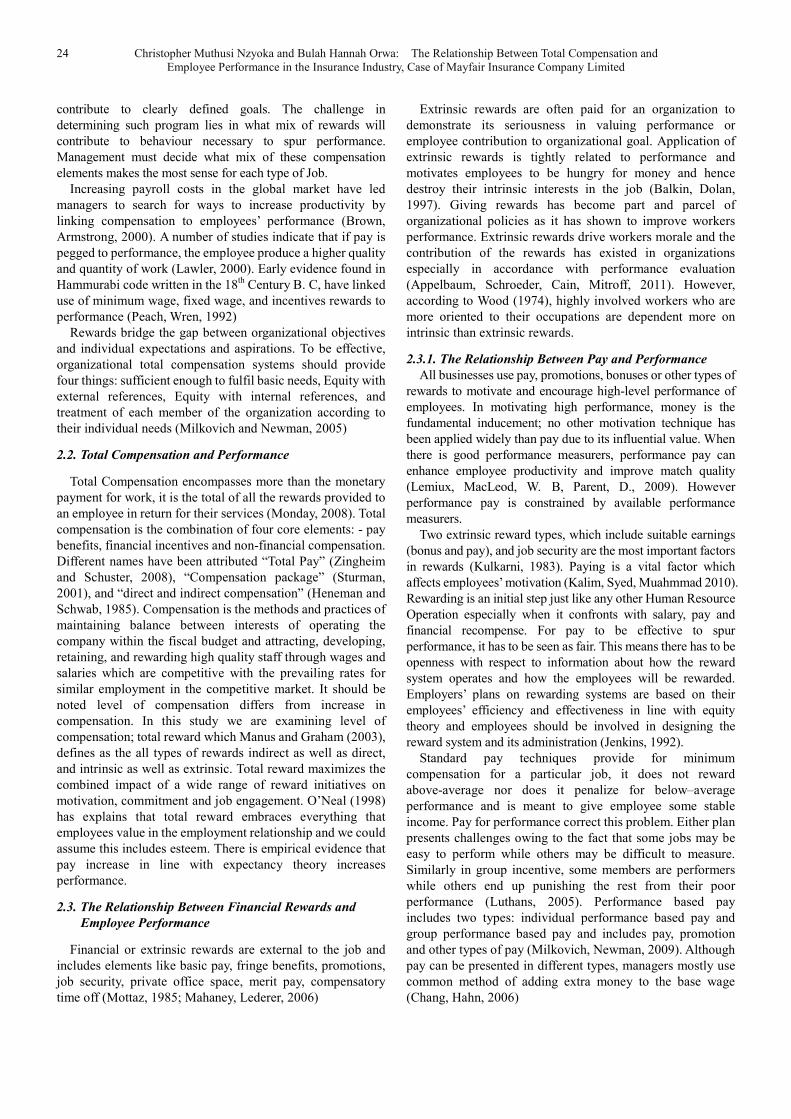
2.6. Conceptual Framework
Source: Researcher 2015.
Figure 2.1. Conceptual Framework.
3. Research Methodology
3.1. Introduction
This section is about the methodology that will be applied in
the research. It describes the research design, the target
population and sample size, research instruments, methods of
data collection and data analysis.
3.2. Research Design
This study will employ descriptive research design which is a
design which attempts to describe or define a subject, often by
creating a profile of a group of problems, people, or events,
through the collection of data and tabulation of the frequencies
on research variables or their interaction as indicated by Cooper
and Schindler (2003). Thus, this approach is appropriate for this
study as it will help to describe the state of affairs as they exist
without manipulation of variables which is the aim of the study.
According to Churchill (1991) descriptive study is appropriate
where the study seeks to describe the characteristics of certain
groups, estimate the proportion of people who have certain
characteristics and make predictions. Orodho, (2004) notes that
the choice of the descriptive research design is made based on
the fact that in the study, the research is interested on the state of
affairs already existing in the field and no variable will be
manipulated. Further, according to Bryman and Bell, (2003)
descriptive study is concerned with determining the relationship
between variables. Mugenda and Mugenda (2008) state that the
descriptive survey research design is a method which enables
the researcher to summarize and organize data in an effective
and meaningful way.
3.3. Population of Study
The population of the study will be comprised of 334
employees of Mayfair Insurance Company Limited.
According to Kothari (2004), a population is a well-defined
set of people, services, elements, and events, group of things
or households that are being investigated. Mugenda and
Mugenda (2008), explain that the target population should
have some observable characteristics, to which the researcher
intends to generalize the results of the study. This definition
Psychology and Behavioral Sciences 2016; 5(1): 20-36 27
assumes that the population is not homogeneous.
3.4. Sampling Design
A sample is a smaller group or sub-group obtained from the
accessible population (Mugenda, 2008). This subgroup is
carefully selected so as to represent the whole population with
the relevant characteristics. Each member or case in the
sample is referred to as subject, respondent or interviewees.
Sampling is a procedure, process or technique of choosing a
sub-group from a population to participate in the study (Ogula,
2005). It is the process of selecting a number of individuals for
a study in such a way that the individuals selected represent
the large group from which they were selected. The study will
apply stratified random sampling procedures to obtain the
respondents for questionnaires. The sample frame of the study
includes a representative sample of employees within the four
departments of the organization (Human Resource and
Administration, Finance, Operations, Sales and Marketing).
At least 30% of the total population is representative (Borg
and Gall, 2003). Thus, 30% of the accessible population is
enough for the sample size.
The table below shows how the sample will be selected:
Table 1. Sampling frame.
Department Total Population Sample Size (30% of
total population)
Administration 27 8
Finance 7 2
Operations 80 24
Sales & Marketing 220 66
Total 334 100
Source: Mayfair Insurance 2015.
3.5. Data Collection
A primary data collection instrument will be used during the
study; a questionnaire. The reason for choosing questionnaire
as the data collection instruments will be primarily due to its
practicability, applicability to the research problem and the
size of the population. A self–administered questionnaire with
both open and closed ended questions will be developed and
administered to obtain information from the 100 respondents.
The questionnaire will have four major sections. The first part
will seek demographic information of the respondents while
the second part will seek information on organizational
change. Part three will try to understand employee perception
of organizational change while the fourth part shall
concentrate on employee performance.
3.6. Reliability and Validity
Validity is the extent to which the instrument collects data
that it is meant to collect. It is the degree to which results
obtained from the analysis of the data actually represent the
phenomenon under study. In this study, to confirm the
reliability of the questionnaire a pre-test of 10%
questionnaires will be given to school of business students at
Kenyatta University to respond to the questions, this will be
done to test the reliability in terms of time taken to fill the
questionnaire. It will also be used to measure the validity in
respect to conceptual framework and whether it relates to the
research objective. The researcher will obtain necessary
approvals from the University and Management of Mayfair
Insurance Company limited. The respondents will be taken
through the questionnaire for the purpose of clarity. The
questionnaires will then be distributed to the respondents
through the Human Resource Office to be collected later.
3.7. Data Analysis
Data analysis is the whole process which starts immediately
after data collection and ends at the point of interpretation and
processing data (Kothari, 2004).
3.7.1. Qualitative Data
All the qualitative data collected from key informants will
be edited on a continuous basis to ensure completeness. Data
collected with the use of questionnaires will be put into
meaningful and exhaustive categories. Content analysis will
be the main method of analyzing the data collected. Data
collected will be categorized according to emerging variables
from each question in the questionnaire. Presentation of
results will be in prose form.
3.7.2. Quantitative Data
Data collected at the end of each day, will be checked to
ensure regularity and accuracy; this will be useful in ensuring
that the objectives of the study are addressed. Analysis will be
done according to the objectives of the study, data generated
by questionnaires will be cleaned, edited and coded before
analysis is done; the statistical package for social sciences
(SPSS) will be used whereby frequencies and percentages
generated from the various data categories will be computed
and the information presented in different charts and tables
form. Correlation analysis will be done to bring out the
relationship between the studies variables.
Finally, conclusions and recommendations will be derived
and presented in chapter 5. Triangulation of these methods
will be correlated to improve on the validity and richness of
the information gathered.
3.8. Ethical Considerations
In this research study, issues relating to the ethical conduct
of research such as informed consent, confidentiality, privacy
and anonymity will be upheld. According to Mark Saunders,
Philip Lewis, Adrian Thornhill (2009), ethics is the norms or
standards of behaviour that guide moral choices about our
behaviour and our relationships with others. Participants and
respondents will be given full information on the purpose and
objectives of the study in order for them to make informed
decisions as to whether to partake or not. Moreover, all
information concerning the identity and personality of
respondents will be treated with utmost confidentiality.
Additionally, all information gathered will be used for the sole
purpose of this research study.
28 Christopher Muthusi Nzyoka and Bulah Hannah Orwa: The Relationship Between Total Compensation and
Employee Performance in the Insurance Industry, Case of Mayfair Insurance Company Limited
4. Data Analysis, Results and Discussion
4.1. Introduction
This chapter presents the data analysis, presentation and
interpretation of findings. Analysis has been done using
correlation analysis and presented in tables and charts.
4.2. Response Analysis
The researcher targeted 100 employees of Mayfair
Insurance Company limited and 91 of the sampled population
answered the questionnaire, where 3 questionnaires were
invalid. This represents 89% response rate of the
questionnaires analysed.
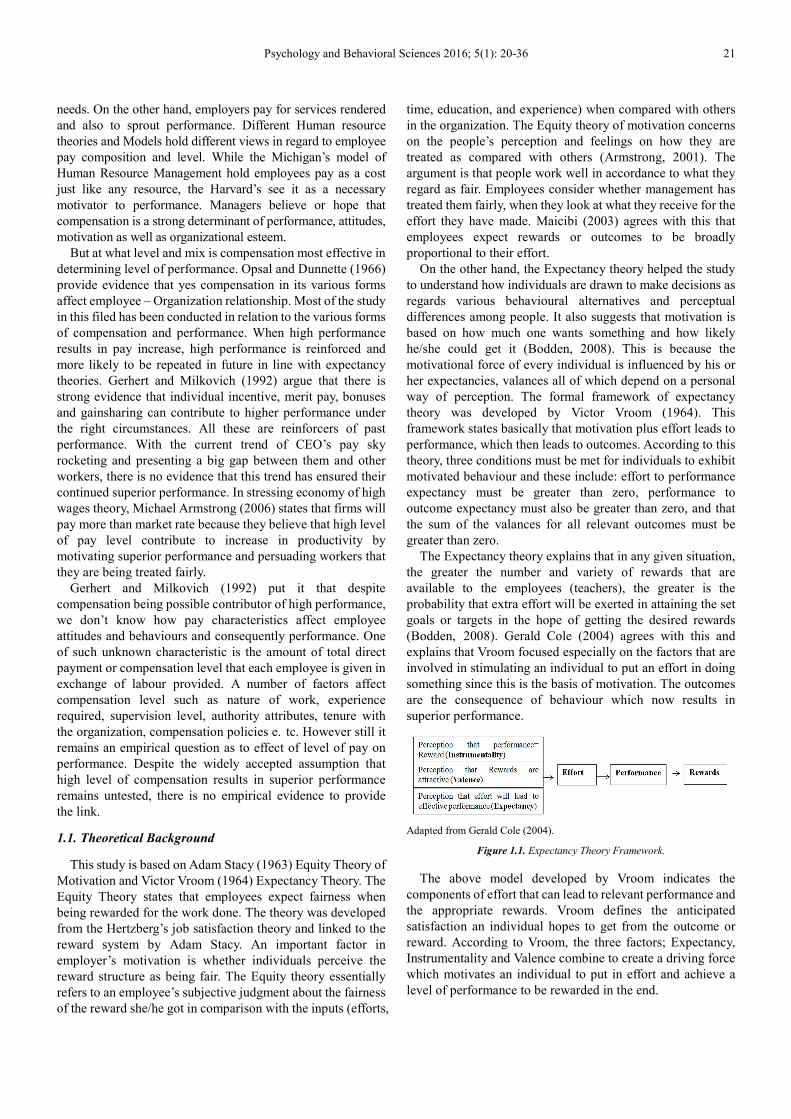
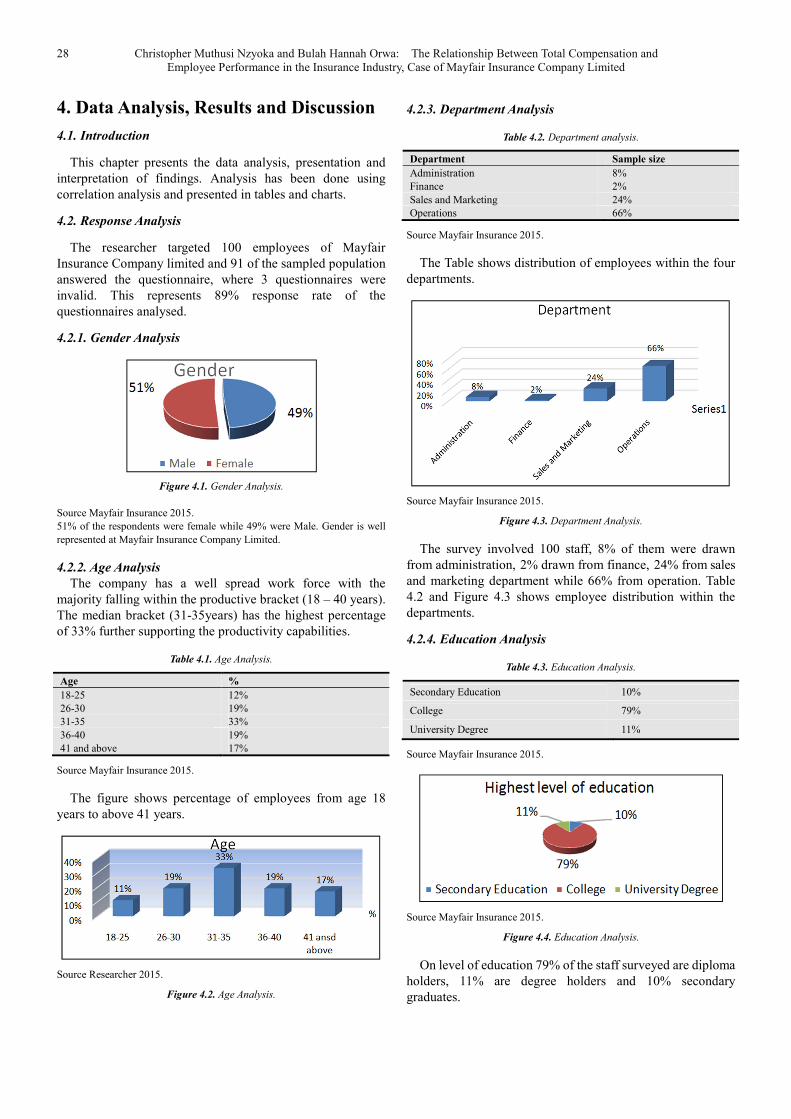
4.2.1. Gender Analysis
Figure 4.1. Gender Analysis.
Source Mayfair Insurance 2015.
51% of the respondents were female while 49% were Male. Gender is well
represented at Mayfair Insurance Company Limited.
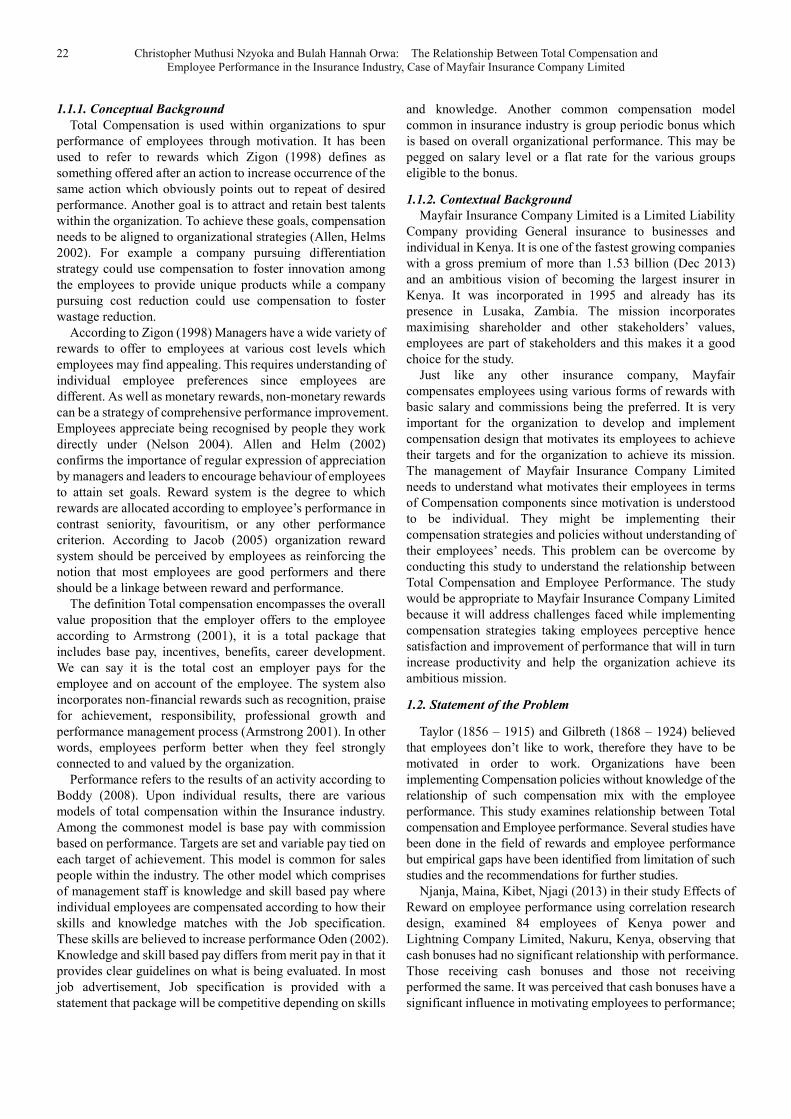
4.2.2. Age Analysis
The company has a well spread work force with the
majority falling within the productive bracket (18 – 40 years).
The median bracket (31-35years) has the highest percentage
of 33% further supporting the productivity capabilities.
Table 4.1. Age Analysis.
Age %
18-25 12%
26-30 19%
31-35 33%
36-40 19%
41 and above 17%
Source Mayfair Insurance 2015.
The figure shows percentage of employees from age 18
years to above 41 years.
Source Researcher 2015.
Figure 4.2. Age Analysis.
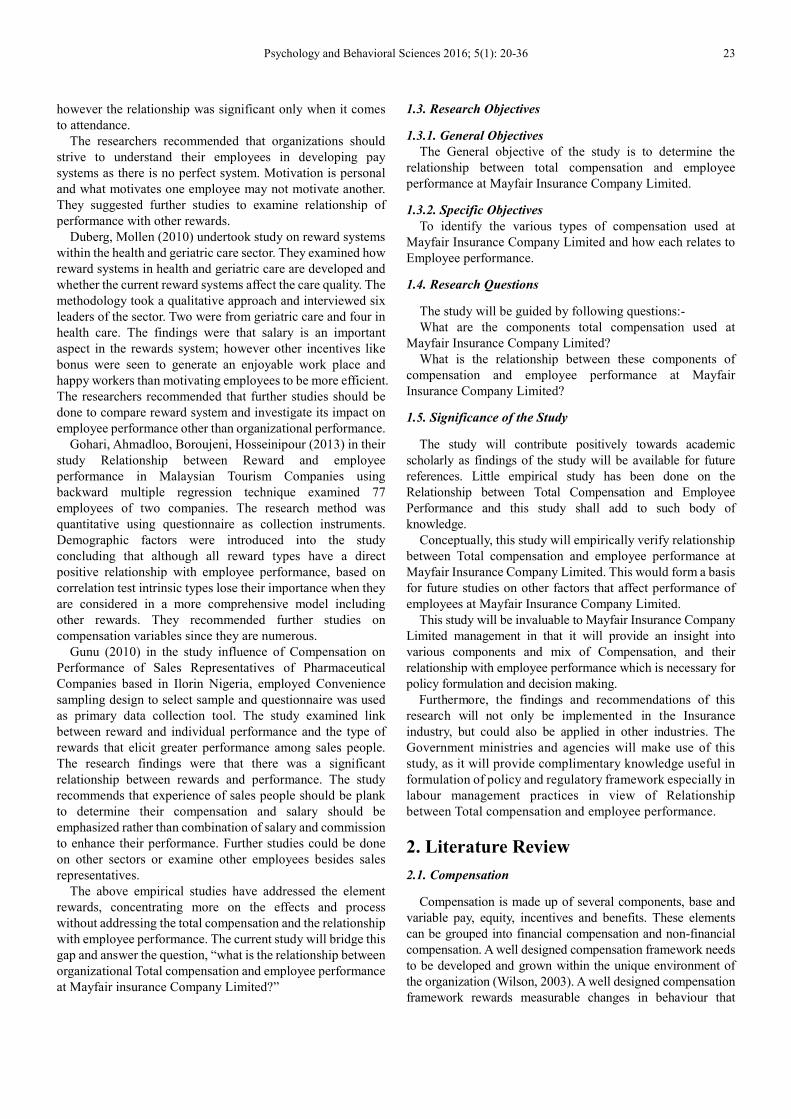
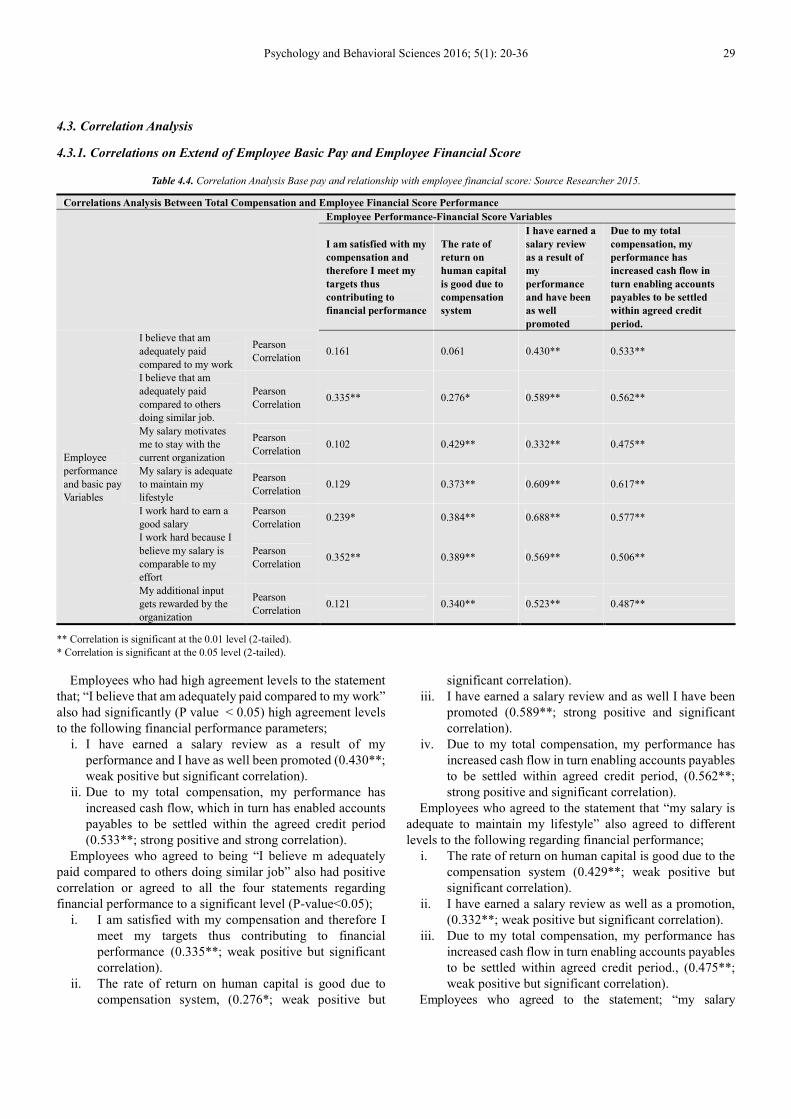
4.2.3. Department Analysis
Table 4.2. Department analysis.
Department Sample size
Administration 8%
Finance 2%
Sales and Marketing 24%
Operations 66%
Source Mayfair Insurance 2015.
The Table shows distribution of employees within the four
departments.
Source Mayfair Insurance 2015.
Figure 4.3. Department Analysis.
The survey involved 100 staff, 8% of them were drawn
from administration, 2% drawn from finance, 24% from sales
and marketing department while 66% from operation. Table
4.2 and Figure 4.3 shows employee distribution within the
departments.
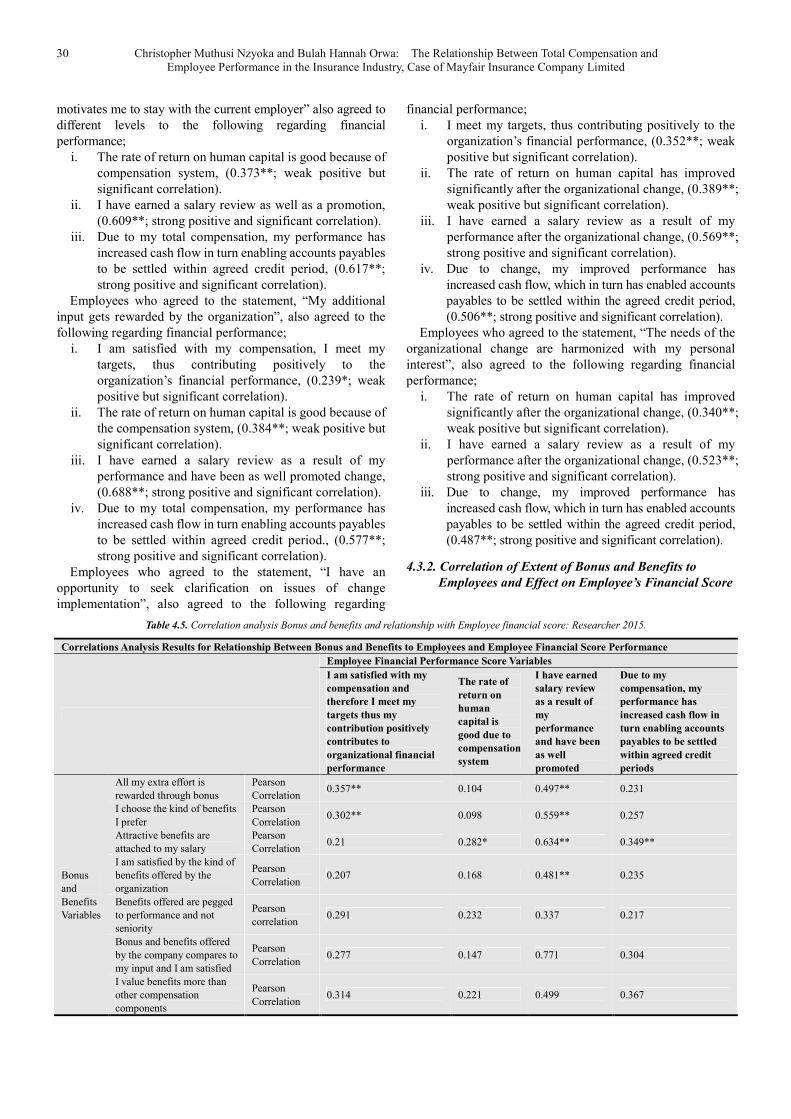
4.2.4. Education Analysis
Table 4.3. Education Analysis.
Secondary Education 10%
College 79%
University Degree 11%
Source Mayfair Insurance 2015.
Source Mayfair Insurance 2015.
Figure 4.4. Education Analysis.
On level of education 79% of the staff surveyed are diploma
holders, 11% are degree holders and 10% secondary
graduates.
Psychology and Behavioral Sciences 2016; 5(1): 20-36 29
4.3. Correlation Analysis
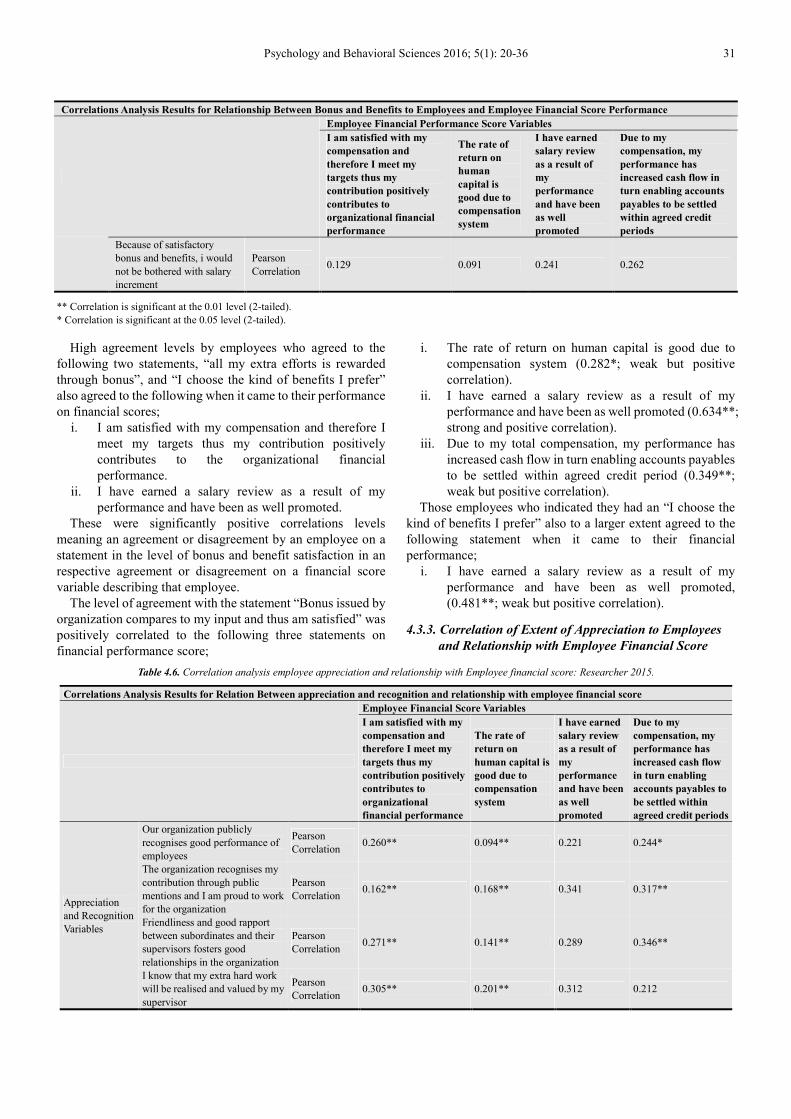
4.3.1. Correlations on Extend of Employee Basic Pay and Employee Financial Score
Table 4.4. Correlation Analysis Base pay and relationship with employee financial score: Source Researcher 2015.
Correlations Analysis Between Total Compensation and Employee Financial Score Performance
Employee Performance-Financial Score Variables
I am satisfied with my
compensation and
therefore I meet my
targets thus
contributing to
financial performance
The rate of
return on
human capital
is good due to
compensation
system
I have earned a
salary review
as a result of
my
performance
and have been
as well
promoted
Due to my total
compensation, my
performance has
increased cash flow in
turn enabling accounts
payables to be settled
within agreed credit
period.
Employee
performance
and basic pay
Variables
I believe that am
adequately paid
compared to my work
Pearson
Correlation 0.161 0.061 0.430** 0.533**
I believe that am
adequately paid
compared to others
doing similar job.
Pearson
Correlation 0.335** 0.276* 0.589** 0.562**
My salary motivates
me to stay with the
current organization
Pearson
Correlation 0.102 0.429** 0.332** 0.475**
My salary is adequate
to maintain my
lifestyle
Pearson
Correlation 0.129 0.373** 0.609** 0.617**
I work hard to earn a
good salary
Pearson
Correlation 0.239* 0.384** 0.688** 0.577**
I work hard because I
believe my salary is
comparable to my
effort
Pearson
Correlation 0.352** 0.389** 0.569** 0.506**
My additional input
gets rewarded by the
organization
Pearson
Correlation 0.121 0.340** 0.523** 0.487**
** Correlation is significant at the 0.01 level (2-tailed).
* Correlation is significant at the 0.05 level (2-tailed).
Employees who had high agreement levels to the statement
that; “I believe that am adequately paid compared to my work”
also had significantly (P value < 0.05) high agreement levels
to the following financial performance parameters;
i. I have earned a salary review as a result of my
performance and I have as well been promoted (0.430**;
weak positive but significant correlation).
ii. Due to my total compensation, my performance has
increased cash flow, which in turn has enabled accounts
payables to be settled within the agreed credit period
(0.533**; strong positive and strong correlation).
Employees who agreed to being “I believe m adequately
paid compared to others doing similar job” also had positive
correlation or agreed to all the four statements regarding
financial performance to a significant level (P-value<0.05);
i. I am satisfied with my compensation and therefore I
meet my targets thus contributing to financial
performance (0.335**; weak positive but significant
correlation).
ii. The rate of return on human capital is good due to
compensation system, (0.276*; weak positive but
significant correlation).
iii. I have earned a salary review and as well I have been
promoted (0.589**; strong positive and significant
correlation).
iv. Due to my total compensation, my performance has
increased cash flow in turn enabling accounts payables
to be settled within agreed credit period, (0.562**;
strong positive and significant correlation).
Employees who agreed to the statement that “my salary is
adequate to maintain my lifestyle” also agreed to different
levels to the following regarding financial performance;
i. The rate of return on human capital is good due to the
compensation system (0.429**; weak positive but
significant correlation).
ii. I have earned a salary review as well as a promotion,
(0.332**; weak positive but significant correlation).
iii. Due to my total compensation, my performance has
increased cash flow in turn enabling accounts payables
to be settled within agreed credit period., (0.475**;
weak positive but significant correlation).
Employees who agreed to the statement; “my salary
30 Christopher Muthusi Nzyoka and Bulah Hannah Orwa: The Relationship Between Total Compensation and
Employee Performance in the Insurance Industry, Case of Mayfair Insurance Company Limited
motivates me to stay with the current employer” also agreed to
different levels to the following regarding financial
performance;
i. The rate of return on human capital is good because of
compensation system, (0.373**; weak positive but
significant correlation).
ii. I have earned a salary review as well as a promotion,
(0.609**; strong positive and significant correlation).
iii. Due to my total compensation, my performance has
increased cash flow in turn enabling accounts payables
to be settled within agreed credit period, (0.617**;
strong positive and significant correlation).
Employees who agreed to the statement, “My additional
input gets rewarded by the organization”, also agreed to the
following regarding financial performance;
i. I am satisfied with my compensation, I meet my
targets, thus contributing positively to the
organization’s financial performance, (0.239*; weak
positive but significant correlation).
ii. The rate of return on human capital is good because of
the compensation system, (0.384**; weak positive but
significant correlation).
iii. I have earned a salary review as a result of my
performance and have been as well promoted change,
(0.688**; strong positive and significant correlation).
iv. Due to my total compensation, my performance has
increased cash flow in turn enabling accounts payables
to be settled within agreed credit period., (0.577**;
strong positive and significant correlation).
Employees who agreed to the statement, “I have an
opportunity to seek clarification on issues of change
implementation”, also agreed to the following regarding
financial performance;
i. I meet my targets, thus contributing positively to the
organization’s financial performance, (0.352**; weak
positive but significant correlation).
ii. The rate of return on human capital has improved
significantly after the organizational change, (0.389**;
weak positive but significant correlation).
iii. I have earned a salary review as a result of my
performance after the organizational change, (0.569**;
strong positive and significant correlation).
iv. Due to change, my improved performance has
increased cash flow, which in turn has enabled accounts
payables to be settled within the agreed credit period,
(0.506**; strong positive and significant correlation).
Employees who agreed to the statement, “The needs of the
organizational change are harmonized with my personal
interest”, also agreed to the following regarding financial
performance;
i. The rate of return on human capital has improved
significantly after the organizational change, (0.340**;
weak positive but significant correlation).
ii. I have earned a salary review as a result of my
performance after the organizational change, (0.523**;
strong positive and significant correlation).
iii. Due to change, my improved performance has
increased cash flow, which in turn has enabled accounts
payables to be settled within the agreed credit period,
(0.487**; strong positive and significant correlation).
4.3.2. Correlation of Extent of Bonus and Benefits to
Employees and Effect on Employee’s Financial Score
Table 4.5. Correlation analysis Bonus and benefits and relationship with Employee financial score: Researcher 2015.
Correlations Analysis Results for Relationship Between Bonus and Benefits to Employees and Employee Financial Score Performance
Employee Financial Performance Score Variables
I am satisfied with my
compensation and
therefore I meet my
targets thus my
contribution positively
contributes to
organizational financial
performance
The rate of
return on
human
capital is
good due to
compensation
system
I have earned
salary review
as a result of
my
performance
and have been
as well
promoted
Due to my
compensation, my
performance has
increased cash flow in
turn enabling accounts
payables to be settled
within agreed credit
periods
Bonus
and
Benefits
Variables
All my extra effort is
rewarded through bonus
Pearson
Correlation 0.357** 0.104 0.497** 0.231
I choose the kind of benefits
I prefer
Pearson
Correlation 0.302** 0.098 0.559** 0.257
Attractive benefits are
attached to my salary
Pearson
Correlation 0.21 0.282* 0.634** 0.349**
I am satisfied by the kind of
benefits offered by the
organization
Pearson
Correlation 0.207 0.168 0.481** 0.235
Benefits offered are pegged
to performance and not
seniority
Pearson
correlation 0.291 0.232 0.337 0.217
Bonus and benefits offered
by the company compares to
my input and I am satisfied
Pearson
Correlation 0.277 0.147 0.771 0.304
I value benefits more than
other compensation
components
Pearson
Correlation 0.314 0.221 0.499 0.367
Psychology and Behavioral Sciences 2016; 5(1): 20-36 31
Correlations Analysis Results for Relationship Between Bonus and Benefits to Employees and Employee Financial Score Performance
Employee Financial Performance Score Variables
I am satisfied with my
compensation and
therefore I meet my
targets thus my
contribution positively
contributes to
organizational financial
performance
The rate of
return on
human
capital is
good due to
compensation
system
I have earned
salary review
as a result of
my
performance
and have been
as well
promoted
Due to my
compensation, my
performance has
increased cash flow in
turn enabling accounts
payables to be settled
within agreed credit
periods
Because of satisfactory
bonus and benefits, i would
not be bothered with salary
increment
Pearson
Correlation 0.129 0.091 0.241 0.262
** Correlation is significant at the 0.01 level (2-tailed).
* Correlation is significant at the 0.05 level (2-tailed).
High agreement levels by employees who agreed to the
following two statements, “all my extra efforts is rewarded
through bonus”, and “I choose the kind of benefits I prefer”
also agreed to the following when it came to their performance
on financial scores;
i. I am satisfied with my compensation and therefore I
meet my targets thus my contribution positively
contributes to the organizational financial
performance.
ii. I have earned a salary review as a result of my
performance and have been as well promoted.
These were significantly positive correlations levels
meaning an agreement or disagreement by an employee on a
statement in the level of bonus and benefit satisfaction in an
respective agreement or disagreement on a financial score
variable describing that employee.
The level of agreement with the statement “Bonus issued by
organization compares to my input and thus am satisfied” was
positively correlated to the following three statements on
financial performance score;
i. The rate of return on human capital is good due to
compensation system (0.282*; weak but positive
correlation).
ii. I have earned a salary review as a result of my
performance and have been as well promoted (0.634**;
strong and positive correlation).
iii. Due to my total compensation, my performance has
increased cash flow in turn enabling accounts payables
to be settled within agreed credit period (0.349**;
weak but positive correlation).
Those employees who indicated they had an “I choose the
kind of benefits I prefer” also to a larger extent agreed to the
following statement when it came to their financial
performance;
i. I have earned a salary review as a result of my
performance and have been as well promoted,
(0.481**; weak but positive correlation).
4.3.3. Correlation of Extent of Appreciation to Employees
and Relationship with Employee Financial Score
Table 4.6. Correlation analysis employee appreciation and relationship with Employee financial score: Researcher 2015.
Correlations Analysis Results for Relation Between appreciation and recognition and relationship with employee financial score
Employee Financial Score Variables
I am satisfied with my
compensation and
therefore I meet my
targets thus my
contribution positively
contributes to
organizational
financial performance
The rate of
return on
human capital is
good due to
compensation
system
I have earned
salary review
as a result of
my
performance
and have been
as well
promoted
Due to my
compensation, my
performance has
increased cash flow
in turn enabling
accounts payables to
be settled within
agreed credit periods
Appreciation
and Recognition
Variables
Our organization publicly
recognises good performance of
employees
Pearson
Correlation 0.260** 0.094** 0.221 0.244*
The organization recognises my
contribution through public
mentions and I am proud to work
for the organization
Pearson
Correlation 0.162** 0.168** 0.341 0.317**
Friendliness and good rapport
between subordinates and their
supervisors fosters good
relationships in the organization
Pearson
Correlation 0.271** 0.141** 0.289 0.346**
I know that my extra hard work
will be realised and valued by my
supervisor
Pearson
Correlation 0.305** 0.201** 0.312 0.212
32 Christopher Muthusi Nzyoka and Bulah Hannah Orwa: The Relationship Between Total Compensation and
Employee Performance in the Insurance Industry, Case of Mayfair Insurance Company Limited
Correlations Analysis Results for Relation Between appreciation and recognition and relationship with employee financial score
Employee Financial Score Variables
I am satisfied with my
compensation and
therefore I meet my
targets thus my
contribution positively
contributes to
organizational
financial performance
The rate of
return on
human capital is
good due to
compensation
system
I have earned
salary review
as a result of
my
performance
and have been
as well
promoted
Due to my
compensation, my
performance has
increased cash flow
in turn enabling
accounts payables to
be settled within
agreed credit periods
I trust my supervisor and I know
he/she has best interest for me
Pearson
Correlation 0.177 0.359 0.237 0.414
I am involved in the development
of the organization
Pearson
Correlation 0.214 0.222 0.197 0.378
** Correlation is significant at the 0.01 level (2-tailed).
* Correlation is significant at the 0.05 level (2-tailed).
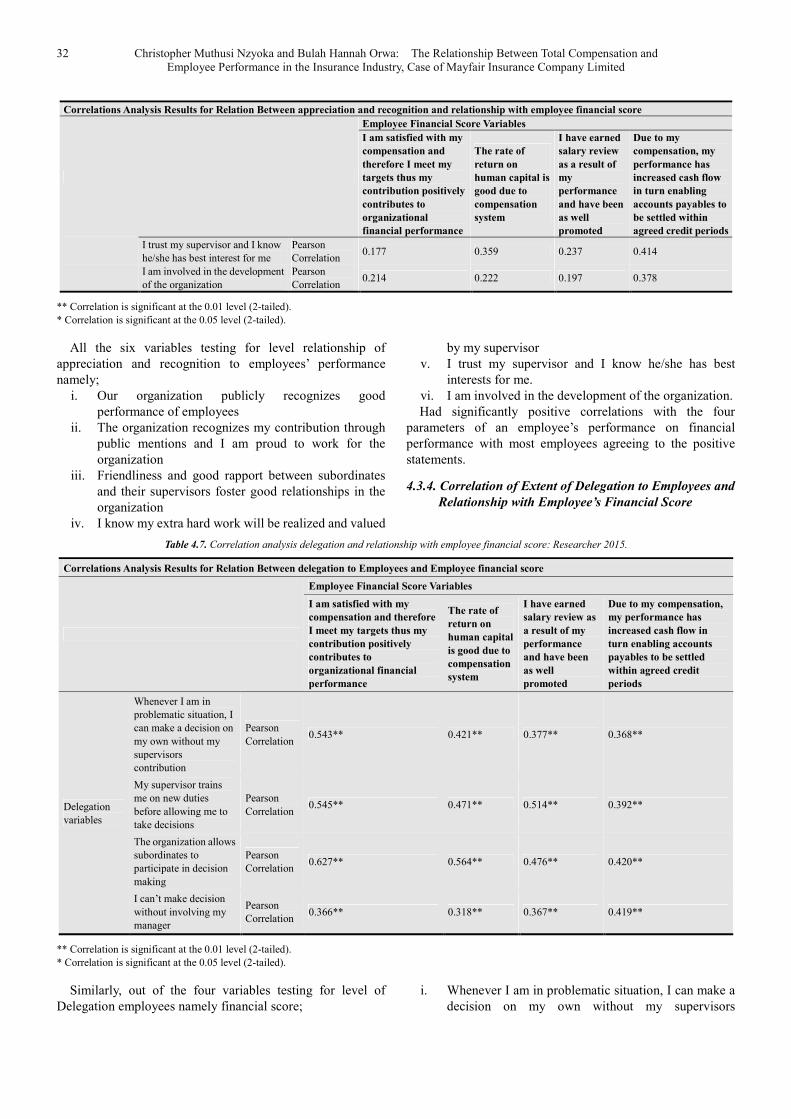
All the six variables testing for level relationship of
appreciation and recognition to employees’ performance
namely;
i. Our organization publicly recognizes good
performance of employees
ii. The organization recognizes my contribution through
public mentions and I am proud to work for the
organization
iii. Friendliness and good rapport between subordinates
and their supervisors foster good relationships in the
organization
iv. I know my extra hard work will be realized and valued
by my supervisor
v. I trust my supervisor and I know he/she has best
interests for me.
vi. I am involved in the development of the organization.
Had significantly positive correlations with the four
parameters of an employee’s performance on financial
performance with most employees agreeing to the positive
statements.
4.3.4. Correlation of Extent of Delegation to Employees and
Relationship with Employee’s Financial Score
Table 4.7. Correlation analysis delegation and relationship with employee financial score: Researcher 2015.
Correlations Analysis Results for Relation Between delegation to Employees and Employee financial score
Employee Financial Score Variables
I am satisfied with my
compensation and therefore
I meet my targets thus my
contribution positively
contributes to
organizational financial
performance
The rate of
return on
human capital
is good due to
compensation
system
I have earned
salary review as
a result of my
performance
and have been
as well
promoted
Due to my compensation,
my performance has
increased cash flow in
turn enabling accounts
payables to be settled
within agreed credit
periods
Delegation
variables
Whenever I am in
problematic situation, I
can make a decision on
my own without my
supervisors
contribution
Pearson
Correlation 0.543** 0.421** 0.377** 0.368**
My supervisor trains
me on new duties
before allowing me to
take decisions
Pearson
Correlation 0.545** 0.471** 0.514** 0.392**
The organization allows
subordinates to
participate in decision
making
Pearson
Correlation 0.627** 0.564** 0.476** 0.420**
I can’t make decision
without involving my
manager
Pearson
Correlation 0.366** 0.318** 0.367** 0.419**
** Correlation is significant at the 0.01 level (2-tailed).
* Correlation is significant at the 0.05 level (2-tailed).
Similarly, out of the four variables testing for level of
Delegation employees namely financial score;
i. Whenever I am in problematic situation, I can make a
decision on my own without my supervisors
Psychology and Behavioral Sciences 2016; 5(1): 20-36 33
contribution
ii. My supervisor trains me on new duties before
allowing me to make decisions.
iii. The organization allows subordinates to participate in
decision making.
Except one “I can’t make decision without involving my
manager” had significantly positive correlations with the four
employees financial score variables namely;
i. I am satisfied with my compensation and therefore I
meet my targets thus my contribution positively
contributes to the organizational financial
performance.
ii. The rate of return on human capital is good due to
compensation system.
iii. I have earned a salary review as a result of my
performance and have been as well promoted.
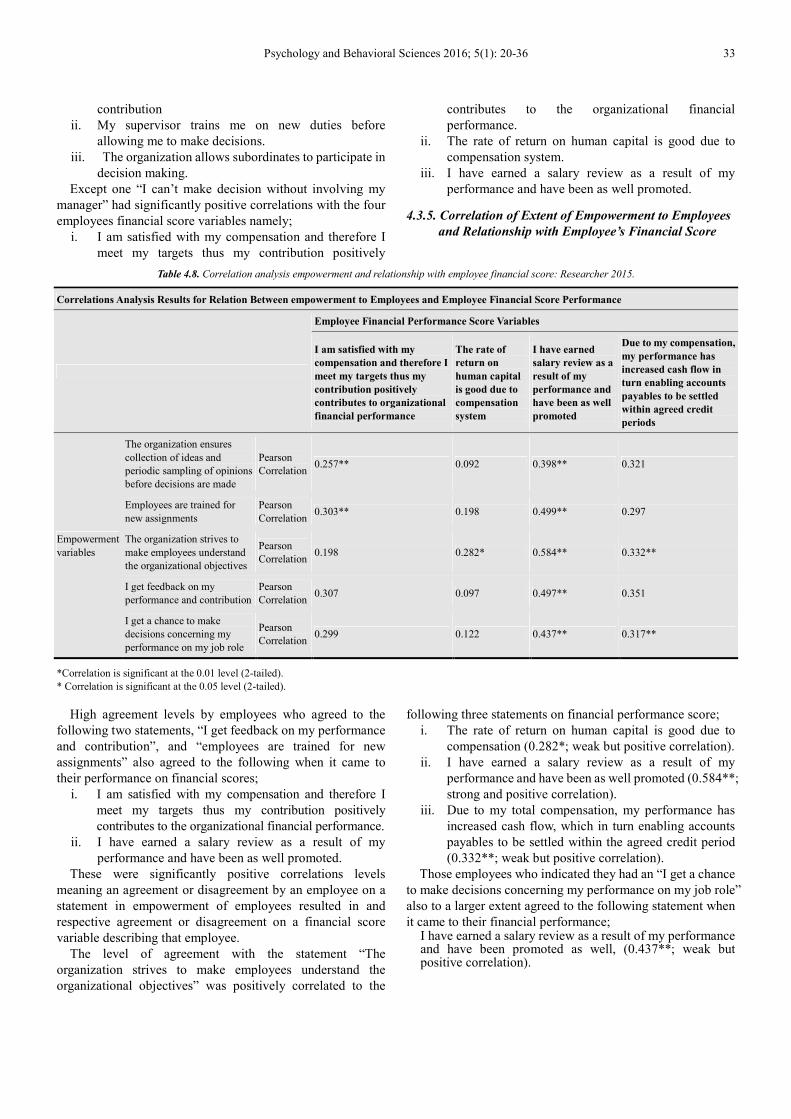
4.3.5. Correlation of Extent of Empowerment to Employees
and Relationship with Employee’s Financial Score
Table 4.8. Correlation analysis empowerment and relationship with employee financial score: Researcher 2015.
Correlations Analysis Results for Relation Between empowerment to Employees and Employee Financial Score Performance
Employee Financial Performance Score Variables
I am satisfied with my
compensation and therefore I
meet my targets thus my
contribution positively
contributes to organizational
financial performance
The rate of
return on
human capital
is good due to
compensation
system
I have earned
salary review as a
result of my
performance and
have been as well
promoted
Due to my compensation,
my performance has
increased cash flow in
turn enabling accounts
payables to be settled
within agreed credit
periods
Empowerment
variables
The organization ensures
collection of ideas and
periodic sampling of opinions
before decisions are made
Pearson
Correlation 0.257** 0.092 0.398** 0.321
Employees are trained for
new assignments
Pearson
Correlation 0.303** 0.198 0.499** 0.297
The organization strives to
make employees understand
the organizational objectives
Pearson
Correlation 0.198 0.282* 0.584** 0.332**
I get feedback on my
performance and contribution
Pearson
Correlation 0.307 0.097 0.497** 0.351
I get a chance to make
decisions concerning my
performance on my job role
Pearson
Correlation 0.299 0.122 0.437** 0.317**
*Correlation is significant at the 0.01 level (2-tailed).
* Correlation is significant at the 0.05 level (2-tailed).
High agreement levels by employees who agreed to the
following two statements, “I get feedback on my performance
and contribution”, and “employees are trained for new
assignments” also agreed to the following when it came to
their performance on financial scores;
i. I am satisfied with my compensation and therefore I
meet my targets thus my contribution positively
contributes to the organizational financial performance.
ii. I have earned a salary review as a result of my
performance and have been as well promoted.
These were significantly positive correlations levels
meaning an agreement or disagreement by an employee on a
statement in empowerment of employees resulted in and
respective agreement or disagreement on a financial score
variable describing that employee.
The level of agreement with the statement “The
organization strives to make employees understand the
organizational objectives” was positively correlated to the
following three statements on financial performance score;
i. The rate of return on human capital is good due to
compensation (0.282*; weak but positive correlation).
ii. I have earned a salary review as a result of my
performance and have been as well promoted (0.584**;
strong and positive correlation).
iii. Due to my total compensation, my performance has
increased cash flow, which in turn enabling accounts
payables to be settled within the agreed credit period
(0.332**; weak but positive correlation).
Those employees who indicated they had an “I get a chance
to make decisions concerning my performance on my job role”
also to a larger extent agreed to the following statement when
it came to their financial performance; I have earned a salary review as a result of my performance and have been promoted as well, (0.437**; weak but positive correlation).
34 Christopher Muthusi Nzyoka and Bulah Hannah Orwa: The Relationship Between Total Compensation and
Employee Performance in the Insurance Industry, Case of Mayfair Insurance Company Limited
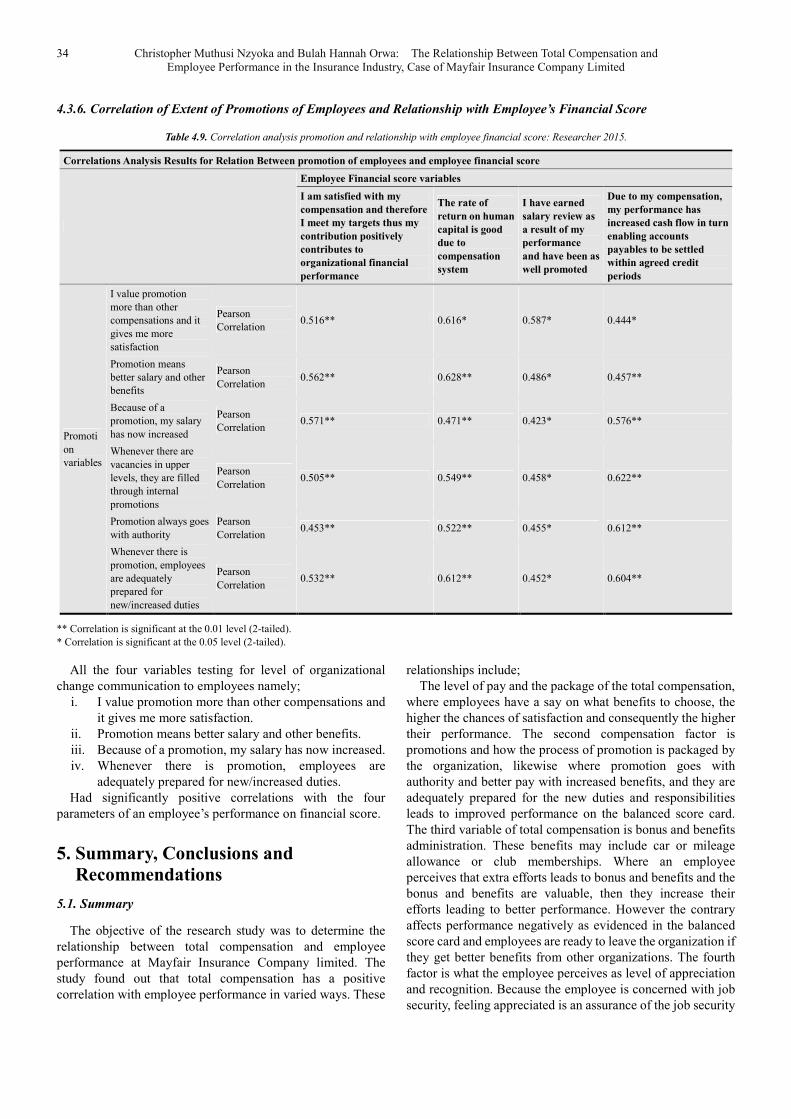
4.3.6. Correlation of Extent of Promotions of Employees and Relationship with Employee’s Financial Score
Table 4.9. Correlation analysis promotion and relationship with employee financial score: Researcher 2015.
Correlations Analysis Results for Relation Between promotion of employees and employee financial score
Employee Financial score variables
I am satisfied with my
compensation and therefore
I meet my targets thus my
contribution positively
contributes to
organizational financial
performance
The rate of
return on human
capital is good
due to
compensation
system
I have earned
salary review as
a result of my
performance
and have been as
well promoted
Due to my compensation,
my performance has
increased cash flow in turn
enabling accounts
payables to be settled
within agreed credit
periods
Promoti
on
variables
I value promotion
more than other
compensations and it
gives me more
satisfaction
Pearson
Correlation 0.516** 0.616* 0.587* 0.444*
Promotion means
better salary and other
benefits
Pearson
Correlation 0.562** 0.628** 0.486* 0.457**
Because of a
promotion, my salary
has now increased
Pearson
Correlation 0.571** 0.471** 0.423* 0.576**
Whenever there are
vacancies in upper
levels, they are filled
through internal
promotions
Pearson
Correlation 0.505** 0.549** 0.458* 0.622**
Promotion always goes
with authority
Pearson
Correlation 0.453** 0.522** 0.455* 0.612**
Whenever there is
promotion, employees
are adequately
prepared for
new/increased duties
Pearson
Correlation 0.532** 0.612** 0.452* 0.604**
** Correlation is significant at the 0.01 level (2-tailed).
* Correlation is significant at the 0.05 level (2-tailed).
All the four variables testing for level of organizational
change communication to employees namely;
i. I value promotion more than other compensations and
it gives me more satisfaction.
ii. Promotion means better salary and other benefits.
iii. Because of a promotion, my salary has now increased.
iv. Whenever there is promotion, employees are
adequately prepared for new/increased duties.
Had significantly positive correlations with the four
parameters of an employee’s performance on financial score.
5. Summary, Conclusions and
Recommendations
5.1. Summary
The objective of the research study was to determine the
relationship between total compensation and employee
performance at Mayfair Insurance Company limited. The
study found out that total compensation has a positive
correlation with employee performance in varied ways. These
relationships include;
The level of pay and the package of the total compensation,
where employees have a say on what benefits to choose, the
higher the chances of satisfaction and consequently the higher
their performance. The second compensation factor is
promotions and how the process of promotion is packaged by
the organization, likewise where promotion goes with
authority and better pay with increased benefits, and they are
adequately prepared for the new duties and responsibilities
leads to improved performance on the balanced score card.
The third variable of total compensation is bonus and benefits
administration. These benefits may include car or mileage
allowance or club memberships. Where an employee
perceives that extra efforts leads to bonus and benefits and the
bonus and benefits are valuable, then they increase their
efforts leading to better performance. However the contrary
affects performance negatively as evidenced in the balanced
score card and employees are ready to leave the organization if
they get better benefits from other organizations. The fourth
factor is what the employee perceives as level of appreciation
and recognition. Because the employee is concerned with job
security, feeling appreciated is an assurance of the job security
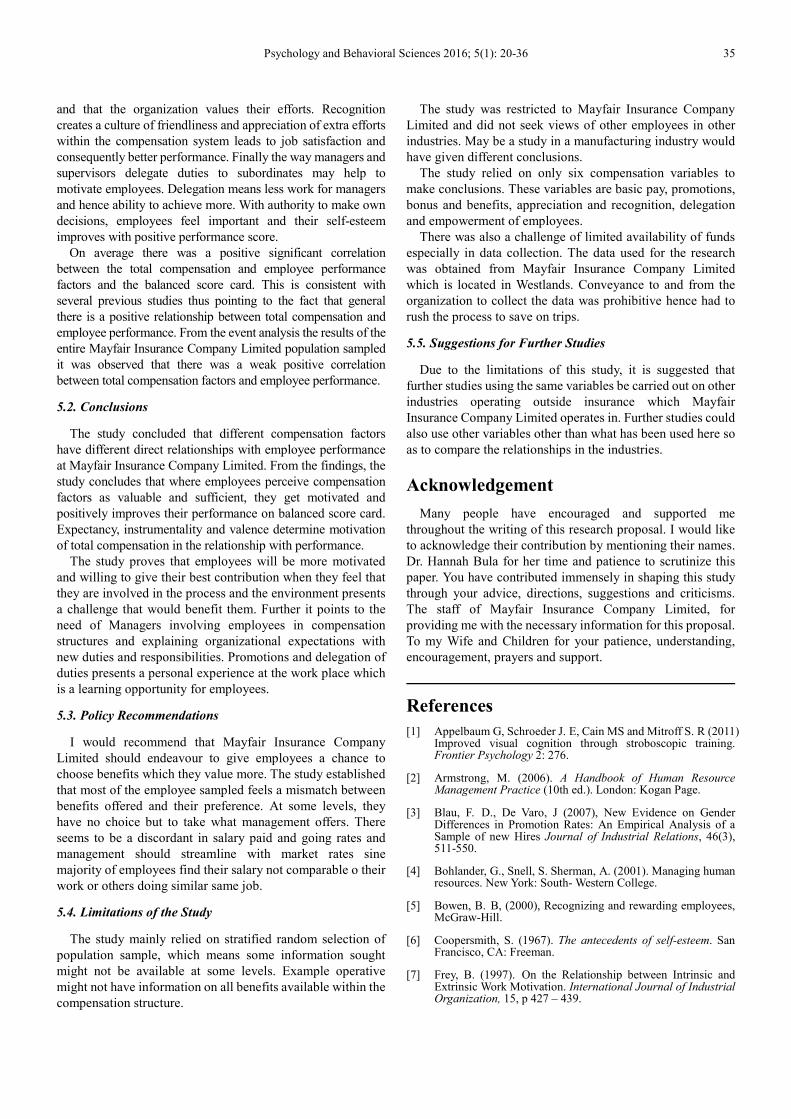
Psychology and Behavioral Sciences 2016; 5(1): 20-36 35
and that the organization values their efforts. Recognition
creates a culture of friendliness and appreciation of extra efforts
within the compensation system leads to job satisfaction and
consequently better performance. Finally the way managers and
supervisors delegate duties to subordinates may help to
motivate employees. Delegation means less work for managers
and hence ability to achieve more. With authority to make own
decisions, employees feel important and their self-esteem
improves with positive performance score.
On average there was a positive significant correlation
between the total compensation and employee performance
factors and the balanced score card. This is consistent with
several previous studies thus pointing to the fact that general
there is a positive relationship between total compensation and
employee performance. From the event analysis the results of the
entire Mayfair Insurance Company Limited population sampled
it was observed that there was a weak positive correlation
between total compensation factors and employee performance.
5.2. Conclusions
The study concluded that different compensation factors
have different direct relationships with employee performance
at Mayfair Insurance Company Limited. From the findings, the
study concludes that where employees perceive compensation
factors as valuable and sufficient, they get motivated and
positively improves their performance on balanced score card.
Expectancy, instrumentality and valence determine motivation
of total compensation in the relationship with performance.
The study proves that employees will be more motivated
and willing to give their best contribution when they feel that
they are involved in the process and the environment presents
a challenge that would benefit them. Further it points to the
need of Managers involving employees in compensation
structures and explaining organizational expectations with
new duties and responsibilities. Promotions and delegation of
duties presents a personal experience at the work place which
is a learning opportunity for employees.
5.3. Policy Recommendations
I would recommend that Mayfair Insurance Company
Limited should endeavour to give employees a chance to
choose benefits which they value more. The study established
that most of the employee sampled feels a mismatch between
benefits offered and their preference. At some levels, they
have no choice but to take what management offers. There
seems to be a discordant in salary paid and going rates and
management should streamline with market rates sine
majority of employees find their salary not comparable o their
work or others doing similar same job.
5.4. Limitations of the Study
The study mainly relied on stratified random selection of
population sample, which means some information sought
might not be available at some levels. Example operative
might not have information on all benefits available within the
compensation structure.
The study was restricted to Mayfair Insurance Company
Limited and did not seek views of other employees in other
industries. May be a study in a manufacturing industry would
have given different conclusions.
The study relied on only six compensation variables to
make conclusions. These variables are basic pay, promotions,
bonus and benefits, appreciation and recognition, delegation
and empowerment of employees.
There was also a challenge of limited availability of funds
especially in data collection. The data used for the research
was obtained from Mayfair Insurance Company Limited
which is located in Westlands. Conveyance to and from the
organization to collect the data was prohibitive hence had to
rush the process to save on trips.
5.5. Suggestions for Further Studies
Due to the limitations of this study, it is suggested that
further studies using the same variables be carried out on other
industries operating outside insurance which Mayfair
Insurance Company Limited operates in. Further studies could
also use other variables other than what has been used here so
as to compare the relationships in the industries.
Acknowledgement
Many people have encouraged and supported me
throughout the writing of this research proposal. I would like
to acknowledge their contribution by mentioning their names.
Dr. Hannah Bula for her time and patience to scrutinize this
paper. You have contributed immensely in shaping this study
through your advice, directions, suggestions and criticisms.
The staff of Mayfair Insurance Company Limited, for
providing me with the necessary information for this proposal.
To my Wife and Children for your patience, understanding,
encouragement, prayers and support.
References
[1] Appelbaum G, Schroeder J. E, Cain MS and Mitroff S. R (2011) Improved visual cognition through stroboscopic training. Frontier Psychology 2: 276.
[2] Armstrong, M. (2006). A Handbook of Human Resource Management Practice (10th ed.). London: Kogan Page.
[3] Blau, F. D., De Varo, J (2007), New Evidence on Gender Differences in Promotion Rates: An Empirical Analysis of a Sample of new Hires Journal of Industrial Relations, 46(3), 511-550.
[4] Bohlander, G., Snell, S. Sherman, A. (2001). Managing human resources. New York: South- Western College.
[5] Bowen, B. B, (2000), Recognizing and rewarding employees, McGraw-Hill.
[6] Coopersmith, S. (1967). The antecedents of self-esteem. San Francisco, CA: Freeman.
[7] Frey, B. (1997). On the Relationship between Intrinsic and Extrinsic Work Motivation. International Journal of Industrial Organization, 15, p 427 – 439.

36 Christopher Muthusi Nzyoka and Bulah Hannah Orwa: The Relationship Between Total Compensation and
Employee Performance in the Insurance Industry, Case of Mayfair Insurance Company Limited
[8] Greenberg J. (1990), Employee theft as a reaction to underpayment inequity: hidden costs of pay cuts. Journal of Applied Psychology, 5, 561-568.
[9] Hakala, D. (2008). How to Measure Employee Performance, 16 Ways. HR World Newsletter.
[10] Harrison, L. L., Novak, D. (2006). Evaluation of a Gerontological nursing continuing education programme: Effect on nurses' knowledge and attitudes and on patients' perceptions and satisfaction. Journal of Advanced Nursing, 13(6), 684-692.
[11] Heneman, H. G. Schwab, D. P. (1985). Pay satisfaction: Its multidimensional nature and measurement. International Journal of Psychology, 20, 129-141.
[12] Herzberg, F. (1986). One more time: How do you motivate employees? In J. N. Williamson (Ed.), The leader-Manager (pp. 433-448).
[13] Hill, C. W. L. (1990). Cooperation, Opportunism, and the Invisible Hand: Implications for Transaction Cost Theory. Academy of Management Review, Vol. 15, No. 3, pp. 500-513., ISSN: 0363-7425.
[14] Huseman, R. H (1987). A New Perspective on Equity Theory: The Equity Sensitivity Construct. The Academy of Management Review, 12, 222-234.
[15] Johnson, R. R. (2009). Using organizational characteristics to explain patrol officer drug arrest activity. Policing: An International Journal of Police Strategies and Management, 32(1), 6-20.
[16] Kalim, S. U (2010), ‘The Relationship between Rewards and Employee Motivation in Commercial Banks of Pakistan’, Research Journal of International Studies, 14, pp 70-72.
[17] Korman, A. (1976). Hypothesis of work behaviour revisited and an extension. Academy of Management Review, 1, 50–63.
[18] Kouzes J. M., Posner B. Z. (2002). Leadership Challenge. San Francisco, CA: Jossey-Bass.
[19] Mathibe, I. R. 2008, Expectancy Theory and its implications for employee motivation. Academic Leadership Journal. Volume 6 Issue 3.
[20] Mark Saunders, Philip Lewis, Adrian Thornhill (2009), Research Methods for Business Students, 5th Ed. Pearson, England.
[21] Michael Armstrong (2006) Handbook on Human Resource Management practice (10th Edition), Kogan page, 120 pentoville, London, NI 9JN, United Kingdom.
[22] Milkovich, G., Milkovich, C. (1992). Strengthening the pay–performance relationship: The research. Compensation and Benefits Review, 24, 53–62.
[23] Milkovich, G. T., Newman, J. M. (2005). Compensation, 8th
Ed. New York: McGraw-Hill/Irwin.
[24] Mondy, R. W. (2008). Human Resource Management (10th ed.).
New Jersey: Pearson Prentice Hall.
[25] Njanja, R. K (2013) Effect of Reward on Employee Performance: A Case of Kenya Power and Lighting Company Ltd., Nakuru, Kenya, International Journal of Business and Management; 8(21) 41-49.
[26] Opsahl, R. L. Dunnette, M. D. (1966). The role of financial
incentives in industrial motivation. Psychological Bulletin 12, 45-47.
[27] Page D., Wong P. T. (2000). A Conceptual Framework for Measuring Servant Leadership. Academy of Management Journal. 38 (1442-56).
[28] Payam Gohari, A. A, (2013) The Relationship Between Rewards and Employee Performance. Interdisciplinary Journal of Contemporary Research in Business, 5(3), 543–569.
[29] Pinter C. C (2008). Work Motivation in Organizational behaviour. New York: Psychology press.
[30] Podrug, N. (2010) Stewardship Relations within Management Hierarchy in Large Croatian Companies. Doctoral dissertation. Faculty of economics and business Zagreb, Zagreb.
[31] Redmond, B. F. (2009). Lesson 5: Equity Theory: Equity Theory: Is what I get for my work fair compared to others? Work attitudes and motivation. The Pennsylvania State University World Campus.
[32] Redmond, B. F. (2010). Lecture on expectancy theory (Lesson 4). Personal Collection of B. F. Redmond, Penn State University, University Park, PA.
[33] Reio, G, T. Callahon, J. L. (2004). Affect, Curiosity, and socialization-related Learning; a path analysis of antecedents to job performance, Journal of Business and Psychology, Vol. 19, pp3-22.
[34] Riketta, M., Dick, R. V. (2005). Foci of attachment in organizations: A meta-analytic comparison of the strength and correlates of workgroup versus organizational identification and commitment. Journal of Vocational Behaviour, 67(3), 490-510.
[35] Rothman, S and Coetzer, E. P., (2003). The Big Five Personality Dimension on Job Performance. SA Journal of Industrial Psychology 72.
[36] Ryan, R. M., and Deci, E. L. (2000). When rewards compete with nature: The undermining of intrinsic motivation and self-regulation, San Diego: Academic Press pp. 14-54.
[37] Stajkovic, A. D., Luthans, F. (1999). The relative effects of different incentive motivators on work performance. Paper presented at the Academy of Management Meeting, San Diego, CA.
[38] Stetched M. D, Rosse, J. G. (2007). Understanding reactions to workplace injustice through process theories of motivation. A teaching module and simulation. Journal of Management Education, 31, 777-796.
[39] Sturman, M. C. (2001). The compensation conundrum: Does the hospitality industry short-change its employees – and itself? The Cornell Hotel and Restaurant Administration Quarterly, 47, 70-76.
[40] Umar, G (2010) The Influence of Compensation on Performance of Sales Representatives of Pharmaceutical Companies Based in Ilorin –Nigeria, An International Multi-Disciplinary Journal, Ethiopia, 4 (3b) 223–239.
[41] Woodbury, Stephen, A. (1983) Substitution between wages and non-wage Benefits, American Economic Review 73, 166-182.