the relationship between test-takers' listening proficiency and - ielts
TRANSCRIPT
IELTS Research Reports Volume 12 © www.ielts.org 1
The relationship between test-takers’ listening proficiency and their performance on the IELTS Speaking Test Author: Fumiyo Nakatsuhara, University of Bedfordshire, UK Grant awarded Round 15, 2009
This research investigates the relationship between test-takers’ listening proficiency and performance on Part 3 of the IELTS Speaking Test, as against that on Part 2.
Click here to read the Introduction to this volume which includes an appraisal of this research, its context and impact.
ABSTRACT This study investigated the relationship between test-takers’ listening proficiency and performance on Part 3 (Discussion) of the IELTS Speaking Test, as against that on Part 2 (Individual Long Turn). It explored how communication problems that were associated with test-takers’ listening proficiency occurred and how these problems were dealt with.
Data were collected from 36 pre-sessional course students at a UK university, who took both a listening test and IELTS Speaking Test, followed by a short semi-structured interview session. All Speaking Test sessions were both audio and video recorded. The audio-recordings were edited to separate the students’ performances on Part 2 from those on Part 3, and each recording was rated by two of the four trained IELTS examiners involved in this study. Examiners were also asked to write down reasons for awarding their scores.
Speaking Test scores were analysed for any difference in difficulty between the two parts. Correlations between the listening test scores and the Speaking Test scores awarded on four analytical criteria were compared between the two parts. A Conversation Analysis (CA) methodology was utilised to illustrate salient occurrences of communication problems that were related to test-takers’ difficulties in hearing or understanding the examiner.
The findings of this study highlighted the differences between Part 2 and Part 3 in terms of the constructs they measure, showing that the latter format, at least to some extent, measures listening-into-speaking abilities. The interactional data also showed that the construct underlying Part 3 was not a purely productive speaking ability, especially for students at Band 5.0 and below who tended to encounter some difficulties in understanding the examiner.
FUMIYO NAKATSUHARA Dr Fumiyo Nakatsuhara is a lecturer in Language Assessment at the Centre for Research in English Language Learning and Assessment (CRELLA), University of Bedfordshire. She has a PhD in Language Testing and an MA in Applied Linguistics from the University of Essex. Her research interests include the nature of co-constructed interaction in various speaking test formats (eg, interview, paired, and group formats), task design and rating scale development. Her MA dissertation received the IELTS MA Award 2005 from the IELTS partners (the University of Cambridge ESOL Examinations, the British Council, and IDP: IELTS Australia). Her recent publications include a book chapter in Language Testing: Theories and Practices (O’Sullivan, 2011) and research papers in Cambridge ESOL Research Notes (2006), ELT Journal (2008) and Language Testing (forthcoming).
Fumiyo Nakatsuhara
IELTS Research Reports Volume 12 © www.ielts.org 2
CONTENTS
1 Introduction....................................................................................................................................3
2 Background of the research.........................................................................................................3 2.1 Recent IELTS Speaking Test studies ......................................................................................3 2.2 The impact of listening proficiency on Speaking Test performance.........................................5
3 Research questions ......................................................................................................................6
4 Research design............................................................................................................................6 4.1 Participants ..............................................................................................................................6 4.2 Data collection .........................................................................................................................8
4.2.1 Listening Test...........................................................................................................................8 4.2.2 Speaking Test ..........................................................................................................................9 4.2.3 Audio-rating of the speaking performance ...............................................................................9 4.2.4 A short interview concerning the students’ Speaking Test experience..................................10
4.3 Data analysis .........................................................................................................................10
5 Results and discusssion ............................................................................................................11 5.1 Listening Test scores .............................................................................................................11 5.2 Speaking Test scores (RQ 1).................................................................................................12
5.2.1 Overview of Speaking Test scores and comparing Part 2 and Part 3 overall scores ............12 5.2.2 Comparing Part 2 and Part 3 analytical scores......................................................................15
5.3 Relationship between Listening and Speaking scores (RQ2)................................................17 5.4 Communication problems related to test-takers’ limited listening proficiency (RQ3) .............20 5.5 Test-takers’ perceptions of communication problems............................................................34
6 Conclusion ...................................................................................................................................36
7 Limitations of the study and future research ...........................................................................38
References...........................................................................................................................................40
Appendix 1: Self-assessment questionnaire....................................................................................43
Appendix 2: Test-takers’ Listening and Speaking scores and self-assessment ratings .............47
Appendix 3: Transcription notation...................................................................................................48
Appendix 4: Examples of examiners’ comments.............................................................................49
IELTS RESEARCH REPORTS, VOLUME 12, 2011 Published by: IDP: IELTS Australia and British Council Editor: Jenny Osborne, IDP: IELTS Australia Editorial consultant: Petronella McGovern, IDP: IELTS Australia Editorial assistance: Judith Fairbairn, British Council Acknowledgements: Dr Lynda Taylor, University of Cambridge ESOL Examinations IDP: IELTS Australia Pty Limited British Council ABN 84 008 664 766 Bridgewater House Level 8, 535 Bourke St, Melbourne VIC 3000, Australia 58 Whitworth St, Manchester, M1 6BB, UK © IDP: IELTS Australia Pty Limited 2011 © British Council 2011 This publication is copyright. Apart from any fair dealing for the purposes of: private study, research, criticism or review, as permitted under the Copyright Act, no part may be reproduced or copied in any form or by any means (graphic, electronic or mechanical, including recording, taping or information retrieval systems) by any process without the written permission of the publishers. Enquiries should be made to the publisher. The research and opinions expressed in this volume are of individual researchers and do not represent the views of IDP: IELTS Australia Pty Limited. The publishers do not accept responsibility for any of the claims made in the research. National Library of Australia, cataloguing-in-publication data, 2011 edition, IELTS Research Reports 2011 Volume 12. ISBN 978-0-9775875-8-2
The relationship between test-takers’ listening proficiency and their performance on the IELTS Speaking Test
IELTS Research Reports Volume 12 © www.ielts.org 3
1 INTRODUCTION
The IELTS Speaking Test involves interactions between an examiner and a test-taker, and so the interactive parts of the test inevitably require a degree of listening proficiency. Listening proficiency seems to have a role, especially in Part 3 of the test, where the examiner invites a test-taker to participate in discussion about more abstract topics than those in Part 2. In fact, recent research into the discourse of the IELTS Speaking Test has identified examples of communication problems caused by the test-takers’ apparent failure to understand the questions (Seedhouse and Egbert, 2006). It is also noteworthy that the majority of suggestions for changes in the rating scale and the interviewer frame made in recent IELTS studies relate either to test-takers’ listening problems and/or to the Fluency and Coherence component of the rating scale (Brown, 2006a, 2006b; O'Sullivan and Lu, 2006; Seedhouse and Egbert, 2006).
Despite increasing interest in the relationship between listening proficiency and speaking performance in listening-into-speaking tests (Lee, 2006; Sawaki et al, 2009; Stricker et al, 2005), no study has directly addressed this issue in speaking test formats that include interaction between a test-taker and an examiner. It is, therefore, important to investigate the impact of listening proficiency on IELTS Speaking Test performance. The aims of this research are to investigate the relationship between test-takers’ listening proficiency and performance on Part 3 (Discussion) of the IELTS Speaking Test, as against that on Part 2 (Individual long turn), and to explore how communication problems that are associated with test-takers’ listening proficiency occur, and how these problems are dealt with.
2 BACKGROUND OF THE RESEARCH
2.1 Recent IELTS Speaking Test studies Four recent IELTS Speaking studies have identified potential concerns associated with test-takers’ listening proficiency and the Fluency and Coherence scale (Brown, 2006a, 2006b; O'Sullivan and Lu, 2006; Seedhouse and Egbert, 2006).
Based on Conversation Analysis (CA) of 137 audio-recorded tests, Seedhouse and Egbert (2006) demonstrate that interactional problems can be caused by test-takers’ misunderstanding of what the examiner has said, although some communication breakdowns were also caused by the examiners’ poor questioning. When test-takers do not understand questions posed by examiners, they usually initiate repairs by requesting question repetition, and they may also occasionally ask for a re-formulation or explanation of the question. However, in Part 1 of the IELTS Speaking Test, examiners are allowed to repeat the same question only once, and are not allowed to re-formulate questions. Thus, examiners usually reject the request for re-formulation. For Seedhouse and Egbert (2006, p 172), this highlights a discrepancy between IELTS Test interactions and the kinds of interactions that students might expect to have in the university context. To avoid possible confusion to test-takers, the researchers suggest that a statement on repair rules should be included in documentation for students. For a further research direction, they speculate that “there does appear to be some kind of correlation between [the IELTS Speaking] test score and occurrence of other-initiated repair, ie trouble in hearing or understanding on the part of the candidate” (Seedhouse and Egbert, 2006, p 193). In other words, it is important to explore the extent to which listening ability impacts on Speaking Test performance.
Fumiyo Nakatsuhara
IELTS Research Reports Volume 12 © www.ielts.org 4
The interlocutor frame is rather less rigid in Part 3 than in Part 1, and the examiner has greater discretion. In fact, using 85 audio-taped IELTS Speaking Tests, O’Sullivan and Lu (2006) found that Part 3 involved a far greater number of examiner deviations from the interlocutor frame than Parts 1 and 2. The deviations particularly relate to the number of paraphrasing questions used by the examiner (91% of the paraphrasing questions occurred in Part 3). Paraphrasing is most likely to occur when the test-taker has failed to understand the question, pointing to difficulty with listening comprehension. Although Seedhouse and Egbert (2006) expressed concern that examiners’ re-formulation and repetition of questions could be a potential source of unfairness, as some exceeded the set rules for communication repair, O’Sullivan and Lu (2006) demonstrated that, among other types of deviations, paraphrasing resulted in only a minimal impact on test-takers’ performance as measured against criteria for elaborating and expanding in discourse, linguistic accuracy, complexity and fluency. On the basis of their findings, O’Sullivan and Lu (2006) suggest the possibility of allowing for some flexibility in examiners’ use of paraphrasing questions. This issue of paraphrasing again indicates the need to investigate the relationship between test-takers’ listening proficiency and their performance in the interactive parts of the IELTS Speaking Test.
Two recent studies on the validation of the analytical rating scales have investigated test-takers’ language and examiners’ rating processes (Brown, 2006a, 2006b). In order to validate descriptors for each of the four analytical rating scales (ie, Pronunciation, Grammatical Range and Accuracy, Lexical Resource and Fluency and Coherence), Brown (2006a) analysed the IELTS Speaking Test discourse of 20 test-takers at different proficiency-levels. She utilised a wide range of linguistic measures to evaluate key features described for each marking category. For example, in relation to the Fluency and Coherence scale, linguistic measures included the occurrence of restarts and repeats per 100 words, the ratio of pause time to speech time, the number of words per 60 seconds, the average length of responses, the total number of words etc. Although there was considerable variation in the size of the differences between other bands across measures, there was a clear step up from Band 5 to Band 6 for all of the measures relating to the Fluency and Coherence criterion. For the Grammatical Range and Accuracy measures, the greatest difference in grammatical complexity was also observed between Bands 5 and 6, while for the accuracy measures, the greatest difference lay between Bands 7 and 8. For the Lexical Resources measures, there was only small difference between means for all measures. Through detailed analysis of test-taker language, this current study seeks a possible boundary in bands where the degree of impact of test-takers’ listening proficiency changes.
Brown (2006b) has also investigated how examiners interpret the analytical scales and what problems they identify when making rating decisions. Verbal reports from 12 IELTS examiners showed that the Fluency and Coherence scale was the most complex and difficult for them to interpret. One of the reasons for the problems seemed to be associated with the interpretation of hesitation. It did not always seem to be clear to the examiners whether test-takers were hesitating because of a search for ideas or a search for language (Brown, 2006b, p 51). Furthermore, the examiners found Fluency and Coherence the most difficult to distinguish from the other scales. Investigating the role of listening ability may help to clarify the sources of test-taker hesitation/pauses and so help to improve examiners’ interpretation of the scale or suggest revisions in line with Brown’s (2006b) intentions.
The relationship between test-takers’ listening proficiency and their performance on the IELTS Speaking Test
IELTS Research Reports Volume 12 © www.ielts.org 5
2.2 The impact of listening proficiency on Speaking Test performance Previous research into the impact of listening proficiency on speaking test performance has yielded mixed results. This section will briefly describe previous research on this issue in a) integrated tests of listening-into-speaking and b) paired and group oral tests, while discussing a potential impact for listening proficiency on IELTS Speaking Test performance.
Investigations of the impact of listening ability on scores on the integrated speaking tasks in the TOEFL iBT have found no impact for listening proficiency on listening-into-speaking scores (Lee, 2006; Sawaki et al, 2009). Two reasons have been put forward for this. Firstly, the listening texts employed in the integrated tasks were easier than those used in the Listening section (Sawaki et al, 2009, p 26). Secondly and perhaps more importantly, the five-level holistic rating scales used in these TOEFL iBT studies did not seem to be sensitive enough to tap the construct of listening-into-speaking. In contrast, the IELTS Speaking scale might have greater potential for detecting differences in test-takers’ listening proficiency. This is because, although the IELTS scale was not developed to reflect test-takers’ listening proficiency, the IELTS scale employs analytic scoring, and some phrases included in the Fluency and Coherence category in particular would seem to imply a role for listening proficiency (eg, cannot respond without noticeable pauses).
The increasing use of paired and group oral tests has also attracted attention to the relationship between test-takers’ listening proficiency and their performance on these formats, and there is clear evidence here that listening ability does play a part in performance. In her analysis of group oral test discourse, Nakatsuhara (2009) reported that communication problems in group tests could be attributable in part to limited listening proficiency. Recent studies into paired tests also have pointed out the importance of listening as part of successful interaction (ie, interactive listening) (eg, Ducasse and Brown, 2009; Galaczi, 2010; May, 2007). Ducasse and Brown (2009) illustrate two demonstrations of comprehension that contribute to successful interaction; 1) showing evidence of comprehension by the listener (eg, filling in with a missing word to help the partner) and 2) showing supportive listening by providing audible support with sounds (eg, back-channelling).
Although the IELTS Speaking Test does not elicit as many interactional features as paired and group formats due to the nature of the one-to-one interview format (ffrench, 2003), recent research, as discussed in section 2.1 above, has suggested that even in this limited context, limitations in understanding the interviewer’s questions could result in some difficulties for the test-taker resulting in less effective spoken responses (eg, Mohammadi, 2009; Seedhouse and Egbert, 2006). Such problems are likely to be greater for test-takers who have limited listening proficiency.
This section has reviewed recent research into IELTS and other speaking tests which signals the importance of listening proficiency for the interactive parts, especially Part 3, of the IELTS Speaking Test. It is fair to say that, while the interlocutors’ input language in interactive spoken formats has been pointed out as one of the contextual parameters that could influence test-takers’ cognitive processes and, therefore, their output language (see Weir’s (2005) socio-cognitive framework; further elaborated in Field, 2011), the relationship between their listening proficiency and their spoken performance has been under-researched. If the present investigation finds any impact of listening proficiency on test-takers’ performance on Part 3 of the IELTS Speaking Test, this indicates that the part is at least to some extent tapping the construct of listening-into-speaking, and the literature reviewed above suggests that this could be reflected in scores on the Fluency and Coherence scale.
Fumiyo Nakatsuhara
IELTS Research Reports Volume 12 © www.ielts.org 6
3 RESEARCH QUESTIONS
This study considered three research questions concerning the relationship between test-takers’ listening proficiency and their scores on Part 3 of the IELTS Speaking Test as against that on Part 2, and explored how listening-related communication problems in Part 3 occurred and how these problems were dealt with.
Research Question 1: Is there evidence of any difference in difficulty between Part 2 (Individual long turn) and Part 3 (Discussion) of the IELTS Speaking Test identified by overall scores and scores given to each analytical category?
Research Question 2: What are the relationships between test-takers’ listening proficiency and overall and analytical scores awarded on Part 2 and Part 3 respectively?
Research Question 3: How do communication problems in Part 3 that seem to be related to test-takers’ difficulties in understanding the examiner occur and how are they dealt with?
! Are there any differences between different proficiency-level test-takers in terms of the number and types of listening-related communication problems?
! What are test-takers’ perceptions of difficulties encountered while communicating with the examiner?
4 RESEARCH DESIGN
4.1 Participants The participants in this study were 36 pre-sessional course students at a UK university. Of the 36 participants, 17 were males (47.2%) and 19 were females (52.8%). They were all approximately 20-years old (mean: 19.34, SD: 1.31). Twenty-eight were from the People’s Republic of China (L1: Chinese), and the rest comprised five from Hong Kong (L1: Cantonese), one from Kazakhstan (L1: Kazakh), one from Oman (L1: Arabic) and one from Kuwait (L1: Arabic).
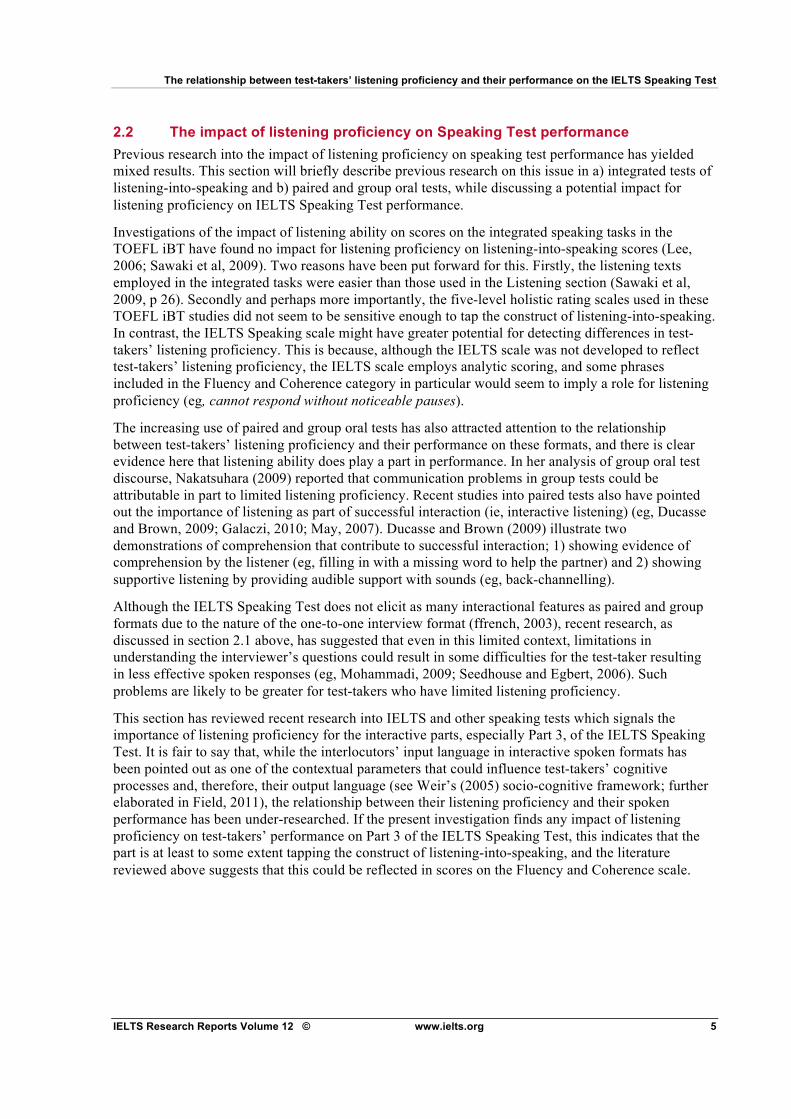
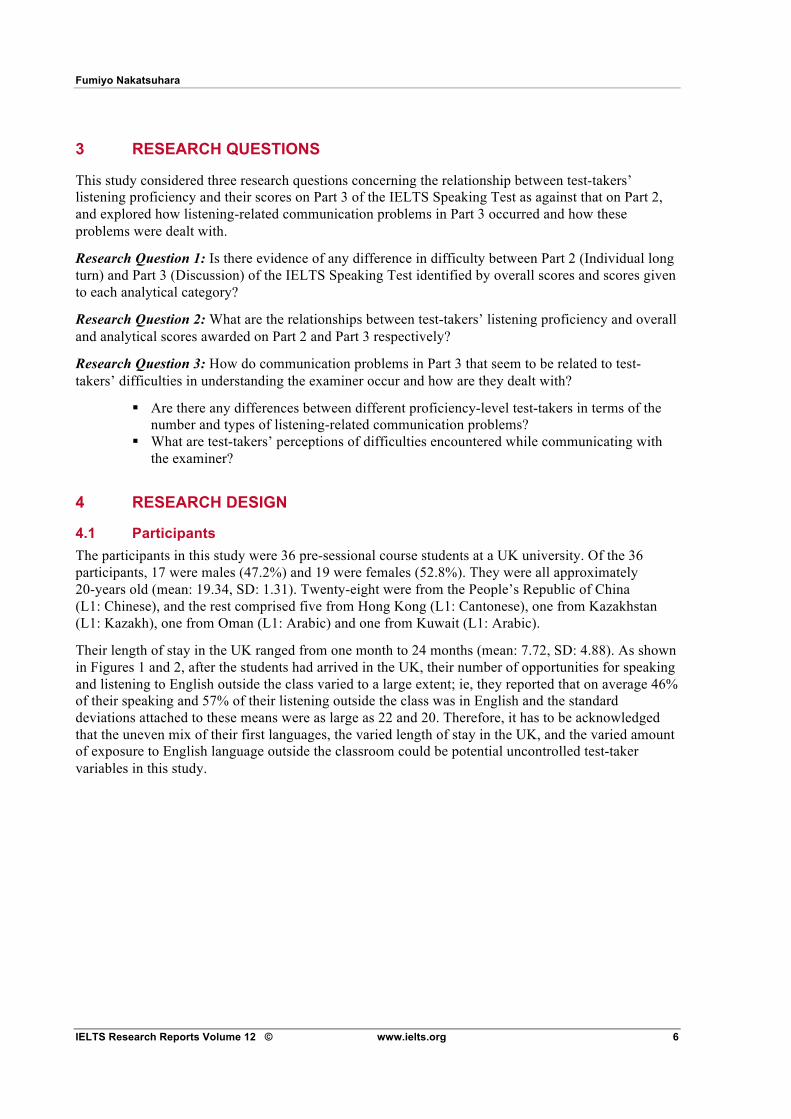
Their length of stay in the UK ranged from one month to 24 months (mean: 7.72, SD: 4.88). As shown in Figures 1 and 2, after the students had arrived in the UK, their number of opportunities for speaking and listening to English outside the class varied to a large extent; ie, they reported that on average 46% of their speaking and 57% of their listening outside the class was in English and the standard deviations attached to these means were as large as 22 and 20. Therefore, it has to be acknowledged that the uneven mix of their first languages, the varied length of stay in the UK, and the varied amount of exposure to English language outside the classroom could be potential uncontrolled test-taker variables in this study.
The relationship between test-takers’ listening proficiency and their performance on the IELTS Speaking Test
IELTS Research Reports Volume 12 © www.ielts.org 7
Figure 1: Speaking English Figure 2: Listening to English outside the class (%) outside the class (%)
To better understand the participating students’ profiles, a self-assessment questionnaire about their capacity in coping with aural and oral communication inside and outside the classroom was administered, using Likert-scale questions and the CEFR self-assessment grid (see Appendix 1). Although it should be pointed out that their self-assessments may not be very accurate, the results indicated that their average listening ability assessment was between B1 and B2 in the CEFR and their average spoken interaction ability assessment was at B2 level. Thus, despite some uncontrolled test-taker variables pointed out above, it seems that, considering most UK universities set the admission cut-off point of English proficiency around B2 and C1, these participating students are typical students at pre-sessional courses (who would also be preparing for IELTS), in terms of their capacity in coping with their everyday English listening and speaking activities. As this questionnaire is not central to this research, a summary of the findings is presented in Appendix 1.
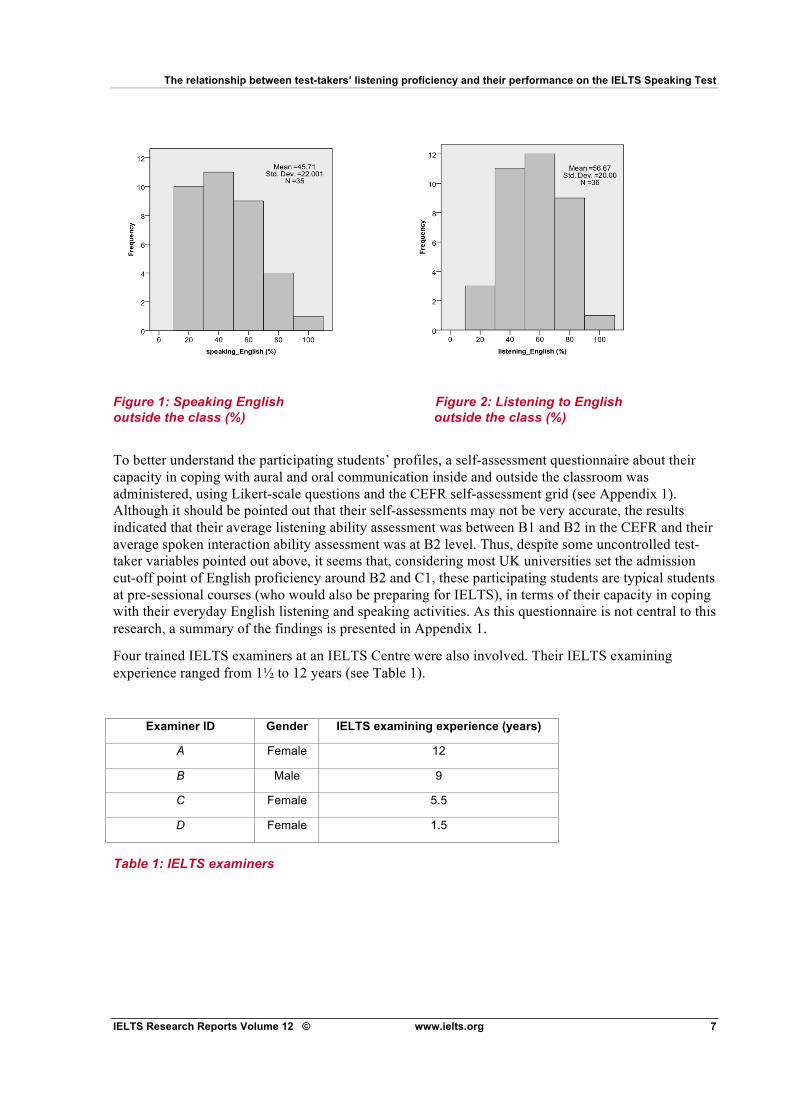
Four trained IELTS examiners at an IELTS Centre were also involved. Their IELTS examining experience ranged from 1! to 12 years (see Table 1).
Examiner ID Gender IELTS examining experience (years)
A Female 12
B Male 9
C Female 5.5
D Female 1.5
Table 1: IELTS examiners

Fumiyo Nakatsuhara
IELTS Research Reports Volume 12 © www.ielts.org 8
4.2 Data collection All of the instruments described below were piloted with a small number of participants prior to the main experiment.
4.2.1 Listening Test To assess the test-takers’ listening abilities, the study used a listening component from the Cambridge Main Suite test instead of an IELTS Listening Test. This was because the construct of the IELTS Listening Test is the academic listening ability required for university study, and thus the test involves listening to lectures. However, the construct to be measured for the purpose of this study was a more general listening ability, and therefore, the content of the recordings in a Cambridge Main Suite test that measures general English proficiency is more akin to what IELTS test-takers might listen to during the IELTS Speaking Test. To reflect the range of abilities in the target group and so discriminate more effectively between participants in terms of their listening abilities, both FCE (B2) and CAE (C1) items were included in the test.
A listening test that includes both FCE and CAE items was created using FCE and CAE practice materials published by the University of Cambridge ESOL Examinations (Cambridge ESOL, 2008a, 2008b, 2009a, 2009b). As shown in Table 2 below, the 36 students took the 40-minute listening test, each of the 34 items being worth one mark.
Phase Task type and focus Format No. of items
1
FCE
Part 1
Multiple choice.
General gist, detail, function, purpose, attitude, opinion, relationship, topic, place, situation, genre, agreement, etc.
A series of short unrelated extracts, of approximately 30 seconds each, from monologues or exchanges between interacting speakers. There is one multiple choice question per text, each with three options.
8
2
FCE
Part 2
Sentence completion.
Detail, specific information, stated opinion.
A monologue or text involving interacting speakers and lasting approximately 3 minutes. Candidates are required to complete the sentences with information heard on the recording.
10
3 CAE
Part 3
Multiple choice.
Attitude and opinion.
A conversation between two or more speakers of approximately 4 minutes. There are six multiple-choice questions, each with four options.
6
4 CAE
Part 4
Multiple matching.
Gist, attitude, main points, interpreting context.
Five short themed monologues, of
approximately 30 seconds each. Each multiple-matching task requires selection of the correct options from a list of eight.
10
Total 34
Table 2: Listening Test (40 minutes) (taken from UCLES, 2007a; UCLES, 2007b)

The relationship between test-takers’ listening proficiency and their performance on the IELTS Speaking Test
IELTS Research Reports Volume 12 © www.ielts.org 9
4.2.2 Speaking Test Two sets of examiner prompts of the IELTS Speaking Test were provided by Cambridge ESOL (Prompt 1: Interest, Prompt 2: Parties). These prompts were taken from the DVD, IELTS Scores Explained (IELTS Partners, 2006) In the interest prompt, test-takers are asked to describe an interest or hobby that they enjoy in the Individual long turn part (Part 2) followed by a discussion with the examiner on more general themes such as the social benefits of hobbies and leisure time (Part 3). Under each theme, a number of questions are provided. In the parties prompt, they are asked to describe the best party they have ever been to, followed by a discussion on family parties in their countries, other parties and national celebrations. Instructions in both Part 2 and Part 3 and questions that the examiners ask in Part 3 are all scripted, and the examiners are required to follow the scripts word-for-word, though they can select one or two of the themes that are appropriate for developing discussion, depending on each test-taker’s response. Permission was granted for use of these prompts for the purpose of this study. Each prompt was used with 18 students.
Over two days of data collection, 36 students each took a 10-minute Speaking Test. All the Speaking Test sessions were both audio and video recorded. The test included three parts (see Table 3):
1) a very brief warm-up conversation (this was different from a usual IELTS Part 1)
2) Part 2
3) Part 3.
1 Warm-up
(30 sec - 1 minute)
! Check the test-taker’s name and introduce yourself ! Ask the test-taker about him/herself (eg home, work, studies)
2 Part 2
Individual long turn
(3-4 minutes)
3 Part 3
Discussion
(4-5 minutes)
! Using the two prompts: 1) Interest and 2) Parties in turn, carry out Part 2 and Part 3 as you would normally do in an IELTS Speaking Test
Table 3: Speaking test structure and instructions for the examiner
4.2.3 Audio-rating of the speaking performance Non-live marking was conducted using audio-recordings of the test-takers’ performances. Since this study compares scores awarded on Part 2 and Part 3 separately, if examiners had assessed students’ performances on Part 2 and on Part 3 during the same live session, the scores awarded on one part might have influenced those on the other part.
Fumiyo Nakatsuhara
IELTS Research Reports Volume 12 © www.ielts.org 10
Therefore, in order to obtain more valid scores for each student on each test part, the audio-recordings were edited to separate the students’ performances on Part 2 from those on Part 3, and a mixture of separate Part 2 and Part 3 recordings from different test-takers were given to the examiners.
Each audio-recording was independently marked by two of the four examiners. The ratings followed a rating matrix to have all four raters overlap with one another, so that the FACETS program could calibrate speaking scores that take account of rater harshness levels.
The examiners were also asked to write down briefly why they awarded the scores that they did on each analytical category. This was thought to be useful when interpreting the score and interactional data. Compared with the verbal report methodology which has been employed in a number of recent speaking test studies into examiners’ scoring process (eg, Brown et al, 2005; Brown, 2006b; May, 2009), a written description is likely to be less informative. However, considering the focus of this study, which was mainly on students’ performance in the two parts of the test, it was decided to ask the examiners to provide brief notes on reasons for awarding each score.
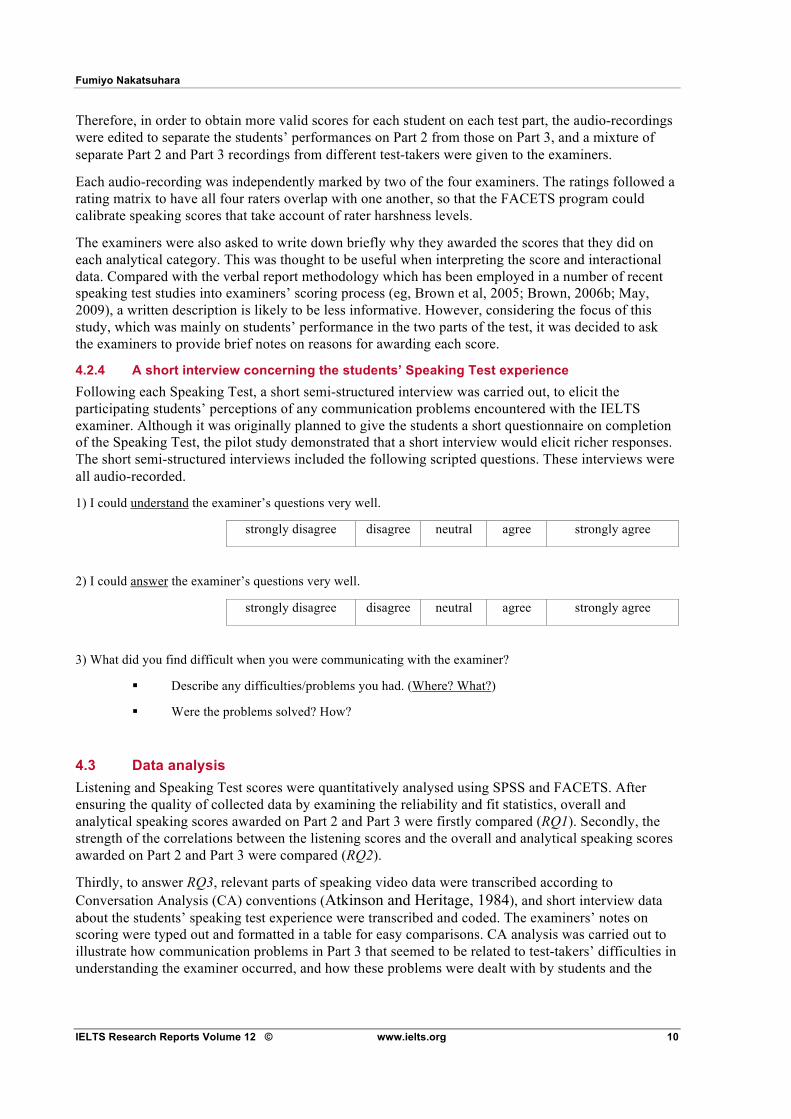
4.2.4 A short interview concerning the students’ Speaking Test experience Following each Speaking Test, a short semi-structured interview was carried out, to elicit the participating students’ perceptions of any communication problems encountered with the IELTS examiner. Although it was originally planned to give the students a short questionnaire on completion of the Speaking Test, the pilot study demonstrated that a short interview would elicit richer responses. The short semi-structured interviews included the following scripted questions. These interviews were all audio-recorded.
1) I could understand the examiner’s questions very well.
strongly disagree disagree neutral agree strongly agree
2) I could answer the examiner’s questions very well.
strongly disagree disagree neutral agree strongly agree
3) What did you find difficult when you were communicating with the examiner?
! Describe any difficulties/problems you had. (Where? What?)
! Were the problems solved? How?
4.3 Data analysis Listening and Speaking Test scores were quantitatively analysed using SPSS and FACETS. After ensuring the quality of collected data by examining the reliability and fit statistics, overall and analytical speaking scores awarded on Part 2 and Part 3 were firstly compared (RQ1). Secondly, the strength of the correlations between the listening scores and the overall and analytical speaking scores awarded on Part 2 and Part 3 were compared (RQ2).
Thirdly, to answer RQ3, relevant parts of speaking video data were transcribed according to Conversation Analysis (CA) conventions (Atkinson and Heritage, 1984), and short interview data about the students’ speaking test experience were transcribed and coded. The examiners’ notes on scoring were typed out and formatted in a table for easy comparisons. CA analysis was carried out to illustrate how communication problems in Part 3 that seemed to be related to test-takers’ difficulties in understanding the examiner occurred, and how these problems were dealt with by students and the
The relationship between test-takers’ listening proficiency and their performance on the IELTS Speaking Test
IELTS Research Reports Volume 12 © www.ielts.org 11
examiners. A list of the transcription notations is provided in Appendix 3. Although detailed features of repair sequences have already been identified by Seedhouse and Egbert (2006), the present study has a slightly different perspective as it aims to identify sequences that involve listening-related communication problems which do not necessarily result in repairs. This study also aims at providing deeper insight into the interactional features including visual information (eg, eye gaze and other forms of non-verbal communication), using video-recorded data.
Furthermore, to suggest a possible level boundary that differentiates the degree/types of communication problems related to test-takers’ listening proficiency on Part 3 speaking performance, the Speaking Test transcripts and the coded interview data were qualitatively analysed. The qualitative data did not lend itself to statistical analysis due to the limited sample size and the limited number of communication breakdowns that it contained. However, it was hoped that the qualitative analyses of the Speaking Test performance and short interview data could serve to suggest a possible boundary in IELTS Speaking Band scores that differentiates the degree/types of impact of listening proficiency.
5 RESULTS AND DISCUSSION
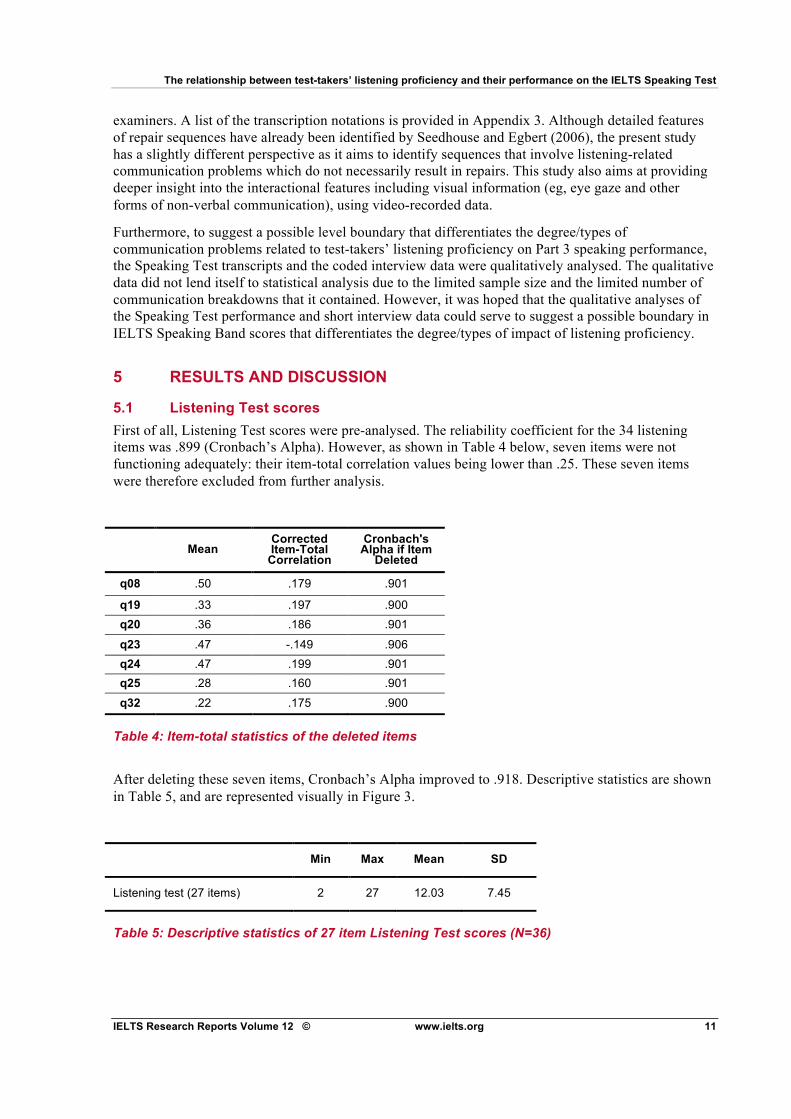
5.1 Listening Test scores First of all, Listening Test scores were pre-analysed. The reliability coefficient for the 34 listening items was .899 (Cronbach’s Alpha). However, as shown in Table 4 below, seven items were not functioning adequately: their item-total correlation values being lower than .25. These seven items were therefore excluded from further analysis.
Mean Corrected Item-Total
Correlation
Cronbach's Alpha if Item
Deleted
q08 .50 .179 .901
q19 .33 .197 .900 q20 .36 .186 .901
q23 .47 -.149 .906 q24 .47 .199 .901 q25 .28 .160 .901
q32 .22 .175 .900
Table 4: Item-total statistics of the deleted items
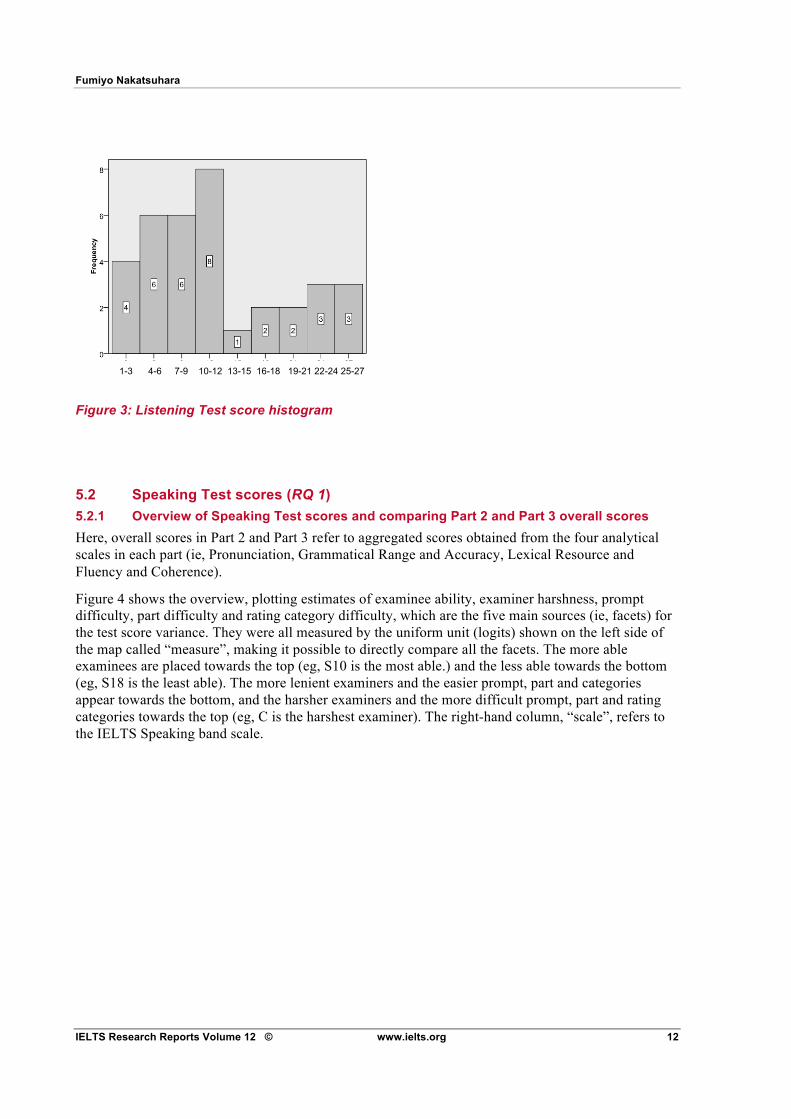
After deleting these seven items, Cronbach’s Alpha improved to .918. Descriptive statistics are shown in Table 5, and are represented visually in Figure 3.
Min Max Mean SD
Listening test (27 items) 2 27 12.03 7.45
Table 5: Descriptive statistics of 27 item Listening Test scores (N=36)
Fumiyo Nakatsuhara
IELTS Research Reports Volume 12 © www.ielts.org 12
Figure 3: Listening Test score histogram
5.2 Speaking Test scores (RQ 1) 5.2.1 Overview of Speaking Test scores and comparing Part 2 and Part 3 overall scores Here, overall scores in Part 2 and Part 3 refer to aggregated scores obtained from the four analytical scales in each part (ie, Pronunciation, Grammatical Range and Accuracy, Lexical Resource and Fluency and Coherence).
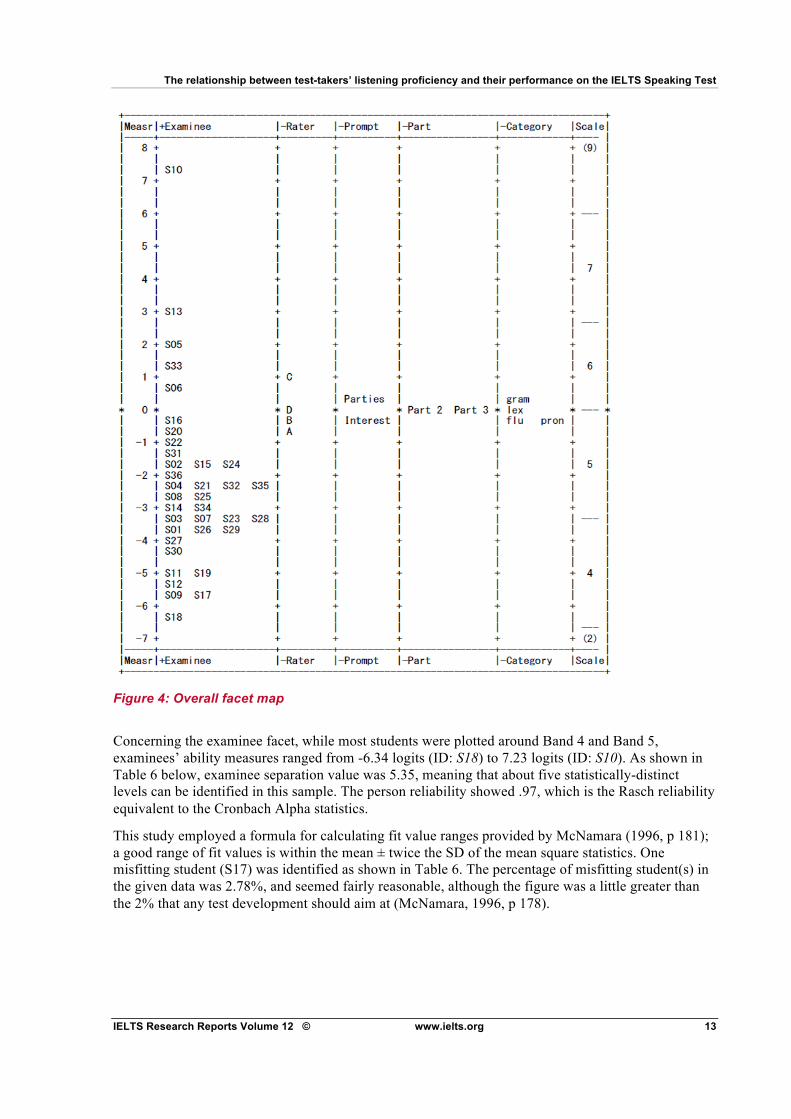
Figure 4 shows the overview, plotting estimates of examinee ability, examiner harshness, prompt difficulty, part difficulty and rating category difficulty, which are the five main sources (ie, facets) for the test score variance. They were all measured by the uniform unit (logits) shown on the left side of the map called “measure”, making it possible to directly compare all the facets. The more able examinees are placed towards the top (eg, S10 is the most able.) and the less able towards the bottom (eg, S18 is the least able). The more lenient examiners and the easier prompt, part and categories appear towards the bottom, and the harsher examiners and the more difficult prompt, part and rating categories towards the top (eg, C is the harshest examiner). The right-hand column, “scale”, refers to the IELTS Speaking band scale.
1-3 4-6 7-9 10-12 13-15 16-18 19-21 22-24 25-27
Listening test (27 items)
The relationship between test-takers’ listening proficiency and their performance on the IELTS Speaking Test
IELTS Research Reports Volume 12 © www.ielts.org 13
Figure 4: Overall facet map
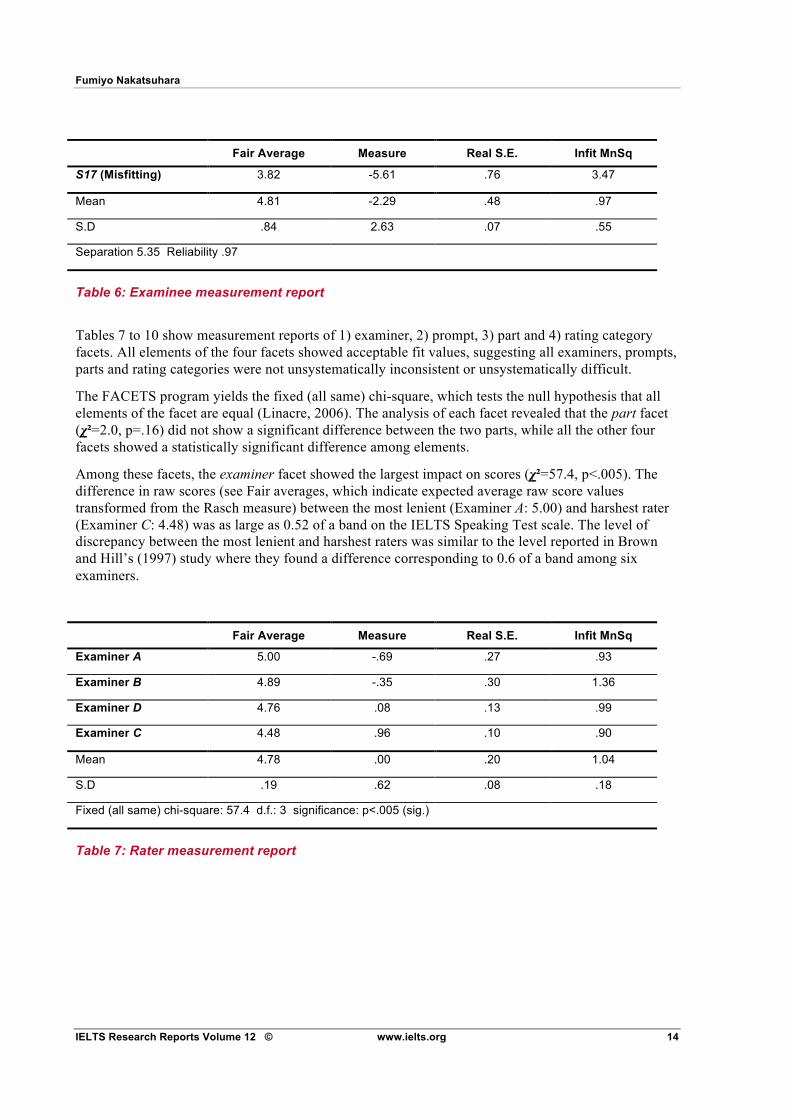
Concerning the examinee facet, while most students were plotted around Band 4 and Band 5, examinees’ ability measures ranged from -6.34 logits (ID: S18) to 7.23 logits (ID: S10). As shown in Table 6 below, examinee separation value was 5.35, meaning that about five statistically-distinct levels can be identified in this sample. The person reliability showed .97, which is the Rasch reliability equivalent to the Cronbach Alpha statistics.
This study employed a formula for calculating fit value ranges provided by McNamara (1996, p 181); a good range of fit values is within the mean ± twice the SD of the mean square statistics. One misfitting student (S17) was identified as shown in Table 6. The percentage of misfitting student(s) in the given data was 2.78%, and seemed fairly reasonable, although the figure was a little greater than the 2% that any test development should aim at (McNamara, 1996, p 178).
Fumiyo Nakatsuhara
IELTS Research Reports Volume 12 © www.ielts.org 14
Fair Average Measure Real S.E. Infit MnSq
S17 (Misfitting) 3.82 -5.61 .76 3.47
Mean 4.81 -2.29 .48 .97
S.D .84 2.63 .07 .55
Separation 5.35 Reliability .97
Table 6: Examinee measurement report
Tables 7 to 10 show measurement reports of 1) examiner, 2) prompt, 3) part and 4) rating category facets. All elements of the four facets showed acceptable fit values, suggesting all examiners, prompts, parts and rating categories were not unsystematically inconsistent or unsystematically difficult.
The FACETS program yields the fixed (all same) chi-square, which tests the null hypothesis that all elements of the facet are equal (Linacre, 2006). The analysis of each facet revealed that the part facet (!!=2.0, p=.16) did not show a significant difference between the two parts, while all the other four facets showed a statistically significant difference among elements.
Among these facets, the examiner facet showed the largest impact on scores (!!=57.4, p<.005). The difference in raw scores (see Fair averages, which indicate expected average raw score values transformed from the Rasch measure) between the most lenient (Examiner A: 5.00) and harshest rater (Examiner C: 4.48) was as large as 0.52 of a band on the IELTS Speaking Test scale. The level of discrepancy between the most lenient and harshest raters was similar to the level reported in Brown and Hill’s (1997) study where they found a difference corresponding to 0.6 of a band among six examiners.
Fair Average Measure Real S.E. Infit MnSq
Examiner A 5.00 -.69 .27 .93
Examiner B 4.89 -.35 .30 1.36
Examiner D 4.76 .08 .13 .99
Examiner C 4.48 .96 .10 .90
Mean 4.78 .00 .20 1.04
S.D .19 .62 .08 .18
Fixed (all same) chi-square: 57.4 d.f.: 3 significance: p<.005 (sig.)
Table 7: Rater measurement report
The relationship between test-takers’ listening proficiency and their performance on the IELTS Speaking Test
IELTS Research Reports Volume 12 © www.ielts.org 15
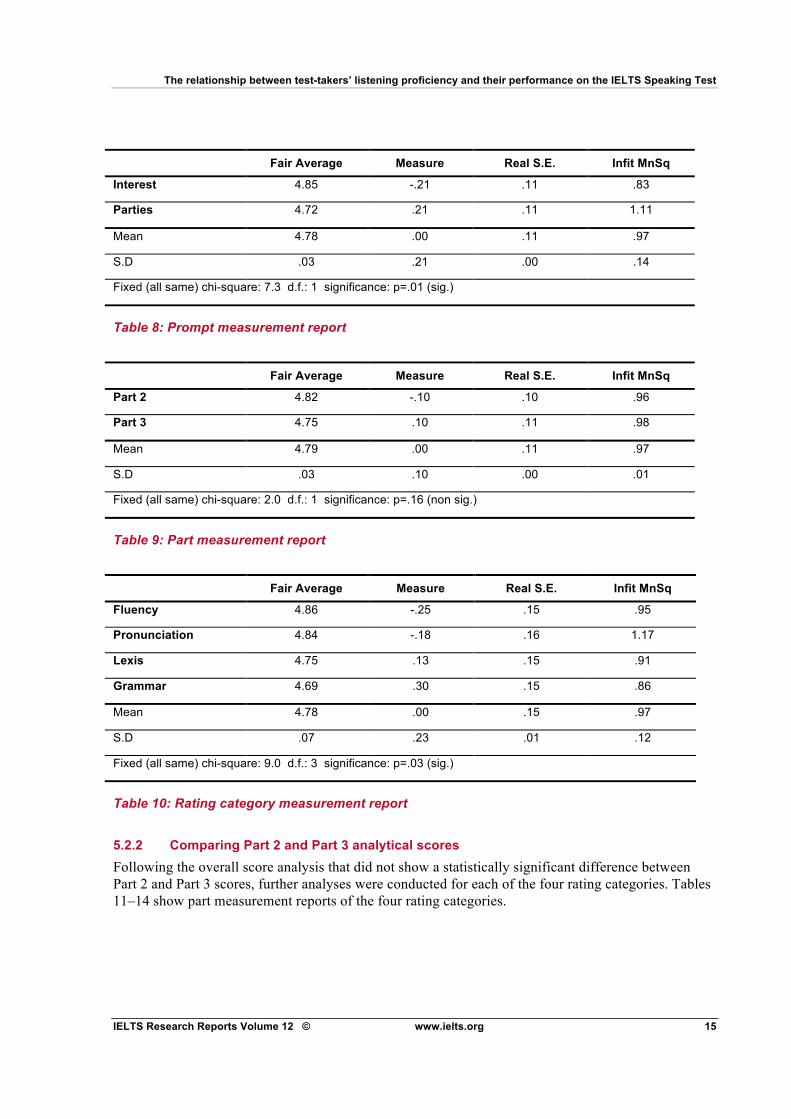
Fair Average Measure Real S.E. Infit MnSq
Interest 4.85 -.21 .11 .83
Parties 4.72 .21 .11 1.11
Mean 4.78 .00 .11 .97
S.D .03 .21 .00 .14
Fixed (all same) chi-square: 7.3 d.f.: 1 significance: p=.01 (sig.)
Table 8: Prompt measurement report
Fair Average Measure Real S.E. Infit MnSq
Part 2 4.82 -.10 .10 .96
Part 3 4.75 .10 .11 .98
Mean 4.79 .00 .11 .97
S.D .03 .10 .00 .01
Fixed (all same) chi-square: 2.0 d.f.: 1 significance: p=.16 (non sig.)
Table 9: Part measurement report
Fair Average Measure Real S.E. Infit MnSq
Fluency 4.86 -.25 .15 .95
Pronunciation 4.84 -.18 .16 1.17
Lexis 4.75 .13 .15 .91
Grammar 4.69 .30 .15 .86
Mean 4.78 .00 .15 .97
S.D .07 .23 .01 .12
Fixed (all same) chi-square: 9.0 d.f.: 3 significance: p=.03 (sig.)
Table 10: Rating category measurement report
5.2.2 Comparing Part 2 and Part 3 analytical scores Following the overall score analysis that did not show a statistically significant difference between Part 2 and Part 3 scores, further analyses were conducted for each of the four rating categories. Tables 11–14 show part measurement reports of the four rating categories.
Fumiyo Nakatsuhara
IELTS Research Reports Volume 12 © www.ielts.org 16
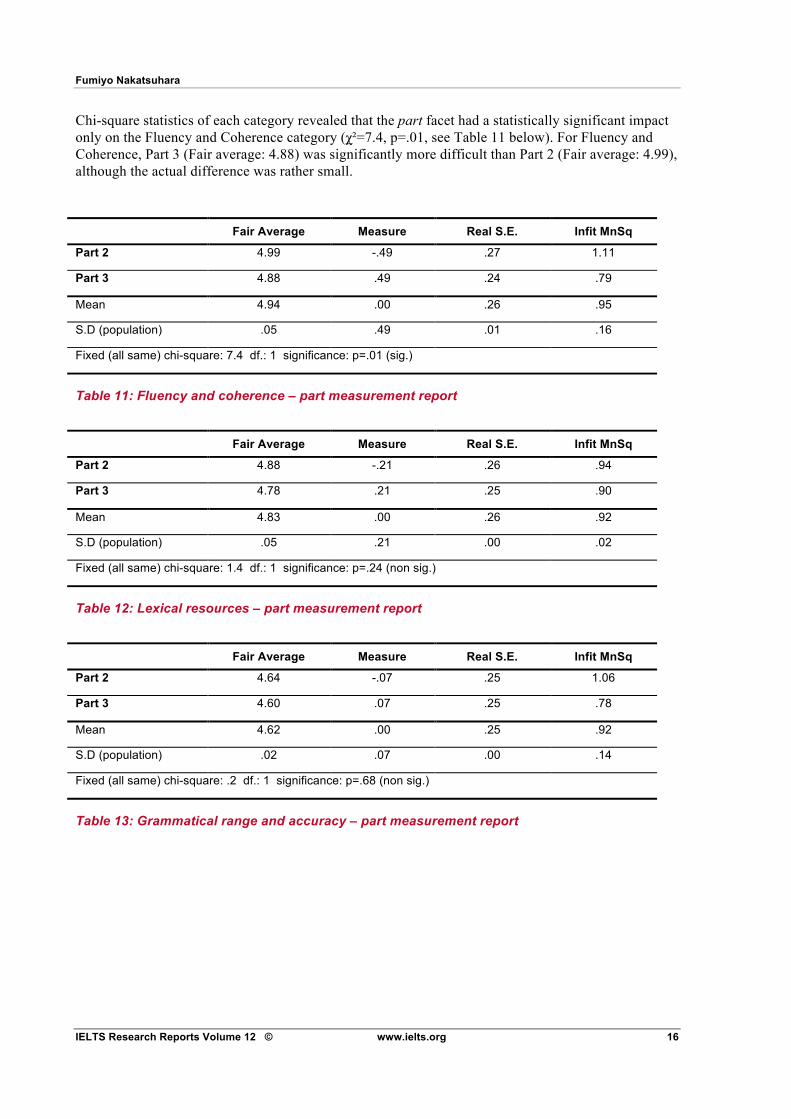
Chi-square statistics of each category revealed that the part facet had a statistically significant impact only on the Fluency and Coherence category ("#=7.4, p=.01, see Table 11 below). For Fluency and Coherence, Part 3 (Fair average: 4.88) was significantly more difficult than Part 2 (Fair average: 4.99), although the actual difference was rather small.
Fair Average Measure Real S.E. Infit MnSq
Part 2 4.99 -.49 .27 1.11
Part 3 4.88 .49 .24 .79
Mean 4.94 .00 .26 .95
S.D (population) .05 .49 .01 .16
Fixed (all same) chi-square: 7.4 df.: 1 significance: p=.01 (sig.)
Table 11: Fluency and coherence – part measurement report
Fair Average Measure Real S.E. Infit MnSq
Part 2 4.88 -.21 .26 .94
Part 3 4.78 .21 .25 .90
Mean 4.83 .00 .26 .92
S.D (population) .05 .21 .00 .02
Fixed (all same) chi-square: 1.4 df.: 1 significance: p=.24 (non sig.)
Table 12: Lexical resources – part measurement report
Fair Average Measure Real S.E. Infit MnSq
Part 2 4.64 -.07 .25 1.06
Part 3 4.60 .07 .25 .78
Mean 4.62 .00 .25 .92
S.D (population) .02 .07 .00 .14
Fixed (all same) chi-square: .2 df.: 1 significance: p=.68 (non sig.)
Table 13: Grammatical range and accuracy – part measurement report

The relationship between test-takers’ listening proficiency and their performance on the IELTS Speaking Test
IELTS Research Reports Volume 12 © www.ielts.org 17
Fair Average Measure Real S.E. Infit MnSq
Part 3 4.78 -.19 .23 .87
Part 2 4.69 .19 .24 1.06
Mean 4.74 .00 .24 .96
S.D (population) .05 .19 .00 .09
Fixed (all same) chi-square: 1.2 df.: 1 significance: p=.27 (non sig.)
Table 14: Pronunciation – part measurement report
5.3 Relationship between Listening and Speaking scores (RQ2) Having examined the Listening and Speaking scores separately in 5.1 and 5.2, the correlations between the Listening and the Speaking scores (both overall and analytical scores) were investigated.
For the Listening Test scores, 27 items selected in section 5.1 were used. For the Speaking Test scores, fair average scores produced by the FACETS program were used, as fair average scores are adjusted ratings in a standardised environment in which all other elements interacting with the Speaking Test scores have the mean measure of all elements in their facets, for example, adjusting raw ratings for lenient and harsh examiners (Linacre, 2006).
As indicated in Tables 5 and 15 and Figures 3, 5 and 6, neither Listening scores nor Speaking fair average scores were normally distributed. Therefore, non-parametric correlation coefficients (Spearman’s rho) were used in the following correlation analyses.
Mean SD Min Max Skewness Kurtosis
Overall 4.92 .84 3.69 7.73 1.38 2.59
Fluency and coherence 5.01 .87 3.58 7.64 .85 1.27
Lexical resource 4.90 .88 3.35 7.85 .99 2.19
Grammatical range & accuracy 4.80 .91 3.76 7.76 1.62 2.55
Part 2
Pronunciation 4.90 .99 3.33 7.89 1.13 1.47
Overall 4.71 .98 2.75 8.08 1.23 3.41
Fluency and coherence 4.69 1.05 2.00 8.00 .62 2.88
Lexical resource 4.69 1.02 2.85 8.00 .81 1.91
Grammatical range & accuracy 4.69 1.02 2.85 8.00 .81 1.91
Part 3
Pronunciation 4.77 1.00 3.06 8.41 1.77 4.75
Table 15: Descriptive statistics of Speaking fair average scores (N=36)
Fumiyo Nakatsuhara
IELTS Research Reports Volume 12 © www.ielts.org 18
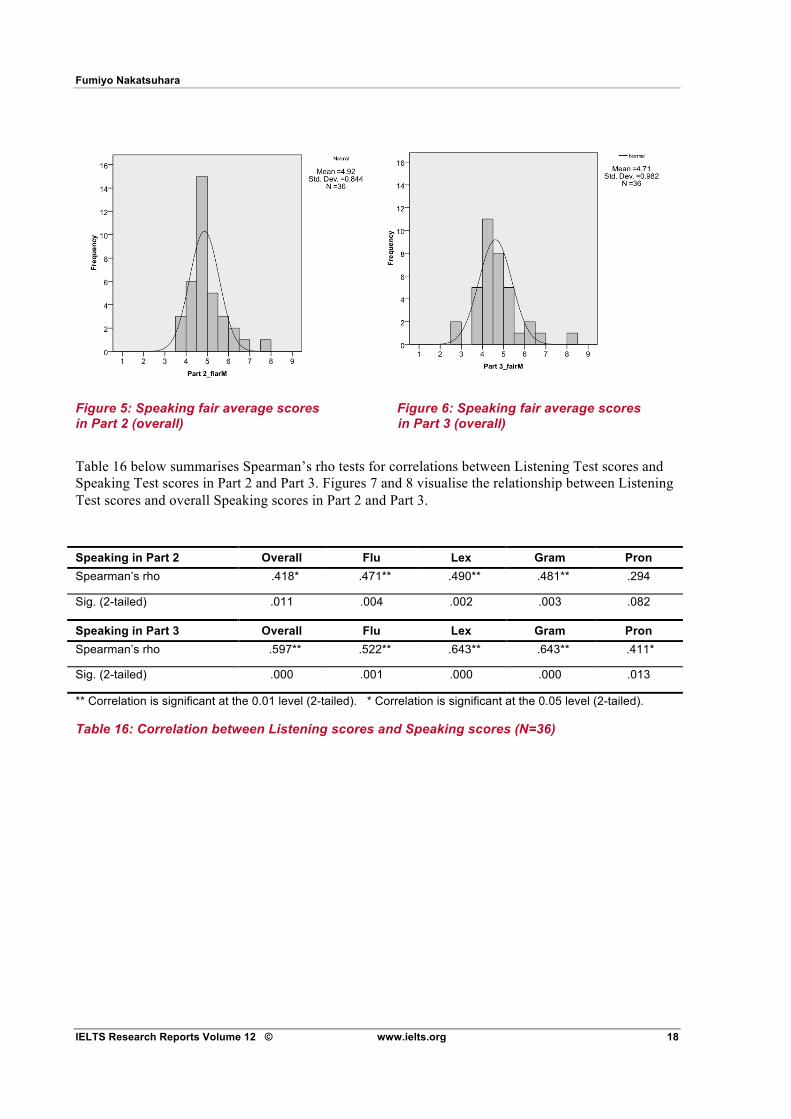
Figure 5: Speaking fair average scores Figure 6: Speaking fair average scores in Part 2 (overall) in Part 3 (overall)
Table 16 below summarises Spearman’s rho tests for correlations between Listening Test scores and Speaking Test scores in Part 2 and Part 3. Figures 7 and 8 visualise the relationship between Listening Test scores and overall Speaking scores in Part 2 and Part 3.
Speaking in Part 2 Overall Flu Lex Gram Pron Spearman’s rho .418* .471** .490** .481** .294
Sig. (2-tailed) .011 .004 .002 .003 .082
Speaking in Part 3 Overall Flu Lex Gram Pron Spearman’s rho .597** .522** .643** .643** .411*
Sig. (2-tailed) .000 .001 .000 .000 .013
** Correlation is significant at the 0.01 level (2-tailed). * Correlation is significant at the 0.05 level (2-tailed).
Table 16: Correlation between Listening scores and Speaking scores (N=36)

The relationship between test-takers’ listening proficiency and their performance on the IELTS Speaking Test
IELTS Research Reports Volume 12 © www.ielts.org 19
Figure 7: Listening Test scores and Figure 8: Listening Test scores and Speaking Test scores in Part 2 (overall) Speaking Test scores in Part 3 (overall)
There are three main findings related to the second research question of this study; that is, the relationships between Listening and Speaking Test scores. Firstly, except for the pronunciation scores in Part 2, scores in all categories showed statistically significant correlations with Listening scores at the .05 or the .01 level. The correlation coefficient values ranged from .411 to .643, and, therefore, the strength of correlations were medium to large, according to Cohen’s (1998) definition (small: $=±.10 to $=±.29, medium: $=±.30 to $=±.49, large: $=±.50 to $=±1.0). One might find it surprising that Part 2 of the Speaking Test, which does not involve any listening, had some significant, medium-strength correlations with Listening scores. This finding, however, is not unexpected, considering its consistency with the current multi-componential view of language ability in the literature; language ability being accounted for by both underlying general trait and local skill-specific factors (eg, Bachman et al, 1995; Shin, 2005; Sawaki et al, 2009).
Secondly, it was interesting that throughout all rating categories, stronger correlations with listening scores were observed for Speaking scores in Part 3 than those in Part 2. While most correlations in Part 2 showed medium strength ($=.294 to $=.490), most correlations in Part 3 showed large strength ($=.411 to $=.643). The statistical significance in the differences in the rho between Parts 2 and 3 was tested, using the Hotelling-Williams test (Howell, 2002, p281). Although the sample size of the present study was rather small (N=36), p values of the correlational differences in Overall and Lexical Resource scores approached significance (Overall: t(33)=-1.604, p=.059 ; Lexical Resource: t(33)=-1.543, p=.066). This finding suggests that it is worth examining the interactional data qualitatively for a possible impact of test-takers’ listening proficiency on their performance on Part 3, and that further investigations with a larger sample size should be undertaken to confirm the statistical significance of the differences.
Thirdly, for both Part 2 and Part 3, Lexical Resource and Grammatical Range and Accuracy scores showed the strongest correlation with listening scores, followed by Fluency and Coherence. Pronunciation had the weakest correlation. This finding is in accordance with previous studies that showed lexico-grammatical elements usually contribute to a significant amount of the total variance in
Fumiyo Nakatsuhara
IELTS Research Reports Volume 12 © www.ielts.org 20
test-takers’ scores on skills-based tests (eg, Geranpayeh, 2007; Green, 2007; Hawkey, 2009; Joyce, 2008; Shiotsu & Weir, 2007; Weir, 1983). For example, based on his Structural Equation Modelling (SEM) analyses of two large sets of CAE test-takers’ scores on all five papers, Geranpayeh (2007) demonstrated that the Use of English paper correlated with the other four papers better than any of the other papers did, and the correlation with the Listening paper was especially high (.805 in one of the analyses). Joyce (2007) also found that, based on his SEM study taking syntactic knowledge, vocabulary breadth, phonological knowledge, phonological awareness, sentence stress awareness, metacognitive strategy use, working memory and the overlap between these different sub-skills into account, syntactic knowledge was the strongest and most consistent predictor of L2 listening comprehension. However, we also need to bear in mind that even if syntactic knowledge is the best predictor of the L2 listening test scores, it does not necessarily mean that syntactic knowledge holds the key to listening, since parsing (ie, the phase of listening that involves syntactic analysis) is critically dependent upon earlier decoding at phoneme and word levels as well as on working memory capacity and the ability to retain words in L2 in mind.
5.4 Communication problems related to test-takers’ limited listening proficiency (RQ3)
Conversation Analysis of the Part 3 Speaking interactions identified 22 instances of communication problems by 17 test-takers that seemed to be associated with their difficulties in understanding the examiner. The communication problems identified here are limited to those involving obvious troubles in hearing or understanding on the part of the test-takers. Thus, the instances do not include test-takers’ hesitations that were not clear whether they were caused by speaking problems (eg, searching for ideas and language) or listening problems (eg, taking some time to retrieve the meaning of words in the examiner’s questions).
The listening-related communication problems varied in terms of how the problems occurred and how they were dealt with by test-takers and the examiner; they could be categorised into the following five patterns.
a) A test-taker asked the examiner to repeat or to rephrase a question, and after the question was repeated or rephrased, he/she responded to the question relevantly.
b) A test-taker asked the examiner to repeat or to rephrase a question, and after the question was repeated or rephrased, he/she responded irrelevantly to the question.
c) A test-taker misunderstood a question and 1) responded very irrelevantly to the question or 2) gave a somewhat related but mostly irrelevant response.
d) A test-taker echoed a part that he/she did not understand to signal his/her comprehension difficulty, sometimes with notable facial expressions or gestures.
e) A test-taker answered “no” to a question he/she did not understand.
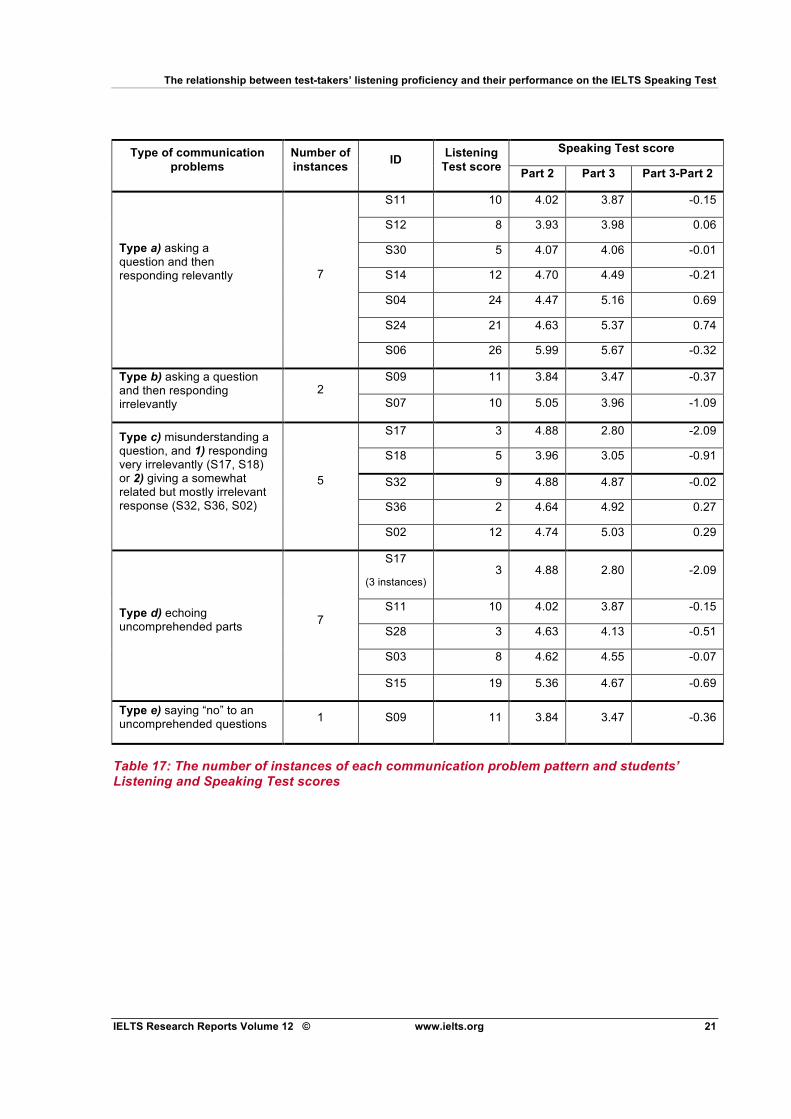
Table 17 summarises the number of instances categorised into the five communication problem patterns, Listening Test scores and overall Speaking scores on Part 2 and Part 3 of those students who encountered the problems, and differences between Part 3 and Part 2 scores. In this table, test-takers are ordered according to their Part 3 scores in each communication problem pattern. For a complete list of all test-takers’ listening scores and analytical speaking scores, see Appendix 2.
The relationship between test-takers’ listening proficiency and their performance on the IELTS Speaking Test
IELTS Research Reports Volume 12 © www.ielts.org 21
Speaking Test score Type of communication problems
Number of instances ID Listening
Test score Part 2 Part 3 Part 3-Part 2
S11 10 4.02 3.87 -0.15
S12 8 3.93 3.98 0.06
S30 5 4.07 4.06 -0.01
S14 12 4.70 4.49 -0.21
S04 24 4.47 5.16 0.69
S24 21 4.63 5.37 0.74
Type a) asking a question and then responding relevantly
7
S06 26 5.99 5.67 -0.32
S09 11 3.84 3.47 -0.37 Type b) asking a question and then responding irrelevantly
2 S07 10 5.05 3.96 -1.09
S17 3 4.88 2.80 -2.09
S18 5 3.96 3.05 -0.91
S32 9 4.88 4.87 -0.02
S36 2 4.64 4.92 0.27
Type c) misunderstanding a question, and 1) responding very irrelevantly (S17, S18) or 2) giving a somewhat related but mostly irrelevant response (S32, S36, S02)
5
S02 12 4.74 5.03 0.29
S17
(3 instances) 3 4.88 2.80 -2.09
S11 10 4.02 3.87 -0.15
S28 3 4.63 4.13 -0.51
S03 8 4.62 4.55 -0.07
Type d) echoing uncomprehended parts 7
S15 19 5.36 4.67 -0.69
Type e) saying “no” to an uncomprehended questions 1 S09 11 3.84 3.47 -0.36
Table 17: The number of instances of each communication problem pattern and students’ Listening and Speaking Test scores
Fumiyo Nakatsuhara
IELTS Research Reports Volume 12 © www.ielts.org 22
Table 17 illustrates that a certain type of listening-related communication problems could be associated with a certain level of listening and speaking proficiency. For example, among the 17 test-takers who encountered listening-related communication problems, S06, S24 and S04 who scored the highest both in the Listening Test and Part 3 of the Speaking Test, all had Type a) problems. Test-takers who encountered Type a) problems also seemed to get Part 3 scores either similar to their Part 2 scores or, in some cases, higher than their Part 2 scores. It is also important to note that except for the three students who encountered Type a) problems, all others scored 5.0 or below in Part 3 of the test, indicating that 5.0 could be a possible level boundary where the degree of impact of test-takers’ listening proficiency changes.
To gain further insights into the relationship between types of listening-related communication problems in Part 3 and the scores awarded by examiners, this section describes each of the five patterns with excerpts from a few test-takers, together with their Listening scores and analytical Speaking Test scores awarded on Part 2 and Part 3. The descriptions are also elaborated on, wherever possible, by some data obtained from: 1) short semi-structured interviews with the students regarding their perceptions of any communication problems encountered with the examiner in Part 3; and 2) examiners’ comments on awarding the scores that they did. Findings of the semi-structured interviews will be again summarised in section 5.5.
a) A test-taker asked the examiner to repeat or to rephrase a question, and after the question was repeated or rephrased, he/she responded to the question relevantly
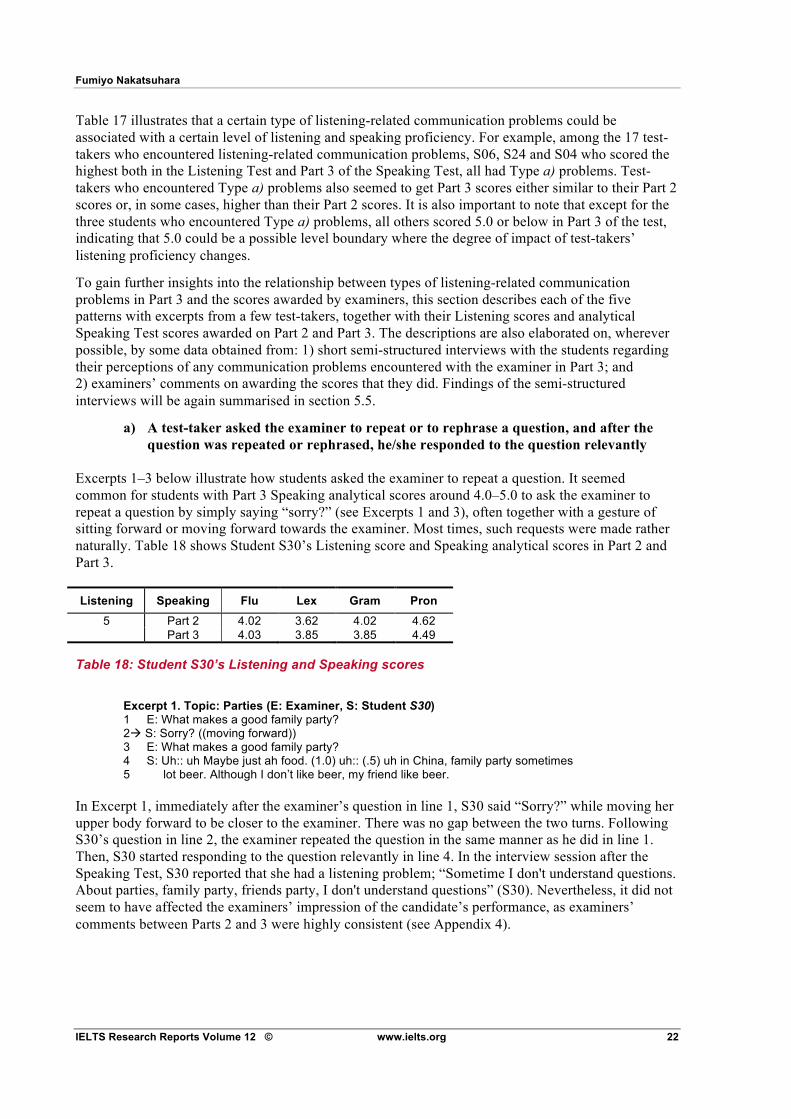
Excerpts 1–3 below illustrate how students asked the examiner to repeat a question. It seemed common for students with Part 3 Speaking analytical scores around 4.0–5.0 to ask the examiner to repeat a question by simply saying “sorry?” (see Excerpts 1 and 3), often together with a gesture of sitting forward or moving forward towards the examiner. Most times, such requests were made rather naturally. Table 18 shows Student S30’s Listening score and Speaking analytical scores in Part 2 and Part 3. Listening Speaking Flu Lex Gram Pron
5 Part 2 4.02 3.62 4.02 4.62 Part 3 4.03 3.85 3.85 4.49
Table 18: Student S30’s Listening and Speaking scores
Excerpt 1. Topic: Parties (E: Examiner, S: Student S30) 1 E: What makes a good family party? 2" S: Sorry? ((moving forward)) 3 E: What makes a good family party? 4 S: Uh:: uh Maybe just ah food. (1.0) uh:: (.5) uh in China, family party sometimes 5 lot beer. Although I don’t like beer, my friend like beer.
In Excerpt 1, immediately after the examiner’s question in line 1, S30 said “Sorry?” while moving her upper body forward to be closer to the examiner. There was no gap between the two turns. Following S30’s question in line 2, the examiner repeated the question in the same manner as he did in line 1. Then, S30 started responding to the question relevantly in line 4. In the interview session after the Speaking Test, S30 reported that she had a listening problem; “Sometime I don't understand questions. About parties, family party, friends party, I don't understand questions” (S30). Nevertheless, it did not seem to have affected the examiners’ impression of the candidate’s performance, as examiners’ comments between Parts 2 and 3 were highly consistent (see Appendix 4).
The relationship between test-takers’ listening proficiency and their performance on the IELTS Speaking Test
IELTS Research Reports Volume 12 © www.ielts.org 23
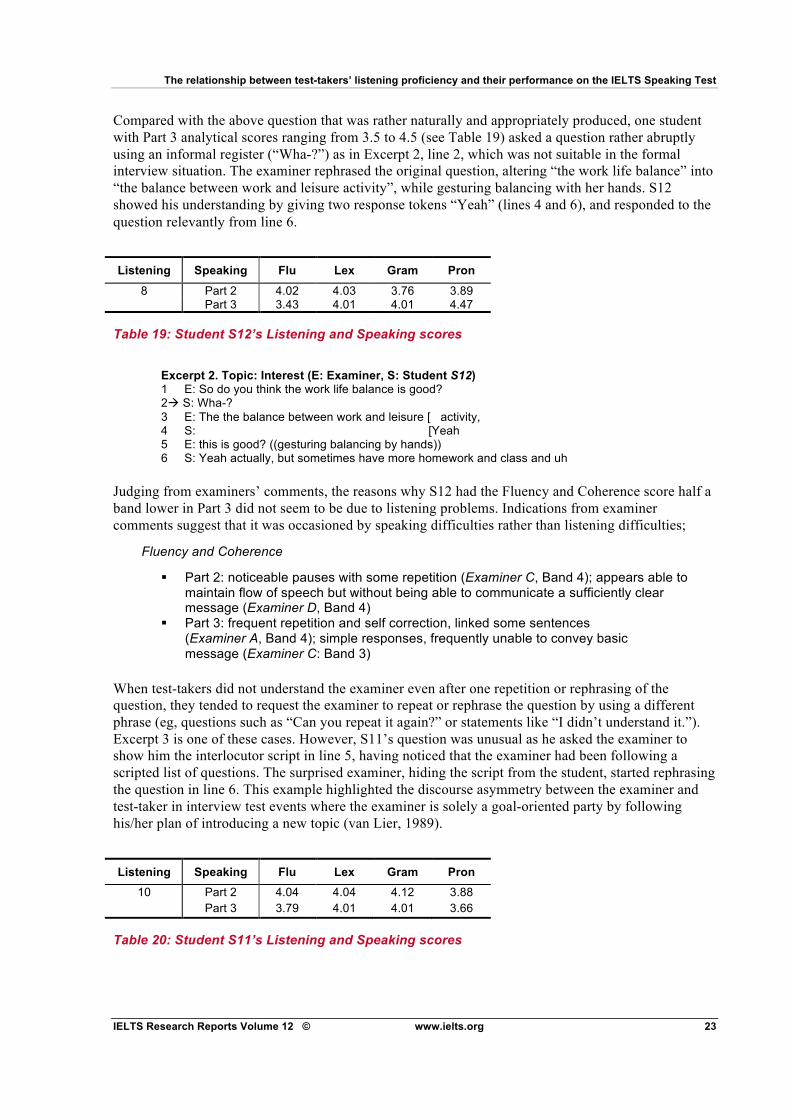
Compared with the above question that was rather naturally and appropriately produced, one student with Part 3 analytical scores ranging from 3.5 to 4.5 (see Table 19) asked a question rather abruptly using an informal register (“Wha-?”) as in Excerpt 2, line 2, which was not suitable in the formal interview situation. The examiner rephrased the original question, altering “the work life balance” into “the balance between work and leisure activity”, while gesturing balancing with her hands. S12 showed his understanding by giving two response tokens “Yeah” (lines 4 and 6), and responded to the question relevantly from line 6.
Listening Speaking Flu Lex Gram Pron
8 Part 2 4.02 4.03 3.76 3.89 Part 3 3.43 4.01 4.01 4.47
Table 19: Student S12’s Listening and Speaking scores
Excerpt 2. Topic: Interest (E: Examiner, S: Student S12) 1 E: So do you think the work life balance is good? 2" S: Wha-? 3 E: The the balance between work and leisure [ activity, 4 S: [Yeah 5 E: this is good? ((gesturing balancing by hands)) 6 S: Yeah actually, but sometimes have more homework and class and uh
!Judging from examiners’ comments, the reasons why S12 had the Fluency and Coherence score half a band lower in Part 3 did not seem to be due to listening problems. Indications from examiner comments suggest that it was occasioned by speaking difficulties rather than listening difficulties;
Fluency and Coherence
! Part 2: noticeable pauses with some repetition (Examiner C, Band 4); appears able to maintain flow of speech but without being able to communicate a sufficiently clear message (Examiner D, Band 4)
! Part 3: frequent repetition and self correction, linked some sentences (Examiner A, Band 4); simple responses, frequently unable to convey basic message (Examiner C: Band 3)
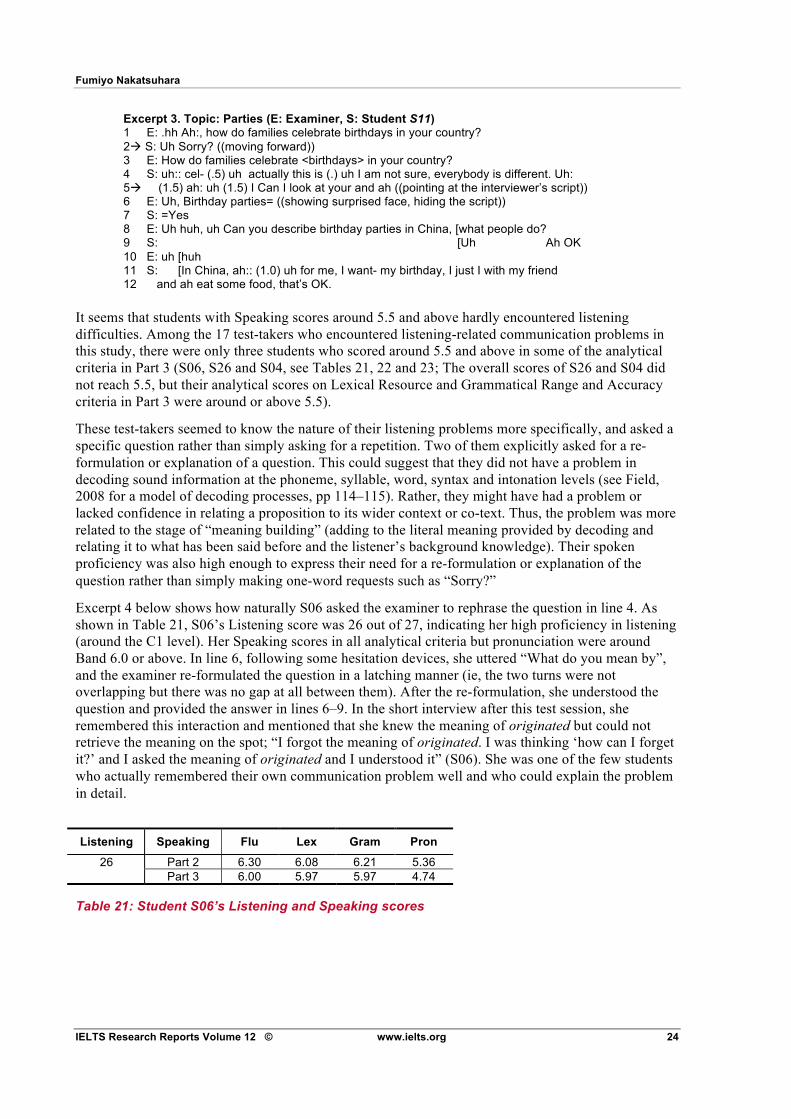
When test-takers did not understand the examiner even after one repetition or rephrasing of the question, they tended to request the examiner to repeat or rephrase the question by using a different phrase (eg, questions such as “Can you repeat it again?” or statements like “I didn’t understand it.”). Excerpt 3 is one of these cases. However, S11’s question was unusual as he asked the examiner to show him the interlocutor script in line 5, having noticed that the examiner had been following a scripted list of questions. The surprised examiner, hiding the script from the student, started rephrasing the question in line 6. This example highlighted the discourse asymmetry between the examiner and test-taker in interview test events where the examiner is solely a goal-oriented party by following his/her plan of introducing a new topic (van Lier, 1989).
Listening Speaking Flu Lex Gram Pron
10 Part 2 4.04 4.04 4.12 3.88 Part 3 3.79 4.01 4.01 3.66
Table 20: Student S11’s Listening and Speaking scores
Fumiyo Nakatsuhara
IELTS Research Reports Volume 12 © www.ielts.org 24
Excerpt 3. Topic: Parties (E: Examiner, S: Student S11) 1 E: .hh Ah:, how do families celebrate birthdays in your country? 2" S: Uh Sorry? ((moving forward)) 3 E: How do families celebrate <birthdays> in your country? 4 S: uh:: cel- (.5) uh actually this is (.) uh I am not sure, everybody is different. Uh: 5" (1.5) ah: uh (1.5) I Can I look at your and ah ((pointing at the interviewer’s script)) 6 E: Uh, Birthday parties= ((showing surprised face, hiding the script)) 7 S: =Yes 8 E: Uh huh, uh Can you describe birthday parties in China, [what people do? 9 S: [Uh Ah OK 10 E: uh [huh 11 S: [In China, ah:: (1.0) uh for me, I want- my birthday, I just I with my friend 12 and ah eat some food, that’s OK.
!It seems that students with Speaking scores around 5.5 and above hardly encountered listening difficulties. Among the 17 test-takers who encountered listening-related communication problems in this study, there were only three students who scored around 5.5 and above in some of the analytical criteria in Part 3 (S06, S26 and S04, see Tables 21, 22 and 23; The overall scores of S26 and S04 did not reach 5.5, but their analytical scores on Lexical Resource and Grammatical Range and Accuracy criteria in Part 3 were around or above 5.5).
These test-takers seemed to know the nature of their listening problems more specifically, and asked a specific question rather than simply asking for a repetition. Two of them explicitly asked for a re-formulation or explanation of a question. This could suggest that they did not have a problem in decoding sound information at the phoneme, syllable, word, syntax and intonation levels (see Field, 2008 for a model of decoding processes, pp 114–115). Rather, they might have had a problem or lacked confidence in relating a proposition to its wider context or co-text. Thus, the problem was more related to the stage of “meaning building” (adding to the literal meaning provided by decoding and relating it to what has been said before and the listener’s background knowledge). Their spoken proficiency was also high enough to express their need for a re-formulation or explanation of the question rather than simply making one-word requests such as “Sorry?”
Excerpt 4 below shows how naturally S06 asked the examiner to rephrase the question in line 4. As shown in Table 21, S06’s Listening score was 26 out of 27, indicating her high proficiency in listening (around the C1 level). Her Speaking scores in all analytical criteria but pronunciation were around Band 6.0 or above. In line 6, following some hesitation devices, she uttered “What do you mean by”, and the examiner re-formulated the question in a latching manner (ie, the two turns were not overlapping but there was no gap at all between them). After the re-formulation, she understood the question and provided the answer in lines 6–9. In the short interview after this test session, she remembered this interaction and mentioned that she knew the meaning of originated but could not retrieve the meaning on the spot; “I forgot the meaning of originated. I was thinking ‘how can I forget it?’ and I asked the meaning of originated and I understood it” (S06). She was one of the few students who actually remembered their own communication problem well and who could explain the problem in detail.
Listening Speaking Flu Lex Gram Pron
26 Part 2 6.30 6.08 6.21 5.36 Part 3 6.00 5.97 5.97 4.74
Table 21: Student S06’s Listening and Speaking scores

The relationship between test-takers’ listening proficiency and their performance on the IELTS Speaking Test
IELTS Research Reports Volume 12 © www.ielts.org 25
Excerpt 4. Topic: Parties (E: Examiner, S: Student S06)! ! ! ! 1 E: Is this a national cerebration?= 2 S: = a- Yeah 3 E: Uh, How do you think it’s originated? 4" S: (.5) Uh:: (.5) what do you mean by= 5 E: = How do you think it’s started? 6 S: Start, uh >( )< international places and people came here for investment or to 7 find a job, and they want places to get themselves together, 8 E: Uh huh 9 S: to maybe uh enjoy, to find relax places for them. !
Excerpt 5 is another example of asking the examiner to re-formulate a question. S24 scored 21 in the Listening Test and his analytical Speaking scores in Part 3 were around Band 5.5. While the examiner repeated the same question rather than rephrasing it as requested, S24 immediately got the meaning as shown his latching utterance in responding to the question in line 4. In the following interview session, he mentioned that he did not find understanding the examiner difficult at all. This could mean that he perhaps did not have any decoding difficulty, but instead he might have been taking some time in processing the meaning in the specific context.
Listening Speaking Flu Lex Gram Pron
21 Part 2 4.77 4.86 4.67 4.22 Part 3 4.81 5.83 5.83 5.00
Table 22: Student S24’s Listening and Speaking scores
Excerpt 5. Topic: Parties (E: Examiner, S: Student S24) 1 E: So what what needs to be planned when you are organising a formal party? 2" S: What do you mean, to be [planned? 3 E: [What needs to be planned?= 4" S: =Ah:: firstly uh time, venue, venue the(h)re ((scratching his head)) ah places 5 places, and uh:: hhh (1.0) and you should consider the: the: budget
!The other test-taker, S04, who scored a little lower than the above two test-takers, seemed to have just missed hearing a word, “celebrations”. In Excerpt 6 below, S04 prolonged the final vowel of the preceding word “family::” to invite the examiner to repeat the following word in line 2. Immediately after the examiner repeated the word, she responded to the question overlapping to the examiner’s utterance.
Listening Speaking Flu Lex gram pron
24 Part 2 4.82 4.87 4.12 4.06 Part 3 5.00 5.44 5.44 4.74
Table 23: Student S04’s Listening and Speaking scores
Excerpt 6. Topic: Parties (E: Examiner, S: Student S04) 1 E: Have ah family celebrations changed in your lifetime? 2" S: (1.0) family::= ((puzzled face, moving forward)) 3 E: =celebrations a[h 4 S: [ah: I guess it didn’t very, ah it didn’t ah change 5 ah (.) much. This huh (.5) Usually, ah du- you celebrate it with 6 your relatives and family members.
!
Fumiyo Nakatsuhara
IELTS Research Reports Volume 12 © www.ielts.org 26
In the short interview session, although S04 did not exactly remember any particular communication problems, she reported, “I had to listen to her, her accent carefully and when I couldn't understand, I asked her to repeat it again”. This could explain this instance.
In general, examiners’ comments on these candidates who encountered Type a) problem tended to be consistent between Part 2 and Part 3, and these comments did not seem to reflect listening problems.
b) A test-taker asked the examiner to repeat or to rephrase a question, and after the
question was repeated or rephrased, he/she responded irrelevantly to the question Some test-takers asked the examiner to repeat or to rephrase a question, and after the question was repeated, he/she misunderstood the question and responded irrelevantly to the question. Two of such communication problems were observed as described in Excerpts 7 and 8. In the interview session, both S07 and S09 reported that they encountered difficulties in understanding the examiner due to unknown vocabulary.
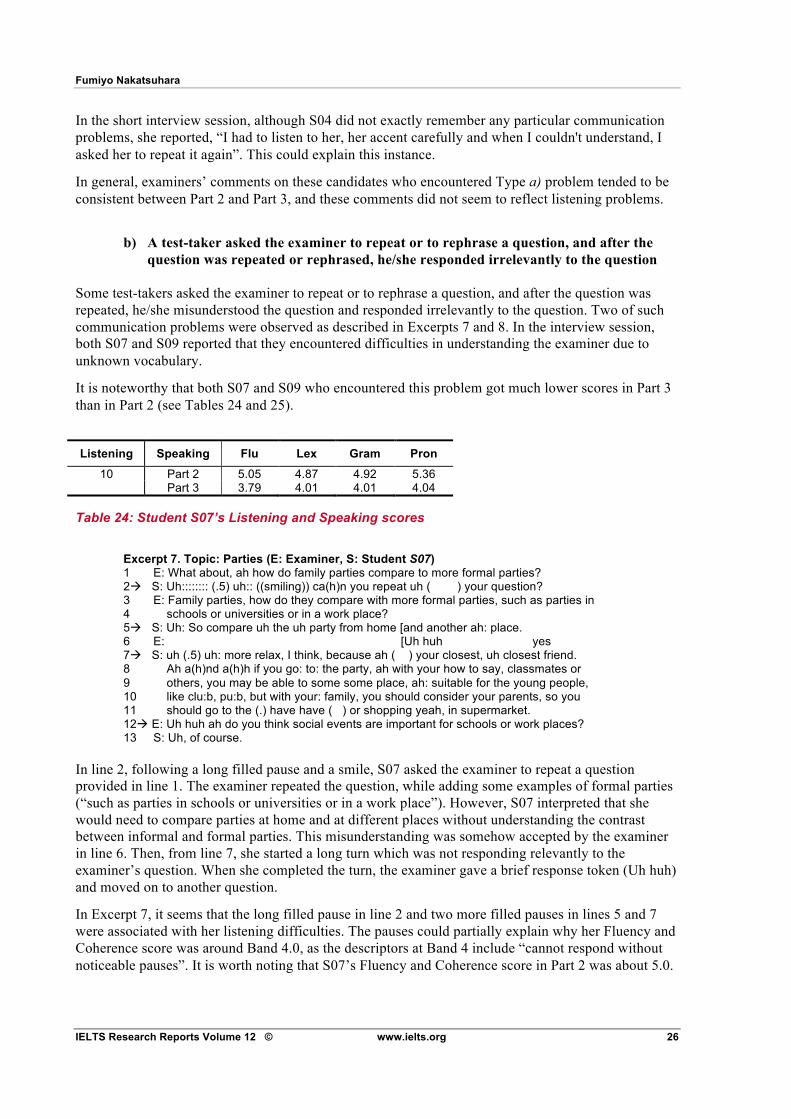
It is noteworthy that both S07 and S09 who encountered this problem got much lower scores in Part 3 than in Part 2 (see Tables 24 and 25).
Listening Speaking Flu Lex Gram Pron
10 Part 2 5.05 4.87 4.92 5.36 Part 3 3.79 4.01 4.01 4.04
Table 24: Student S07’s Listening and Speaking scores
Excerpt 7. Topic: Parties (E: Examiner, S: Student S07) 1 E: What about, ah how do family parties compare to more formal parties? 2" S: Uh:::::::: (.5) uh:: ((smiling)) ca(h)n you repeat uh ( ) your question? 3 E: Family parties, how do they compare with more formal parties, such as parties in 4 schools or universities or in a work place? 5" S: Uh: So compare uh the uh party from home [and another ah: place. 6 E: [Uh huh yes 7" S: uh (.5) uh: more relax, I think, because ah ( ) your closest, uh closest friend. 8 Ah a(h)nd a(h)h if you go: to: the party, ah with your how to say, classmates or 9 others, you may be able to some some place, ah: suitable for the young people, 10 like clu:b, pu:b, but with your: family, you should consider your parents, so you 11 should go to the (.) have have ( ) or shopping yeah, in supermarket. 12" E: Uh huh ah do you think social events are important for schools or work places? 13 S: Uh, of course.
In line 2, following a long filled pause and a smile, S07 asked the examiner to repeat a question provided in line 1. The examiner repeated the question, while adding some examples of formal parties (“such as parties in schools or universities or in a work place”). However, S07 interpreted that she would need to compare parties at home and at different places without understanding the contrast between informal and formal parties. This misunderstanding was somehow accepted by the examiner in line 6. Then, from line 7, she started a long turn which was not responding relevantly to the examiner’s question. When she completed the turn, the examiner gave a brief response token (Uh huh) and moved on to another question.
In Excerpt 7, it seems that the long filled pause in line 2 and two more filled pauses in lines 5 and 7 were associated with her listening difficulties. The pauses could partially explain why her Fluency and Coherence score was around Band 4.0, as the descriptors at Band 4 include “cannot respond without noticeable pauses”. It is worth noting that S07’s Fluency and Coherence score in Part 2 was about 5.0.
The relationship between test-takers’ listening proficiency and their performance on the IELTS Speaking Test
IELTS Research Reports Volume 12 © www.ielts.org 27
This speculation seems to be supported by examiners’ comments, as their comments on S07’s Fluency and Coherence in Part 3 included “cannot speak without noticeable pauses”, while they thought that S07 was able to “maintain flow of speech” with “some hesitation” in Part 2 (see Appendix 4). Hence, this part of the descriptor seems particularly related to the fluency construct in Part 3, which involves a role for listening proficiency. Such discrepancy in the fluency construct between Part 2 and Part 3 might account for Brown’s (2006b) finding that the examiners found the interpretation of the Fluency and Coherence scale the most difficult among the four analytical scales.
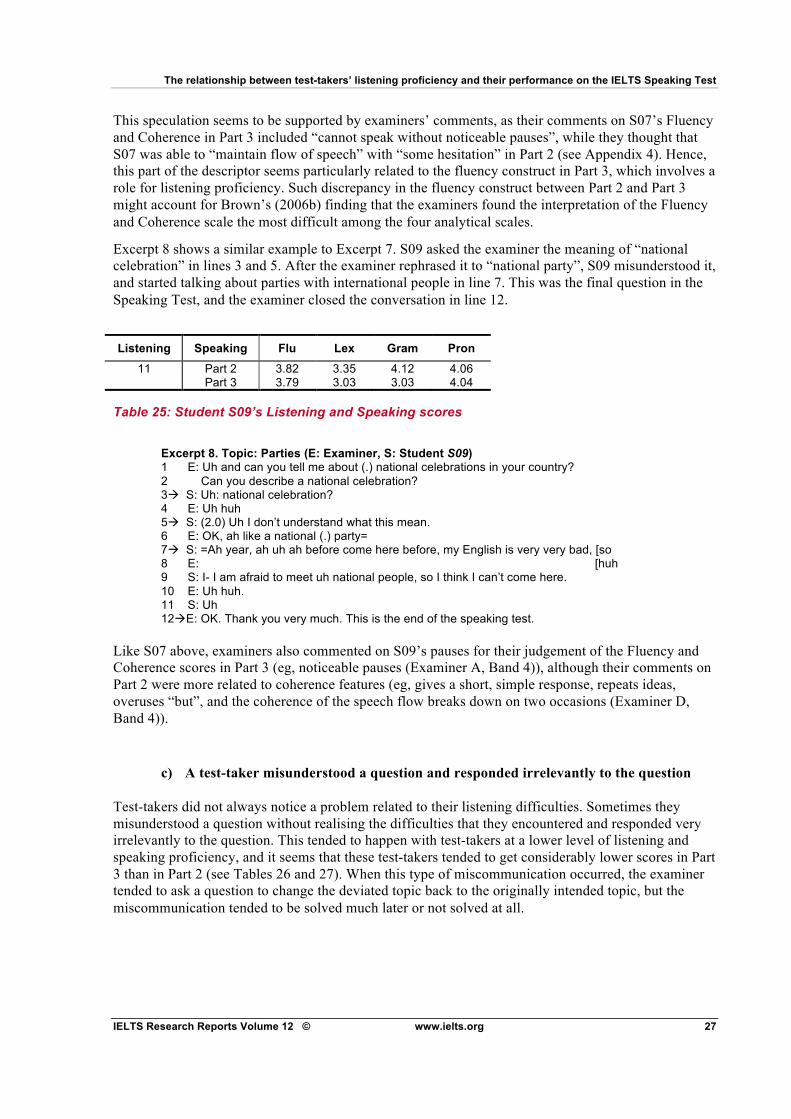
Excerpt 8 shows a similar example to Excerpt 7. S09 asked the examiner the meaning of “national celebration” in lines 3 and 5. After the examiner rephrased it to “national party”, S09 misunderstood it, and started talking about parties with international people in line 7. This was the final question in the Speaking Test, and the examiner closed the conversation in line 12.
Listening Speaking Flu Lex Gram Pron
11 Part 2 3.82 3.35 4.12 4.06 Part 3 3.79 3.03 3.03 4.04
Table 25: Student S09’s Listening and Speaking scores
Excerpt 8. Topic: Parties (E: Examiner, S: Student S09) 1 E: Uh and can you tell me about (.) national celebrations in your country? 2 Can you describe a national celebration? 3" S: Uh: national celebration? 4 E: Uh huh 5" S: (2.0) Uh I don’t understand what this mean. 6 E: OK, ah like a national (.) party= 7" S: =Ah year, ah uh ah before come here before, my English is very very bad, [so 8 E: [huh 9 S: I- I am afraid to meet uh national people, so I think I can’t come here. 10 E: Uh huh. 11 S: Uh 12"E: OK. Thank you very much. This is the end of the speaking test.
Like S07 above, examiners also commented on S09’s pauses for their judgement of the Fluency and Coherence scores in Part 3 (eg, noticeable pauses (Examiner A, Band 4)), although their comments on Part 2 were more related to coherence features (eg, gives a short, simple response, repeats ideas, overuses “but”, and the coherence of the speech flow breaks down on two occasions (Examiner D, Band 4)).
c) A test-taker misunderstood a question and responded irrelevantly to the question Test-takers did not always notice a problem related to their listening difficulties. Sometimes they misunderstood a question without realising the difficulties that they encountered and responded very irrelevantly to the question. This tended to happen with test-takers at a lower level of listening and speaking proficiency, and it seems that these test-takers tended to get considerably lower scores in Part 3 than in Part 2 (see Tables 26 and 27). When this type of miscommunication occurred, the examiner tended to ask a question to change the deviated topic back to the originally intended topic, but the miscommunication tended to be solved much later or not solved at all.
Fumiyo Nakatsuhara
IELTS Research Reports Volume 12 © www.ielts.org 28
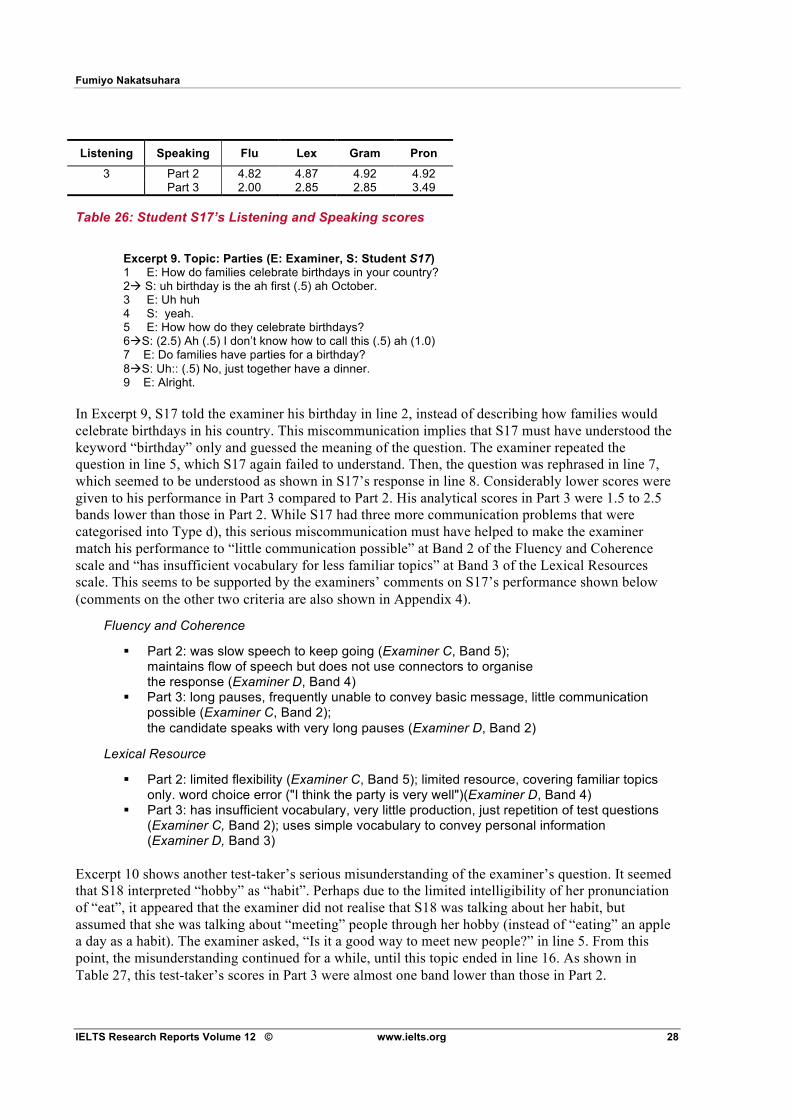
Listening Speaking Flu Lex Gram Pron 3 Part 2 4.82 4.87 4.92 4.92 Part 3 2.00 2.85 2.85 3.49
Table 26: Student S17’s Listening and Speaking scores
Excerpt 9. Topic: Parties (E: Examiner, S: Student S17) 1 E: How do families celebrate birthdays in your country? 2" S: uh birthday is the ah first (.5) ah October. 3 E: Uh huh 4 S: yeah. 5 E: How how do they celebrate birthdays? 6"S: (2.5) Ah (.5) I don’t know how to call this (.5) ah (1.0) 7 E: Do families have parties for a birthday? 8"S: Uh:: (.5) No, just together have a dinner. 9 E: Alright.
In Excerpt 9, S17 told the examiner his birthday in line 2, instead of describing how families would celebrate birthdays in his country. This miscommunication implies that S17 must have understood the keyword “birthday” only and guessed the meaning of the question. The examiner repeated the question in line 5, which S17 again failed to understand. Then, the question was rephrased in line 7, which seemed to be understood as shown in S17’s response in line 8. Considerably lower scores were given to his performance in Part 3 compared to Part 2. His analytical scores in Part 3 were 1.5 to 2.5 bands lower than those in Part 2. While S17 had three more communication problems that were categorised into Type d), this serious miscommunication must have helped to make the examiner match his performance to “little communication possible” at Band 2 of the Fluency and Coherence scale and “has insufficient vocabulary for less familiar topics” at Band 3 of the Lexical Resources scale. This seems to be supported by the examiners’ comments on S17’s performance shown below (comments on the other two criteria are also shown in Appendix 4).
Fluency and Coherence
! Part 2: was slow speech to keep going (Examiner C, Band 5); maintains flow of speech but does not use connectors to organise the response (Examiner D, Band 4)
! Part 3: long pauses, frequently unable to convey basic message, little communication possible (Examiner C, Band 2); the candidate speaks with very long pauses (Examiner D, Band 2)
Lexical Resource
! Part 2: limited flexibility (Examiner C, Band 5); limited resource, covering familiar topics only. word choice error ("I think the party is very well")(Examiner D, Band 4)
! Part 3: has insufficient vocabulary, very little production, just repetition of test questions (Examiner C, Band 2); uses simple vocabulary to convey personal information (Examiner D, Band 3)
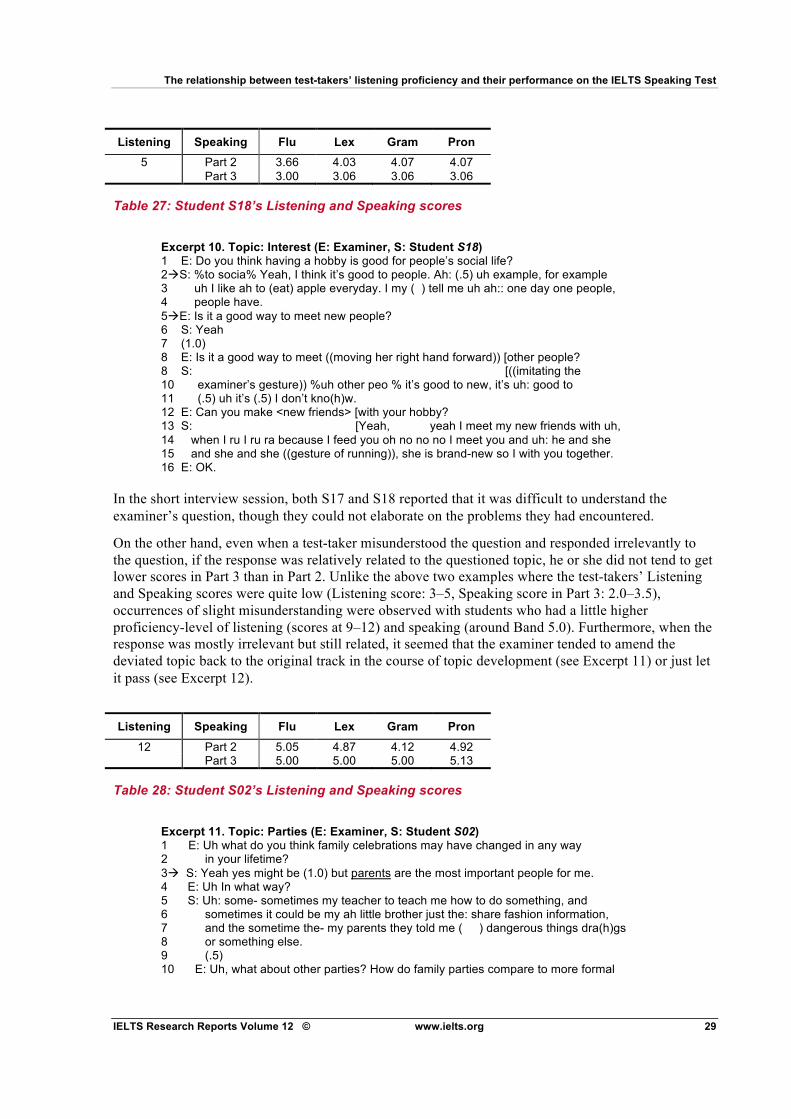
Excerpt 10 shows another test-taker’s serious misunderstanding of the examiner’s question. It seemed that S18 interpreted “hobby” as “habit”. Perhaps due to the limited intelligibility of her pronunciation of “eat”, it appeared that the examiner did not realise that S18 was talking about her habit, but assumed that she was talking about “meeting” people through her hobby (instead of “eating” an apple a day as a habit). The examiner asked, “Is it a good way to meet new people?” in line 5. From this point, the misunderstanding continued for a while, until this topic ended in line 16. As shown in Table 27, this test-taker’s scores in Part 3 were almost one band lower than those in Part 2.
The relationship between test-takers’ listening proficiency and their performance on the IELTS Speaking Test
IELTS Research Reports Volume 12 © www.ielts.org 29
Listening Speaking Flu Lex Gram Pron
5 Part 2 3.66 4.03 4.07 4.07 Part 3 3.00 3.06 3.06 3.06
Table 27: Student S18’s Listening and Speaking scores
Excerpt 10. Topic: Interest (E: Examiner, S: Student S18) 1 E: Do you think having a hobby is good for people’s social life? 2"S: %to socia% Yeah, I think it’s good to people. Ah: (.5) uh example, for example 3 uh I like ah to (eat) apple everyday. I my ( ) tell me uh ah:: one day one people, 4 people have. 5"E: Is it a good way to meet new people? 6 S: Yeah 7 (1.0) 8 E: Is it a good way to meet ((moving her right hand forward)) [other people? 8 S: [((imitating the 10 examiner’s gesture)) %uh other peo % it’s good to new, it’s uh: good to 11 (.5) uh it’s (.5) I don’t kno(h)w. 12 E: Can you make <new friends> [with your hobby? 13 S: [Yeah, yeah I meet my new friends with uh, 14 when I ru I ru ra because I feed you oh no no no I meet you and uh: he and she 15 and she and she ((gesture of running)), she is brand-new so I with you together. 16 E: OK.
In the short interview session, both S17 and S18 reported that it was difficult to understand the examiner’s question, though they could not elaborate on the problems they had encountered.
On the other hand, even when a test-taker misunderstood the question and responded irrelevantly to the question, if the response was relatively related to the questioned topic, he or she did not tend to get lower scores in Part 3 than in Part 2. Unlike the above two examples where the test-takers’ Listening and Speaking scores were quite low (Listening score: 3–5, Speaking score in Part 3: 2.0–3.5), occurrences of slight misunderstanding were observed with students who had a little higher proficiency-level of listening (scores at 9–12) and speaking (around Band 5.0). Furthermore, when the response was mostly irrelevant but still related, it seemed that the examiner tended to amend the deviated topic back to the original track in the course of topic development (see Excerpt 11) or just let it pass (see Excerpt 12).
Listening Speaking Flu Lex Gram Pron
12 Part 2 5.05 4.87 4.12 4.92 Part 3 5.00 5.00 5.00 5.13
Table 28: Student S02’s Listening and Speaking scores
Excerpt 11. Topic: Parties (E: Examiner, S: Student S02) 1 E: Uh what do you think family celebrations may have changed in any way 2 in your lifetime? 3" S: Yeah yes might be (1.0) but parents are the most important people for me. 4 E: Uh In what way? 5 S: Uh: some- sometimes my teacher to teach me how to do something, and 6 sometimes it could be my ah little brother just the: share fashion information, 7 and the sometime the- my parents they told me ( ) dangerous things dra(h)gs 8 or something else. 9 (.5) 10 E: Uh, what about other parties? How do family parties compare to more formal
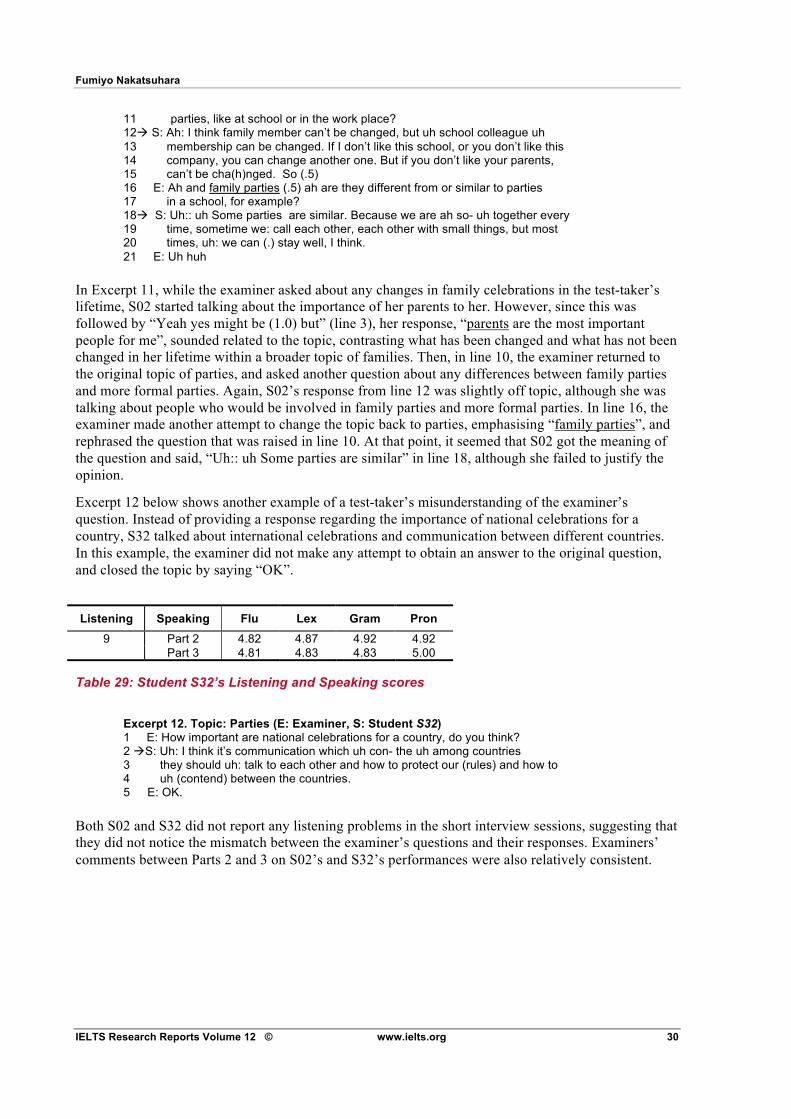
Fumiyo Nakatsuhara
IELTS Research Reports Volume 12 © www.ielts.org 30
11 parties, like at school or in the work place? 12" S: Ah: I think family member can’t be changed, but uh school colleague uh 13 membership can be changed. If I don’t like this school, or you don’t like this 14 company, you can change another one. But if you don’t like your parents, 15 can’t be cha(h)nged. So (.5) 16 E: Ah and family parties (.5) ah are they different from or similar to parties 17 in a school, for example? 18" S: Uh:: uh Some parties are similar. Because we are ah so- uh together every 19 time, sometime we: call each other, each other with small things, but most 20 times, uh: we can (.) stay well, I think. 21 E: Uh huh
!In Excerpt 11, while the examiner asked about any changes in family celebrations in the test-taker’s lifetime, S02 started talking about the importance of her parents to her. However, since this was followed by “Yeah yes might be (1.0) but” (line 3), her response, “parents are the most important people for me”, sounded related to the topic, contrasting what has been changed and what has not been changed in her lifetime within a broader topic of families. Then, in line 10, the examiner returned to the original topic of parties, and asked another question about any differences between family parties and more formal parties. Again, S02’s response from line 12 was slightly off topic, although she was talking about people who would be involved in family parties and more formal parties. In line 16, the examiner made another attempt to change the topic back to parties, emphasising “family parties”, and rephrased the question that was raised in line 10. At that point, it seemed that S02 got the meaning of the question and said, “Uh:: uh Some parties are similar” in line 18, although she failed to justify the opinion.
Excerpt 12 below shows another example of a test-taker’s misunderstanding of the examiner’s question. Instead of providing a response regarding the importance of national celebrations for a country, S32 talked about international celebrations and communication between different countries. In this example, the examiner did not make any attempt to obtain an answer to the original question, and closed the topic by saying “OK”.
Listening Speaking Flu Lex Gram Pron
9 Part 2 4.82 4.87 4.92 4.92 Part 3 4.81 4.83 4.83 5.00
Table 29: Student S32’s Listening and Speaking scores
Excerpt 12. Topic: Parties (E: Examiner, S: Student S32) 1 E: How important are national celebrations for a country, do you think? 2 "S: Uh: I think it’s communication which uh con- the uh among countries 3 they should uh: talk to each other and how to protect our (rules) and how to 4 uh (contend) between the countries. 5 E: OK.
!Both S02 and S32 did not report any listening problems in the short interview sessions, suggesting that they did not notice the mismatch between the examiner’s questions and their responses. Examiners’ comments between Parts 2 and 3 on S02’s and S32’s performances were also relatively consistent.

The relationship between test-takers’ listening proficiency and their performance on the IELTS Speaking Test
IELTS Research Reports Volume 12 © www.ielts.org 31
d) A test-taker echoed a part that he/she did not understand to signal his/her
comprehension difficulty, sometimes with notable facial expressions or gestures Test-takers’ listening problems were also signalled without an explicit question to repeat or rephrase a question. Some test-takers simply echoed the part that they did not understand. This was often accompanied by notable facial expressions or gestures. This echoing strategy was utilised by test-takers with Listening scores from 3 to 10 and Speaking scores from 2.0 to 4.5.
As shown in Excerpts 13 and 14, some test-takers utilised such echoing as the first question, followed by an explicit request to repeat the question, which confirmed that they echoed to signal their problems in understanding the examiner.
Listening Speaking Flu Lex Gram Pron
8 Part 2 4.65 4.83 4.07 4.94 Part 3 4.32 4.43 4.43 5.03
Table 30: Student S03’s Listening and Speaking scores
Excerpt 13. Topic: Interest (E: Examiner, S: Student S03) 1 E: Do you think they will get more free time? 2" S: Uh: (.5) I think, uh %more free time% ((unfocused eyes, stroking his chin)) 3 E: Will they, will they get more free time? 4 (.5) 5 S: uh I don’t understand your questi(h)on. ((stroking his chin)) 6 E: Do you think in the future, the job people do, ah will be uh will take up a lot 7 of their time, or they will work less and have more free time? 8 S: (.5)Yes, I I think that people work less and you can more free time to relax,
9 but (.) but they have no mon-, only a little money. !In Excerpt 13, after the examiner’s question in line 1, S03 murmured “%more free time%” with his eyes unfocused and while stroking his chin, which triggered the examiner to repeat the question. Looking at the discourse only by this point, it may not be certain if the murmur was indicating a listening-related difficulty (ie, this might also be signalling a problem in generating an idea to answer the question). However, after half a second of silence, he explicitly stated that he did not understand the question, again while stroking his chin, indicating that the echoing was actually signalling his difficulty in understanding the question.
The following example is similar to Excerpt 14. S11 echoed “changed” in line 2 while pinching his cheek. Following the utterance and gesture, the examiner rephrased the question in line 3. Then, S11 made an explicit request for the examiner to repeat the question, indicating that the echoing was signalling his comprehension problem.
Listening Speaking Flu Lex Gram Pron
10 Part 2 4.04 4.04 4.12 3.88 Part 3 3.79 4.01 4.01 3.66
Table 31: Student S11’s Listening and Speaking scores
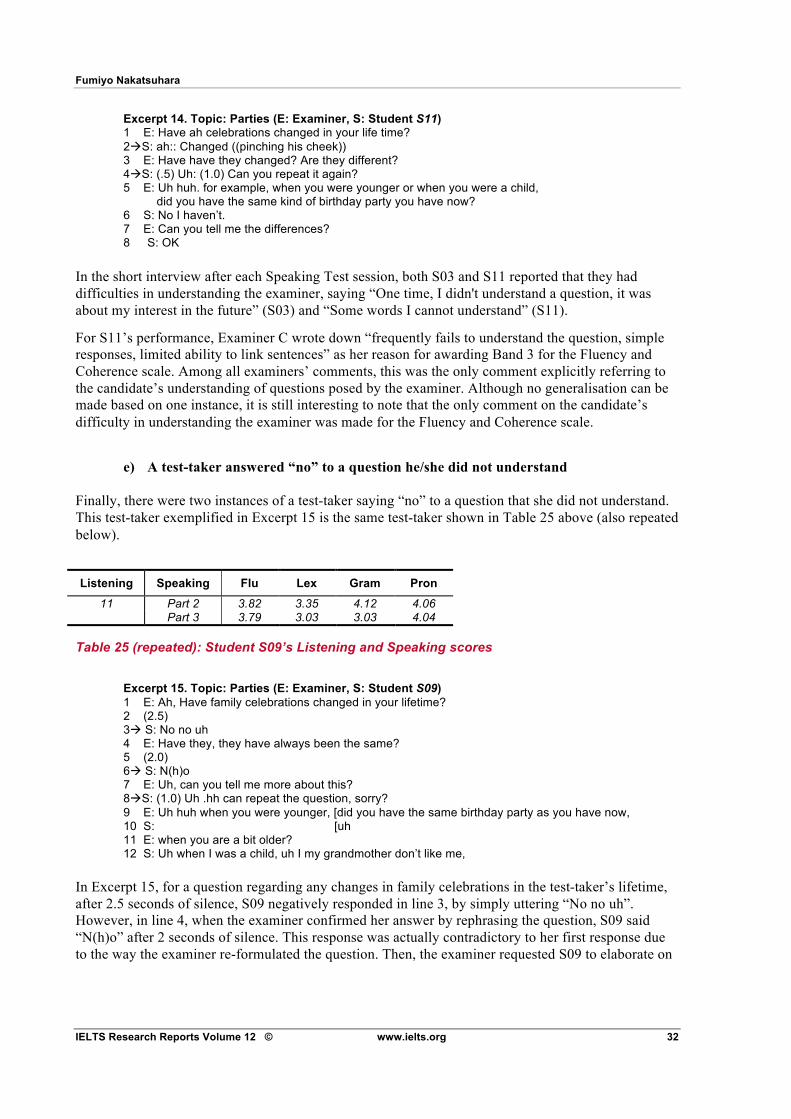
Fumiyo Nakatsuhara
IELTS Research Reports Volume 12 © www.ielts.org 32
Excerpt 14. Topic: Parties (E: Examiner, S: Student S11) 1 E: Have ah celebrations changed in your life time? 2"S: ah:: Changed ((pinching his cheek)) 3 E: Have have they changed? Are they different? 4"S: (.5) Uh: (1.0) Can you repeat it again? 5 E: Uh huh. for example, when you were younger or when you were a child, did you have the same kind of birthday party you have now? 6 S: No I haven’t. 7 E: Can you tell me the differences? 8 S: OK
In the short interview after each Speaking Test session, both S03 and S11 reported that they had difficulties in understanding the examiner, saying “One time, I didn't understand a question, it was about my interest in the future” (S03) and “Some words I cannot understand” (S11).
For S11’s performance, Examiner C wrote down “frequently fails to understand the question, simple responses, limited ability to link sentences” as her reason for awarding Band 3 for the Fluency and Coherence scale. Among all examiners’ comments, this was the only comment explicitly referring to the candidate’s understanding of questions posed by the examiner. Although no generalisation can be made based on one instance, it is still interesting to note that the only comment on the candidate’s difficulty in understanding the examiner was made for the Fluency and Coherence scale.
!e) A test-taker answered “no” to a question he/she did not understand
Finally, there were two instances of a test-taker saying “no” to a question that she did not understand. This test-taker exemplified in Excerpt 15 is the same test-taker shown in Table 25 above (also repeated below).
Listening Speaking Flu Lex Gram Pron
11 Part 2 3.82 3.35 4.12 4.06 Part 3 3.79 3.03 3.03 4.04
Table 25 (repeated): Student S09’s Listening and Speaking scores
Excerpt 15. Topic: Parties (E: Examiner, S: Student S09) 1 E: Ah, Have family celebrations changed in your lifetime? 2 (2.5) 3" S: No no uh 4 E: Have they, they have always been the same? 5 (2.0) 6" S: N(h)o 7 E: Uh, can you tell me more about this? 8"S: (1.0) Uh .hh can repeat the question, sorry? 9 E: Uh huh when you were younger, [did you have the same birthday party as you have now, 10 S: [uh 11 E: when you are a bit older? 12 S: Uh when I was a child, uh I my grandmother don’t like me,
!In Excerpt 15, for a question regarding any changes in family celebrations in the test-taker’s lifetime, after 2.5 seconds of silence, S09 negatively responded in line 3, by simply uttering “No no uh”. However, in line 4, when the examiner confirmed her answer by rephrasing the question, S09 said “N(h)o” after 2 seconds of silence. This response was actually contradictory to her first response due to the way the examiner re-formulated the question. Then, the examiner requested S09 to elaborate on
The relationship between test-takers’ listening proficiency and their performance on the IELTS Speaking Test
IELTS Research Reports Volume 12 © www.ielts.org 33
her contradicting responses. Only at that time, did she express that, in fact, she had not understood the preceding questions, and she asked the examiner to repeat the question in line 8.
Although this was the only example of this type of communication problem occurrence among the 36 test-takers in the main study, a similar example was also observed in the pilot stage of this study. When the researcher asked the student why he said “no” for what he did not actually understand, he mentioned that it was a test-taking strategy, as examiners are likely to move on to the next question if he gives a negative answer. While it is not certain whether or not S09 in the main study also said “no” for the same reason, it is worth noting that this could be a test-taking strategy that some test-takers might utilise when encountering a comprehension problem in speaking tests.
This section has illustrated how communication problems in Part 3 that seemed to be related to test-takers’ difficulties in understanding the examiner occurred, and how they were dealt with, and categorised into five types. It has been suggested that a certain type of listening-related communication problems could be linked to a certain level of listening and speaking proficiency. Each pattern of communication problems and test-takers’ Listening scores and Part 3 Speaking analytical scores can be summarised as follows.
! Type a) asking a question and then responding relevantly [Listening scores: 5–12, Part 3 Speaking analytical scores: 4.0-5.0 (occasionally those with higher listening (21–26) and spoken proficiency at 5.5 and above)]
! Type b) asking a question and then responding irrelevantly [Listening scores: 10–11, Part 3 Speaking analytical scores: 3.0–4.0]
! Type c1) misunderstanding a question and responding very irrelevantly [Listening scores: 10–11, Part 3 Speaking analytical scores: 2.0–3.0]
! Type c2) misunderstanding a question and giving somewhat related but mostly irrelevant response [Listening scores: 2–12, Part 3 Speaking analytical scores: 5.0]
! Type d) echoing uncomprehended parts [Listening scores: 3–19, Part 3 Speaking analytical scores: 2.0-4.5]
! Type e) saying “no” to an uncomprehended question [Listening score: 11, Part 3 Speaking analytical scores: 3.0–4.0]
It has also been suggested that certain types of breakdowns could contribute more to lowering test-takers’ Part 3 scores than their Part 2 scores. Among these patterns of listening-related communication problems, some test-takers who had Type b), c1) and d) problems received considerably lower scores in Part 2 than in Part 3. However, Speaking scores in Part 2 and Part 3 did not differ for test-takers with Type a) and c2) problems, and some of them even received higher scores in Part 3 than in Part 2. Such interpretations of the interactional data were, whenever possible, elaborated on or supported by the candidates’ interview data and examiners’ comments for awarding their scores.
Test-takers who had some of the Part 3 analytical scores at 5.5 and above did not tend to encounter listening-related problems during the Part 3, and even when it happened, they solved the problem naturally with an appropriate request. It demonstrates their understandings of the nature of problems that they encountered, and their listening problems in the processing model seemed to be associated with the higher, meaning building level, or they have just missed hearing a particular word. Therefore, the results suggest that a possible boundary in bands where the degree of impact of test-takers’ listening proficiency changes might be Band 5.0.
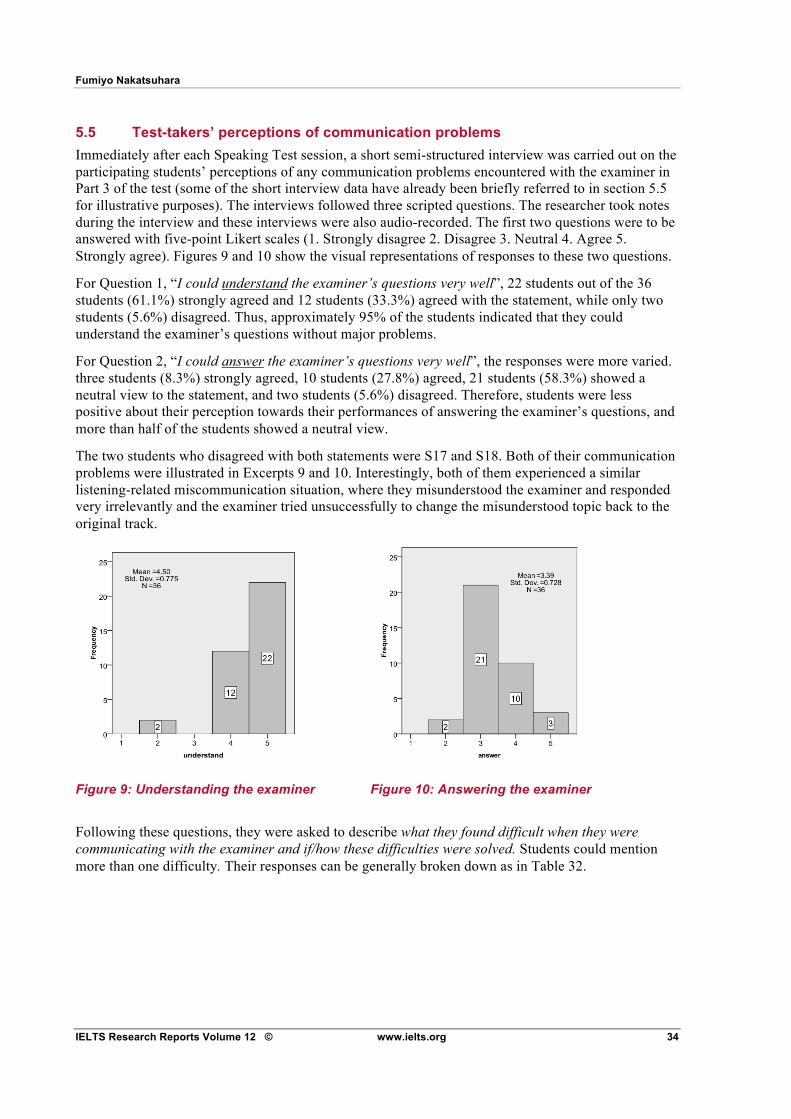
Fumiyo Nakatsuhara
IELTS Research Reports Volume 12 © www.ielts.org 34
5.5 Test-takers’ perceptions of communication problems Immediately after each Speaking Test session, a short semi-structured interview was carried out on the participating students’ perceptions of any communication problems encountered with the examiner in Part 3 of the test (some of the short interview data have already been briefly referred to in section 5.5 for illustrative purposes). The interviews followed three scripted questions. The researcher took notes during the interview and these interviews were also audio-recorded. The first two questions were to be answered with five-point Likert scales (1. Strongly disagree 2. Disagree 3. Neutral 4. Agree 5. Strongly agree). Figures 9 and 10 show the visual representations of responses to these two questions.
For Question 1, “I could understand the examiner’s questions very well”, 22 students out of the 36 students (61.1%) strongly agreed and 12 students (33.3%) agreed with the statement, while only two students (5.6%) disagreed. Thus, approximately 95% of the students indicated that they could understand the examiner’s questions without major problems.
For Question 2, “I could answer the examiner’s questions very well”, the responses were more varied. three students (8.3%) strongly agreed, 10 students (27.8%) agreed, 21 students (58.3%) showed a neutral view to the statement, and two students (5.6%) disagreed. Therefore, students were less positive about their perception towards their performances of answering the examiner’s questions, and more than half of the students showed a neutral view.
The two students who disagreed with both statements were S17 and S18. Both of their communication problems were illustrated in Excerpts 9 and 10. Interestingly, both of them experienced a similar listening-related miscommunication situation, where they misunderstood the examiner and responded very irrelevantly and the examiner tried unsuccessfully to change the misunderstood topic back to the original track.
Figure 9: Understanding the examiner Figure 10: Answering the examiner
Following these questions, they were asked to describe what they found difficult when they were communicating with the examiner and if/how these difficulties were solved. Students could mention more than one difficulty. Their responses can be generally broken down as in Table 32.
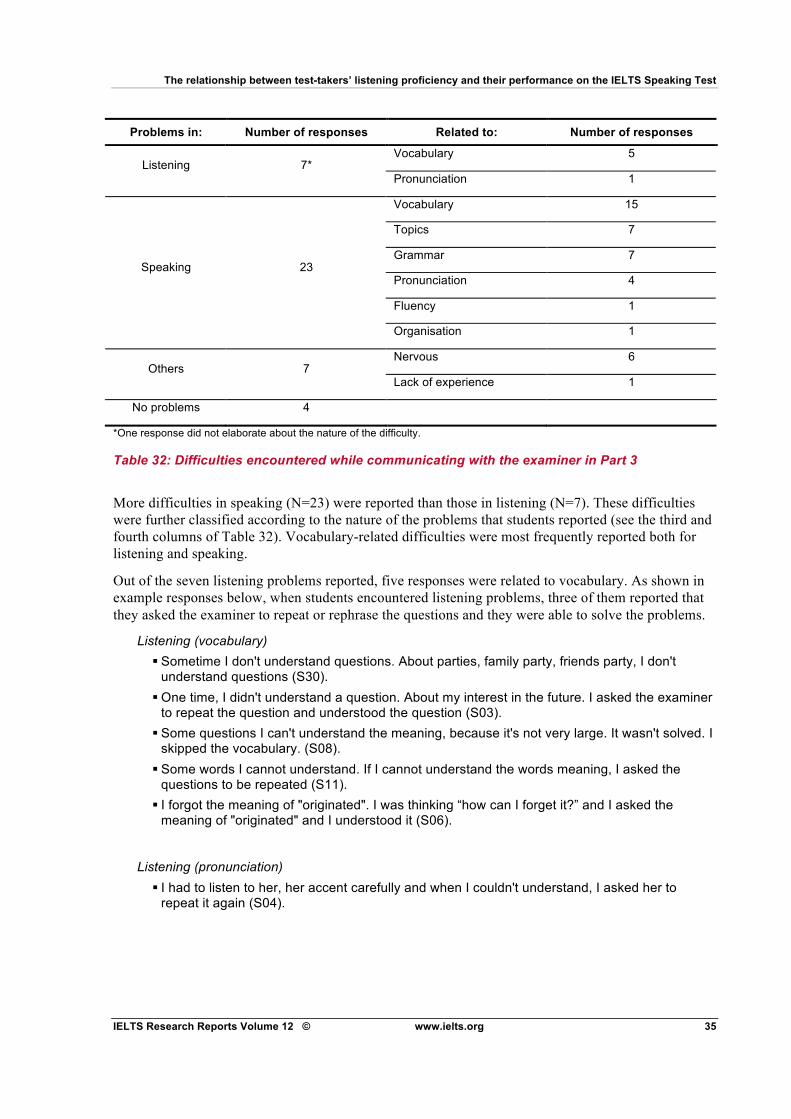
The relationship between test-takers’ listening proficiency and their performance on the IELTS Speaking Test
IELTS Research Reports Volume 12 © www.ielts.org 35
Problems in: Number of responses Related to: Number of responses
Vocabulary 5 Listening 7*
Pronunciation 1
Vocabulary 15
Topics 7
Grammar 7
Pronunciation 4
Fluency 1
Speaking 23
Organisation 1
Nervous 6 Others 7
Lack of experience 1
No problems 4
*One response did not elaborate about the nature of the difficulty.
Table 32: Difficulties encountered while communicating with the examiner in Part 3
More difficulties in speaking (N=23) were reported than those in listening (N=7). These difficulties were further classified according to the nature of the problems that students reported (see the third and fourth columns of Table 32). Vocabulary-related difficulties were most frequently reported both for listening and speaking.
Out of the seven listening problems reported, five responses were related to vocabulary. As shown in example responses below, when students encountered listening problems, three of them reported that they asked the examiner to repeat or rephrase the questions and they were able to solve the problems.
Listening (vocabulary) ! Sometime I don't understand questions. About parties, family party, friends party, I don't
understand questions (S30). ! One time, I didn't understand a question. About my interest in the future. I asked the examiner
to repeat the question and understood the question (S03). ! Some questions I can't understand the meaning, because it's not very large. It wasn't solved. I
skipped the vocabulary. (S08). ! Some words I cannot understand. If I cannot understand the words meaning, I asked the
questions to be repeated (S11). ! I forgot the meaning of "originated". I was thinking “how can I forget it?” and I asked the
meaning of "originated" and I understood it (S06).
Listening (pronunciation)
! I had to listen to her, her accent carefully and when I couldn't understand, I asked her to repeat it again (S04).
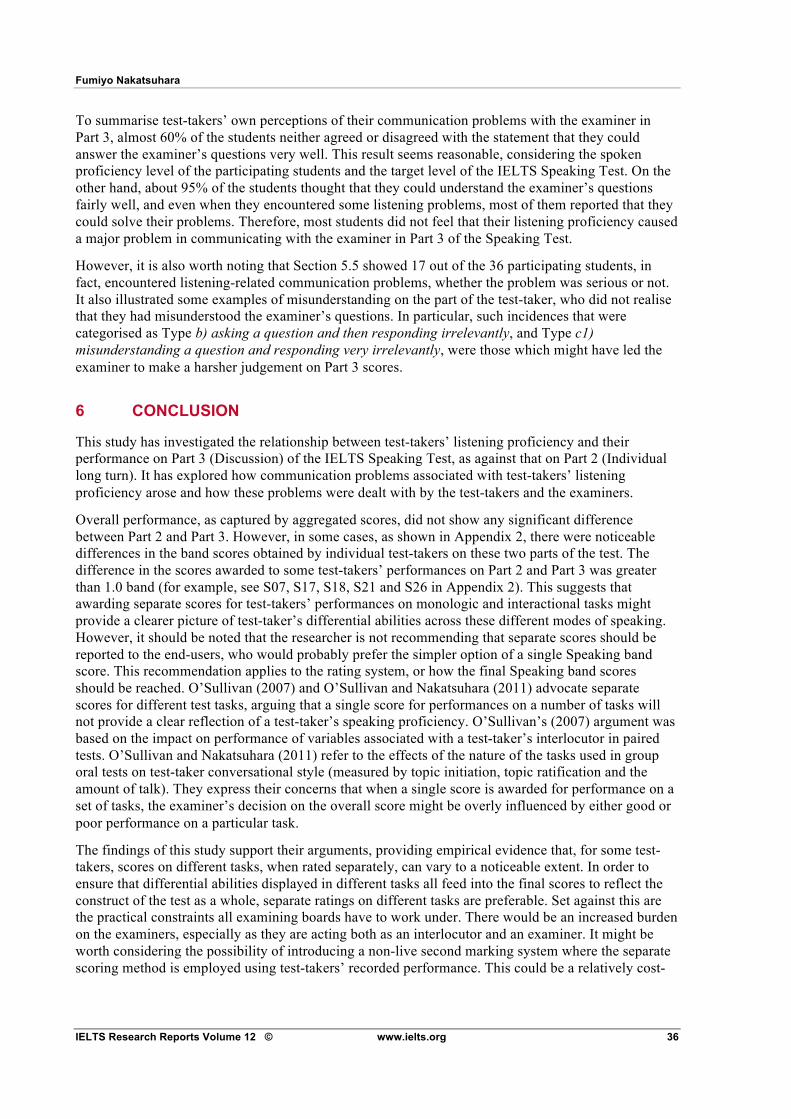
Fumiyo Nakatsuhara
IELTS Research Reports Volume 12 © www.ielts.org 36
To summarise test-takers’ own perceptions of their communication problems with the examiner in Part 3, almost 60% of the students neither agreed or disagreed with the statement that they could answer the examiner’s questions very well. This result seems reasonable, considering the spoken proficiency level of the participating students and the target level of the IELTS Speaking Test. On the other hand, about 95% of the students thought that they could understand the examiner’s questions fairly well, and even when they encountered some listening problems, most of them reported that they could solve their problems. Therefore, most students did not feel that their listening proficiency caused a major problem in communicating with the examiner in Part 3 of the Speaking Test.
However, it is also worth noting that Section 5.5 showed 17 out of the 36 participating students, in fact, encountered listening-related communication problems, whether the problem was serious or not. It also illustrated some examples of misunderstanding on the part of the test-taker, who did not realise that they had misunderstood the examiner’s questions. In particular, such incidences that were categorised as Type b) asking a question and then responding irrelevantly, and Type c1) misunderstanding a question and responding very irrelevantly, were those which might have led the examiner to make a harsher judgement on Part 3 scores.
6 CONCLUSION
This study has investigated the relationship between test-takers’ listening proficiency and their performance on Part 3 (Discussion) of the IELTS Speaking Test, as against that on Part 2 (Individual long turn). It has explored how communication problems associated with test-takers’ listening proficiency arose and how these problems were dealt with by the test-takers and the examiners.
Overall performance, as captured by aggregated scores, did not show any significant difference between Part 2 and Part 3. However, in some cases, as shown in Appendix 2, there were noticeable differences in the band scores obtained by individual test-takers on these two parts of the test. The difference in the scores awarded to some test-takers’ performances on Part 2 and Part 3 was greater than 1.0 band (for example, see S07, S17, S18, S21 and S26 in Appendix 2). This suggests that awarding separate scores for test-takers’ performances on monologic and interactional tasks might provide a clearer picture of test-taker’s differential abilities across these different modes of speaking. However, it should be noted that the researcher is not recommending that separate scores should be reported to the end-users, who would probably prefer the simpler option of a single Speaking band score. This recommendation applies to the rating system, or how the final Speaking band scores should be reached. O’Sullivan (2007) and O’Sullivan and Nakatsuhara (2011) advocate separate scores for different test tasks, arguing that a single score for performances on a number of tasks will not provide a clear reflection of a test-taker’s speaking proficiency. O’Sullivan’s (2007) argument was based on the impact on performance of variables associated with a test-taker’s interlocutor in paired tests. O’Sullivan and Nakatsuhara (2011) refer to the effects of the nature of the tasks used in group oral tests on test-taker conversational style (measured by topic initiation, topic ratification and the amount of talk). They express their concerns that when a single score is awarded for performance on a set of tasks, the examiner’s decision on the overall score might be overly influenced by either good or poor performance on a particular task.
The findings of this study support their arguments, providing empirical evidence that, for some test-takers, scores on different tasks, when rated separately, can vary to a noticeable extent. In order to ensure that differential abilities displayed in different tasks all feed into the final scores to reflect the construct of the test as a whole, separate ratings on different tasks are preferable. Set against this are the practical constraints all examining boards have to work under. There would be an increased burden on the examiners, especially as they are acting both as an interlocutor and an examiner. It might be worth considering the possibility of introducing a non-live second marking system where the separate scoring method is employed using test-takers’ recorded performance. This could be a relatively cost-
The relationship between test-takers’ listening proficiency and their performance on the IELTS Speaking Test
IELTS Research Reports Volume 12 © www.ielts.org 37
effective solution for generating more reliable scores without placing any additional burden on the examiners in the live tests.
Furthermore, the data confirmed that the level of language produced by test-takers was significantly higher in Part 2 than in Part 3 for the Fluency and Coherence category. The interactional data also indicated that it could be those aspects of fluency which relate to interaction that contributed to the differences (eg, filled and unfilled pauses before responding to the examiner), serving to depress performance on this criterion. This suggests that, in order to offer a true reflection of a candidate’s true ability required in the two tasks, it might be worth considering using different formulations of the Fluency and Coherence descriptors in rating performance on Part 3 from those used in rating Part 2, explicitly making the Part 3 descriptors reflect the construct of listening-into-speaking. For instance, since some listening-related problems tend to be realised at turn initial parts of test-takers’ utterances, descriptors for Part 3 could include graded (dis)fluency elements associated with turn initial parts of test-takers’ utterances, such as hesitations, false starts, repetition and reformulation. Descriptors about how naturally they request the examiner to repeat, rephrase or explain a question, when they have listening-related difficulties, and how they fill a gap in their turn initial parts to gain some time to formulate ideas and utterances will also be useful, taking into consideration the cognitive processing demands of interactional communication that take place under time pressure. It is also important that examiner training should make examiners more aware of the role of listening in Part 3 of the test. On the other hand, descriptors for Part 2 could expect less hesitation markers and repetition and a greater extent of coherence in utterances from test-takers at the same proficiency level, considering the nature of monologic speech and also one-minute planning time prior to the monologue (Field, 2011).
The discrepancies in the fluency construct between Part 2 and Part 3 may also help to explain Brown’s (2006b) findings that the examiners felt the Fluency and Coherence scale was the most difficult to interpret. In addition to the ambiguity in test-takers’ hesitations whether they are caused by a search for ideas or a search for language (Brown, 2006b, p 51), this study highlights another level of complexity in interpreting the cause of hesitations, which is whether test-takers are hesitating because of their speaking-related limitations or listening-related limitations. Formulating separate sets of descriptors for monologic and interactional tasks, reflecting a clearer operationalisation of the Fluency and Coherence construct, and providing separate scores on each part could be a key to solving this issue.
The results of this study have also suggested that the Part 3 interactive task assesses a more integrated listening-into-speaking construct as distinct from the more purely speaking construct measured in the Part 2 monologic task. Correlations between Listening and Speaking scores were higher in Part 3 (Discussion) than in Part 2 (Individual long turn), and some of the differences approached significance, even with the small sample size of this study. There was additional evidence in the interactional data presented in the study that the construct underlying Part 3 of the IELTS Speaking Test was not a purely productive speaking ability, especially for those at Band 5.0 (in Part 3) and below who tended to have some difficulties in understanding the examiner. In contrast, test-takers at Band 5.5 and above did not tend to encounter listening-related problems, and even when they did, they solved the problem naturally with an appropriate, specific request, demonstrating their understandings of the nature of the listening problems, or they have simply missed hearing a particular word. This finding would seem to support Seedhouse and Egbert’s (2006) supposition that there would be a correlation between the IELTS Speaking Test scores and difficulty in hearing or understanding on the part of test-takers. It may be that for students at Band 5.0 and below, their deficits in listening affected attention or working memory capacity, which might have impaired speech planning.

Fumiyo Nakatsuhara
IELTS Research Reports Volume 12 © www.ielts.org 38
The importance of listening ability to the discussion task is also reflected in the stronger correlation between the Listening Test scores and scores awarded to Part 3 discussion tasks as against Part 2 monologue tasks. Additionally, in case the weight of listening seems larger than it should be (eg, S17 who had difficulties in understanding almost all questions posed by the examiner), it might also be worth considering the preparation of easier question scripts for low-level test-takers so they can follow the examiner, and provide ratable speech samples in Part 3. This would improve the scoring validity of the IELTS Speaking Tests for candidates with Band 5.0 and below. However, great caution may be required if easier question scripts are to be introduced, because it could compromise comparability and fairness. If this recommendation is pursued, rules on the use of graded cues should be clearly established and integrated into the interlocutor frame and examiner training.
In conclusion, the findings of this study have highlighted the differences between monologic and interactional tasks in terms of the constructs they measure, showing that the latter format, at least to some extent, measures listening-into-speaking abilities. This has broader implications for the relationship between test-takers’ listening proficiency and performance on other more interactive speaking test formats such as paired and group oral tests. However, in these peer–peer formats, since all test-takers are supposed to have an equal level of goal-orientation and they can manage the interaction as they wish, they could more freely use avoidance strategies to cover their listening limitations (eg, Excerpt 15). Test-takers in these formats are also expected to support each other to be fluent and create a “confluence” in the conversation (McCarthy, 2005), and thus the listening deficits might not be as noticeable as an examiner–examinee format. Future studies comparing monologue, examiner–examinee discussion and peer–peer discussion tasks will be useful to gain further insights into this issue.
7 LIMITATIONS OF THE STUDY AND FUTURE RESEARCH
This study has shortcomings to be acknowledged in terms of its methodological design and its scope. Based on these limitations, some directions for future research will be proposed to confirm and extend the findings of the present study.
As described in Section 4.1, 28 out of the total 36 participants shared the same first language, Mandarin Chinese. Therefore, it should be noted that the uneven mix of participants’ first languages may restrict the generalisability of the results obtained in this study. Additionally, the length of stay in the UK and the amount of exposure to English outside the class also varied to a large extent. These differences could be potential uncontrolled variables, as learners might listen in a different way once they have integrated into the L2 environment. Hence, it will be necessary to replicate this study with different test-taker populations to confirm the findings of this study.
In this study, the Speaking Test transcripts and the coded interview data were qualitatively analysed to suggest a possible level boundary that differentiates the degree/types of communication problems related to test-takers’ listening proficiency on Part 3 Speaking performance. However, due to the limited sample sizes, no statistical analysis was utilised for this part. It will be useful to replicate this study with a larger sample size and carry out inferential statistics on the data, to confirm the boundary suggested in this study. Replicating this study with a larger sample size is also necessary to carry out more reliable inferential statistics on the differences in correlations between listening scores and Parts 2 and 3 scores of the Speaking Test.
Due to practical constraints, it was not possible to interview students for longer than five minutes following each Speaking Test session. In future research, it might be more informative if retrospective interviews could be carried out with test-takers after each test session, while showing a video-tape of their performance. Additionally, more detailed information could probably be obtained if these retrospective interviews could be conducted in the test-taker’s L1, since it seemed too demanding for
The relationship between test-takers’ listening proficiency and their performance on the IELTS Speaking Test
IELTS Research Reports Volume 12 © www.ielts.org 39
some students at the lower proficiency levels to explain what problems they had encountered while communicating with the examiner.
Finally, to sum up three key recommendations arisen from this study to be considered by IELTS Speaking Test, they are to:
1. score Part 2 and Part 3 of the Speaking Test separately
2. formulate different descriptors of the Fluency and Coherence scale reflecting a clearer operationalisation of the Fluency and Coherence construct in Part 2 and Part 3
3. grade the language of the interviewer cues, and use easier question scripts for test-takers with low-level listening proficiency to be able to follow the examiner, in case the weight of listening seems larger than it should be.
Each of these points need to be further investigated and followed up, in order to confirm and extend the findings of the study and to provide recommendations in fine details.
ACKNOWLEDGEMENTS I am very grateful to Shaida Mohammadi, Head of English at the International Study Centre, Leicester University for allowing me access to students and facilities at the centre and for assisting me with various aspects of the speaking and listening data collection. I am indebted to the students and IELTS examiners who participated in the data collection. I would also like to express my appreciation to Professor Cyril J Weir, Dr Tony Green, Dr Stephen Bax and Dr John Field for their valuable suggestions and comments on earlier versions of this report.
Fumiyo Nakatsuhara
IELTS Research Reports Volume 12 © www.ielts.org 40
REFERENCES
Atkinson, JM and Heritage, J, 1984, Structures of social action, Cambridge University Press, Cambridge
Bachman, LF, Davidson, FG, Ryan, K and Choi, I-C, 1995, An investigation into the comparability of two tests of English as a foreign language: the Cambridge - TOEFL comparability study, Cambridge University Press, Cambridge
Brown, A, 2006a, Candidate discourse in the revised IELTS Speaking Test in IELTS Research Reports Volume 6, IELTS Australia, Canberra and British Council, London, pp 71-89
Brown, A, 2006b, An examination of the rating process in the revised IELTS Speaking Test in IELTS Research Reports Volume 6, IELTS Australia, Canberra and British Council, London, pp 41-69
Brown, A and Hill, K, 1997, Interviewer style and candidate performance in the IELTS oral interview in IELTS Research Reports 1997 Volume 1, ed S Woods, ELICOS/IELTS Pty Ltd, Canberra pp 1-19
Brown, A, Iwashita, N and McNamara, T, 2005, An examination of rater orientations and test-taker performance on English-for-Academic-Purposes speaking tests, TOEFL Monograph Series MS - 29, available on line at http://www.ets.org/Media/Research/pdf/RR-05-05.pdf
Cambridge ESOL, 2008a, Cambridge Certificate in Advanced English 2, Cambridge University Press, Cambridge
Cambridge ESOL, 2008b, Cambridge First Certificate in English 2, Cambridge University Press, Cambridge
Cambridge ESOL, 2009a, Cambridge Certificate in Advanced English 3, Cambridge University Press, Cambridge
Cambridge ESOL, 2009b, Cambridge First Certificate in English 3, Cambridge University Press, Cambridge
Cohen, J, 1998, Statistical power analysis for the behavioural sciences, Erlbaum, Hillsdale, NJ
Council of Europe, 2001, Common European Framework of Reference for Languages: Learning, teaching, assessment, Cambridge University Press, Cambridge
Ducasse, AM and Brown, A, 2009, Assessing paired orals: Raters' orientation to interaction, Language Testing vol 26, (3), pp 423-443
ffrench, A, 2003, 'The change process at the paper level. Paper 5, Speaking' in Continuity and innovation: Revising the Cambridge Proficiency in English examination 1913-2002, eds C J Weir and M Milanovic, Cambridge University Press, Cambridge, pp 367-471
The relationship between test-takers’ listening proficiency and their performance on the IELTS Speaking Test
IELTS Research Reports Volume 12 © www.ielts.org 41
Field, J, 2008, Listening in the language classroom, Cambridge University Press, Cambridge
Field, J, 2011, 'Cognitive validity' in Examining speaking, Studies in Language Testing 30, ed L Taylor, Cambridge University Press, Cambridge, pp65-111
Galaczi, ED, 2010, Interactional competence across proficiency levels, oral presentation at the 32nd Language Testing Research Colloquium, University of Cambridge, UK, April 2010
Geranpayeh, A, 2007, 'Using Structural Equation Modelling to facilitate the revision of high stakes testing: the case of CAE', Research Notes vol 30, pp 8-12
Green, A, 2007, IELTS washback in context: Preparation for academic writing in higher education Cambridge University Press, Cambridge
Hawkey, R, 2009, Examining FCE and CAE: Key issues and recurring themes in developing the First Certificate in English and Certificate in Advanced English exams, Studies in Language Testing 28. Cambridge University Press, Cambridge
Howell, D, 2002, Statistical methods for Psychology, Duxbury, Pacific Grove, CA
Hutchby, I and Wooffitt, R, 1998, Conversation analysis, Cambridge University Press, Cambridge
IELTS Partners, 2006, IELTS scores explained (DVD)
Joyce, P, 2008, Linguistic Knowledge and Psycholinguistic Processing Skills as Components of L2 Listening Comprehension, Unpublished PhD thesis, Roehampton University
Lee, Y-W, 2006, 'Dependability of scores for a new ESL speaking assessment consisting of integrated and independent tasks', Language Testing vol 23, (2), pp 131-166
Linacre, M, 2006, A user's guide to FACETS: Rasch-model computer programs, MESA Press, Chicago, IL
May, L, 2007, Interaction in a paired speaking test: the rater's perspective, Unpublished PhD thesis, University of Melbourne, Australia
McCarthy, M, 2005, 'Fluency and confluence: What fluent speakers do', The Language Teacher vol 29, (6), pp 26-28
McNamara, TF, 1996, Measuring second language performance, Longman, Harlow
Mohammadi, S, 2009, Assessing spoken language: Validity in the language proficiency interview, Unpublished Mphil thesis, University of Nottingham, UK
Nakatsuhara, F, 2009, Conversational styles in group oral tests: How is the conversation co-constructed? Unpublished PhD thesis, the University of Essex, UK
Fumiyo Nakatsuhara
IELTS Research Reports Volume 12 © www.ielts.org 42
O’Sullivan, B and Lu, Y, 2006, The impact on candidate language of examiner deviation from a set interlocutor frame in the IELTS Speaking Test in IELTS Research Reports Volume 6, IELTS Australia, Canberra and British Council, London, pp 91-117
O’Sullivan, B, 2007, Modelling performance in tests of spoken language, Frankfurt, Peter Lang
O’Sullivan, B and Nakatsuhara, F, 2011, 'Quantifying conversational styles in group oral test discourse' in Language testing: Theories and practices, ed B O’Sullivan, Palgrave, London, pp 164-185
Sawaki, Y, Stricker, LJ and Oranje, AH, 2009, 'Factor structure of the TOEFL Internet-based test', Language Testing vol 26, (1), pp 5-30
Seedhouse, P and Egbert, M, 2006, 'The interactional organisation of the IELTS Speaking Test' in IELTS Research Reports Volume 6, IELTS Australia, Canberra and British Council, London, pp 161-205
Shin, K, 2005, 'Did they take the same test? Examinee language proficiency and the structure of language tests', Language Testing vol 22, (1), pp 31-57
Shiotsu, T and Weir, CJ, 2007, 'The relative significance of syntactic knowledge and vocabulary breadth in the prediction of reading comprehension test performance', Language Testing vol 24, (1), pp 99-128
Stricker, LJ, Rock, DA and Lee, Y-W, 2005, Factor structure of the LanguEdge test across language groups (TOEFL Monograph Series MS-32), Educational Testing Service, Princeton, NJ
UCLES, 2007a, Certificate in Advanced English: Handbook for teachers, available online at https://www.teachers.cambridgeesol.org/ts/digitalAssets/109740_cae_hb_dec08.pdf
UCLES, 2007b, First Certificate in English: Handbook for teachers, available online at: http://www.cambridgeesol.org/assets/pdf/resources/teacher/fce_hb_dec08.pdf,
van Lier, L, 1989, 'Reeling, writhing, drawing, stretching and fainting in coils: Oral proficiency interviews as conversation', TESOL Quarterly, 23 (3), pp489-508
Weir, C J, 1983, Identifying the language problems of the overseas students in tertiary education in the UK, Unpublished PhD dissertation, University of London
Weir, C J, 2005, Language testing and validation: An evidence-based approach, Basingstoke, Palgrave Macmillan
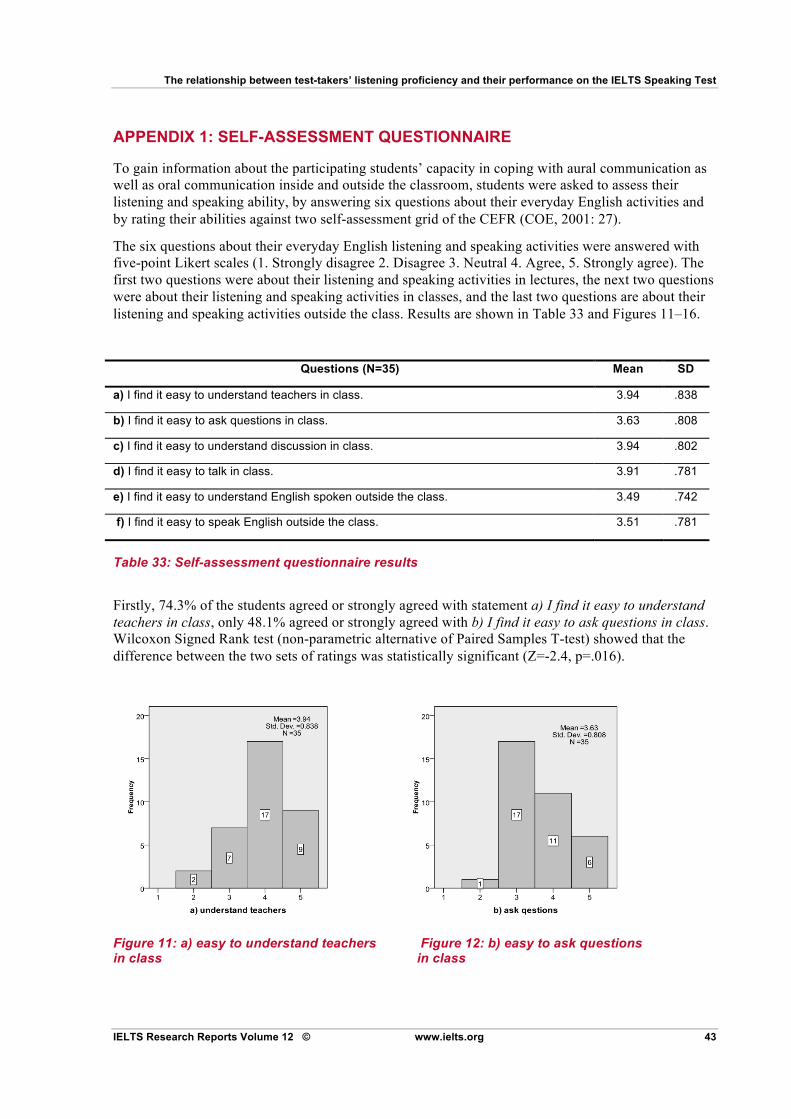
The relationship between test-takers’ listening proficiency and their performance on the IELTS Speaking Test
IELTS Research Reports Volume 12 © www.ielts.org 43
APPENDIX 1: SELF-ASSESSMENT QUESTIONNAIRE
To gain information about the participating students’ capacity in coping with aural communication as well as oral communication inside and outside the classroom, students were asked to assess their listening and speaking ability, by answering six questions about their everyday English activities and by rating their abilities against two self-assessment grid of the CEFR (COE, 2001: 27).
The six questions about their everyday English listening and speaking activities were answered with five-point Likert scales (1. Strongly disagree 2. Disagree 3. Neutral 4. Agree, 5. Strongly agree). The first two questions were about their listening and speaking activities in lectures, the next two questions were about their listening and speaking activities in classes, and the last two questions are about their listening and speaking activities outside the class. Results are shown in Table 33 and Figures 11–16.
Questions (N=35) Mean SD
a) I find it easy to understand teachers in class. 3.94 .838
b) I find it easy to ask questions in class. 3.63 .808
c) I find it easy to understand discussion in class. 3.94 .802
d) I find it easy to talk in class. 3.91 .781
e) I find it easy to understand English spoken outside the class. 3.49 .742
f) I find it easy to speak English outside the class. 3.51 .781
Table 33: Self-assessment questionnaire results
Firstly, 74.3% of the students agreed or strongly agreed with statement a) I find it easy to understand teachers in class, only 48.1% agreed or strongly agreed with b) I find it easy to ask questions in class. Wilcoxon Signed Rank test (non-parametric alternative of Paired Samples T-test) showed that the difference between the two sets of ratings was statistically significant (Z=-2.4, p=.016).
Figure 11: a) easy to understand teachers Figure 12: b) easy to ask questions in class in class
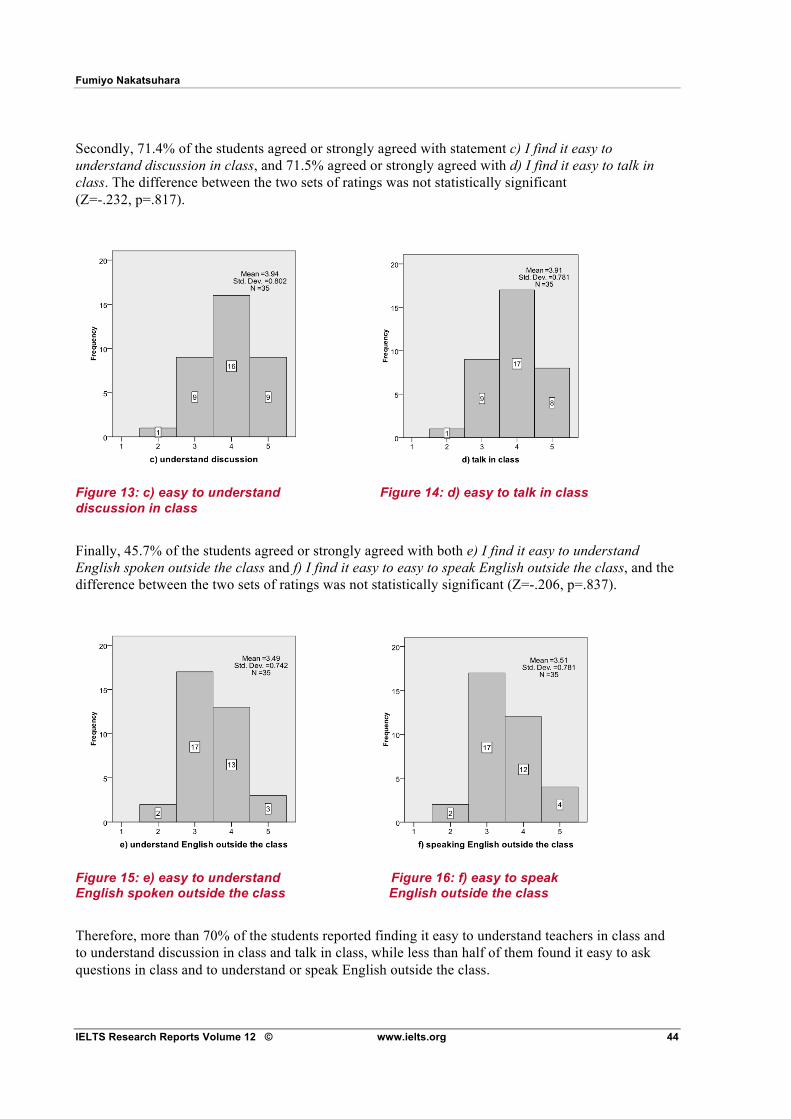
Fumiyo Nakatsuhara
IELTS Research Reports Volume 12 © www.ielts.org 44
Secondly, 71.4% of the students agreed or strongly agreed with statement c) I find it easy to understand discussion in class, and 71.5% agreed or strongly agreed with d) I find it easy to talk in class. The difference between the two sets of ratings was not statistically significant (Z=-.232, p=.817).
Figure 13: c) easy to understand Figure 14: d) easy to talk in class discussion in class
Finally, 45.7% of the students agreed or strongly agreed with both e) I find it easy to understand English spoken outside the class and f) I find it easy to easy to speak English outside the class, and the difference between the two sets of ratings was not statistically significant (Z=-.206, p=.837).
Figure 15: e) easy to understand Figure 16: f) easy to speak English spoken outside the class English outside the class
Therefore, more than 70% of the students reported finding it easy to understand teachers in class and to understand discussion in class and talk in class, while less than half of them found it easy to ask questions in class and to understand or speak English outside the class.
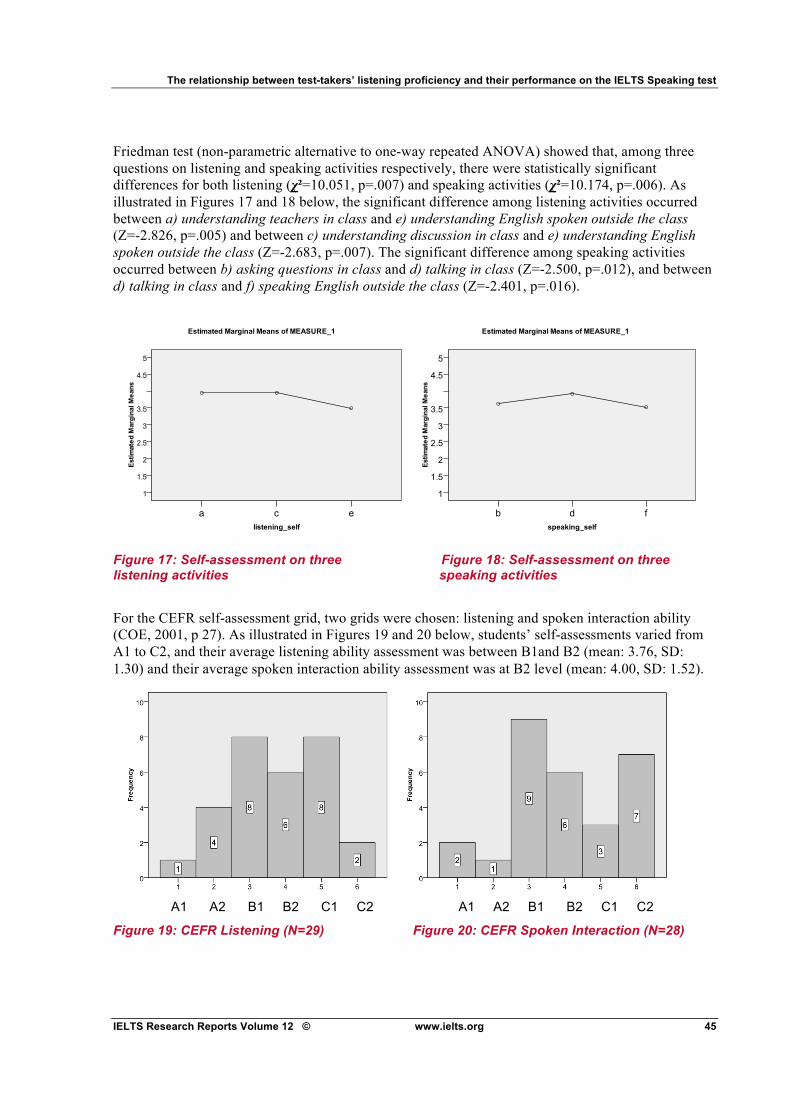
The relationship between test-takers’ listening proficiency and their performance on the IELTS Speaking test
IELTS Research Reports Volume 12 © www.ielts.org 45
Friedman test (non-parametric alternative to one-way repeated ANOVA) showed that, among three questions on listening and speaking activities respectively, there were statistically significant differences for both listening (!!=10.051, p=.007) and speaking activities (!!=10.174, p=.006). As illustrated in Figures 17 and 18 below, the significant difference among listening activities occurred between a) understanding teachers in class and e) understanding English spoken outside the class (Z=-2.826, p=.005) and between c) understanding discussion in class and e) understanding English spoken outside the class (Z=-2.683, p=.007). The significant difference among speaking activities occurred between b) asking questions in class and d) talking in class (Z=-2.500, p=.012), and between d) talking in class and f) speaking English outside the class (Z=-2.401, p=.016).
Figure 17: Self-assessment on three Figure 18: Self-assessment on three listening activities speaking activities
For the CEFR self-assessment grid, two grids were chosen: listening and spoken interaction ability (COE, 2001, p 27). As illustrated in Figures 19 and 20 below, students’ self-assessments varied from A1 to C2, and their average listening ability assessment was between B1and B2 (mean: 3.76, SD: 1.30) and their average spoken interaction ability assessment was at B2 level (mean: 4.00, SD: 1.52).
Figure 19: CEFR Listening (N=29) Figure 20: CEFR Spoken Interaction (N=28)
A1 A2 B1 B2 C1 C2 A1 A2 B1 B2 C1 C2
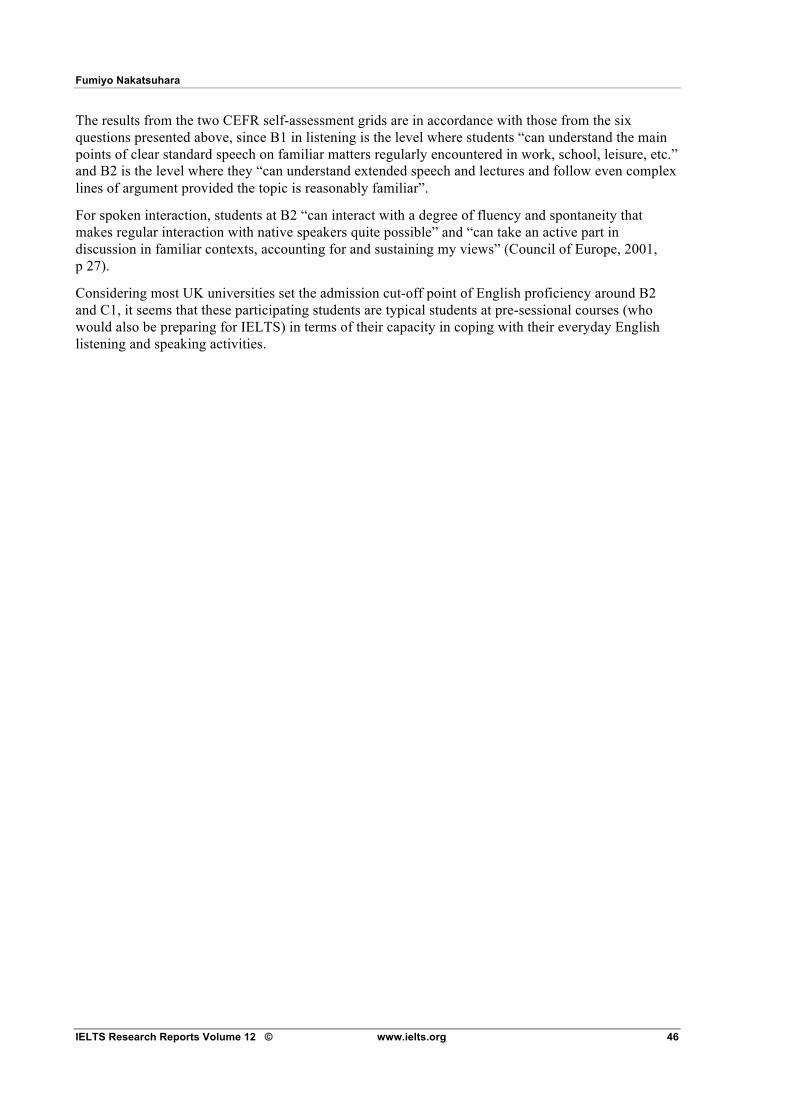
Fumiyo Nakatsuhara
IELTS Research Reports Volume 12 © www.ielts.org 46
The results from the two CEFR self-assessment grids are in accordance with those from the six questions presented above, since B1 in listening is the level where students “can understand the main points of clear standard speech on familiar matters regularly encountered in work, school, leisure, etc.” and B2 is the level where they “can understand extended speech and lectures and follow even complex lines of argument provided the topic is reasonably familiar”.
For spoken interaction, students at B2 “can interact with a degree of fluency and spontaneity that makes regular interaction with native speakers quite possible” and “can take an active part in discussion in familiar contexts, accounting for and sustaining my views” (Council of Europe, 2001, p 27).
Considering most UK universities set the admission cut-off point of English proficiency around B2 and C1, it seems that these participating students are typical students at pre-sessional courses (who would also be preparing for IELTS) in terms of their capacity in coping with their everyday English listening and speaking activities.
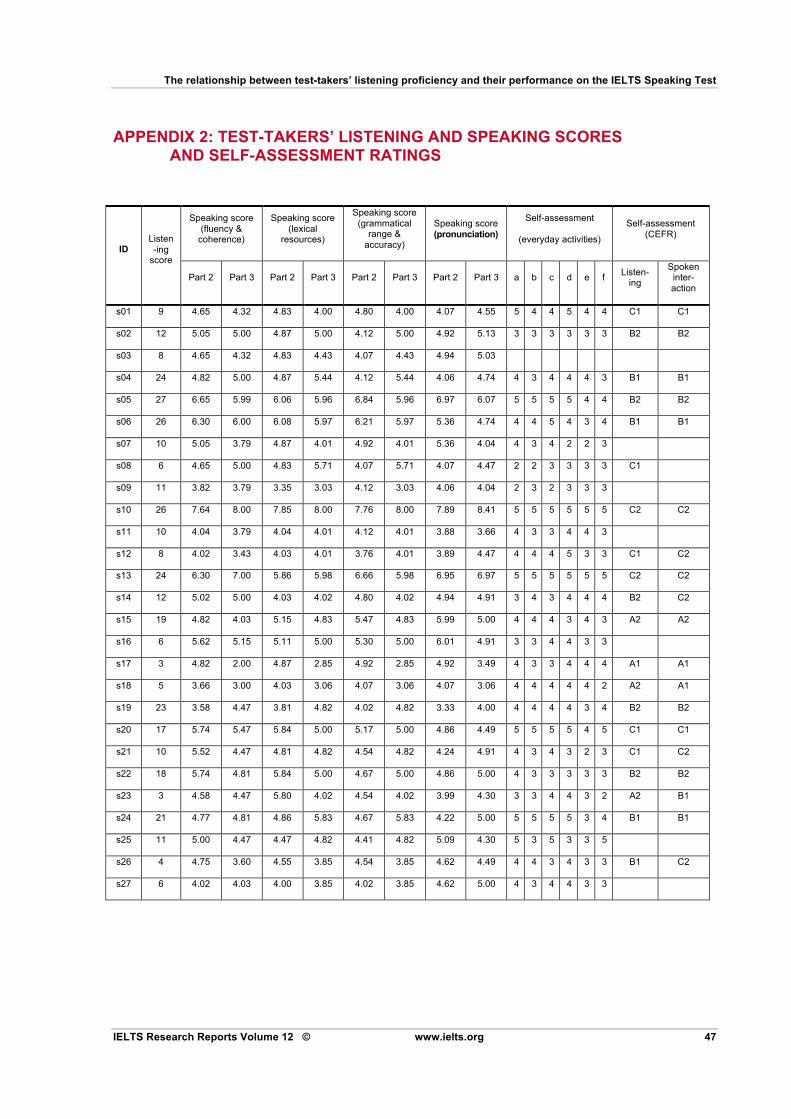
The relationship between test-takers’ listening proficiency and their performance on the IELTS Speaking Test
IELTS Research Reports Volume 12 © www.ielts.org 47
APPENDIX 2: TEST-TAKERS’ LISTENING AND SPEAKING SCORES AND SELF-ASSESSMENT RATINGS
Speaking score (fluency &
coherence)
Speaking score (lexical
resources)
Speaking score (grammatical
range & accuracy)
Speaking score (pronunciation)
Self-assessment
(everyday activities)
Self-assessment (CEFR)
ID Listen-ing
score
Part 2 Part 3 Part 2 Part 3 Part 2 Part 3 Part 2 Part 3 a b c d e f Listen-ing
Spoken inter-action
s01 9 4.65 4.32 4.83 4.00 4.80 4.00 4.07 4.55 5 4 4 5 4 4 C1 C1
s02 12 5.05 5.00 4.87 5.00 4.12 5.00 4.92 5.13 3 3 3 3 3 3 B2 B2
s03 8 4.65 4.32 4.83 4.43 4.07 4.43 4.94 5.03
s04 24 4.82 5.00 4.87 5.44 4.12 5.44 4.06 4.74 4 3 4 4 4 3 B1 B1
s05 27 6.65 5.99 6.06 5.96 6.84 5.96 6.97 6.07 5 5 5 5 4 4 B2 B2
s06 26 6.30 6.00 6.08 5.97 6.21 5.97 5.36 4.74 4 4 5 4 3 4 B1 B1
s07 10 5.05 3.79 4.87 4.01 4.92 4.01 5.36 4.04 4 3 4 2 2 3
s08 6 4.65 5.00 4.83 5.71 4.07 5.71 4.07 4.47 2 2 3 3 3 3 C1
s09 11 3.82 3.79 3.35 3.03 4.12 3.03 4.06 4.04 2 3 2 3 3 3
s10 26 7.64 8.00 7.85 8.00 7.76 8.00 7.89 8.41 5 5 5 5 5 5 C2 C2
s11 10 4.04 3.79 4.04 4.01 4.12 4.01 3.88 3.66 4 3 3 4 4 3
s12 8 4.02 3.43 4.03 4.01 3.76 4.01 3.89 4.47 4 4 4 5 3 3 C1 C2
s13 24 6.30 7.00 5.86 5.98 6.66 5.98 6.95 6.97 5 5 5 5 5 5 C2 C2
s14 12 5.02 5.00 4.03 4.02 4.80 4.02 4.94 4.91 3 4 3 4 4 4 B2 C2
s15 19 4.82 4.03 5.15 4.83 5.47 4.83 5.99 5.00 4 4 4 3 4 3 A2 A2
s16 6 5.62 5.15 5.11 5.00 5.30 5.00 6.01 4.91 3 3 4 4 3 3
s17 3 4.82 2.00 4.87 2.85 4.92 2.85 4.92 3.49 4 3 3 4 4 4 A1 A1
s18 5 3.66 3.00 4.03 3.06 4.07 3.06 4.07 3.06 4 4 4 4 4 2 A2 A1
s19 23 3.58 4.47 3.81 4.82 4.02 4.82 3.33 4.00 4 4 4 4 3 4 B2 B2
s20 17 5.74 5.47 5.84 5.00 5.17 5.00 4.86 4.49 5 5 5 5 4 5 C1 C1
s21 10 5.52 4.47 4.81 4.82 4.54 4.82 4.24 4.91 4 3 4 3 2 3 C1 C2
s22 18 5.74 4.81 5.84 5.00 4.67 5.00 4.86 5.00 4 3 3 3 3 3 B2 B2
s23 3 4.58 4.47 5.80 4.02 4.54 4.02 3.99 4.30 3 3 4 4 3 2 A2 B1
s24 21 4.77 4.81 4.86 5.83 4.67 5.83 4.22 5.00 5 5 5 5 3 4 B1 B1
s25 11 5.00 4.47 4.47 4.82 4.41 4.82 5.09 4.30 5 3 5 3 3 5
s26 4 4.75 3.60 4.55 3.85 4.54 3.85 4.62 4.49 4 4 3 4 3 3 B1 C2
s27 6 4.02 4.03 4.00 3.85 4.02 3.85 4.62 5.00 4 3 4 4 3 3
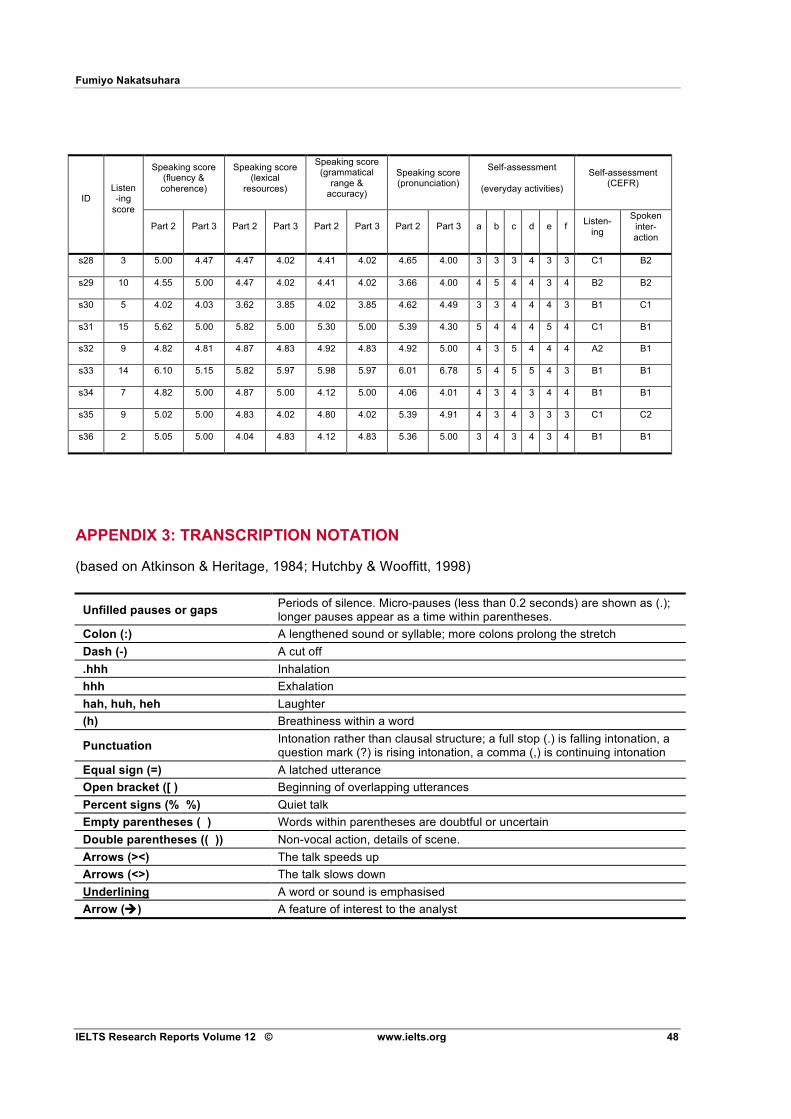
Fumiyo Nakatsuhara
IELTS Research Reports Volume 12 © www.ielts.org 48
Speaking score (fluency &
coherence)
Speaking score (lexical
resources)
Speaking score (grammatical
range & accuracy)
Speaking score (pronunciation)
Self-assessment
(everyday activities)
Self-assessment (CEFR)
ID Listen-ing
score
Part 2 Part 3 Part 2 Part 3 Part 2 Part 3 Part 2 Part 3 a b c d e f Listen-ing
Spoken inter-action
s28 3 5.00 4.47 4.47 4.02 4.41 4.02 4.65 4.00 3 3 3 4 3 3 C1 B2
s29 10 4.55 5.00 4.47 4.02 4.41 4.02 3.66 4.00 4 5 4 4 3 4 B2 B2
s30 5 4.02 4.03 3.62 3.85 4.02 3.85 4.62 4.49 3 3 4 4 4 3 B1 C1
s31 15 5.62 5.00 5.82 5.00 5.30 5.00 5.39 4.30 5 4 4 4 5 4 C1 B1
s32 9 4.82 4.81 4.87 4.83 4.92 4.83 4.92 5.00 4 3 5 4 4 4 A2 B1
s33 14 6.10 5.15 5.82 5.97 5.98 5.97 6.01 6.78 5 4 5 5 4 3 B1 B1
s34 7 4.82 5.00 4.87 5.00 4.12 5.00 4.06 4.01 4 3 4 3 4 4 B1 B1
s35 9 5.02 5.00 4.83 4.02 4.80 4.02 5.39 4.91 4 3 4 3 3 3 C1 C2
s36 2 5.05 5.00 4.04 4.83 4.12 4.83 5.36 5.00 3 4 3 4 3 4 B1 B1
APPENDIX 3: TRANSCRIPTION NOTATION
(based on Atkinson & Heritage, 1984; Hutchby & Wooffitt, 1998)
Unfilled pauses or gaps Periods of silence. Micro-pauses (less than 0.2 seconds) are shown as (.); longer pauses appear as a time within parentheses.
Colon (:) A lengthened sound or syllable; more colons prolong the stretch Dash (-) A cut off .hhh Inhalation hhh Exhalation hah, huh, heh Laughter (h) Breathiness within a word
Punctuation Intonation rather than clausal structure; a full stop (.) is falling intonation, a question mark (?) is rising intonation, a comma (,) is continuing intonation
Equal sign (=) A latched utterance Open bracket ([ ) Beginning of overlapping utterances Percent signs (% %) Quiet talk Empty parentheses ( ) Words within parentheses are doubtful or uncertain Double parentheses (( )) Non-vocal action, details of scene. Arrows (><) The talk speeds up Arrows (<>) The talk slows down Underlining A word or sound is emphasised Arrow (") A feature of interest to the analyst
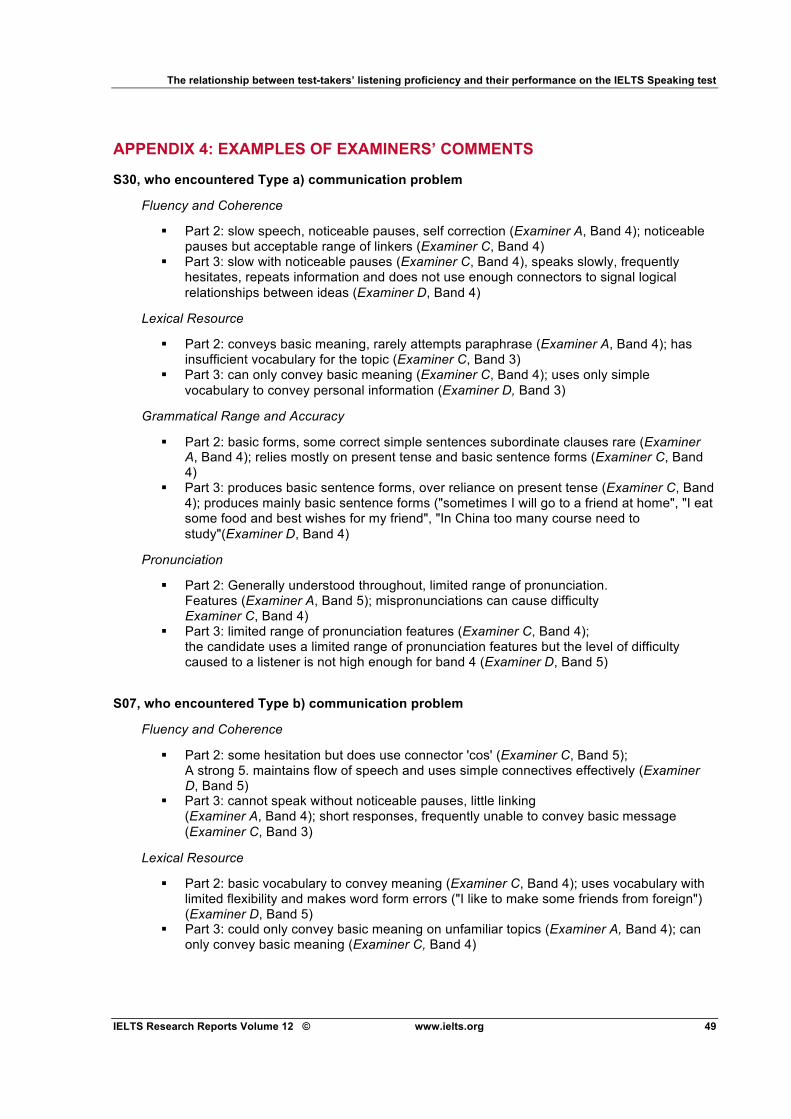
The relationship between test-takers’ listening proficiency and their performance on the IELTS Speaking test
IELTS Research Reports Volume 12 © www.ielts.org 49
APPENDIX 4: EXAMPLES OF EXAMINERS’ COMMENTS
S30, who encountered Type a) communication problem
Fluency and Coherence
! Part 2: slow speech, noticeable pauses, self correction (Examiner A, Band 4); noticeable pauses but acceptable range of linkers (Examiner C, Band 4)
! Part 3: slow with noticeable pauses (Examiner C, Band 4), speaks slowly, frequently hesitates, repeats information and does not use enough connectors to signal logical relationships between ideas (Examiner D, Band 4)
Lexical Resource
! Part 2: conveys basic meaning, rarely attempts paraphrase (Examiner A, Band 4); has insufficient vocabulary for the topic (Examiner C, Band 3)
! Part 3: can only convey basic meaning (Examiner C, Band 4); uses only simple vocabulary to convey personal information (Examiner D, Band 3)
Grammatical Range and Accuracy
! Part 2: basic forms, some correct simple sentences subordinate clauses rare (Examiner A, Band 4); relies mostly on present tense and basic sentence forms (Examiner C, Band 4)
! Part 3: produces basic sentence forms, over reliance on present tense (Examiner C, Band 4); produces mainly basic sentence forms ("sometimes I will go to a friend at home", "I eat some food and best wishes for my friend", "In China too many course need to study"(Examiner D, Band 4)
Pronunciation
! Part 2: Generally understood throughout, limited range of pronunciation. Features (Examiner A, Band 5); mispronunciations can cause difficulty Examiner C, Band 4)
! Part 3: limited range of pronunciation features (Examiner C, Band 4); the candidate uses a limited range of pronunciation features but the level of difficulty caused to a listener is not high enough for band 4 (Examiner D, Band 5)
S07, who encountered Type b) communication problem
Fluency and Coherence
! Part 2: some hesitation but does use connector 'cos' (Examiner C, Band 5); A strong 5. maintains flow of speech and uses simple connectives effectively (Examiner D, Band 5)
! Part 3: cannot speak without noticeable pauses, little linking (Examiner A, Band 4); short responses, frequently unable to convey basic message (Examiner C, Band 3)
Lexical Resource
! Part 2: basic vocabulary to convey meaning (Examiner C, Band 4); uses vocabulary with limited flexibility and makes word form errors ("I like to make some friends from foreign") (Examiner D, Band 5)
! Part 3: could only convey basic meaning on unfamiliar topics (Examiner A, Band 4); can only convey basic meaning (Examiner C, Band 4)
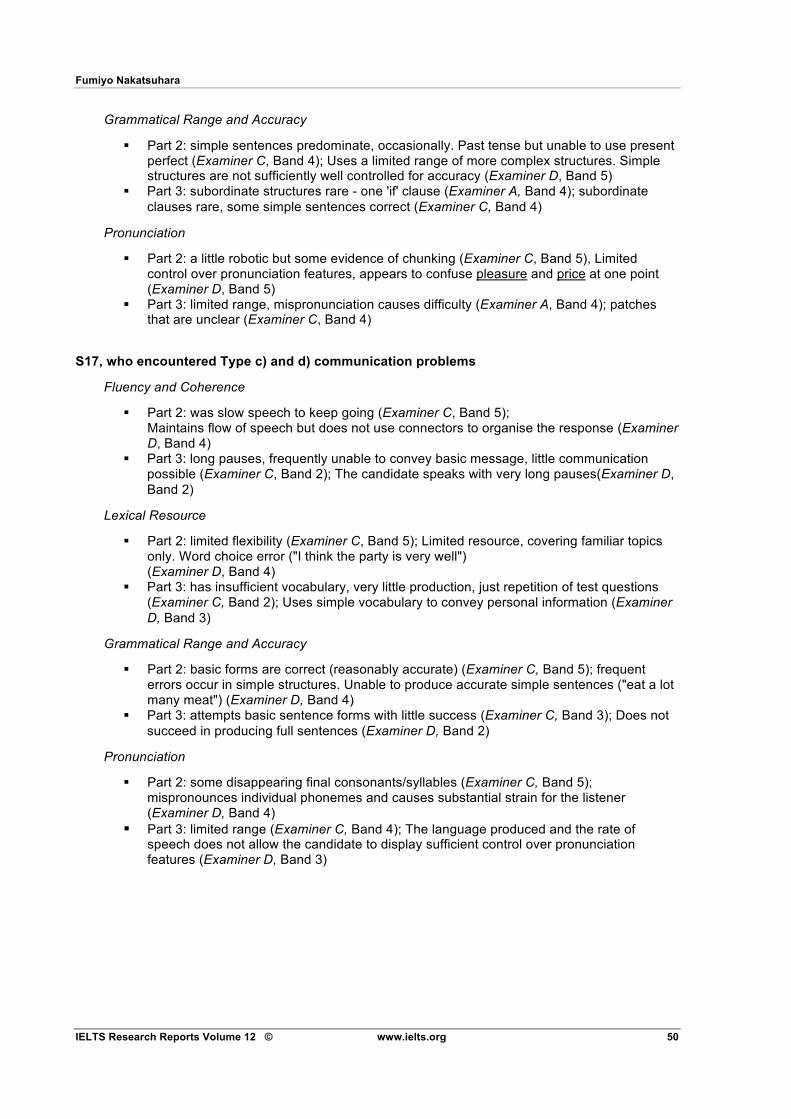
Fumiyo Nakatsuhara
IELTS Research Reports Volume 12 © www.ielts.org 50
Grammatical Range and Accuracy
! Part 2: simple sentences predominate, occasionally. Past tense but unable to use present perfect (Examiner C, Band 4); Uses a limited range of more complex structures. Simple structures are not sufficiently well controlled for accuracy (Examiner D, Band 5)
! Part 3: subordinate structures rare - one 'if' clause (Examiner A, Band 4); subordinate clauses rare, some simple sentences correct (Examiner C, Band 4)
Pronunciation
! Part 2: a little robotic but some evidence of chunking (Examiner C, Band 5), Limited control over pronunciation features, appears to confuse pleasure and price at one point (Examiner D, Band 5)
! Part 3: limited range, mispronunciation causes difficulty (Examiner A, Band 4); patches that are unclear (Examiner C, Band 4)
S17, who encountered Type c) and d) communication problems
Fluency and Coherence
! Part 2: was slow speech to keep going (Examiner C, Band 5); Maintains flow of speech but does not use connectors to organise the response (Examiner D, Band 4)
! Part 3: long pauses, frequently unable to convey basic message, little communication possible (Examiner C, Band 2); The candidate speaks with very long pauses(Examiner D, Band 2)
Lexical Resource
! Part 2: limited flexibility (Examiner C, Band 5); Limited resource, covering familiar topics only. Word choice error ("I think the party is very well") (Examiner D, Band 4)
! Part 3: has insufficient vocabulary, very little production, just repetition of test questions (Examiner C, Band 2); Uses simple vocabulary to convey personal information (Examiner D, Band 3)
Grammatical Range and Accuracy
! Part 2: basic forms are correct (reasonably accurate) (Examiner C, Band 5); frequent errors occur in simple structures. Unable to produce accurate simple sentences ("eat a lot many meat") (Examiner D, Band 4)
! Part 3: attempts basic sentence forms with little success (Examiner C, Band 3); Does not succeed in producing full sentences (Examiner D, Band 2)
Pronunciation
! Part 2: some disappearing final consonants/syllables (Examiner C, Band 5); mispronounces individual phonemes and causes substantial strain for the listener (Examiner D, Band 4)
! Part 3: limited range (Examiner C, Band 4); The language produced and the rate of speech does not allow the candidate to display sufficient control over pronunciation features (Examiner D, Band 3)