the relation of prerecorded music media format and the u ... · recording industry’s piracy...
TRANSCRIPT
The relation of prerecorded
recording i
ABSTRACT
Using data from 1972 to 200recording industry’s piracy claims by comparing record sales consumption expenditures in periods of piracy friendliness (music available on cassettes or online) to periods of piracy unfriearlier CDs). This study also confirms that reduced record sales in the piracy friendly eras was not part of a larger phenomenon of changing patterns in consumer recreational spending. Keywords: Music piracy, prerecorded music purchases, recreational spending
Research in Business and Economics Journal
The relation of prerecorded, Page
rerecorded music media format and the U. S.
industry piracy claims: 1972-2009
Gregory K. Faulk Belmont University
Using data from 1972 to 2009 this study finds results consistent with the recording industry’s piracy claims by comparing record sales normalized by personal
in periods of piracy friendliness (music available on cassettes or online) to periods of piracy unfriendliness (music formatted on vinyl records
This study also confirms that reduced record sales in the piracy friendly eras was not part of a larger phenomenon of changing patterns in consumer recreational
cy, prerecorded music purchases, recreational spending
Research in Business and Economics Journal
The relation of prerecorded, Page 1
ormat and the U. S.
this study finds results consistent with the normalized by personal
in periods of piracy friendliness (music available on cassettes vinyl records and
This study also confirms that reduced record sales in the piracy friendly eras was not part of a larger phenomenon of changing patterns in consumer recreational
cy, prerecorded music purchases, recreational spending
The main purpose of this article is to determine if the data Industry Association of America’s (RIAA) claims, beginning in 1971, that unauthorized copying (piracy) has caused it serious economic harmpreponderance of recent empirical downloads, this study seeks to determine whether the data are consistent with the domestic recording industry’s pAnother contribution of this paper in recreational spending on piracy. Sessions 2005, Hong 2007) to music purchases (replenishing album collections as formats changemagazines, books, video purchases, video rentals, movies, plays, operaselectronic games and toys) cannot fully prerecorded music. Prerecorded music purchases complementary goods are componentservices.1 This study seeks to determine if dattributed to piracy may be part of a larger phenomenon of consumer spending on recreational goods and services
The remainder of this paper is organized as follows. law’s impact on recording industry revenues are examinedreviewed. The recording industry’s claims of piracy losses characterized by various recording technologies, some of which are piracy friendly and others which aren’t. In addition, ccompared to those on recreational goods and services. summary and conclusions.
TECHNOLOGY AND COPYRIGHT LAW’S IMPACT ON RECORDING
INDUSTRY REVENUES
The topic of illegal digital file downloads has received much attention recently
(Liebowitz 2006). However, piracy since 1971. Over the years prerecorded music has been delivered in various formats, some of which were more amenable to piracy (tapes, songs) than others (celluloid discs (78’s),industry has resorted to legal and technological remedies This section recaps a brief history of the impact of changes in technology and copyright law on recording industry revenues
The recording industry celluloid discs in the late 1870s. The industry enjoyed increased prosperity with the public’s acceptance of vinyl recordmusic was tapped into by offshore plant(counterfeited) albums. It was limited to a small number of players due to fairly substantial barriers to entry and the economic loss associated with being apprehended and convicted. Their main protection was ineff1996).
1 A list of recreational goods and services in included in the Appendix.
Research in Business and Economics Journal
The relation of prerecorded, Page
purpose of this article is to determine if the data supports the Industry Association of America’s (RIAA) claims, beginning in 1971, that unauthorized
caused it serious economic harm. In contrast with the empirical studies on music piracy which have focused on digital
downloads, this study seeks to determine whether the data are consistent with the domestic recording industry’s piracy loss claims across the analog (tape) and digital eras.
of this paper is the examination of the potential impact on piracy. Previous studies (Liebowitz 2004, 2007,
have determined that various substitutes for or complements replenishing album collections as formats change, newspapers
magazines, books, video purchases, video rentals, movies, plays, operas, concerts) cannot fully account for reductions in spending on
Prerecorded music purchases and related substitute and are components of the broader category of recreational goods and
study seeks to determine if drops in spending on prerecorded music part of a larger phenomenon of concomitant drops in
consumer spending on recreational goods and services. The remainder of this paper is organized as follows. Technology and
’s impact on recording industry revenues are examined. Previous studieshe recording industry’s claims of piracy losses are analyzed over periods
ized by various recording technologies, some of which are piracy friendly and In addition, consumer spending patterns on prerecorded music are recreational goods and services. The paper wraps up with a
TECHNOLOGY AND COPYRIGHT LAW’S IMPACT ON RECORDING
The topic of illegal digital file downloads has received much attention recently (Liebowitz 2006). However, the recording industry has been gravely concerned piracy since 1971. Over the years prerecorded music has been delivered in various formats, some of which were more amenable to piracy (tapes, later CDs, on-line songs) than others (celluloid discs (78’s), vinyl records, earlier CDs). The recindustry has resorted to legal and technological remedies for piracy with limited success. This section recaps a brief history of the impact of changes in technology and copyright
revenues. The recording industry was created with the invention of record players and
celluloid discs in the late 1870s. The industry enjoyed increased prosperity with the vinyl records in the mid 1940s. The profitability of recorded
music was tapped into by offshore plants that reproduced and sold unauthorized (counterfeited) albums. It was limited to a small number of players due to fairly substantial barriers to entry and the economic loss associated with being apprehended and
main protection was ineffectual prosecution by their government (Burke
A list of recreational goods and services in included in the Appendix.
Research in Business and Economics Journal
The relation of prerecorded, Page 2
the Recording
Industry Association of America’s (RIAA) claims, beginning in 1971, that unauthorized
studies on music piracy which have focused on digital downloads, this study seeks to determine whether the data are consistent with the
the analog (tape) and digital eras. is the examination of the potential impact of changes
, 2007, Stevans and or complements
newspapers, concerts,
account for reductions in spending on
of the broader category of recreational goods and rops in spending on prerecorded music
drops in
echnology and copyright studies are
over periods ized by various recording technologies, some of which are piracy friendly and
onsumer spending patterns on prerecorded music are The paper wraps up with a
TECHNOLOGY AND COPYRIGHT LAW’S IMPACT ON RECORDING
The topic of illegal digital file downloads has received much attention recently concerned with
piracy since 1971. Over the years prerecorded music has been delivered in various line digital
CDs). The recording with limited success.
This section recaps a brief history of the impact of changes in technology and copyright
ed with the invention of record players and celluloid discs in the late 1870s. The industry enjoyed increased prosperity with the
The profitability of recorded s that reproduced and sold unauthorized
(counterfeited) albums. It was limited to a small number of players due to fairly substantial barriers to entry and the economic loss associated with being apprehended and
ectual prosecution by their government (Burke
Cassette tapes were introduced took advantage of the recording capacity of cassettes and began duplicating and swapping songs with each other. By 1971taping was one third the volume of legitimate recordings.the recording industry persuaded Congress to amend the 1909 Copyright Act. Effective February 15, 1972, the act contained two provisions that greatly enhanced record labels ability to prosecute copyright offenders. cause for legal action since copyrights were attached to the song and only the song writer or his delegate could sue for copyright violations. The amendment gave copyright status to the master sound recording, allowincourt systems. Also prior to the amendment there was no national standard for enforcing copyright infringement, that infraction was covered by individual state statutes and case law. The amendment prohibited the unauthorized copying of a sound recording at the federal level, simplifying record labels’ ability to prosecute offenders.
The home taping piracy problem partially self effaced with the introduction of digitally recorded compact discs (CDs) in 1mechanism for consumers to copyhigh cost of CD equipment delayed initial consumer acceptance of the media, but the lowering costs of CD players spurred growth and by 19outstripped the sale of full length cassettes.
The technological advances allowand expensive. In 1991 CD copying equipment was introduced to the consumer market by Sony and Philips at a cost of $40,000was $80. By 1995 the price of the equipment had been “reduced” to $995. costs, consumers had to contend with the decision of which ultimately prevail. CD-RW equipment (rewritof $1,000. The discs cost $12 and were not backward compatible with CDBy 1998 two competing interfaces of CDCompounding the consumer’s dilemma was the introduction of DVDtime. Initially CD-Rs and CDthat by 1999 only 14% of music consumers owned a device capable of burning CDs(Farwell 2003). Simply put, bycosts and technical constraints and of the Internet in the 1990s expanded the potential for piracycapacity to share digital files (no longer limited by physical proximity.recording and film industries lobbied Congress to pass a barrage of legislation: the Audio Home Recording Act of 1992, the Digital Performance Right in Sound Recordings Act of 1995, the No Electronic Theft Act of 1997, and the Digital Millennium Copyright Act of 1998.4
Two developments in the late 1990s exponentially song sharing. The emergence of the MP3 format facilitated online file sharing
2 Copyright Act of 1909, Title 17 Stat. 391.United States House of Representatives, Washington DC
3 RIAA 1998 Consumer Profiles (10 year summary), RIAA web site http://www.riaa.com.
4 See Menell (2002) for an analysis of copyright law as it applies to the music and computer industries.
Research in Business and Economics Journal
The relation of prerecorded, Page
were introduced commercially in the late 1960s. Some consumers took advantage of the recording capacity of cassettes and began duplicating and swapping
By 1971 the RIAA estimated that the volume of unauthorized was one third the volume of legitimate recordings. In response to the piracy threat
the recording industry persuaded Congress to amend the 1909 Copyright Act. Effective February 15, 1972, the act contained two provisions that greatly enhanced record labels ability to prosecute copyright offenders. Prior to the amendment record labels had no cause for legal action since copyrights were attached to the song and only the song writer or his delegate could sue for copyright violations. The amendment gave copyright status to the master sound recording, allowing record labels to pursue infringements through the court systems. Also prior to the amendment there was no national standard for enforcing copyright infringement, that infraction was covered by individual state statutes and case
ited the unauthorized copying of a sound recording at the federal level, simplifying record labels’ ability to prosecute offenders.2
The home taping piracy problem partially self effaced with the introduction of digitally recorded compact discs (CDs) in 1983. There was no cheap, effective mechanism for consumers to copy songs from prerecorded music CDs to blank CDs. The high cost of CD equipment delayed initial consumer acceptance of the media, but the lowering costs of CD players spurred growth and by 1991 the sales of full length CDs outstripped the sale of full length cassettes.3
echnological advances allowing individuals to copy songs to CDs expensive. In 1991 CD copying equipment was introduced to the consumer market
lips at a cost of $40,000. The costs of blank CD-Rs (single copy CDs) was $80. By 1995 the price of the equipment had been “reduced” to $995. costs, consumers had to contend with the decision of which CD technology would
RW equipment (rewritable CDs) was introduced in 1996 at a cost of $1,000. The discs cost $12 and were not backward compatible with CD-R equipment.
interfaces of CD-RW to personal computers were on the marketnsumer’s dilemma was the introduction of DVD-Rs around this
Rs and CD-RWs wouldn’t play on DVD-R equipment. It is estimated by 1999 only 14% of music consumers owned a device capable of burning CDs
Simply put, by 1999 song swapping via CDs was circumscribed by costs and technical constraints and probably not a widespread phenomena. The growth
expanded the potential for piracy. Internet users had the capacity to share digital files (which included songs) with one another. Song sharers were
by physical proximity. To protect its interests in the digital era the recording and film industries lobbied Congress to pass a barrage of legislation: the Audio
Act of 1992, the Digital Performance Right in Sound Recordings Act of 1995, the No Electronic Theft Act of 1997, and the Digital Millennium Copyright Act of
developments in the late 1990s exponentially exacerbated the potential for The emergence of the MP3 format facilitated online file sharing
Copyright Act of 1909, Title 17 U S Code S. 1. Amended October 15, 1971, Pub. L. 92United States House of Representatives, Washington DC
RIAA 1998 Consumer Profiles (10 year summary), RIAA web site http://www.riaa.com.
(2002) for an analysis of copyright law as it applies to the music and computer industries.
Research in Business and Economics Journal
The relation of prerecorded, Page 3
Some consumers took advantage of the recording capacity of cassettes and began duplicating and swapping
the volume of unauthorized In response to the piracy threat
the recording industry persuaded Congress to amend the 1909 Copyright Act. Effective February 15, 1972, the act contained two provisions that greatly enhanced record labels
to the amendment record labels had no cause for legal action since copyrights were attached to the song and only the song writer or his delegate could sue for copyright violations. The amendment gave copyright status
g record labels to pursue infringements through the court systems. Also prior to the amendment there was no national standard for enforcing copyright infringement, that infraction was covered by individual state statutes and case
ited the unauthorized copying of a sound recording at the
The home taping piracy problem partially self effaced with the introduction of 983. There was no cheap, effective
CDs to blank CDs. The high cost of CD equipment delayed initial consumer acceptance of the media, but the
91 the sales of full length CDs
CDs was slow expensive. In 1991 CD copying equipment was introduced to the consumer market
copy CDs) Besides
technology would CDs) was introduced in 1996 at a cost
R equipment. to personal computers were on the market.
Rs around this It is estimated
by 1999 only 14% of music consumers owned a device capable of burning CDs 1999 song swapping via CDs was circumscribed by
The growth Internet users had the
Song sharers were To protect its interests in the digital era the
recording and film industries lobbied Congress to pass a barrage of legislation: the Audio Act of 1992, the Digital Performance Right in Sound Recordings Act of
1995, the No Electronic Theft Act of 1997, and the Digital Millennium Copyright Act of
the potential for The emergence of the MP3 format facilitated online file sharing by making
October 15, 1971, Pub. L. 92-140, § 1(a), 85
(2002) for an analysis of copyright law as it applies to the music and computer industries.
files easier to swap due to their devoted to file sharing (which included song swapping). Song swappers now had a clearing house and were no longer limited claimed that worldwide the industry was losing over $4 billion a year to piracy.
The recording industry Diamond Multimedia, the manufacturer of MP3 players, but lost the caseNapster, effectively putting it out business.allowed computer to computer file sharing without a central file server, Napster’sdownfall. The industry responded by sharing portals as well as the Internet Service Provider VerizonInternet song swapping portals.
In conjunction with legal action, the recording industrcombat piracy. It partnered with electronic retailers and released songs with Rights Management (DRM) softwareelectronic file. Legitimate purchases of onbegan in 2002 at the web site Listen.com. Most of these songs were sold with some type of copy protection feature. For a brief time the recording industry experimented with a two tier pricing system. Downloaded songs witwith unlimited copying capability. Due to consumer backlash about the incompatibility of legally obtained DRM files with their listening devices the industry eventually gave up on copy protecting on-line music. EMIcopying restrictions in April of 2007. The other major record labels soon followed suit. By 2008 the four major record labels: EMI, Sony/BMG, Warner and Universal as well as a host of independent record labecatalogs online in a DRM free format
Between 1972 and 200which, tapes and digital songs, were amenable to piracy, and two of whand CDs weren’t as amenable. a longitudinal study to assess whether that losses caused by piracy arefocused primarily on the digital era2004, 2007, Hui and Png 2003, Rob and WaldfogelZentner 2006, Stevans and Sessions
PRIOR STUDIES
Although generally supportive of the industry’s claims of piracy induced revenue
losses in the digital era, some empirical studies cast doubt on its magnitude. sample of international data from 1994 to 1998 Hui and Png (2003) impact of piracy on CD sales was about 42% of industry estimates. Liebowitz (2004) studies the effects on annual trends in national record sales from 1973 to 2002 of various factors: album prices, income, portability and “librarying” (replenishing album these factors cannot fully explain declines in record sales over the period andbased on 1999 to 2002 data, that digital file sharing has
5 Recording Industry Association of America (RIAA). RIAA Releases 2001 Physical AntiApril 5, 2002
Research in Business and Economics Journal
The relation of prerecorded, Page
files easier to swap due to their increased density. In 1999 Napster introduced devoted to file sharing (which included song swapping). Song swappers now had a
and were no longer limited to personal acquaintances. By 2001 the RIAA claimed that worldwide the industry was losing over $4 billion a year to piracy.
recording industry turned to the courts to ameliorate piracy losses. Multimedia, the manufacturer of MP3 players, but lost the case. It
effectively putting it out business. However, other web sites sprung up that allowed computer to computer file sharing without a central file server, Napster’s
l. The industry responded by suing the major peer-to-peer (P2P) Internet the Internet Service Provider Verizon and individual users of
Internet song swapping portals. In conjunction with legal action, the recording industry turned to technology to
It partnered with electronic retailers and released songs with Digital Rights Management (DRM) software which limited the user to one or a few copies of an electronic file. Legitimate purchases of on-line songs from all the major record labels began in 2002 at the web site Listen.com. Most of these songs were sold with some type of copy protection feature. For a brief time the recording industry experimented with a two tier pricing system. Downloaded songs with DRM sold for a lower price than songs with unlimited copying capability. Due to consumer backlash about the incompatibility of legally obtained DRM files with their listening devices the industry eventually gave up
line music. EMI and Apple began offering online music free of copying restrictions in April of 2007. The other major record labels soon followed suit. By 2008 the four major record labels: EMI, Sony/BMG, Warner and Universal as well as a host of independent record labels offered most if not all of the songs in their music catalogs online in a DRM free format (Sayer 2008).
Between 1972 and 2009 prerecorded music was delivered in four formats, two of which, tapes and digital songs, were amenable to piracy, and two of which, vinyl recordsand CDs weren’t as amenable. This technological demarcation provides a framework for a longitudinal study to assess whether the data are consistent with the industry’s claims
are long lived and significant. Prior studies, which have focused primarily on the digital era, mainly support the industry’s claims. (Liebowitz
2003, Rob and Waldfogel 2006, Peitz and WaelbrockStevans and Sessions 2005, Hong 2007)
Although generally supportive of the industry’s claims of piracy induced revenue , some empirical studies cast doubt on its magnitude.
sample of international data from 1994 to 1998 Hui and Png (2003) conclude impact of piracy on CD sales was about 42% of industry estimates. Liebowitz (2004) studies the effects on annual trends in national record sales from 1973 to 2002 of various
income, music quality, markets for substitutes and complements, portability and “librarying” (replenishing album collections as formats change)these factors cannot fully explain declines in record sales over the period and
data, that digital file sharing has reduced aggregate record sales.
Recording Industry Association of America (RIAA). RIAA Releases 2001 Physical Anti
Research in Business and Economics Journal
The relation of prerecorded, Page 4
introduced a web site devoted to file sharing (which included song swapping). Song swappers now had a
By 2001 the RIAA claimed that worldwide the industry was losing over $4 billion a year to piracy.5
turned to the courts to ameliorate piracy losses. It sued sued
However, other web sites sprung up that allowed computer to computer file sharing without a central file server, Napster’s legal
peer (P2P) Internet file individual users of
y turned to technology to Digital
the user to one or a few copies of an from all the major record labels
began in 2002 at the web site Listen.com. Most of these songs were sold with some type of copy protection feature. For a brief time the recording industry experimented with a
h DRM sold for a lower price than songs with unlimited copying capability. Due to consumer backlash about the incompatibility of legally obtained DRM files with their listening devices the industry eventually gave up
and Apple began offering online music free of copying restrictions in April of 2007. The other major record labels soon followed suit. By 2008 the four major record labels: EMI, Sony/BMG, Warner and Universal as well as
ls offered most if not all of the songs in their music
prerecorded music was delivered in four formats, two of vinyl records
This technological demarcation provides a framework for data are consistent with the industry’s claims
Prior studies, which have (Liebowitz
Peitz and Waelbrock 2004,
Although generally supportive of the industry’s claims of piracy induced revenue , some empirical studies cast doubt on its magnitude. Using a
de that the impact of piracy on CD sales was about 42% of industry estimates. Liebowitz (2004) studies the effects on annual trends in national record sales from 1973 to 2002 of various
and complements, collections as formats change). He finds
these factors cannot fully explain declines in record sales over the period and deduces, reduced aggregate record sales.
Recording Industry Association of America (RIAA). RIAA Releases 2001 Physical Anti-Piracy Figures,
He finds a large increase in the sales of prerecorded albums in the cassette eraattributes to increased portabilityabsent piracy. Rob and Waldfogel (200and downloading, as well as consumers' valuations of these albums, among a sample of U.S. college students in 2003. purchases by at least 20%. Peitz and Waelbrock sales over the period 2000-2001 using data from 16 countries. downloading couldn’t have been responsible for more than 25% of the record sales decline. Zentner (2006) estimatepurchasing music using an individual2001. His results indicate that peerby 30 percent. Using National Income and Product Account data from 1990 to 2004, Stevans and Sessions (2005) consumer spending on tapes, LPs, and CDs through the priceFalling DVD prices have also served to reduce the demand ofsame period. They conclude music in aggregate, the probability of purchasing music (i.e., proportion of music legally purchased) is reduced. Liebowitzthe evidence strongly suggests that file sharing harms the recording industry
Most subsequent studies have supported this assertionExpenditure Survey data from 199usage on the demand for entertainment. He finds that fmagazines, books, video purchases, video rentals, movies, plays, operas, concertselectronic games and toys, the effectinsignificant. In contrast, a negative effect stillmusic, potentially reflecting the
Using a data set that includdemographic measures for 99 American cities over the period 1998(2008) examines the extent to which file sharing has caused the U.S. decline in soundrecording sales. He concludesin record sales and appears to have vitiated what otherwise would have been growth in the industry.
Oberholzer-Gee and Strumpffind that digital downloads have aThey analyze sample data of domestic music down loads over a 17 week period in the fall of 2002 and compared that activity with a that time period. They concludeare likely individuals who would not have bought the album even in the absence of file sharing.” In a working paper
The preponderance of empirical studies support recording industry revenues in the digital era, but not to the extent claimedclaims of piracy losses in the analog era haven’t been substantiatedstudy to date on the analog era
With one exception studies have focused onpiracy induced economic implications recording industry revenues mayfacilitated unauthorized copying, audio tapes expanded the market for prerecorded music by expanding its portability from the home to automobiles and anywhere a
Research in Business and Economics Journal
The relation of prerecorded, Page
He finds a large increase in the sales of prerecorded albums in the cassette eraattributes to increased portability and suggests that sales may have been more robust
and Waldfogel (2006) collect data on albums obtained via purchase and downloading, as well as consumers' valuations of these albums, among a sample of U.S. college students in 2003. They estimate that each album download reduces
Peitz and Waelbrock (2004) measure the change in record 2001 using data from 16 countries. They conclude that
downloading couldn’t have been responsible for more than 25% of the record sales estimates the effect of music downloads on the probability of
individual-level cross section of 15,000 people from that peer-to-peer usage reduces the probability of buying music
Using National Income and Product Account data from 1990 to 2004, find that music downloading, subsequent to 2000, affects
consumer spending on tapes, LPs, and CDs through the price elasticity of demand. also served to reduce the demand of recorded music during this
They conclude that while people who file-share typically purchase more music in aggregate, the probability of purchasing music (i.e., proportion of music legally
Liebowitz (2006) surveys the piracy literature and concludes that the evidence strongly suggests that file sharing harms the recording industry.
ubsequent studies have supported this assertion. Using Consumer from 1996 to 2002 Hong (2007) studies the effect of
usage on the demand for entertainment. He finds that for purchases of newspapersmagazines, books, video purchases, video rentals, movies, plays, operas, concerts
, the effect of Internet growth are small or statistically negative effect still remains significant for purchases
music, potentially reflecting the result of file sharing. includes album sales, Internet penetration, and various
demographic measures for 99 American cities over the period 1998-2003, Liebowitz examines the extent to which file sharing has caused the U.S. decline in sound
des that file sharing appears to have caused the entire decline in record sales and appears to have vitiated what otherwise would have been growth in
Gee and Strumpf’s (2007) results differ from previous studies. They that digital downloads have an insignificant effect on recording industry revenues.
They analyze sample data of domestic music down loads over a 17 week period in the fall of 2002 and compared that activity with a sample of United States released albums over that time period. They conclude that “While downloads occur on a vast scale, most users are likely individuals who would not have bought the album even in the absence of file
a working paper Liebowitz (2007) disputes their results. The preponderance of empirical studies support the contention that piracy harmed
recording industry revenues in the digital era, but not to the extent claimed. claims of piracy losses in the analog era haven’t been substantiated. The only e
on the analog era (Liebowitz, 2004) does not support the industry’s claimsstudies have focused on digital file sharing based piracy.
economic implications for taped music are not clear cut. Although recording industry revenues may have been diminished by audio tapes since they facilitated unauthorized copying, audio tapes expanded the market for prerecorded music by expanding its portability from the home to automobiles and anywhere a cassette player
Research in Business and Economics Journal
The relation of prerecorded, Page 5
He finds a large increase in the sales of prerecorded albums in the cassette era which he that sales may have been more robust ct data on albums obtained via purchase
and downloading, as well as consumers' valuations of these albums, among a sample of hey estimate that each album download reduces
4) measure the change in record hey conclude that
downloading couldn’t have been responsible for more than 25% of the record sales ads on the probability of
level cross section of 15,000 people from Europe in peer usage reduces the probability of buying music
Using National Income and Product Account data from 1990 to 2004, to 2000, affects
elasticity of demand. recorded music during this
share typically purchase more music in aggregate, the probability of purchasing music (i.e., proportion of music legally
concludes that .
Consumer studies the effect of Internet
newspapers, magazines, books, video purchases, video rentals, movies, plays, operas, concerts,
Internet growth are small or statistically purchases recorded
netration, and various Liebowitz
examines the extent to which file sharing has caused the U.S. decline in sound-used the entire decline
in record sales and appears to have vitiated what otherwise would have been growth in
results differ from previous studies. They ffect on recording industry revenues.
They analyze sample data of domestic music down loads over a 17 week period in the fall released albums over
ile downloads occur on a vast scale, most users are likely individuals who would not have bought the album even in the absence of file
the contention that piracy harmed The RIAA’s
The only empirical not support the industry’s claims.
digital file sharing based piracy. The taped music are not clear cut. Although
have been diminished by audio tapes since they facilitated unauthorized copying, audio tapes expanded the market for prerecorded music
cassette player
could be heard. Furthermore, whad a much less pronounced effect on record label revenues. Audio taping had a much smaller pool of potential music “sharers.” number of people willing to share their music files,a physical copy from a personal acquaintance, who may have had a limited library of albums. The capacity of a person making an audio copy of a song to pass that song along to others is greatly diminished because of sound degradation in copying. of the natural damping effect in audio taping that is not present in file sharingobserver would have grounds to believe that the revenue losses attributable to piracy in the 1970s
The goal of this paper is to assess whether the data are consistent with the domestic recording industry’s piracy loss claims in both the digital and analog eras. Its contribution to the literature on music piracy is primarily its scope. It studies the potential of piracy effects on consumption and conditioned on prerecorded music media format, since record labels have had the legal standing to fidifferences in scaled recording industry revenues between piracy friendly and unfriendly eras would support the industry’s claims. Any lack of significant change across piracy friendly and unfriendly eras would cast
In many prior studies prevenues via the elimination of other causesmarkets for substitutes and complements, portability, libraryingThis study examines another spending. The recording industry’s trends in consumer spending on recreational goods and services. prerecorded music during piracy eras may spending on recreational goods and services
MEDIA FORMAT AND PIRACY POTENTIAL
Studies supporting and refuting consumer piracy
have mainly focused on the effect on record sales of phenomena that became significant with the appearance of Napsanother change in technology, tape recording, aroused the recording industry’s piracy fears as far back as 1971, when it convinced Congress to strengthen copyright protection law. From this date forward there have been periods where piracy was readily available to consumers (cassettes and P2P file sharing) as well as periods when the predominant forms of 1999) were not easily susceptible to home recording. attributed to file sharing on the However, during the tape era the industry thought piracy was a sufficient enough issue to warrant legislative action. The partitioning of data based on piracy friendliness can shedlight on current piracy studiessimilar effect occur in the tape era? industry’s claims of longstanding
In order to put RIAA’s claims of the effect of piracy loss on revenues into perspective, the metric used is recording revenues expressed as a percentage of personal consumption in the United States
Research in Business and Economics Journal
The relation of prerecorded, Page
. Furthermore, when compared to file sharing audio taping should have had a much less pronounced effect on record label revenues. Audio taping had a much smaller pool of potential music “sharers.” Internet based piracy is delimited only by the
o share their music files, whereas audio taping requirea physical copy from a personal acquaintance, who may have had a limited library of albums. The capacity of a person making an audio copy of a song to pass that song
tly diminished because of sound degradation in copying. natural damping effect in audio taping that is not present in file sharing
observer would have grounds to believe that the magnitude of the RIAA’s claims of attributable to piracy in the 1970s was an exaggeration.
The goal of this paper is to assess whether the data are consistent with the domestic recording industry’s piracy loss claims in both the digital and analog eras. Its
on music piracy is primarily its scope. It studies the piracy effects on domestic record label revenues, scaled for personal
consumption and conditioned on prerecorded music media format, since record labels have had the legal standing to file suit for copyright violations. The finding of significant differences in scaled recording industry revenues between piracy friendly and unfriendly eras would support the industry’s claims. Any lack of significant change across piracy
iendly eras would cast doubt on the industry’s claims. any prior studies piracy has been surmised as a source of reduced
revenues via the elimination of other causes (album prices, income, music quality, markets for substitutes and complements, portability, librarying, and internet usage
examines another potential explanation for dips in prerecorded music The recording industry’s piracy claims is analyzed against the backdrop of
trends in consumer spending on recreational goods and services. Reduced spending on prerecorded music during piracy eras may have been a component of reduced overall spending on recreational goods and services.
ORMAT AND PIRACY POTENTIAL
Studies supporting and refuting consumer piracy’s effect on record label revenues have mainly focused on the effect on record sales of illegal digital downloading, a phenomena that became significant with the appearance of Napster in 1999. However another change in technology, tape recording, aroused the recording industry’s piracy fears as far back as 1971, when it convinced Congress to strengthen copyright protection law. From this date forward there have been periods where technology easily facilitating piracy was readily available to consumers (cassettes and P2P file sharing) as well as periods when the predominant forms of prerecorded music (vinyl records, CDs
) were not easily susceptible to home recording. Declining recorded music sales to file sharing on the Internet spurred the recording industry to legal action.
However, during the tape era the industry thought piracy was a sufficient enough issue to action. The partitioning of data based on piracy friendliness can shed
studies. If recorded music sales slumped in the digital era, did a similar effect occur in the tape era? Finding similar effects would be consistent with th
longstanding piracy induced revenue losses. In order to put RIAA’s claims of the effect of piracy loss on revenues into
perspective, the metric used is recording revenues expressed as a percentage of personal tates. The RIAA’s claims of piracy are based on
Research in Business and Economics Journal
The relation of prerecorded, Page 6
audio taping should have had a much less pronounced effect on record label revenues. Audio taping had a much
delimited only by the audio taping requires getting
a physical copy from a personal acquaintance, who may have had a limited library of albums. The capacity of a person making an audio copy of a song to pass that song
tly diminished because of sound degradation in copying. Because natural damping effect in audio taping that is not present in file sharing an unbiased
RIAA’s claims of
The goal of this paper is to assess whether the data are consistent with the domestic recording industry’s piracy loss claims in both the digital and analog eras. Its
on music piracy is primarily its scope. It studies the record label revenues, scaled for personal
consumption and conditioned on prerecorded music media format, since record labels The finding of significant
differences in scaled recording industry revenues between piracy friendly and unfriendly eras would support the industry’s claims. Any lack of significant change across piracy
source of reduced industry album prices, income, music quality,
and internet usage). potential explanation for dips in prerecorded music
analyzed against the backdrop of Reduced spending on
reduced overall
’s effect on record label revenues digital downloading, a
ter in 1999. However another change in technology, tape recording, aroused the recording industry’s piracy fears as far back as 1971, when it convinced Congress to strengthen copyright protection
technology easily facilitating piracy was readily available to consumers (cassettes and P2P file sharing) as well as
s, CDs before eclining recorded music sales
legal action. However, during the tape era the industry thought piracy was a sufficient enough issue to
action. The partitioning of data based on piracy friendliness can shed . If recorded music sales slumped in the digital era, did a
Finding similar effects would be consistent with the
In order to put RIAA’s claims of the effect of piracy loss on revenues into perspective, the metric used is recording revenues expressed as a percentage of personal
are based on downward
trends of recording revenues. However, record sales $6 million in 1933. During the same time frame personal consumption fell from $77.4 billion to $45.9 billion. The downward trend in record sales was caused by spending patterns due to an overall reduction in personal consumption in the United States during the Depression.
To determine if the data necessary. Under the assumption that music would have remained a constant percentage of personal consumption, care made of record sales (as a percentage of recording/downloading friendliness (cassettes recording (vinyl records and CDs). would not be supportive of the RIAA’s piracy claimsbetween the populations (condition 1lower recording revenues as a percentage of personal consumption in periods where home recording was readily available compared to periods where it wasconsistent with the RIAA’s contention that consumer piracy hurt revenuesIf condition 2 holds, further comparisons can be made between like periods with respect to home recording friendliness. Finding no significant differencebetween the vinyl record and CD periods as well as would indicate no significant change of record sales purchases consumption) within like home recording capability periodrecord sales purchases occurred during periods when readily available technology facilitated home recording (condition 3)
Even if the results indicate significant drops in purchases of music during piracy friendly eras, record label losses ascribed to piracy could be explained asdownturns in spending on recreational goods and servicesexplanation comparisons are made of consumer recording/downloading friendliness to periods not amenable to home recording/downloading. Finding no significant dropsduring the piracy friendly eras view that piracy, as opposed to ddeclining record sales (condition 4). spending in piracy friendly eras compared to piracy unfriendly eras would support the view that all or a portion of losses consumer recreational spending patterns.
The Data and Method of Analysis
Since the focus of this study is on piracy in the United States, the relevant
analytical time span is from 1972 tothe first year record labels had the legal status to prosecute copyright offenders. sample ends in 2009. Data are derived from the RIAA on annual domestic record sales.Personal consumption and recreational spending Bureau of Economic Analysis.
6 The RIAA data is based on suggested retail prinstances.
Research in Business and Economics Journal
The relation of prerecorded, Page
trends of recording revenues. However, record sales dropped from $75 million in 1929 to $6 million in 1933. During the same time frame personal consumption fell from $77.4
lion. The downward trend in record sales was caused by shifts in an overall reduction in personal consumption in the United
States during the Depression. To determine if the data supports the RIAA’s claims four conditions are
Under the assumption that without piracy consumer spending on prerecorded music would have remained a constant percentage of personal consumption, c
as a percentage of personal consumption) in periods of home friendliness (cassettes and P2P) to periods not amenable to home
s and CDs). Finding no significant difference across all four eras would not be supportive of the RIAA’s piracy claims. If there are significant di
condition 1), further tests can be made. Finding significantrecording revenues as a percentage of personal consumption in periods where
home recording was readily available compared to periods where it wasn’t wconsistent with the RIAA’s contention that consumer piracy hurt revenues (condition 2)
, further comparisons can be made between like periods with respect to home recording friendliness. Finding no significant differences in relative record sales
and CD periods as well as between the cassette and P2P periods would indicate no significant change of record sales purchases (relative to personal
within like home recording capability periods. The significant shifts in record sales purchases occurred during periods when readily available technology
(condition 3). Even if the results indicate significant drops in purchases of music during piracy
d label losses ascribed to piracy could be explained as a component of spending on recreational goods and services. To test this potential
comparisons are made of consumer recreational spending in periods of home ding friendliness to periods not amenable to home
Finding no significant drops in consumer recreational spendingduring the piracy friendly eras compared to piracy unfriendly eras would support the view that piracy, as opposed to drops in recreational spending, was a potential cause of declining record sales (condition 4). Finding significantly lower consumer recreational spending in piracy friendly eras compared to piracy unfriendly eras would support the
of losses ascribed to piracy could be explained by shifts in consumer recreational spending patterns.
The Data and Method of Analysis
ince the focus of this study is on piracy in the United States, the relevanttime span is from 1972 to 2009. The study commences in 1972 since that was
the first year record labels had the legal status to prosecute copyright offenders. Data are derived from the RIAA on annual domestic record sales.
recreational spending data are obtained from the United States Bureau of Economic Analysis.
The RIAA data is based on suggested retail prices, which may be higher than actual sales prices in some
Research in Business and Economics Journal
The relation of prerecorded, Page 7
from $75 million in 1929 to $6 million in 1933. During the same time frame personal consumption fell from $77.4
shifts in an overall reduction in personal consumption in the United
are piracy consumer spending on prerecorded
music would have remained a constant percentage of personal consumption, comparisons in periods of home
P2P) to periods not amenable to home Finding no significant difference across all four eras
If there are significant differences Finding significantly
recording revenues as a percentage of personal consumption in periods where would be (condition 2).
, further comparisons can be made between like periods with respect in relative record sales
the cassette and P2P periods (relative to personal
s. The significant shifts in record sales purchases occurred during periods when readily available technology
Even if the results indicate significant drops in purchases of music during piracy a component of
potential spending in periods of home
consumer recreational spending would support the
rops in recreational spending, was a potential cause of Finding significantly lower consumer recreational
spending in piracy friendly eras compared to piracy unfriendly eras would support the could be explained by shifts in
ince the focus of this study is on piracy in the United States, the relevant since that was
the first year record labels had the legal status to prosecute copyright offenders. The data Data are derived from the RIAA on annual domestic record sales.6
obtained from the United States
ices, which may be higher than actual sales prices in some
During this period advances in technology forms of song delivery: vinyl recorddownloadable songs. Technology also provided consumers with P2P Vinyl records were introduced introduced in 1967, but it was 198form of prerecorded music sales.cassettes, the recording industry introduced CDs in 1983. Reduced equipment cost and increased reliability enabled the sales of CDs to surpass cassettessubsequent web sites appeared Internet (P2P). To characterize eras where record sales were most susceptible to piracy, they are stratified by period based on the medium that wasmechanism of prerecorded music Table 1, Appendix). The periods selected for comparison in this study are: (1972-1983), cassette tapes (1984
In each of these categorized erasrecords were produced by offshore plants. Cassettes could be copied to other cassettes. CDs could be weren’t readily copyable to other CDs until the standard on personal computers. CD eras by when they became the predominant delivery mewere introduced is the presumption that equipment would be necessary For instance, cassette sales werethe RIAA in 1967, but by 1972, the first year of this study, they comprised sales, vinyl records still accounted for cassette form, most purchasers of music preferred the words, the data seems to be saying that there wasn’t much incentive for most music listeners to pirate a cassette tape, they preferredmusic purchases were cassettes. At this point the majority of music listeners had adapted to cassettes and had the capacity
As previously mentioned four conditions are necessary for the data to support the RIAA’s piracy claims. These condformat the data provide four distinct populations. consumer purchases of prerecorded music as a percentage of personal consumption would have remained constant oprocedure is employed to test the of personal consumption are similar across hypothesis would not be suppoconsumption, revenues were appreciably smaller in the P2P eras compared to the piracy unfriendly hypothesis is rejected (condition 1)will be used to pair wise compare the four eras. significantly higher mean sales as a percentage of personal consumption compared totapes and P2P (condition 2), and if
7 Source: RIAA Market Research Committee
8 Source: RIAA Market Research Committee
Research in Business and Economics Journal
The relation of prerecorded, Page
advances in technology provided the recording industry vinyl records (primarily LPs), cassette tapes, CDs and Technology also provided consumers with P2P file sharing
s were introduced commercially in the late 1940s. Cassette tapes were , but it was 1984 before they replaced vinyl records as the predominant
form of prerecorded music sales.7 To combat the inherent piracy capabilities of cassettes, the recording industry introduced CDs in 1983. Reduced equipment cost and
reliability enabled the sales of CDs to surpass cassettes in 1991.8 Napster appeared in 1999 and allowed individuals to share songs on the
(P2P). To characterize eras where record sales were most susceptible to piracy, are stratified by period based on the medium that was the predominant delivery
mechanism of prerecorded music or where P2P file sharing was readily accessibleThe periods selected for comparison in this study are: vinyl record
(1984-1990), CDs (1991-1998) and P2P (1999-200In each of these categorized eras piracy existed to some extent. Counterfeit vinyl
records were produced by offshore plants. Vinyl records could be copied to cassettes. Cassettes could be copied to other cassettes. CDs could be copied to cassettes. CDs
able to other CDs until the early 2000s when this feature became personal computers. The reason for categorizing the vinyl record
CD eras by when they became the predominant delivery media as opposed to when they the presumption that a critical mass of users with the appropriate
necessary for piracy to have a meaningful effect on record saleswere of sufficient magnitude to be separately categorized
, but by 1972, the first year of this study, they comprised only still accounted for 72%. (Table 1, Appendix). Although available in purchasers of music preferred the vinyl record format. In other
words, the data seems to be saying that there wasn’t much incentive for most music pirate a cassette tape, they preferred vinyl records. By 1984 over half of all
were cassettes. At this point the majority of music listeners had adapted and had the capacity to copy an LP or a cassette.
As previously mentioned four conditions are necessary for the data to support the These conditions are tested in several steps. Based on delivery
format the data provide four distinct populations. Under the assumption that absent piracy consumer purchases of prerecorded music as a percentage of personal consumption would have remained constant over the period 1972-2009, the Kruskal-Wallis
is employed to test the null hypotheses that mean record sales as a percentage are similar across the populations. Acceptance of the null
hypothesis would not be supportive of the RIAA’s claims that, when scaled by personal revenues were appreciably smaller in the piracy friendly cassette
compared to the piracy unfriendly vinyl record and CD eras. If the null (condition 1), then least squared differences (LSD) tests
wise compare the four eras. If vinyl records and CDs have mean sales as a percentage of personal consumption compared to
, and if no significant differences are found in mean sales as a
Source: RIAA Market Research Committee Manufacturers Unit Shipments 1978-1989.
Source: RIAA Market Research Committee Manufacturers Unit Shipments 1990-1999.
Research in Business and Economics Journal
The relation of prerecorded, Page 8
provided the recording industry four and
haring. in the late 1940s. Cassette tapes were
as the predominant To combat the inherent piracy capabilities of
cassettes, the recording industry introduced CDs in 1983. Reduced equipment cost and Napster and
individuals to share songs on the (P2P). To characterize eras where record sales were most susceptible to piracy,
the predominant delivery where P2P file sharing was readily accessible (see
vinyl records 2009).
Counterfeit vinyl Vinyl records could be copied to cassettes.
copied to cassettes. CDs this feature became vinyl record, tape and
as opposed to when they with the appropriate
on record sales. separately categorized by
only 28 % of Although available in format. In other
words, the data seems to be saying that there wasn’t much incentive for most music s. By 1984 over half of all
were cassettes. At this point the majority of music listeners had adapted
As previously mentioned four conditions are necessary for the data to support the itions are tested in several steps. Based on delivery
Under the assumption that absent piracy consumer purchases of prerecorded music as a percentage of personal consumption
Wallis rank sum record sales as a percentage Acceptance of the null
, when scaled by personal cassette tape and If the null
(LSD) tests on ranks have
mean sales as a percentage of personal consumption compared to significant differences are found in mean sales as a
percentage of personal consumption when comparing P2P (condition 3) these results would be consistent with consumer piracy hurt record sales.
If significant recreational spending downturns occur on the same cycles as downturns for prerecorded music purchases, then one possible explanation for piracy losses is that they were a component of reduced consumer recreational spending.Kruskal-Wallis rank sum test and services spending as a percentage of personal consumption is similar across the piracy friendly and unfriendly periods.that reduced record label revenues in piracy friendly eras wrecreational spending. If the null hypothesis is rejecteddifferences (LSD) tests will be used to pair wise compare the four eras. in recreational spending coinciding with the tape and P2P erasreduced music purchases in the piracy friendly eras were not part of downturns in recreational spending (condition 4)
Prerecorded Music Format
According to the RIAA, record sales increased from $1,924,000,000 in 1972 to a
peak of $14,584,700,000 in 1999 and declined to $Appendix). According to the Bureau of Economic Analysis during this same time period personal consumption expenditures in the United States increased from $770,600,000,000 in 1972 to $10,088,549,000,000 in 200record sales varied from a high of 0.2Appendix). During this 38 year span, the year of the lowest dollar value of record sales, 1972, had the 35th highest percentage of record sales to personal consumption, and the year with the highest dollar sales, 1999need to normalize record sales with respect to personal consumption to gauge any significant movement in record sales caused by factors spending.
Figure 1 (Appendix) displays record sales as a percentage of personal consumption from 1972 to 200sloping, the sub-trends in the graph support the view thatoverall in the piracy friendly the piracy unfriendly vinyl record data are supportive of this observation. Both in terms of mean record sales as a percentage of personal consumption and rank, record sales in the cassette (0.1771%,13.43) and P2P (0.1(0.2268%, 26.58) and CD (0.228
The first hypothesis tested is that consumption in all four eras is hypothesis is rejected at the 99% confidence level (Table the raw data, the test rejects the assertion that statistically equivalent across all four eras
To determine if the data are supportive of the RIAA’s claims two further sets of hypotheses are tested using Fisher’s Least Significant Difference (LSD) procedureranked data. The first set tested is that the unfriendly eras (vinyl records
Research in Business and Economics Journal
The relation of prerecorded, Page
percentage of personal consumption when comparing vinyl records to CDs and tapes to these results would be consistent with the RIAA’s contention that
record sales. f significant recreational spending downturns occur on the same cycles as
downturns for prerecorded music purchases, then one possible explanation for piracy losses is that they were a component of reduced consumer recreational spending.
test is employed to test the hypothesis that recreational goods spending as a percentage of personal consumption is similar across the
piracy friendly and unfriendly periods. Acceptance of the null hypothesis would that reduced record label revenues in piracy friendly eras weren’t part of changes in recreational spending. If the null hypothesis is rejected then ranked least squared differences (LSD) tests will be used to pair wise compare the four eras. Finding
coinciding with the tape and P2P eras would indicatreduced music purchases in the piracy friendly eras were not part of downturns in
(condition 4).
Format
the RIAA, record sales increased from $1,924,000,000 in 1972 to a 00,000 in 1999 and declined to $7,686,000,000 in 2009 (Table 1
. According to the Bureau of Economic Analysis during this same time period penditures in the United States increased from $770,600,000,000
,000,000 in 2009. As a percentage of personal consumption, high of 0.29% in 1978 to a low of 0.08% in 2009 (Figure year span, the year of the lowest dollar value of record sales,
highest percentage of record sales to personal consumption, and the year with the highest dollar sales, 1999, ranked 26th in percentage. This exemplifies the
alize record sales with respect to personal consumption to gauge any significant movement in record sales caused by factors other than changes in personal
displays record sales as a percentage of personal 72 to 2009. Although the overall trend of record sales is downward
trends in the graph support the view that relative record sales were lower piracy friendly cassette tape (1984-1990) and P2P (1999-2009) periods than
vinyl record (1972-1983) and CD (1991-1998) periods. data are supportive of this observation. Both in terms of mean record sales as a percentage of personal consumption and rank, record sales in the cassette tape
and P2P (0.1484%, 9.55) eras are lower than in the vinyl record ) and CD (0.2280%,27.88) eras (Tables 2 and 3, Appendix).
The first hypothesis tested is that the mean percentage of record sales to personal all four eras is the same. Using the Kruskal Wallis rank sum test, t
hypothesis is rejected at the 99% confidence level (Table 3, Appendix). Consistent with the raw data, the test rejects the assertion that ranked relative record label revenues were
valent across all four eras (condition 1). To determine if the data are supportive of the RIAA’s claims two further sets of
using Fisher’s Least Significant Difference (LSD) procedure. The first set tested is that the ranked mean relative record sales in the piracy
vinyl records, CDs) should be higher than the piracy friendly eras
Research in Business and Economics Journal
The relation of prerecorded, Page 9
CDs and tapes to RIAA’s contention that
f significant recreational spending downturns occur on the same cycles as downturns for prerecorded music purchases, then one possible explanation for piracy losses is that they were a component of reduced consumer recreational spending. The
the hypothesis that recreational goods spending as a percentage of personal consumption is similar across the
Acceptance of the null hypothesis would indicate ’t part of changes in
least squared nding no dips
indicate that reduced music purchases in the piracy friendly eras were not part of downturns in
the RIAA, record sales increased from $1,924,000,000 in 1972 to a (Table 1,
. According to the Bureau of Economic Analysis during this same time period penditures in the United States increased from $770,600,000,000
. As a percentage of personal consumption, (Figure 1,
year span, the year of the lowest dollar value of record sales, highest percentage of record sales to personal consumption, and the
in percentage. This exemplifies the alize record sales with respect to personal consumption to gauge any
changes in personal
displays record sales as a percentage of personal . Although the overall trend of record sales is downward
record sales were lower ) periods than
1998) periods. The raw data are supportive of this observation. Both in terms of mean record sales as a
tape vinyl record
. percentage of record sales to personal
Using the Kruskal Wallis rank sum test, this ). Consistent with
relative record label revenues were
To determine if the data are supportive of the RIAA’s claims two further sets of using Fisher’s Least Significant Difference (LSD) procedure on the
mean relative record sales in the piracy than the piracy friendly eras (tapes,
P2P). Finding the null hypotheses true would be consistent with the RIAA’s contthat piracy usurped record salesthe ranked mean percentages of piracy alike eras (are the same. If the percentages are statistically equivalent, this finsupport the view that shifts in record sales as a percentage of personal consumption across time are related to changes in consumer accessibility to recording technology(condition 3). Table 4 (Appendix) level.
The difference in the mean ranking of than the LSD statistic (10.10) indicating that relative record sales were statistically larger in the vinyl than cassette era. difference in mean ranking (17.04that relative record sales were statistically larger in the results support the view that record sacassette and P2P eras when compared to the
The results have similar implications when CDs are compared to The mean ranked difference of CDs and (10.99) signifying that relative record sales were statistically larger in the CD than cassette era. When CDs are measured against (18.33) is larger than the LSD statistic (statistically larger in the CD than P2P era. These results are consistent with the proposition that record sales percentages were lower in the copy friendly cassette and P2P eras than the copy unfriendly equivalent mean percentages within the and P2P eras would be consistent with shifts in technology that facilitated
If prerecorded musicthe mean percentage of record sales to personal consumption during the would differ from the CD era since they were both recording unfrienpercentages would differ between the recording friendly cassette and P2P eras. The difference of record sales to personal consumption for much smaller than the LSD statistic (9.the same in the two eras. The compared to P2P era (3.88), is smaller than the LSD statistic (10.statistical difference in relative record sales betweesupport the view that there was no significant movement of record sales purchases within like home recording capability periods. The significant purchases occurred during periods whenrecording (condition 3).
This study supports the contention that relative record label revenues were lower in piracy friendly cassette and P2P eras than the piracy unfriendly vinyl record and CD eras. The digital (P2P) finding is consistent RIAA’s claim that piracy was facilitated copyrighted songs on the Internetsupportive of the RIAA’s piracy contention but differs from Liebowitz’ (2004) findings.
Research in Business and Economics Journal
The relation of prerecorded, Page
. Finding the null hypotheses true would be consistent with the RIAA’s contthat piracy usurped record sales (condition 2). The second hypothesis set tested is that
percentages of piracy alike eras (tapes and P2P, vinyl recordare the same. If the percentages are statistically equivalent, this finding would further support the view that shifts in record sales as a percentage of personal consumption across time are related to changes in consumer accessibility to recording technology
(Appendix) contains the results of the tests at the 99% confidence
difference in the mean ranking of vinyl records and tapes (13.15) is greater ) indicating that relative record sales were statistically larger
era. When vinyl records are compared to the P2P era the 17.04) is larger than the LSD statistic (8.86) and indicates
that relative record sales were statistically larger in the vinyl record than P2P era. These results support the view that record sales significantly dropped in the piracy friendly cassette and P2P eras when compared to the vinyl record era.
The results have similar implications when CDs are compared to tapes of CDs and tapes (14.45) is larger than the LSD statistic
that relative record sales were statistically larger in the CD than measured against the P2P era the difference in mean ranking
) is larger than the LSD statistic (9.86) and signifies that relative record sales were statistically larger in the CD than P2P era. These results are consistent with the proposition that record sales percentages were lower in the copy friendly cassette and
unfriendly vinyl record and CD eras (condition 2). The finding of percentages within the vinyl record and CD eras as well as the cassette
be consistent with the claim that shifts in record sales accompanied facilitated home recording.
ed music sales are affected by piracy there is no reason to suspect that percentage of record sales to personal consumption during the vinyl record
would differ from the CD era since they were both recording unfriendly, or that the percentages would differ between the recording friendly cassette and P2P eras. The
ecord sales to personal consumption for vinyl records and CDs (much smaller than the LSD statistic (9.69) indicating that relative record revenues were
. The difference in ranked relative sales percentage for is smaller than the LSD statistic (10.26), indicating no
statistical difference in relative record sales between the two eras. Overall, these results support the view that there was no significant movement of record sales purchases within like home recording capability periods. The significant downward shifts in record sales purchases occurred during periods when readily available technology facilitated home
This study supports the contention that relative record label revenues were lower in piracy friendly cassette and P2P eras than the piracy unfriendly vinyl record and CD
ital (P2P) finding is consistent with previous studies and supports was facilitated due to the ease of illegal distribution of Internet. The reduction of revenues in the cassette era is
supportive of the RIAA’s piracy contention but differs from Liebowitz’ (2004) findings.
Research in Business and Economics Journal
The relation of prerecorded, Page 10
. Finding the null hypotheses true would be consistent with the RIAA’s contention . The second hypothesis set tested is that
vinyl records and CDs) ding would further
support the view that shifts in record sales as a percentage of personal consumption across time are related to changes in consumer accessibility to recording technology
at the 99% confidence
) is greater ) indicating that relative record sales were statistically larger
s are compared to the P2P era the ) and indicates
than P2P era. These friendly
tapes and P2P. the LSD statistic
that relative record sales were statistically larger in the CD than the P2P era the difference in mean ranking
that relative record sales were statistically larger in the CD than P2P era. These results are consistent with the proposition that record sales percentages were lower in the copy friendly cassette and
. The finding of and CD eras as well as the cassette
the claim that shifts in record sales accompanied
sales are affected by piracy there is no reason to suspect that vinyl record era
dly, or that the percentages would differ between the recording friendly cassette and P2P eras. The rank
CDs (1.29) is tive record revenues were sales percentage for tapes
), indicating no Overall, these results
support the view that there was no significant movement of record sales purchases within shifts in record sales
readily available technology facilitated home
This study supports the contention that relative record label revenues were lower in piracy friendly cassette and P2P eras than the piracy unfriendly vinyl record and CD
with previous studies and supports the due to the ease of illegal distribution of
revenues in the cassette era is supportive of the RIAA’s piracy contention but differs from Liebowitz’ (2004) findings.
Recreational Goods and Services
The above results indicate that the data supports the RIAA’s contention that
piracy occurred during the tape and P2P eras. spending downturns occur on the same cycles as downturns for prerecorded music purchases, then one possible explanation for piracy losses is that they were a component of reduced consumer recreational spending.during the tape and P2P eras friendly eras were not part of downturns in recreational spending
As noted in the previous s1983) and CD (1991-1998) periods and troughs in the piracy friendly cassette tape (19841990) and P2P (1999-2009) periodsgoods and services has an asc4.47% of personal consumption expenditures in (Figure 2, Table 5, Appendixpurchases during the tape and P2P eras were part of downturns in consumer spending on recreation.
The Kruskal Wallis test is used to determine if the mean percentage of recreational spending to personal consumption in all four eras is the same. Using the rank sum test, this hypothesis is rejected at the 99% confidence level (Table 6Appendix).
As indicated by the raw data, recreational spending has an upward trend over the time frame of the study. There are no dips co(1984-1990) and P2P (1998-2009piracy friendly eras were not part of downturns in recreational spending. The Least Significant Difference (LSD) procedure on the ranked confirms this. The null hypotheses that relative recreational spending over the time periods of the study are equal is rejected for all comparisons (Table 7). In all comparisons later recreational expenditures are higher than earlier ones and difference between the ranked relative recreational expenditures is greater than the LSD statistic when comparing earlier periods to later periods, indicating that recreational expenditures as a percent of personal consumption increased over time. For example when comparing recreational expenditures between the records (1972(1984-1990) eras, the ranked tape mean (16.00) is greater than the ranked records mean (6.50) and the difference (9.50) is greater than the LSD statistic, indicating that recreational expenditures were statistically higher in 1984same principle applies to all periods examined. that record label losses ascribed to piracy recreational goods and services
Summary and conclusions
The recording industryhome recording and file sharinghas reduced domestic record sales. digital downloading of music finds that the underlying data meets the necessary conditions piracy claims for both the tape and digital eras
Research in Business and Economics Journal
The relation of prerecorded, Page
Recreational Goods and Services
The above results indicate that the data supports the RIAA’s contention that ing the tape and P2P eras. However, if significant recreational
downturns occur on the same cycles as downturns for prerecorded music purchases, then one possible explanation for piracy losses is that they were a component
eational spending. Finding no drops in recreational spending would indicate that reduced music purchases in the piracy
friendly eras were not part of downturns in recreational spending (condition 4)As noted in the previous section record sales had peaks in the vinyl record (1972
1998) periods and troughs in the piracy friendly cassette tape (19842009) periods. In contrast, consumer spending on recreational
goods and services has an ascending trend over the time frame of the study, going from % of personal consumption expenditures in the record era to 6.62% in the P2P era
, Appendix). It does not appear that downturns in prerecorded music and P2P eras were part of downturns in consumer spending on
Wallis test is used to determine if the mean percentage of recreational spending to personal consumption in all four eras is the same. Using the rank sum test, this hypothesis is rejected at the 99% confidence level (Table 6
the raw data, recreational spending has an upward trend over the time frame of the study. There are no dips coinciding with the piracy friendly tape
2009) eras, indicating that reduced music purchases in the were not part of downturns in recreational spending. The
Least Significant Difference (LSD) procedure on the ranked recreational spending data The null hypotheses that relative recreational spending over the time tudy are equal is rejected for all comparisons (Table 7). In all
later recreational expenditures are higher than earlier ones and the difference between the ranked relative recreational expenditures is greater than the LSD
ring earlier periods to later periods, indicating that recreational expenditures as a percent of personal consumption increased over time. For example when comparing recreational expenditures between the records (1972-1983) and tape
ranked tape mean (16.00) is greater than the ranked records mean (6.50) and the difference (9.50) is greater than the LSD statistic, indicating that
were statistically higher in 1984-1990 than 1972-1983. This es to all periods examined. The data does not support the contention
record label losses ascribed to piracy are a component of downturns in spending on recreational goods and services (condition 4).
The recording industry asserts that the introduction of technology facilitating and file sharing, most notably cassette tapes and peer-to-peer file sharing,
record sales. Most previous studies of the effect of unauthorized g of music on album sales have confirmed this claim. This study
that the underlying data meets the necessary conditions to support the RIAA’s piracy claims for both the tape and digital eras. Using data from 1972 (when piracy
Research in Business and Economics Journal
The relation of prerecorded, Page 11
The above results indicate that the data supports the RIAA’s contention that if significant recreational
downturns occur on the same cycles as downturns for prerecorded music purchases, then one possible explanation for piracy losses is that they were a component
rops in recreational spending that reduced music purchases in the piracy
(condition 4). ection record sales had peaks in the vinyl record (1972-
1998) periods and troughs in the piracy friendly cassette tape (1984-In contrast, consumer spending on recreational
ending trend over the time frame of the study, going from the record era to 6.62% in the P2P era
downturns in prerecorded music and P2P eras were part of downturns in consumer spending on
Wallis test is used to determine if the mean percentage of recreational spending to personal consumption in all four eras is the same. Using the rank sum test, this hypothesis is rejected at the 99% confidence level (Table 6,
the raw data, recreational spending has an upward trend over the with the piracy friendly tape
indicating that reduced music purchases in the were not part of downturns in recreational spending. The Fisher’s
recreational spending data The null hypotheses that relative recreational spending over the time tudy are equal is rejected for all comparisons (Table 7). In all
the difference between the ranked relative recreational expenditures is greater than the LSD
ring earlier periods to later periods, indicating that recreational expenditures as a percent of personal consumption increased over time. For example
1983) and tape ranked tape mean (16.00) is greater than the ranked records mean
(6.50) and the difference (9.50) is greater than the LSD statistic, indicating that 1983. This
The data does not support the contention a component of downturns in spending on
asserts that the introduction of technology facilitating peer file sharing,
tudies of the effect of unauthorized This study
the RIAA’s Using data from 1972 (when piracy
prosecution under copyright law was mean record sales as a percentage of personal consumption to be during the vinyl record and CD eras, when sound recording equipment was not adopted by consumers, than the cassette tape and peereras, when recording/downloading no significant difference in the meduring the vinyl record and CD eras, which are both home recording unfriendly, and no significant differences in the percentages in the home recording friendly cassette and P2P eras. These latter results are consistent with the argument that no signirecord sales purchases within like home recording capability periodssignificant shifts in record sales purchases occurred during periods when technology facilitated home recordingin the piracy friendly eras was not part of a larger phenomenon of changing patterns in consumer recreational spending, eliminating another potential factor that could have explained piracy.
It must be noted that these resultthan piracy may have contributed to downturns in relative record label revenues. most previous studies, this study recording industry revenues. recording industry’s claims.
REFERENCES
Burke, A. E. (1996). How effective are industry,” Journal of Cultural Economics
Farwell, J. (2003). The evolution of audio devices from the first recording of “Mary had a little lamb” to CDs and MPs,
Hong S.-H. (2007). The recent growth of the internet and changesdemand for entertainmen
Hui, K.-L., & Png, I. (2003Contributions to Economic Analysis and Policy
Liebowitz, S. (2004). Will MP3 downloads so far. In Advances in the Study of Entrepreneurship, Innovation, and Economic
Growth, edited by G. Liebowitz, S, (2006). File sharing:
Journal of Law and Economics
Liebowitz, S, (2007). How Reliable is the OberholzerSharing? Working paper
Liebowitz, S. (2008). Testing file sharing’s impact on music album sales in cities, Management Science,
Menell, P. S. (2002). Envisioning Law School Law Review
Oberholzer-Gee, F., & Stumpf,empirical analysis,” Journal of Political Economy,
Peitz, M., & Waelbroeck, P. section evidence. Review of Economic Research on Cop
Research in Business and Economics Journal
The relation of prerecorded, Page
prosecution under copyright law was standardized nationally) to 2009 this study frecord sales as a percentage of personal consumption to be statistically
and CD eras, when sound recording equipment was not consumers, than the cassette tape and peer-to-peer internet song swapping recording/downloading capability was readily available. This study also finds
no significant difference in the mean percentage of record sales to personal consumand CD eras, which are both home recording unfriendly, and no
significant differences in the percentages in the home recording friendly cassette and P2P These latter results are consistent with the argument that no significant movement of
record sales purchases within like home recording capability periods occurredsignificant shifts in record sales purchases occurred during periods when widely technology facilitated home recording. This study also confirms that reduced record sales in the piracy friendly eras was not part of a larger phenomenon of changing patterns in consumer recreational spending, eliminating another potential factor that could have
It must be noted that these results must be interpreted with caution. Factors other than piracy may have contributed to downturns in relative record label revenues.
his study does not attempt to directly measure piracy’s effects. It simply affirms that the data are consistent with the
recording industry’s claims.
ffective are international copyright conventions in the Journal of Cultural Economics, 20, 51-66.
Farwell, J. (2003). The evolution of audio devices from the first recording of “Mary had a little lamb” to CDs and MPs, Press Play, 9(7), 140-141.
The recent growth of the internet and changes in householddemand for entertainment. Information Economics and Policy, 19, 304
2003). Piracy and the legitimate demand for recorded Contributions to Economic Analysis and Policy, 2 (1), 1-25.
. Will MP3 downloads annihilate the record industry? The Advances in the Study of Entrepreneurship, Innovation, and Economic
Libecap, JAI press, 2004. haring: Creative destruction or just plain destruction?
w and Economics, 49, 1-28. How Reliable is the Oberholzer-Gee and Strumpf Paper on File
paper, University of Texas at Dallas, School of Management(2008). Testing file sharing’s impact on music album sales in cities,
Management Science, 54(4), 852-859. Envisioning copyright law’s digital future. New York
Law School Law Review, 46, 63-158. Stumpf, K. (2007). The effect of file sharing on record
Journal of Political Economy, 115(1), 1-34. (2004). The effect of internet piracy on music
Review of Economic Research on Copyright Issues
Research in Business and Economics Journal
The relation of prerecorded, Page 12
this study finds statistically higher
and CD eras, when sound recording equipment was not widely song swapping
capability was readily available. This study also finds percentage of record sales to personal consumption
and CD eras, which are both home recording unfriendly, and no significant differences in the percentages in the home recording friendly cassette and P2P
ficant movement of occurred, the
widely available that reduced record sales
in the piracy friendly eras was not part of a larger phenomenon of changing patterns in consumer recreational spending, eliminating another potential factor that could have
Factors other than piracy may have contributed to downturns in relative record label revenues. Like
piracy’s effects on that the data are consistent with the
onventions in the music
Farwell, J. (2003). The evolution of audio devices from the first recording of “Mary had a
in household-level 304–318. ecorded music.
ndustry? The evidence Advances in the Study of Entrepreneurship, Innovation, and Economic
estruction?
Gee and Strumpf Paper on File-School of Management.
(2008). Testing file sharing’s impact on music album sales in cities,
New York
ecord sales: An
usic sales: Cross-yright Issues 1, 71-79.
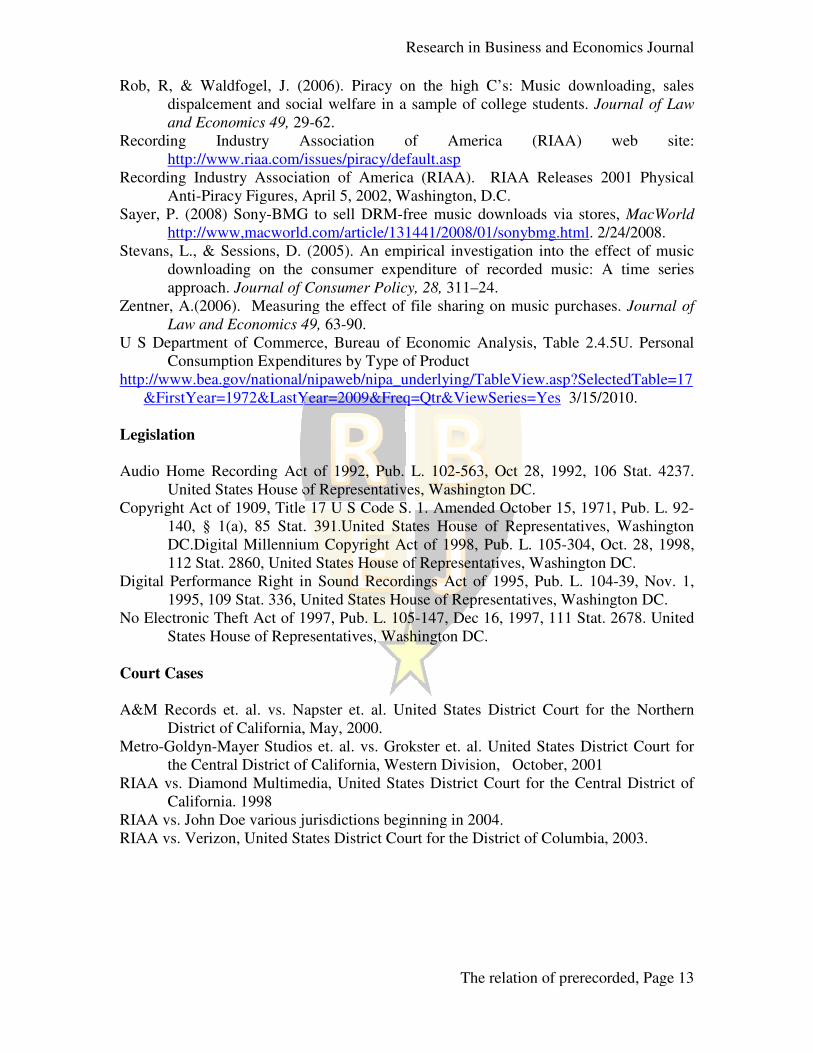
Rob, R, & Waldfogel, J. (2006dispalcement and social and Economics 49, 29
Recording Industry Association of America (RIAA) web site: http://www.riaa.com/issues/piracy/default.asp
Recording Industry Association of America (RIAA). RIAA Releases 2001 Physical Anti-Piracy Figures, April 5, 2002
Sayer, P. (2008) Sony-BMG to sell DRMhttp://www,macworld.com/article/131441/2008/01/sonybmg.html
Stevans, L., & Sessions, D. (2005). An empirical investigation into the effect of music downloading on the consumer expenditure of recorded music: A time series approach. Journal of Consumer Policy,
Zentner, A.(2006). Measuring the Law and Economics 49
U S Department of Commerce, Bureau of Economic AnalysisConsumption Expenditures by Type of Product
http://www.bea.gov/national/nipaweb/nipa_underlying/TableView.asp?SelectedTable=17&FirstYear=1972&LastYear=2009&Freq=Qtr&ViewSeries=Yes
Legislation
Audio Home Recording Act of 1992United States House of Representatives, Washington DC.
Copyright Act of 1909, Title 17 U S Code S. 1.140, § 1(a), 85 Stat. 391DC.Digital Millennium Copyright Act of 1998, Pub. L. 105112 Stat. 2860, United States House of Representatives, Washington DC.
Digital Performance Right in Sound Recordings1995, 109 Stat. 336, United States House of Representatives, Washington DC.
No Electronic Theft Act of 1997,States House of Representatives, Washington DC.
Court Cases
A&M Records et. al. vs. Napster et. al. United States District Court for the Northern
District of California, May, 2000.Metro-Goldyn-Mayer Studios et. al. vs. Grokster et. al. United States District Court for
the Central District of CaliforniRIAA vs. Diamond Multimedia,
California. 1998 RIAA vs. John Doe various jurisdictions beginning in 2004.RIAA vs. Verizon, United States District Court for the
Research in Business and Economics Journal
The relation of prerecorded, Page
2006). Piracy on the high C’s: Music downloading, ocial welfare in a sample of college students. Journal of Law
29-62. Recording Industry Association of America (RIAA) web site:
http://www.riaa.com/issues/piracy/default.asp Recording Industry Association of America (RIAA). RIAA Releases 2001 Physical
Figures, April 5, 2002, Washington, D.C. BMG to sell DRM-free music downloads via stores,
://www,macworld.com/article/131441/2008/01/sonybmg.html. 2/24/2008.Stevans, L., & Sessions, D. (2005). An empirical investigation into the effect of music
the consumer expenditure of recorded music: A time series Journal of Consumer Policy, 28, 311–24.
Measuring the effect of file sharing on music purchases. 49, 63-90.
U S Department of Commerce, Bureau of Economic Analysis, Table 2.4.5U. Personal Consumption Expenditures by Type of Product
http://www.bea.gov/national/nipaweb/nipa_underlying/TableView.asp?SelectedTable=17&FirstYear=1972&LastYear=2009&Freq=Qtr&ViewSeries=Yes 3/15/2010
Home Recording Act of 1992, Pub. L. 102-563, Oct 28, 1992, 106 Stat. 4237.United States House of Representatives, Washington DC.
Copyright Act of 1909, Title 17 U S Code S. 1. Amended October 15, 1971, Pub. L. 925 Stat. 391.United States House of Representatives, Washington
Digital Millennium Copyright Act of 1998, Pub. L. 105-304, Oct. 28, 1998, 112 Stat. 2860, United States House of Representatives, Washington DC.
Digital Performance Right in Sound Recordings Act of 1995, Pub. L. 1041995, 109 Stat. 336, United States House of Representatives, Washington DC.
No Electronic Theft Act of 1997, Pub. L. 105-147, Dec 16, 1997, 111 Stat. 2678. States House of Representatives, Washington DC.
A&M Records et. al. vs. Napster et. al. United States District Court for the Northern District of California, May, 2000.
Mayer Studios et. al. vs. Grokster et. al. United States District Court for the Central District of California, Western Division, October, 2001
RIAA vs. Diamond Multimedia, United States District Court for the Central District of
RIAA vs. John Doe various jurisdictions beginning in 2004. RIAA vs. Verizon, United States District Court for the District of Columbia, 2003.
Research in Business and Economics Journal
The relation of prerecorded, Page 13
ownloading, sales Journal of Law
Recording Industry Association of America (RIAA) web site:
Recording Industry Association of America (RIAA). RIAA Releases 2001 Physical
free music downloads via stores, MacWorld
2/24/2008. Stevans, L., & Sessions, D. (2005). An empirical investigation into the effect of music
the consumer expenditure of recorded music: A time series
urchases. Journal of
Table 2.4.5U. Personal
http://www.bea.gov/national/nipaweb/nipa_underlying/TableView.asp?SelectedTable=175/2010.
563, Oct 28, 1992, 106 Stat. 4237.
October 15, 1971, Pub. L. 92-United States House of Representatives, Washington
304, Oct. 28, 1998, 112 Stat. 2860, United States House of Representatives, Washington DC.
Act of 1995, Pub. L. 104-39, Nov. 1, 1995, 109 Stat. 336, United States House of Representatives, Washington DC.
147, Dec 16, 1997, 111 Stat. 2678. United
A&M Records et. al. vs. Napster et. al. United States District Court for the Northern
Mayer Studios et. al. vs. Grokster et. al. United States District Court for
United States District Court for the Central District of
District of Columbia, 2003.
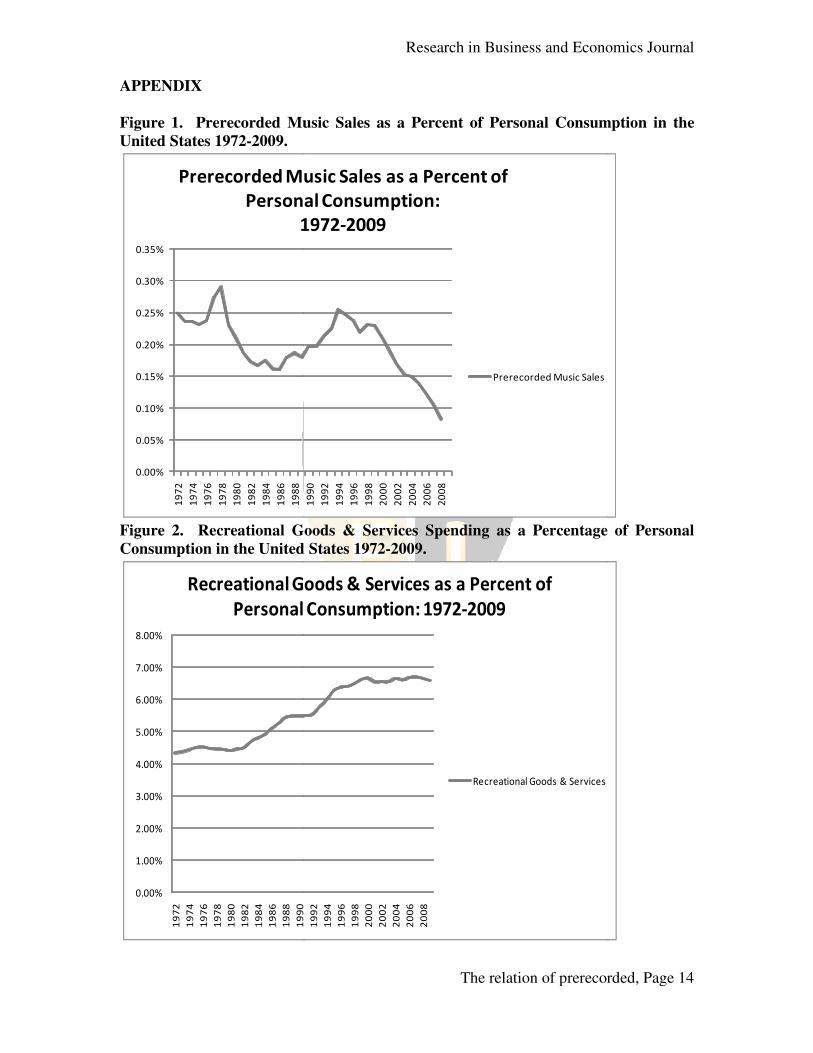
APPENDIX
Figure 1. Prerecorded Music Sales as a Percent of Personal Consumption in the
United States 1972-2009.
0.00%
0.05%
0.10%
0.15%
0.20%
0.25%
0.30%
0.35%
19
72
19
74
19
76
19
78
19
80
19
82
19
84
19
86
19
88
19
90
Prerecorded Music Sales as a Percent of
Personal Consumption:
1972
Figure 2. Recreational Goods & Services Spending
Consumption in the United States 1972
0.00%
1.00%
2.00%
3.00%
4.00%
5.00%
6.00%
7.00%
8.00%
19
72
19
74
19
76
19
78
19
80
19
82
19
84
19
86
19
88
19
90
Recreational Goods & Services as a Percent of
Personal Consumption: 1972
Research in Business and Economics Journal
The relation of prerecorded, Page
Figure 1. Prerecorded Music Sales as a Percent of Personal Consumption in the
19
90
19
92
19
94
19
96
19
98
20
00
20
02
20
04
20
06
20
08
Prerecorded Music Sales as a Percent of
Personal Consumption:
1972-2009
Prerecorded Music Sales
Recreational Goods & Services Spending as a Percentage of Personal
ption in the United States 1972-2009.
19
90
19
92
19
94
19
96
19
98
20
00
20
02
20
04
20
06
20
08
Recreational Goods & Services as a Percent of
Personal Consumption: 1972-2009
Recreational Goods & Services
Research in Business and Economics Journal
The relation of prerecorded, Page 14
Figure 1. Prerecorded Music Sales as a Percent of Personal Consumption in the
as a Percentage of Personal
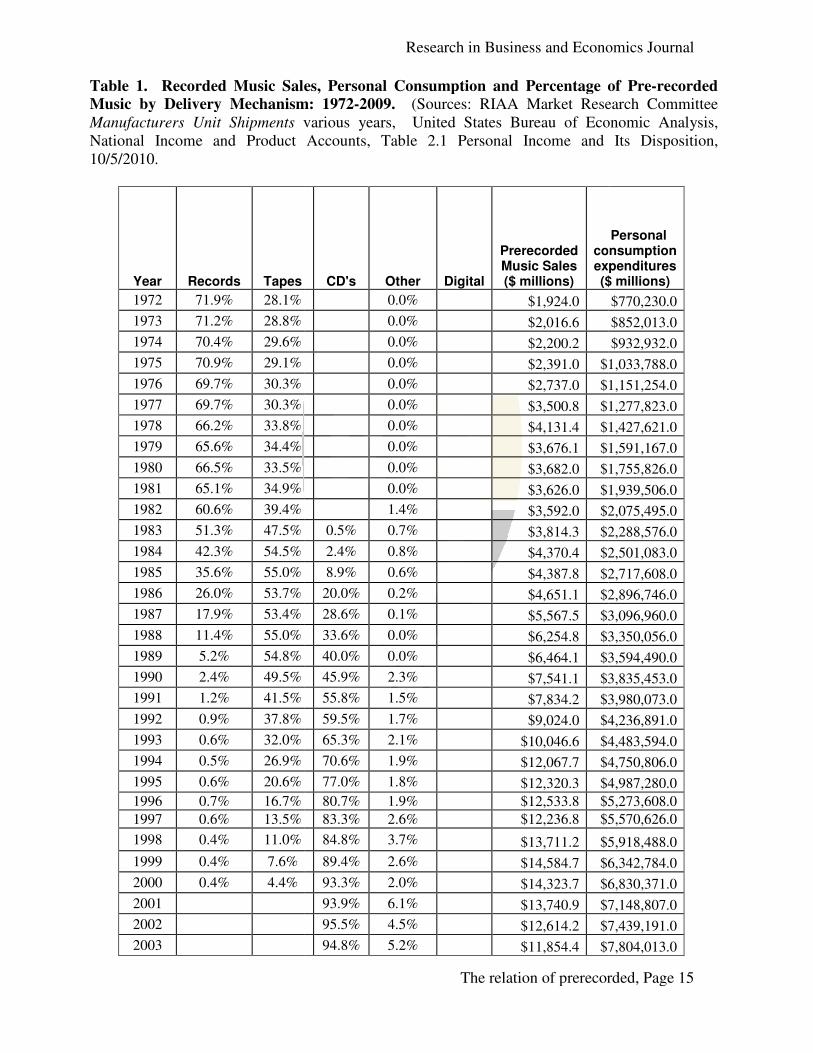
Table 1. Recorded Music Sales, Personal Consumption and
Music by Delivery Mechanism: 1972
Manufacturers Unit Shipments various years, United States Bureau of Economic Analysis, National Income and Product Accounts, Table 2.1 Personal Income and Its Disposition,10/5/2010.
Year Records Tapes
1972 71.9% 28.1%
1973 71.2% 28.8%
1974 70.4% 29.6%
1975 70.9% 29.1%
1976 69.7% 30.3%
1977 69.7% 30.3%
1978 66.2% 33.8%
1979 65.6% 34.4%
1980 66.5% 33.5%
1981 65.1% 34.9%
1982 60.6% 39.4%
1983 51.3% 47.5%
1984 42.3% 54.5%
1985 35.6% 55.0%
1986 26.0% 53.7%
1987 17.9% 53.4%
1988 11.4% 55.0%
1989 5.2% 54.8%
1990 2.4% 49.5%
1991 1.2% 41.5%
1992 0.9% 37.8%
1993 0.6% 32.0%
1994 0.5% 26.9%
1995 0.6% 20.6%
1996 0.7% 16.7%
1997 0.6% 13.5%
1998 0.4% 11.0%
1999 0.4% 7.6%
2000 0.4% 4.4%
2001
2002
2003
Research in Business and Economics Journal
The relation of prerecorded, Page
Recorded Music Sales, Personal Consumption and Percentage of Pre
Music by Delivery Mechanism: 1972-2009. (Sources: RIAA Market Research Committee various years, United States Bureau of Economic Analysis,
National Income and Product Accounts, Table 2.1 Personal Income and Its Disposition,
CD's Other Digital
Prerecorded Music Sales ($ millions)
consumption expenditures($ millions)
0.0% $1,924.0
0.0% $2,016.6
0.0% $2,200.2
0.0% $2,391.0 $1,033,788.0
0.0% $2,737.0 $1,151,254.0
0.0% $3,500.8 $1,277,823.0
0.0% $4,131.4 $1,427,621.0
0.0% $3,676.1 $1,591,167.0
0.0% $3,682.0 $1,755,826.0
0.0% $3,626.0 $1,939,506.0
1.4% $3,592.0 $2,075,495.0
0.5% 0.7% $3,814.3 $2,288,576.0
2.4% 0.8% $4,370.4 $2,501,083.0
8.9% 0.6% $4,387.8 $2,717,608.0
20.0% 0.2% $4,651.1 $2,896,746.0
28.6% 0.1% $5,567.5 $3,096,960.0
33.6% 0.0% $6,254.8 $3,350,056.0
40.0% 0.0% $6,464.1 $3,594,490.0
45.9% 2.3% $7,541.1 $3,835,453.0
55.8% 1.5% $7,834.2 $3,980,073.0
59.5% 1.7% $9,024.0 $4,236,891.0
65.3% 2.1% $10,046.6 $4,483,594.0
70.6% 1.9% $12,067.7 $4,750,806.0
77.0% 1.8% $12,320.3 $4,987,280.0
80.7% 1.9% $12,533.8 $5,273,608.0
83.3% 2.6% $12,236.8 $5,570,626.0
84.8% 3.7% $13,711.2 $5,918,488.0
89.4% 2.6% $14,584.7 $6,342,784.0
93.3% 2.0% $14,323.7 $6,830,371.0
93.9% 6.1% $13,740.9 $7,148,807.0
95.5% 4.5% $12,614.2 $7,439,191.0
94.8% 5.2% $11,854.4 $7,804,013.0
Research in Business and Economics Journal
The relation of prerecorded, Page 15
Percentage of Pre-recorded
Sources: RIAA Market Research Committee various years, United States Bureau of Economic Analysis,
National Income and Product Accounts, Table 2.1 Personal Income and Its Disposition,
Personal consumption expenditures ($ millions)
$770,230.0
$852,013.0
$932,932.0
$1,033,788.0
$1,151,254.0
$1,277,823.0
$1,427,621.0
$1,591,167.0
$1,755,826.0
$1,939,506.0
$2,075,495.0
$2,288,576.0
$2,501,083.0
$2,717,608.0
$2,896,746.0
$3,096,960.0
$3,350,056.0
$3,594,490.0
$3,835,453.0
$3,980,073.0
$4,236,891.0
$4,483,594.0
$4,750,806.0
$4,987,280.0
$5,273,608.0
$5,570,626.0
$5,918,488.0
$6,342,784.0
$6,830,371.0
$7,148,807.0
$7,439,191.0
$7,804,013.0
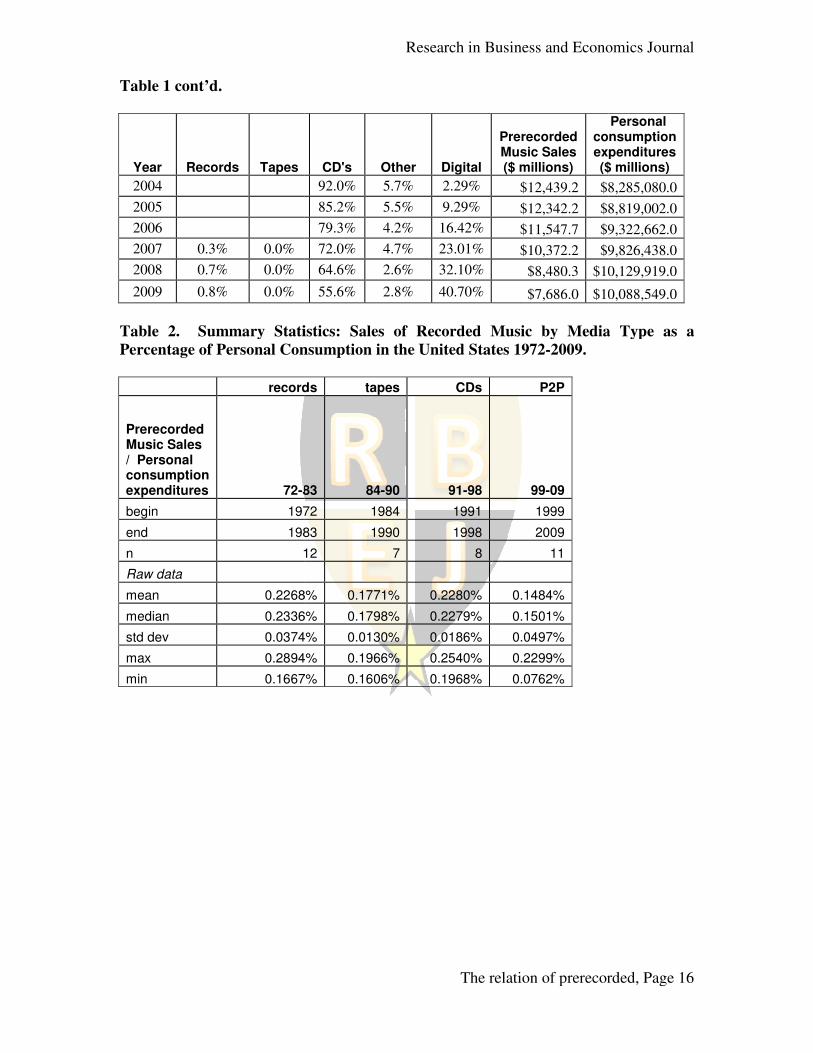
Table 1 cont’d.
Year Records Tapes
2004
2005
2006
2007 0.3% 0.0%
2008 0.7% 0.0%
2009 0.8% 0.0%
Table 2. Summary Statistics:
Percentage of Personal Consumption in the United States 1972
records
Prerecorded Music Sales / Personal consumption expenditures 72-83
begin 1972
end 1983
n 12
Raw data
mean 0.2268%
median 0.2336%
std dev 0.0374%
max 0.2894%
min 0.1667%
Research in Business and Economics Journal
The relation of prerecorded, Page
CD's Other Digital
Prerecorded Music Sales ($ millions)
consumption expenditures($ millions)
92.0% 5.7% 2.29% $12,439.2 $8,285,080.0
85.2% 5.5% 9.29% $12,342.2 $8,819,002.0
79.3% 4.2% 16.42% $11,547.7 $9,322,662.0
72.0% 4.7% 23.01% $10,372.2 $9,826,438.0
64.6% 2.6% 32.10% $8,480.3 $10,129,919.0
55.6% 2.8% 40.70% $7,686.0 $10,088,549.0
Summary Statistics: Sales of Recorded Music by Media Type as a
Percentage of Personal Consumption in the United States 1972-2009.
records tapes CDs P2P
83 84-90 91-98 99-09
1972 1984 1991 1999
1983 1990 1998 2009
12 7 8 11
0.2268% 0.1771% 0.2280% 0.1484%
0.2336% 0.1798% 0.2279% 0.1501%
0.0374% 0.0130% 0.0186% 0.0497%
0.2894% 0.1966% 0.2540% 0.2299%
0.1667% 0.1606% 0.1968% 0.0762%
Research in Business and Economics Journal
The relation of prerecorded, Page 16
Personal consumption expenditures ($ millions)
$8,285,080.0
$8,819,002.0
$9,322,662.0
$9,826,438.0
$10,129,919.0
$10,088,549.0
Sales of Recorded Music by Media Type as a
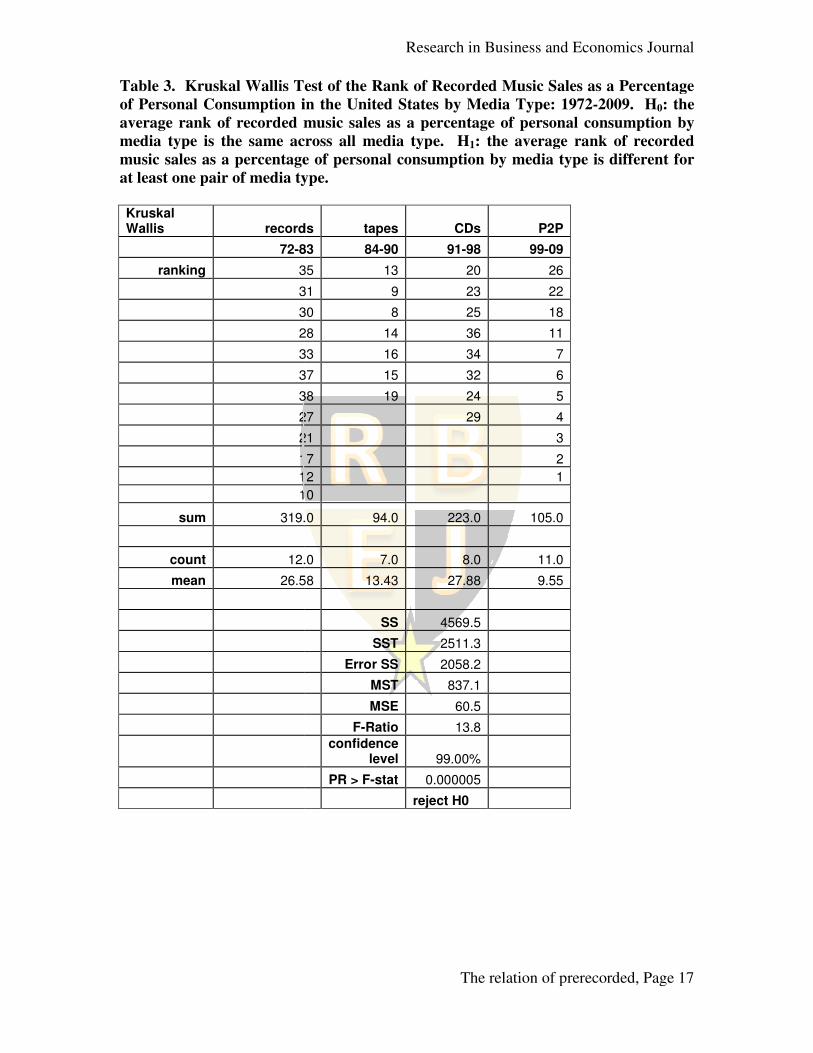
Table 3. Kruskal Wallis Test of the Rank of Record
of Personal Consumption in the United States by Media Type: 1972
average rank of recorded music
media type is the same across all media type. H
music sales as a percentage of personal consumption by media type is different for
at least one pair of media type.
Kruskal Wallis records
72-83
ranking 35
31
30
28
33
37
38
27
21
17
12
10
sum 319.0
count 12.0
mean 26.58
Research in Business and Economics Journal
The relation of prerecorded, Page
. Kruskal Wallis Test of the Rank of Recorded Music Sales as a Percentage
of Personal Consumption in the United States by Media Type: 1972-200
ed music sales as a percentage of personal consumption by
media type is the same across all media type. H1: the average rank of re
sales as a percentage of personal consumption by media type is different for
media type.
records tapes CDs P2P
83 84-90 91-98 99-09
35 13 20 26
31 9 23 22
30 8 25 18
28 14 36 11
33 16 34 7
37 15 32 6
38 19 24 5
27 29 4
21 3
17 2
12 1
10
319.0 94.0 223.0 105.0
12.0 7.0 8.0 11.0
26.58 13.43 27.88 9.55
SS 4569.5
SST 2511.3
Error SS 2058.2
MST 837.1
MSE 60.5
F-Ratio 13.8
confidence level 99.00%
PR > F-stat 0.000005
reject H0
Research in Business and Economics Journal
The relation of prerecorded, Page 17
Sales as a Percentage
2009. H0: the
sales as a percentage of personal consumption by
the average rank of recorded
sales as a percentage of personal consumption by media type is different for
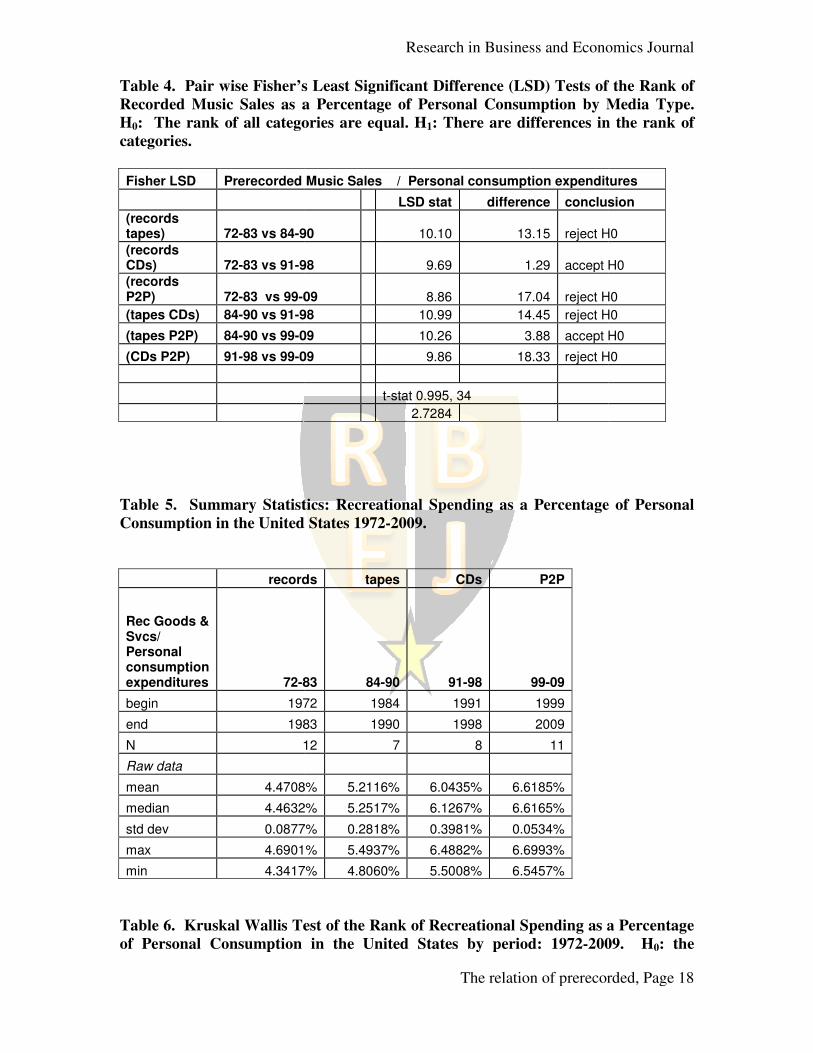
Table 4. Pair wise Fisher’s Least Significant Difference (LSD) T
Recorded Music Sales as a Percentage of Personal Consumption by Media Type.
H0: The rank of all categories are equal
categories.
Fisher LSD Prerecorded Music Sales / Personal consumption expenditures
(records tapes) 72-83 vs 84-90
(records CDs) 72-83 vs 91-98
(records P2P) 72-83 vs 99-09
(tapes CDs) 84-90 vs 91-98
(tapes P2P) 84-90 vs 99-09
(CDs P2P) 91-98 vs 99-09
Table 5. Summary Statistics:
Consumption in the United States 1972
records
Rec Goods & Svcs/ Personal consumption expenditures 72-83
begin 1972
end 1983
N 12
Raw data
mean 4.4708%
median 4.4632%
std dev 0.0877%
max 4.6901%
min 4.3417%
Table 6. Kruskal Wallis Test of the Rank of Recreational Spending as a Percentage
of Personal Consumption in the United States by period: 1972
Research in Business and Economics Journal
The relation of prerecorded, Page
Fisher’s Least Significant Difference (LSD) Tests of the Rank of
Recorded Music Sales as a Percentage of Personal Consumption by Media Type.
all categories are equal. H1: There are differences in the rank of
Prerecorded Music Sales / Personal consumption expenditures
LSD stat difference conclusion
90 10.10 13.15 reject H0
98 9.69 1.29 accept H0
09 8.86 17.04 reject H0
98 10.99 14.45 reject H0
09 10.26 3.88 accept H0
09 9.86 18.33 reject H0
t-stat 0.995, 34
2.7284
. Summary Statistics: Recreational Spending as a Percentage of Personal
Consumption in the United States 1972-2009.
records tapes CDs P2P
83 84-90 91-98 99-09
1972 1984 1991 1999
1983 1990 1998 2009
12 7 8 11
4.4708% 5.2116% 6.0435% 6.6185%
4.4632% 5.2517% 6.1267% 6.6165%
0.0877% 0.2818% 0.3981% 0.0534%
4.6901% 5.4937% 6.4882% 6.6993%
4.3417% 4.8060% 5.5008% 6.5457%
6. Kruskal Wallis Test of the Rank of Recreational Spending as a Percentage
of Personal Consumption in the United States by period: 1972-2009. H
Research in Business and Economics Journal
The relation of prerecorded, Page 18
ests of the Rank of
Recorded Music Sales as a Percentage of Personal Consumption by Media Type.
differences in the rank of
Prerecorded Music Sales / Personal consumption expenditures
conclusion
reject H0
accept H0
reject H0
reject H0
accept H0
reject H0
as a Percentage of Personal
6. Kruskal Wallis Test of the Rank of Recreational Spending as a Percentage
2009. H0: the
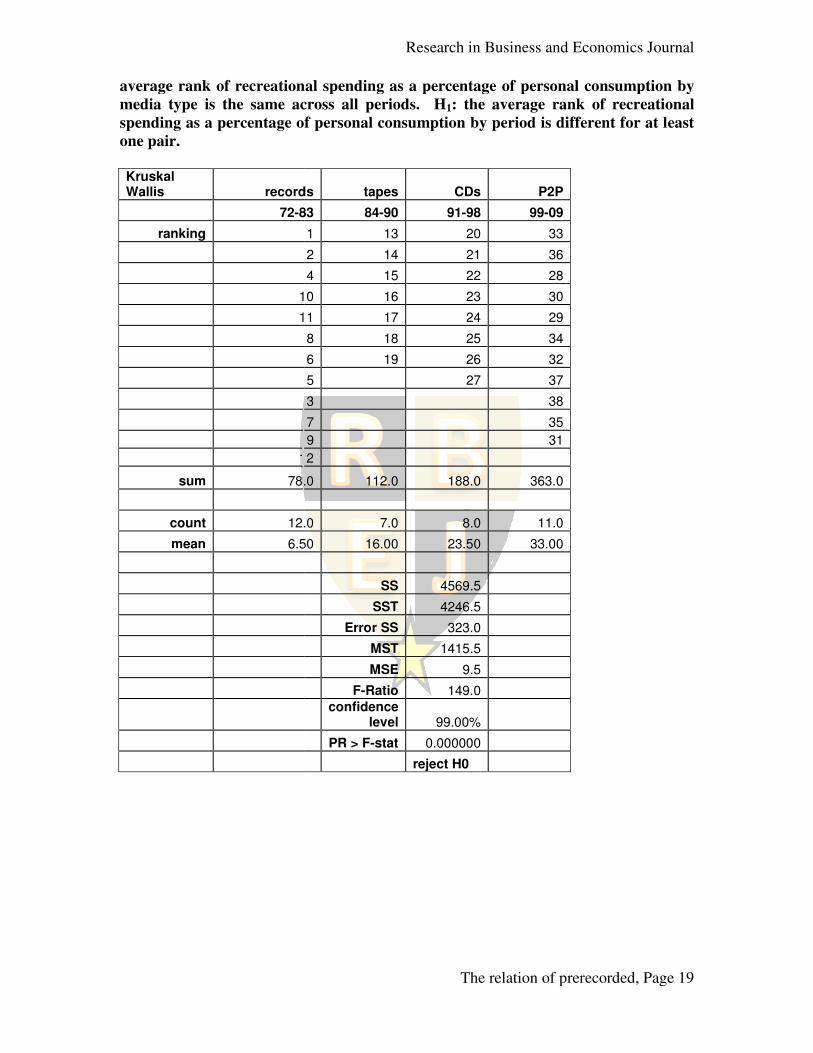
average rank of recreational spending as a percentage of
media type is the same across all periods. H
spending as a percentage of personal consumption by period is different for at least
one pair.
Kruskal Wallis records
72-83
ranking
10
11
12
sum 78.0
count 12.0
mean 6.50
Research in Business and Economics Journal
The relation of prerecorded, Page
average rank of recreational spending as a percentage of personal consumption by
media type is the same across all periods. H1: the average rank of recreational
spending as a percentage of personal consumption by period is different for at least
records tapes CDs P2P
83 84-90 91-98 99-09
1 13 20 33
2 14 21 36
4 15 22 28
10 16 23 30
11 17 24 29
8 18 25 34
6 19 26 32
5 27 37
3 38
7 35
9 31
12
78.0 112.0 188.0 363.0
12.0 7.0 8.0 11.0
6.50 16.00 23.50 33.00
SS 4569.5
SST 4246.5
Error SS 323.0
MST 1415.5
MSE 9.5
F-Ratio 149.0
confidence level 99.00%
PR > F-stat 0.000000
reject H0
Research in Business and Economics Journal
The relation of prerecorded, Page 19
personal consumption by
: the average rank of recreational
spending as a percentage of personal consumption by period is different for at least
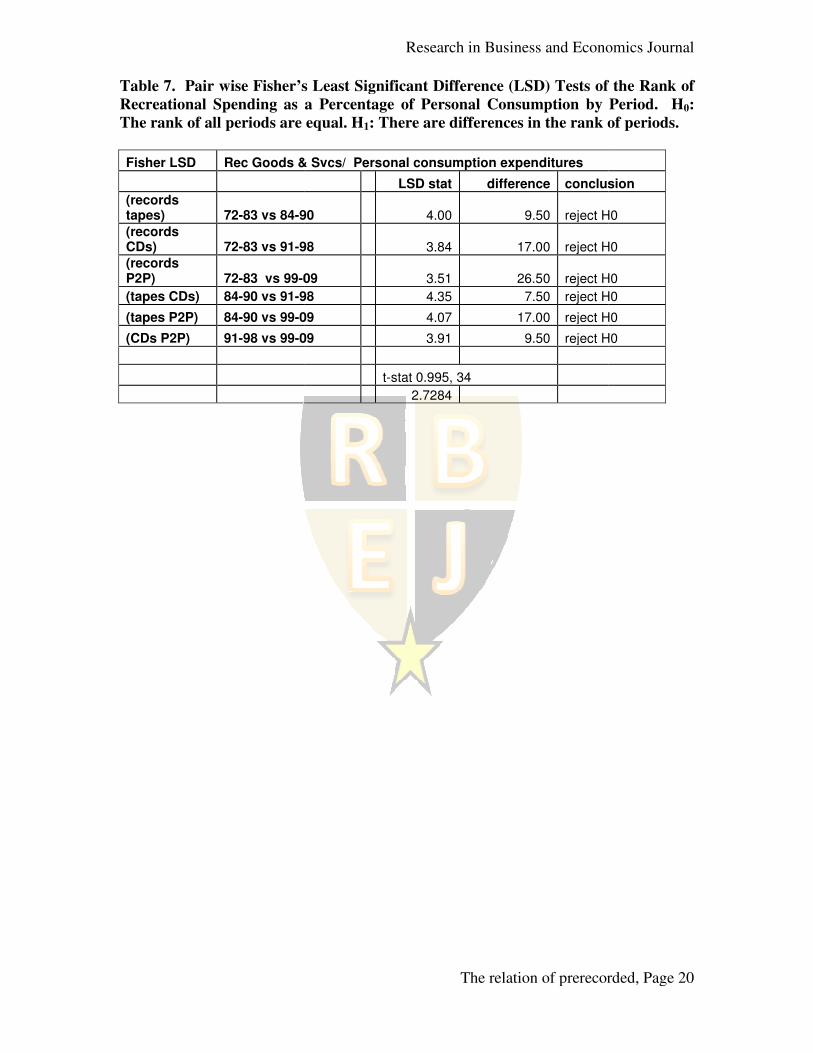
Table 7. Pair wise Fisher’s Least Significant Difference (LSD) Tests of the Rank of
Recreational Spending as a Percentage of Personal Consumption by Period. H
The rank of all periods are equal. H
Fisher LSD Rec Goods & Svcs/ Personal consumption expenditures
(records tapes) 72-83 vs 84-90
(records CDs) 72-83 vs 91-98
(records P2P) 72-83 vs 99-09
(tapes CDs) 84-90 vs 91-98
(tapes P2P) 84-90 vs 99-09
(CDs P2P) 91-98 vs 99-09
Research in Business and Economics Journal
The relation of prerecorded, Page
Table 7. Pair wise Fisher’s Least Significant Difference (LSD) Tests of the Rank of
Recreational Spending as a Percentage of Personal Consumption by Period. H
The rank of all periods are equal. H1: There are differences in the rank of periods.
Rec Goods & Svcs/ Personal consumption expenditures
LSD stat difference conclusion
90 4.00 9.50 reject H0
98 3.84 17.00 reject H0
09 3.51 26.50 reject H0
98 4.35 7.50 reject H0
09 4.07 17.00 reject H0
09 3.91 9.50 reject H0
t-stat 0.995, 34
2.7284
Research in Business and Economics Journal
The relation of prerecorded, Page 20
Table 7. Pair wise Fisher’s Least Significant Difference (LSD) Tests of the Rank of
Recreational Spending as a Percentage of Personal Consumption by Period. H0:
: There are differences in the rank of periods.
conclusion
reject H0
reject H0
reject H0
reject H0
reject H0
reject H0
Recreational Goods and Services as Identified by the United States Bureau of
Economic Analysis.
Recreational goods
Video, audio, photographic, and information processing equipment and media Video and audio equipment Televisions Other video equipment Audio equipment Recording media Prerecorded and blank a Video cassettes and discs, blank and prerecorded Photographic equipment Information processing equipment Personal computers and peripheral equipment Computer software and accessories Calculators, typewriters, and other information processing equipment Sporting equipment, supplies, guns, and ammunition Recreational books Musical instruments
Recreation services
Membership clubs, sports c Membership clubs and participant sports centers Amusement parks, campgrounds, and related recreational services Admissions to specified spectator amusements Motion picture theaters Live entertainment, excluding sports Spectator sports Museums and libraries Audio-video, photographic, and information processing equipment services Cable and satellite television and radio services Photo processing Photo studios Repair of audio-visual, photographic, and information processing equipment Video media rental Gambling Casino gambling Lotteries Pari-mutuel net receipts Other recreational services
Research in Business and Economics Journal
The relation of prerecorded, Page
Recreational Goods and Services as Identified by the United States Bureau of
Video, audio, photographic, and information processing equipment and mediaVideo and audio equipment
Other video equipment
Prerecorded and blank audio discs/tapes/digital files/downloads Video cassettes and discs, blank and prerecorded
Photographic equipment Information processing equipment Personal computers and peripheral equipment
and accessories Calculators, typewriters, and other information processing equipment
Sporting equipment, supplies, guns, and ammunition
Membership clubs, sports centers, parks, theaters, and museums Membership clubs and participant sports centers Amusement parks, campgrounds, and related recreational services Admissions to specified spectator amusements
Motion picture theaters Live entertainment, excluding sports
Museums and libraries video, photographic, and information processing equipment services
Cable and satellite television and radio services
visual, photographic, and information processing equipment
mutuel net receipts er recreational services
Research in Business and Economics Journal
The relation of prerecorded, Page 21
Recreational Goods and Services as Identified by the United States Bureau of
Video, audio, photographic, and information processing equipment and media
Calculators, typewriters, and other information processing equipment
video, photographic, and information processing equipment services
visual, photographic, and information processing equipment