the q2 2016 preqin quarterly update real estate · for any decisions of whatever nature the reader...
TRANSCRIPT
alternative assets. intelligent data.
Content includes...
Fundraising Lowest number of funds
closed in a single quarter in
over 12 years.
Funds in Market More than 500 funds are
currently in market seeking
capital.
Deals Office assets represented
the largest proportion of
both number of deals and
aggregate value in Q2.
Investors in Private Real Estate Appetite for Europe
increases during Q2.
Dry PowderPrivate real estate dry
powder now stands at a
record $238bn.
The Q2 2016
Preqin Quarterly Update
Real Estate Insight on the quarter from the leading provider of alternative assets data
The Preqin Quarterly Update: Real Estate, Q2 2016
Download the data pack at:www.preqin.com/quarterlyupdate
2 © 2016 Preqin Ltd. / www.preqin.com
All rights reserved. The entire contents of Preqin Quarterly Update: Real Estate, Q2 2016 are the Copyright of Preqin Ltd. No part of this publication or any information contained in it may be copied, transmitted by any electronic
means, or stored in any electronic or other data storage medium, or printed or published in any document, report or publication, without the express prior written approval of Preqin Ltd. The information presented in Preqin Quarterly
Update: Real Estate, Q2 2016 is for information purposes only and does not constitute and should not be construed as a solicitation or other offer, or recommendation to acquire or dispose of any investment or to engage in any other
transaction, or as advice of any nature whatsoever. If the reader seeks advice rather than information then he should seek an independent fi nancial advisor and hereby agrees that he will not hold Preqin Ltd. responsible in law or equity
for any decisions of whatever nature the reader makes or refrains from making following its use of Preqin Quarterly Update: Real Estate, Q2 2016.
While reasonable efforts have been made to obtain information from sources that are believed to be accurate, and to confi rm the accuracy of such information wherever possible, Preqin Ltd. does not make any representation or
warranty that the information or opinions contained in Preqin Quarterly Update: Real Estate, Q2 2016 are accurate, reliable, up-to-date or complete.
Although every reasonable effort has been made to ensure the accuracy of this publication Preqin Ltd. does not accept any responsibility for any errors or omissions within Preqin Quarterly Update: Real Estate, Q2 2016 or for any
expense or other loss alleged to have arisen in any way with a reader’s use of this publication.
Foreword - Andy Moylan, Preqin
The trend of capital concentration in the private real estate asset class has continued, with Q2 2016 seeing fewer funds close than the fi rst quarter of the year, which in turn represented a fall from Q4 2015. Despite the decreasing number of vehicles reaching a fi nal close, the level of capital secured by private real estate funds has increased for two consecutive quarters. This was driven by two large fund closures from Brookfi eld Asset Management and Lone Star Funds, which secured $9bn and $5.9bn respectively. Furthermore, there remains fi erce competition for investor capital, with more funds currently in market (505) targeting more capital ($175bn) than seen in recent years.
Performance has remained strong amid increasing asset valuations; private real estate funds have experienced positive average changes in NAV for 22 consecutive quarters, with the PrEQIn Real Estate Index increasing 2.3% in Q3 2015, compared to the 6% loss of the S&P 500 Total Return Index in the same period.
Q2 2016 has seen an increase in the proportion of investors seeking opportunities beyond North America in the next 12 months. Forty-nine percent of investors plan to target Europe in the year ahead compared to 47% targeting North America, a signifi cant reversal from 12 months ago. However, in a recent Preqin survey analyzing the impact of the Brexit vote, over half the institutional investors that responded to the survey plan to invest less in the UK market over the next 12 months.
Preqin’s Real Estate Online has been expanded to include transaction data, and is now the only service to be able to track the private real estate fund market from institutional sources of capital, through funds and fund managers to individual asset- and deal-level data. The second quarter of 2016 saw mixed-use assets account for 27% of private real estate aggregate deal value, up from 17% in Q1. While North American assets continue to dominate the private real estate deal market, accounting for 69% of all deals, the largest deal in Q2 2016 was BlackRock’s sale of the Asia Square Tower 1 in Singapore to Qatar Investment Authority for $2.45bn.
We hope you fi nd this report useful and welcome any feedback you may have. For more information, please visit www.preqin.com or contact [email protected].
Fundraising in Q2 2016 3
Funds in Market 5
Deals 6
Institutional Investors in Real Estate 9
Dry Powder 10
Fund Performance 12
Conferences 13
Contents
Data Source:
Preqin’s Real Estate Online is the leading source of intelligence on the private real estate fund industry. Real Estate Online
is the only service that can provide information on all areas of the private real estate asset class, including institutional investor, fund, performance, deal and asset data.
For more information, or to arrange a demo, please visit: www.preqin.com/reo
The Preqin Quarterly Update: Real Estate, Q2 2016
Download the data pack at:www.preqin.com/quarterlyupdate
3© 2016 Preqin Ltd. / www.preqin.com
Fundraising in Q2 2016
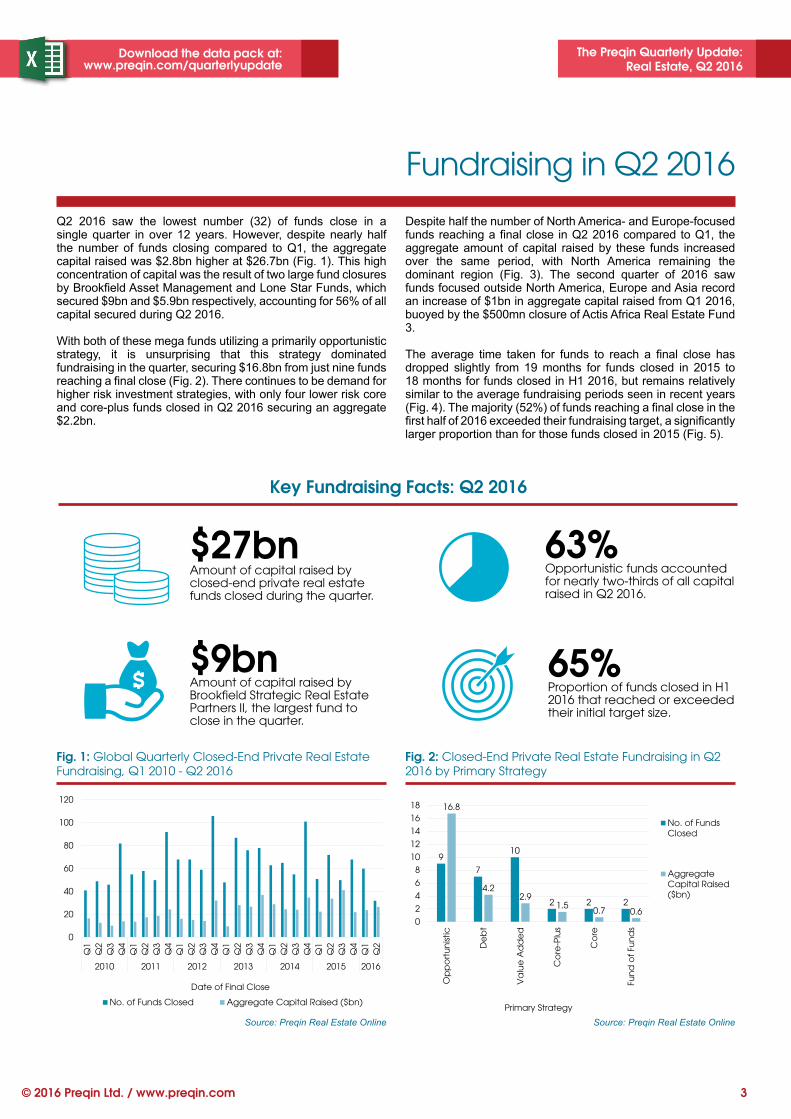
Q2 2016 saw the lowest number (32) of funds close in a single quarter in over 12 years. However, despite nearly half the number of funds closing compared to Q1, the aggregate capital raised was $2.8bn higher at $26.7bn (Fig. 1). This high concentration of capital was the result of two large fund closures by Brookfi eld Asset Management and Lone Star Funds, which secured $9bn and $5.9bn respectively, accounting for 56% of all capital secured during Q2 2016.
With both of these mega funds utilizing a primarily opportunistic strategy, it is unsurprising that this strategy dominated fundraising in the quarter, securing $16.8bn from just nine funds reaching a fi nal close (Fig. 2). There continues to be demand for higher risk investment strategies, with only four lower risk core and core-plus funds closed in Q2 2016 securing an aggregate $2.2bn.
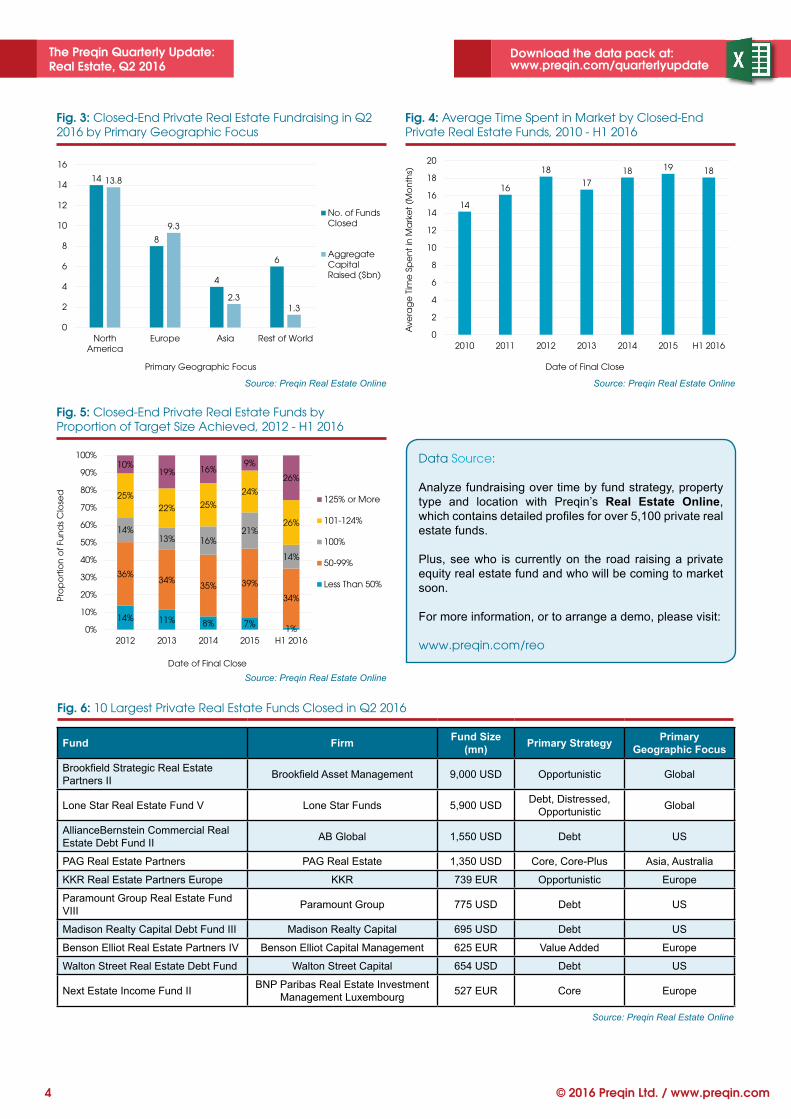
Despite half the number of North America- and Europe-focused funds reaching a fi nal close in Q2 2016 compared to Q1, the aggregate amount of capital raised by these funds increased over the same period, with North America remaining the dominant region (Fig. 3). The second quarter of 2016 saw funds focused outside North America, Europe and Asia record an increase of $1bn in aggregate capital raised from Q1 2016, buoyed by the $500mn closure of Actis Africa Real Estate Fund 3.
The average time taken for funds to reach a fi nal close has dropped slightly from 19 months for funds closed in 2015 to 18 months for funds closed in H1 2016, but remains relatively similar to the average fundraising periods seen in recent years (Fig. 4). The majority (52%) of funds reaching a fi nal close in the fi rst half of 2016 exceeded their fundraising target, a signifi cantly larger proportion than for those funds closed in 2015 (Fig. 5).
Key Fundraising Facts: Q2 2016
$27bnAmount of capital raised by closed-end private real estate funds closed during the quarter.
63%Opportunistic funds accounted for nearly two-thirds of all capital raised in Q2 2016.
65%Proportion of funds closed in H1 2016 that reached or exceeded their initial target size.
$9bnAmount of capital raised by Brookfield Strategic Real Estate Partners II, the largest fund to close in the quarter.
0
20
40
60
80
100
120
Q1
Q2
Q3
Q4
Q1
Q2
Q3
Q4
Q1
Q2
Q3
Q4
Q1
Q2
Q3
Q4
Q1
Q2
Q3
Q4
Q1
Q2
Q3
Q4
Q1
Q2
2010 2011 2012 2013 2014 2015 2016
No. of Funds Closed Aggregate Capital Raised ($bn)
Fig. 1: Global Quarterly Closed-End Private Real Estate Fundraising, Q1 2010 - Q2 2016
Source: Preqin Real Estate Online
Date of Final Close
9
7
10
2 2 2
16.8
4.22.9
1.50.7 0.6
0
2
4
6
8
10
12
14
16
18
Op
po
rtu
nis
tic
De
bt
Va
lue
Ad
de
d
Co
re-P
lus
Co
re
Fun
d o
f Fu
nd
s
No. of FundsClosed
AggregateCapital Raised($bn)
Fig. 2: Closed-End Private Real Estate Fundraising in Q2 2016 by Primary Strategy
Source: Preqin Real Estate Online
Primary Strategy
The Preqin Quarterly Update: Real Estate, Q2 2016
Download the data pack at:www.preqin.com/quarterlyupdate
4 © 2016 Preqin Ltd. / www.preqin.com
14
8
4
6
13.8
9.3
2.31.3
0
2
4
6
8
10
12
14
16
NorthAmerica
Europe Asia Rest of World
No. of FundsClosed
AggregateCapitalRaised ($bn)
Fig. 3: Closed-End Private Real Estate Fundraising in Q2 2016 by Primary Geographic Focus
Source: Preqin Real Estate Online
Primary Geographic Focus
14
16
18
17
18 19 18
0
2
4
6
8
10
12
14
16
18
20
2010 2011 2012 2013 2014 2015 H1 2016
Fig. 4: Average Time Spent in Market by Closed-End Private Real Estate Funds, 2010 - H1 2016
Source: Preqin Real Estate Online
Av
era
ge
Tim
e S
pe
nt
in M
ark
et
(Mo
nth
s)
Date of Final Close
Fig. 6: 10 Largest Private Real Estate Funds Closed in Q2 2016
Fund FirmFund Size
(mn)Primary Strategy
Primary
Geographic Focus
Brookfi eld Strategic Real Estate Partners II
Brookfi eld Asset Management 9,000 USD Opportunistic Global
Lone Star Real Estate Fund V Lone Star Funds 5,900 USDDebt, Distressed,
OpportunisticGlobal
AllianceBernstein Commercial Real Estate Debt Fund II
AB Global 1,550 USD Debt US
PAG Real Estate Partners PAG Real Estate 1,350 USD Core, Core-Plus Asia, Australia
KKR Real Estate Partners Europe KKR 739 EUR Opportunistic Europe
Paramount Group Real Estate Fund VIII
Paramount Group 775 USD Debt US
Madison Realty Capital Debt Fund III Madison Realty Capital 695 USD Debt US
Benson Elliot Real Estate Partners IV Benson Elliot Capital Management 625 EUR Value Added Europe
Walton Street Real Estate Debt Fund Walton Street Capital 654 USD Debt US
Next Estate Income Fund IIBNP Paribas Real Estate Investment
Management Luxembourg527 EUR Core Europe
Source: Preqin Real Estate Online
14% 11% 8% 7%1%
36%34%
35% 39%
34%
14%13% 16%
21%
14%
25%
22% 25%
24%
26%
10%19% 16%
9%
26%
0%
10%
20%
30%
40%
50%
60%
70%
80%
90%
100%
2012 2013 2014 2015 H1 2016
125% or More
101-124%
100%
50-99%
Less Than 50%
Fig. 5: Closed-End Private Real Estate Funds by Proportion of Target Size Achieved, 2012 - H1 2016
Source: Preqin Real Estate Online
Pro
po
rtio
n o
f Fu
nd
s C
lose
d
Date of Final Close
Data Source:
Analyze fundraising over time by fund strategy, property type and location with Preqin’s Real Estate Online, which contains detailed profi les for over 5,100 private real estate funds.
Plus, see who is currently on the road raising a private equity real estate fund and who will be coming to market soon.
For more information, or to arrange a demo, please visit:
www.preqin.com/reo

The Preqin Quarterly Update: Real Estate, Q2 2016
Download the data pack at:www.preqin.com/quarterlyupdate
5© 2016 Preqin Ltd. / www.preqin.com
Funds in Market
The number of closed-end private real estate funds in market now stands at a record 505 vehicles, which are looking to raise an aggregate $175bn as at the start of Q3 2016 (Fig. 1). North America remains the most targeted region for private real estate funds, with 61% of funds in market primarily focused on opportunities within the region, with the majority (57%) of targeted capital also focused on the region (Fig. 2). Europe-focused vehicles account for a fi fth of funds in market, followed by those targeting Asia (11%).
As seen in Fig. 3, fundraising is still a long process for many fi rms: 53% of funds currently in market have been seeking institutional capital for over a year, including nearly a quarter of funds that have been on the road for over two years. In addition, 40% of funds that have yet to hold an interim close have been on the road for over 12 months.
The fi ve largest private real estate funds in market are currently targeting a combined $22bn. Four of the top fi ve largest funds in market utilize debt strategies, including Lone Star Fund X, the only fund in the top fi ve that is new to market in Q2 2016.
Fig. 4: Five Largest Closed-End Private Real Estate Funds Currently in Market
Fund FirmTarget Size
(mn)Strategy
Primary
Geographic Focus
Blackstone Real Estate Partners Europe V Blackstone Group 7,000 EUR Distressed, Opportunistic Western Europe
Lone Star Fund X Lone Star Funds 5,000 USD Debt, Distressed, Opportunistic US
Blackstone Real Estate Debt Strategies III Blackstone Group 4,000 USD DebtEurope, North
America
Oaktree Real Estate Opportunities Fund VIIOaktree Capital Management
3,000 USD Debt, Distressed, Opportunistic Global
Colony Distressed Credit & Special Situations Fund IV
Colony Capital 2,500 USD Debt, DistressedUS, Western
Europe
Source: Preqin Real Estate Online
448 438 453 466 467 468 466 478 470
423 429451
489 492 505
149 150 160 163 163 164 165 165 163 164 153 155174 175 175
0
100
200
300
400
500
600
Q1 Q2 Q3 Q4 Q1 Q2 Q3 Q4 Q1 Q2 Q3 Q4 Q1 Q2 Q3
2013 2014 2015 2016
No. of Funds Raising Aggregate Target Capital ($bn)
Fig. 1: Closed-End Private Real Estate Funds in Market over Time, Q1 2013 - Q3 2016
Source: Preqin Real Estate Online
308
102
5540
100
47
18 100
50
100
150
200
250
300
350
NorthAmerica
Europe Asia Rest of World
No. of FundsRaising
AggregateTarget Capital($bn)
Fig. 2: Closed-End Private Real Estate Funds in Market by Primary Geographic Focus
Source: Preqin Real Estate Online
Primary Geographic Focus
27%40%
16%
20%
19%
20%
22%
20%
25%
8%
4%
12%
22%17%
27%
0%
10%
20%
30%
40%
50%
60%
70%
80%
90%
100%
All Funds Funds Yet toHold an Interim
Close
Funds that HaveHeld at LeastOne Interim
Close
More than24 Months
19-24 Months
13-18 Months
7-12 Months
6 Months orless
Fig. 3: Time Spent on the Road by Closed-End Private Real Estate Funds Currently in Market
Source: Preqin Real Estate Online
Pro
po
rtio
n o
f Fu
nd
s in
Ma
rke
t
The Preqin Quarterly Update: Real Estate, Q2 2016
Download the data pack at:www.preqin.com/quarterlyupdate
6 © 2016 Preqin Ltd. / www.preqin.com
Deals
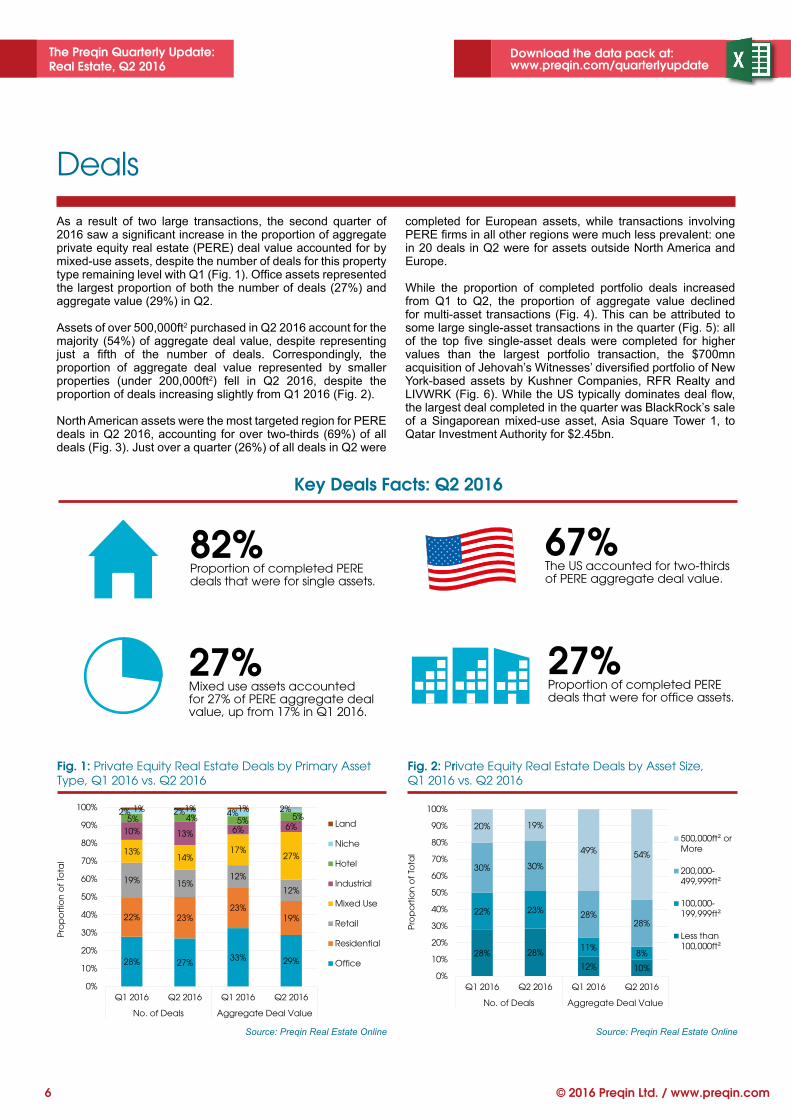
As a result of two large transactions, the second quarter of 2016 saw a signifi cant increase in the proportion of aggregate private equity real estate (PERE) deal value accounted for by mixed-use assets, despite the number of deals for this property type remaining level with Q1 (Fig. 1). Offi ce assets represented the largest proportion of both the number of deals (27%) and aggregate value (29%) in Q2.
Assets of over 500,000ft2 purchased in Q2 2016 account for the majority (54%) of aggregate deal value, despite representing just a fi fth of the number of deals. Correspondingly, the proportion of aggregate deal value represented by smaller properties (under 200,000ft2) fell in Q2 2016, despite the proportion of deals increasing slightly from Q1 2016 (Fig. 2).
North American assets were the most targeted region for PERE deals in Q2 2016, accounting for over two-thirds (69%) of all deals (Fig. 3). Just over a quarter (26%) of all deals in Q2 were
completed for European assets, while transactions involving PERE fi rms in all other regions were much less prevalent: one in 20 deals in Q2 were for assets outside North America and Europe.
While the proportion of completed portfolio deals increased from Q1 to Q2, the proportion of aggregate value declined for multi-asset transactions (Fig. 4). This can be attributed to some large single-asset transactions in the quarter (Fig. 5): all of the top fi ve single-asset deals were completed for higher values than the largest portfolio transaction, the $700mn acquisition of Jehovah’s Witnesses’ diversifi ed portfolio of New York-based assets by Kushner Companies, RFR Realty and LIVWRK (Fig. 6). While the US typically dominates deal fl ow, the largest deal completed in the quarter was BlackRock’s sale of a Singaporean mixed-use asset, Asia Square Tower 1, to Qatar Investment Authority for $2.45bn.
28% 27%33% 29%
22% 23%23%
19%
19% 15%12%
12%
13%14%
17%27%
10% 13% 6% 6%5% 4% 5% 5%
2% 2% 4% 2%1% 1% 1%
0%
10%
20%
30%
40%
50%
60%
70%
80%
90%
100%
Q1 2016 Q2 2016 Q1 2016 Q2 2016
No. of Deals Aggregate Deal Value
Land
Niche
Hotel
Industrial
Mixed Use
Retail
Residential
Office
Fig. 1: Private Equity Real Estate Deals by Primary Asset Type, Q1 2016 vs. Q2 2016
Source: Preqin Real Estate Online
Pro
po
rtio
n o
f To
tal
28% 28%
12% 10%
22% 23%
11%8%
30% 30%
28%28%
20% 19%
49% 54%
0%
10%
20%
30%
40%
50%
60%
70%
80%
90%
100%
Q1 2016 Q2 2016 Q1 2016 Q2 2016
No. of Deals Aggregate Deal Value
500,000ft² orMore
200,000-499,999ft²
100,000-199,999ft²
Less than100,000ft²
Fig. 2: Private Equity Real Estate Deals by Asset Size,Q1 2016 vs. Q2 2016
Source: Preqin Real Estate Online
Pro
po
rtio
n o
f To
tal
Key Deals Facts: Q2 2016
82%Proportion of completed PERE deals that were for single assets.
67%The US accounted for two-thirds of PERE aggregate deal value.
27%Proportion of completed PERE deals that were for office assets.
27%Mixed use assets accounted for 27% of PERE aggregate deal value, up from 17% in Q1 2016.

The Preqin Quarterly Update: Real Estate, Q2 2016
Download the data pack at:www.preqin.com/quarterlyupdate
7© 2016 Preqin Ltd. / www.preqin.com
Fig. 5: Five Largest Single-Asset Private Equity Real Estate Deals Completed in Q2 2016
AssetAsset
TypeBuyer(s) Seller(s)
Deal Size
(mn)Location
Deal
Date
Asia Square Tower 1 Mixed Use Qatar Investment Authority BlackRock 2,450 USD Singapore Jun-16
1285 Avenue of the Americas
Offi ceChina Life Insurance, RXR Realty, David Werner Real
Estate
AXA Investment Managers - Real Assets, JP Morgan
Asset Management1,650 USD New York, NY May-16
The Shops At Crystals RetailInvesco Real Estate, Simon
Property GroupUnidentifi ed Seller(s) 1,100 USD Las Vegas, NV Apr-16
Blanchardstown Centre
Mixed Use Blackstone Group Unidentifi ed Seller(s) 950 EUR Dublin, Ireland Apr-16
Merry Hill Shopping Centre
Retail Intu Properties QIC Real Estate 601 GBPWest
Midlands, UKJun-16
Source: Preqin Real Estate Online
69%
26%
2%3%
North America
Europe
Asia
Rest of World
Fig. 3: Private Equity Real Estate Deals Completed in Q2 2016 by Primary Asset Location
Source: Preqin Real Estate Online
84% 82%70% 75%
16% 18%30% 25%
0%
10%
20%
30%
40%
50%
60%
70%
80%
90%
100%
Q1 2016 Q2 2016 Q1 2016 Q2 2016
No. of Deals Aggregate Deal Value
Single Asset Portfolio
Fig. 4: Private Equity Real Estate Deals by Transaction Type, Q1 2016 vs. Q2 2016
Source: Preqin Real Estate Online
Pro
po
rtio
n o
f To
tal
Fig. 6: Five Largest Portfolio Private Equity Real Estate Deals Completed in Q2 2016
AssetAsset
TypeBuyer(s) Seller(s)
Deal Size
(mn)Location
Deal
Date
New York, NY Diversifi ed Portfolio
Offi ceKushner Companies, LIVWRK, RFR Realty
Unidentifi ed Seller/s 700 USD New York, NY Apr-16
Las Vegas, Nevada, Apartment Portfolio
ResidentialBascom Group, Oaktree
Capital ManagementCamden Property Trust 630 USD Las Vegas, NV Apr-16
Las Vegas, NV, Diversifi ed Portfolio
Residential Unidentifi ed Buyer/s Camden Property Trust 630 USD Las Vegas, NV Apr-16
Borås, Sweden, Multi-Family Portfolio
Residential AP-Fonden 1 Unidentifi ed Seller(s) 540 EURBorås,
SwedenApr-16
New York, NY, Hotel Portfolio
Hotel Cindat Capital Management Hersha 571 USD New York, NY May-16
Source: Preqin Real Estate Online
Data Source:
NEW! View detailed information on deal and exit size, type and location of assets purchased or sold, deal participants, service providers involved in the deal and much more.
For more information, or to arrange a demo, please visit: www.preqin.com/reo

+44 20 7121 5093 | [email protected] | www.europegri.com
DAVID BRUSHCIOMERLIN PROPERTIES SOCIMI, Spain
RICHARD CROFT CEOM7 REAL ESTATE, UK
GORDON BLACK Senior MD & Co-head of EuropeHEITMAN, UK
AREF LAHHAM Managing Director ORION CAPITAL MANAGERS, UK
FRÉDÉRIC BÔLHead of Real Estate FranceSWISS LIFE REIM, France
PARTICIPANTS INCLUDE:
DISDISDISDISCOVCOVCOVCOVCOVER ER ER ER ALLALLALLALL GR GR GR GRI EI EI EI EVENVENVENVENTSTSTSTS AfrAfrAfricaicaica Su Su Su Summimmimmimmimmimmimmimmitt • ArgArgArgArgArgentententententinainainaina ••• AsiAsiAsiaa ••• BraBraBraBrazilzilzil • Br Britiitiitishshsh • CEECEECEECEE ••• ColColColombombombiaia
DeuDeuDeuDeutsctsctschehehehe •• DeuDeuDeuDeutsctsctsctsche he he he WohWohWohWohnennennen ••• Ea Ea Ea East st st AfrAfrAfrAfricaica • EspEspEspaña • IndIndIndiaiaia ••• ItaItaItaly ly ly ••• MexMexicoicoico • Russiasia • WesWest At Afrifricaca
SinSinSinSince ce ce ce 1991991991991998, 8, 8, 8, GRIGRIGRIGRI me me me meetietietietingsngsngsngs pr pr pr proviovioviovide de de de a fa fa fa fa foruoruoruoruorum fm fm for or or thethethe wo wo worldrldrldrldrld’s leading real es estattattattate pe pe pe playlaylaylayersersersers to to to de de develvelvelvelop op op op op
valvalvalvalvaluabuabuabuabuable le le le relrelrelrelatiatiatiationsonsonsonsonshiphiphiphips, s, s, s, f infinfinfind nd nd nd new ew ew ew busbusbusbusineineineineiness ss ss parparpar tnetnetners,rs,rs, an an and sd sd sd sd strengthen their gl gl globaobaobaobal nl nl nl netwetwetwetworkorkorkorks.s.s.
Co n n e c t i n g Eu ro p e a n & G l o b a l R e a l E s t a t e Le a d e r s
INCORPORATING.....
FRANCEGRI2016FFFFRRRRAAAANNNNNCCCCCEEEEE
14-15 SEPPARIS
The 19th Annual
EUROPEEUROPEEUROPE GRI2016
HENRIE KÖTTER CIO & MD DevelopmentECE PROJEKTMANAGEMENT, Germany
alternative assets. intelligent data.
Funds | Fund Managers | Investors | Deals | Performance | Service Providers
For more on Preqin’s industry-leading online service, please visit:
www.preqin.com/REO
Real Estate Online: The Foundation for Opportunities
NEW
The Preqin Quarterly Update: Real Estate, Q2 2016
Download the data pack at:www.preqin.com/quarterlyupdate
9© 2016 Preqin Ltd. / www.preqin.com
Institutional Investors in Private Real Estate
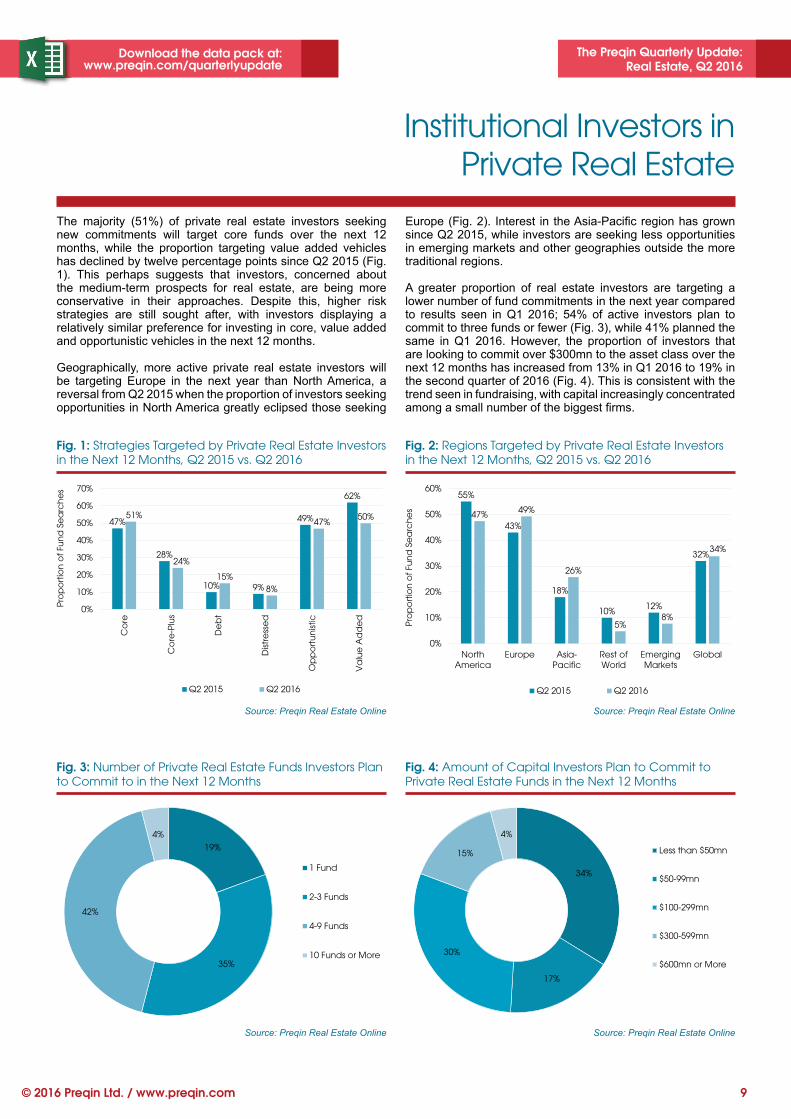
The majority (51%) of private real estate investors seeking new commitments will target core funds over the next 12 months, while the proportion targeting value added vehicles has declined by twelve percentage points since Q2 2015 (Fig. 1). This perhaps suggests that investors, concerned about the medium-term prospects for real estate, are being more conservative in their approaches. Despite this, higher risk strategies are still sought after, with investors displaying a relatively similar preference for investing in core, value added and opportunistic vehicles in the next 12 months.
Geographically, more active private real estate investors will be targeting Europe in the next year than North America, a reversal from Q2 2015 when the proportion of investors seeking opportunities in North America greatly eclipsed those seeking
Europe (Fig. 2). Interest in the Asia-Pacifi c region has grown since Q2 2015, while investors are seeking less opportunities in emerging markets and other geographies outside the more traditional regions.
A greater proportion of real estate investors are targeting a lower number of fund commitments in the next year compared to results seen in Q1 2016; 54% of active investors plan to commit to three funds or fewer (Fig. 3), while 41% planned the same in Q1 2016. However, the proportion of investors that are looking to commit over $300mn to the asset class over the next 12 months has increased from 13% in Q1 2016 to 19% in the second quarter of 2016 (Fig. 4). This is consistent with the trend seen in fundraising, with capital increasingly concentrated among a small number of the biggest fi rms.
47%
28%
10% 9%
49%
62%
51%
24%
15%
8%
47%50%
0%
10%
20%
30%
40%
50%
60%
70%
Co
re
Co
re-P
lus
De
bt
Dis
tre
sse
d
Op
po
rtu
nis
tic
Va
lue
Ad
de
d
Q2 2015 Q2 2016
Fig. 1: Strategies Targeted by Private Real Estate Investors in the Next 12 Months, Q2 2015 vs. Q2 2016
Source: Preqin Real Estate Online
Pro
po
rtio
n o
f Fu
nd
Se
arc
he
s
55%
43%
18%
10%12%
32%
47%49%
26%
5%8%
34%
0%
10%
20%
30%
40%
50%
60%
NorthAmerica
Europe Asia-Pacific
Rest ofWorld
EmergingMarkets
Global
Q2 2015 Q2 2016
Fig. 2: Regions Targeted by Private Real Estate Investors in the Next 12 Months, Q2 2015 vs. Q2 2016
Source: Preqin Real Estate Online
Pro
po
rtio
n o
f Fu
nd
Se
arc
he
s
19%
35%
42%
4%
1 Fund
2-3 Funds
4-9 Funds
10 Funds or More
Fig. 3: Number of Private Real Estate Funds Investors Plan to Commit to in the Next 12 Months
Source: Preqin Real Estate Online
34%
17%
30%
15%
4%
Less than $50mn
$50-99mn
$100-299mn
$300-599mn
$600mn or More
Fig. 4: Amount of Capital Investors Plan to Commit to Private Real Estate Funds in the Next 12 Months
Source: Preqin Real Estate Online
The Preqin Quarterly Update: Real Estate, Q2 2016
Download the data pack at:www.preqin.com/quarterlyupdate
10 © 2016 Preqin Ltd. / www.preqin.com
Dry Powder
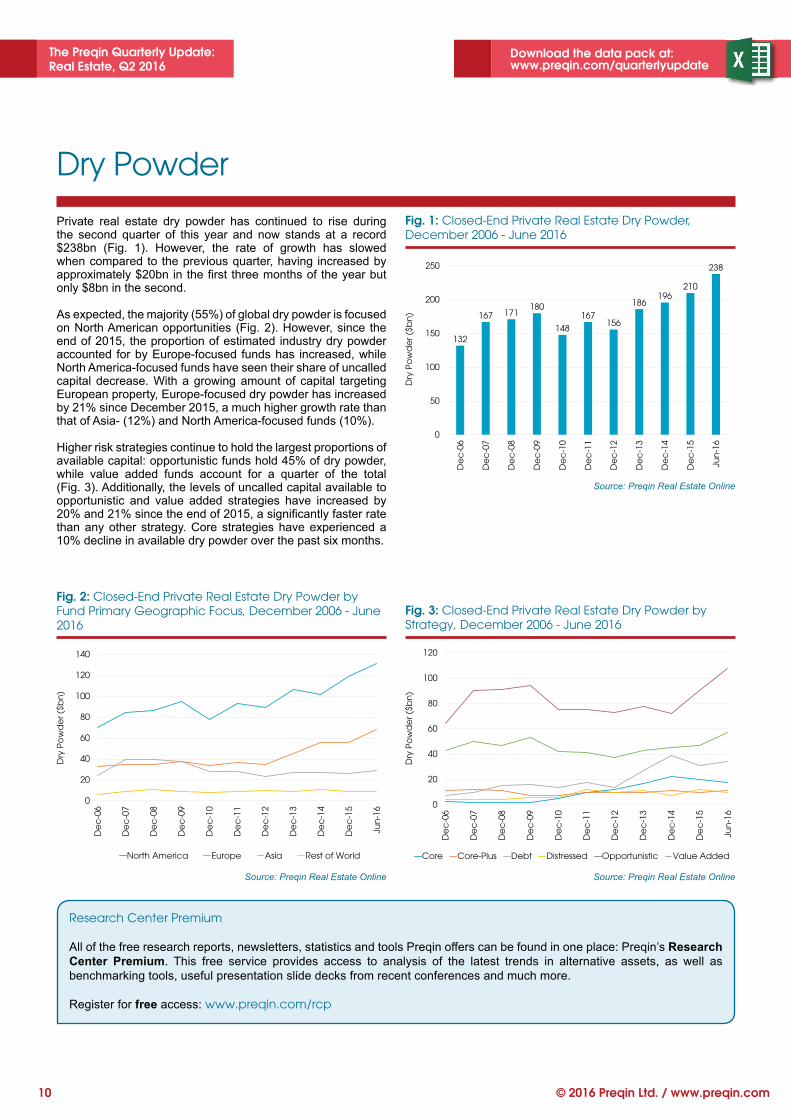
Private real estate dry powder has continued to rise during the second quarter of this year and now stands at a record $238bn (Fig. 1). However, the rate of growth has slowed when compared to the previous quarter, having increased by approximately $20bn in the fi rst three months of the year but only $8bn in the second.
As expected, the majority (55%) of global dry powder is focused on North American opportunities (Fig. 2). However, since the end of 2015, the proportion of estimated industry dry powder accounted for by Europe-focused funds has increased, while North America-focused funds have seen their share of uncalled capital decrease. With a growing amount of capital targeting European property, Europe-focused dry powder has increased by 21% since December 2015, a much higher growth rate than that of Asia- (12%) and North America-focused funds (10%).
Higher risk strategies continue to hold the largest proportions of available capital: opportunistic funds hold 45% of dry powder, while value added funds account for a quarter of the total (Fig. 3). Additionally, the levels of uncalled capital available to opportunistic and value added strategies have increased by 20% and 21% since the end of 2015, a signifi cantly faster rate than any other strategy. Core strategies have experienced a 10% decline in available dry powder over the past six months.
132
167 171180
148
167156
186196
210
238
0
50
100
150
200
250
De
c-0
6
De
c-0
7
De
c-0
8
De
c-0
9
De
c-1
0
De
c-1
1
De
c-1
2
De
c-1
3
De
c-1
4
De
c-1
5
Jun
-16
Fig. 1: Closed-End Private Real Estate Dry Powder, December 2006 - June 2016
Source: Preqin Real Estate Online
Dry
Po
wd
er
($b
n)
0
20
40
60
80
100
120
140
De
c-0
6
De
c-0
7
De
c-0
8
De
c-0
9
De
c-1
0
De
c-1
1
De
c-1
2
De
c-1
3
De
c-1
4
De
c-1
5
Jun
-16
North America Europe Asia Rest of World
Fig. 2: Closed-End Private Real Estate Dry Powder by Fund Primary Geographic Focus, December 2006 - June 2016
Source: Preqin Real Estate Online
Dry
Po
wd
er
($b
n)
0
20
40
60
80
100
120
De
c-0
6
De
c-0
7
De
c-0
8
De
c-0
9
De
c-1
0
De
c-1
1
De
c-1
2
De
c-1
3
De
c-1
4
De
c-1
5
Jun
-16
Core Core-Plus Debt Distressed Opportunistic Value Added
Fig. 3: Closed-End Private Real Estate Dry Powder by Strategy, December 2006 - June 2016
Source: Preqin Real Estate Online
Dry
Po
wd
er
($b
n)
Research Center Premium
All of the free research reports, newsletters, statistics and tools Preqin offers can be found in one place: Preqin’s Research
Center Premium. This free service provides access to analysis of the latest trends in alternative assets, as well as benchmarking tools, useful presentation slide decks from recent conferences and much more.
Register for free access: www.preqin.com/rcp

SEPTEMBER 14 & 15 , 2016 | LOS ANGELES
P R I V A T E E Q U I T Y S U M M I T :
REGISTER TODAY AT www.iglobalforum.com/repe15
KEY TOPICS TO BE COVERED INCLUDE: • A renewed look at the capital markets and global market volatility impacting high pricing
• New niche opportunities and sectors investors are looking to in diversifi cation efforts
• Understanding the LP and operator perspective, and the evolution of partnerships in 2017
• Strategies for conquering fundraising challenges and the contrary issue of dry powder
• The recent infl ux of foreign capital into US real estate, and what to expect next year
• Demand and demographic shifts in real estate caused by technology innovations
• Strategies in alternative debt providers and investors acting as lenders to complement equity portfolios in the wake of new banking regulations
• The increasing importance of GP and OP partnerships in JV equity deals
KEYNOTE INTERVIEW WITH:
Use
discount code
PREQIN for 10% off
Bert J. Crouch
Managing Director,
Portfolio Manager –
Structured Investments
INVESCO REAL
ESTATE
Call: 1-212-901-0542 | http://www.imn.org/cfoeast16 | Email: [email protected]
Reference Discount Code “PQ10” for 10% Discount
REAL ESTATE CFO FORUM
The 5th Annual
Advisory Board Members:
September 19-20, 2016 | New York, NY
Eric Graham, CFO, BLUEPRINT CAPITAL REIT
Alex Topchy, CFO, BROAD STREET REALTY
Joel Hammer, CFO, CASTELLAN REAL ESTATE PARTNERS
John Warch, CFO, FOUR SPRINGS CAPITAL TRUST
Michael Giglio, CFO, KAUFMAN MANAGEMENT COMPANY, LLC
Marc Ehrlich, CFO, ROSE ASSOCIATES
James Allen, SVP & CFO, STARWOOD CAPITAL GROUP
Jerry Fink, Managing Partner, THE BASCOM GROUP, LLC
Michael Schurer, CFO, THOR EQUITIES, LLC
The Preqin Quarterly Update: Real Estate, Q2 2016
Download the data pack at:www.preqin.com/quarterlyupdate
12 © 2016 Preqin Ltd. / www.preqin.com
Fund Performance
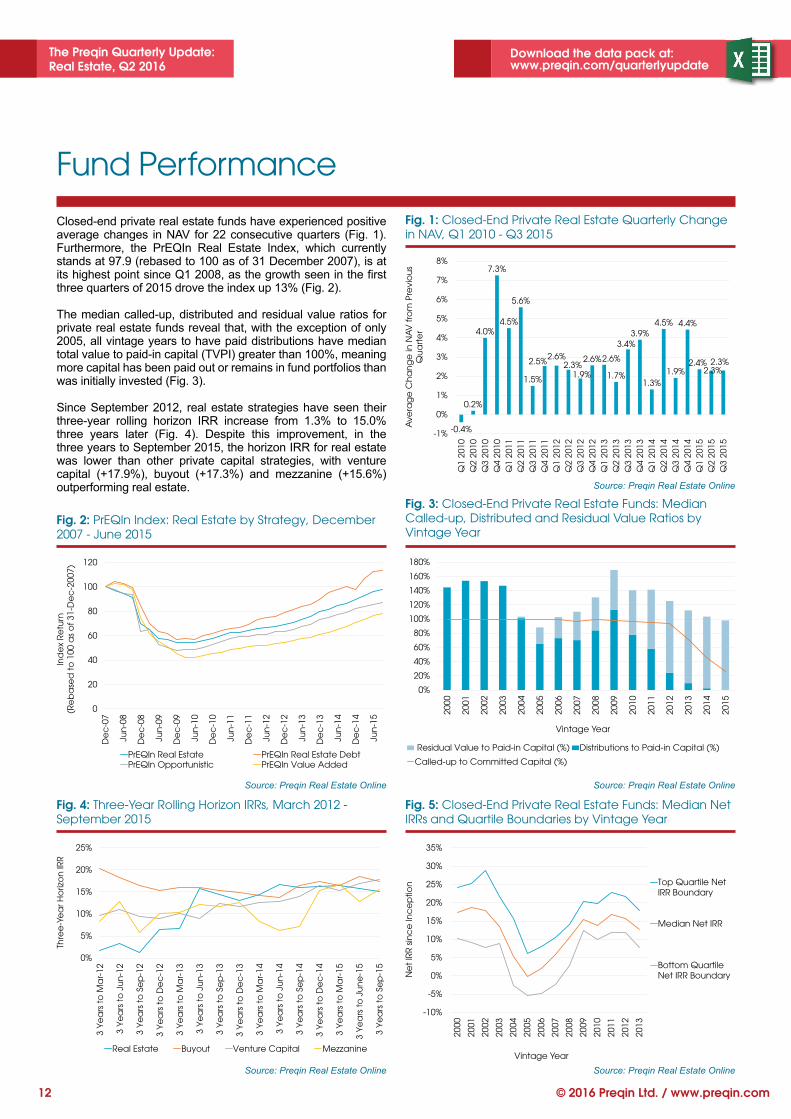
Closed-end private real estate funds have experienced positive average changes in NAV for 22 consecutive quarters (Fig. 1). Furthermore, the PrEQIn Real Estate Index, which currently stands at 97.9 (rebased to 100 as of 31 December 2007), is at its highest point since Q1 2008, as the growth seen in the fi rst three quarters of 2015 drove the index up 13% (Fig. 2).
The median called-up, distributed and residual value ratios for private real estate funds reveal that, with the exception of only 2005, all vintage years to have paid distributions have median total value to paid-in capital (TVPI) greater than 100%, meaning more capital has been paid out or remains in fund portfolios than was initially invested (Fig. 3).
Since September 2012, real estate strategies have seen their three-year rolling horizon IRR increase from 1.3% to 15.0% three years later (Fig. 4). Despite this improvement, in the three years to September 2015, the horizon IRR for real estate was lower than other private capital strategies, with venture capital (+17.9%), buyout (+17.3%) and mezzanine (+15.6%) outperforming real estate.
-0.4%
0.2%
4.0%
7.3%
4.5%
5.6%
1.5%
2.5%2.6%
2.3%1.9%
2.6%2.6%
1.7%
3.4%3.9%
1.3%
4.5%
1.9%
4.4%
2.4%2.3%
2.3%
-1%
0%
1%
2%
3%
4%
5%
6%
7%
8%
Q1
20
10
Q2
20
10
Q3
20
10
Q4
20
10
Q1
20
11
Q2
20
11
Q3
20
11
Q4
20
11
Q1
20
12
Q2
20
12
Q3
20
12
Q4
20
12
Q1
20
13
Q2
20
13
Q3
20
13
Q4
20
13
Q1
20
14
Q2
20
14
Q3
20
14
Q4
20
14
Q1
20
15
Q2
20
15
Q3
20
15
Fig. 1: Closed-End Private Real Estate Quarterly Change in NAV, Q1 2010 - Q3 2015
Source: Preqin Real Estate Online
Av
era
ge
Ch
an
ge
in N
AV
fro
m P
rev
iou
s Q
ua
rte
r
0
20
40
60
80
100
120
De
c-0
7
Jun
-08
De
c-0
8
Jun
-09
De
c-0
9
Jun
-10
De
c-1
0
Jun
-11
De
c-1
1
Jun
-12
De
c-1
2
Jun
-13
De
c-1
3
Jun
-14
De
c-1
4
Jun
-15
PrEQIn Real Estate PrEQIn Real Estate DebtPrEQIn Opportunistic PrEQIn Value Added
Fig. 2: PrEQIn Index: Real Estate by Strategy, December 2007 - June 2015
Source: Preqin Real Estate Online
Ind
ex
Re
turn
(R
eb
ase
d t
o 1
00
as
of
31
-De
c-2
00
7)
0%
20%
40%
60%
80%
100%
120%
140%
160%
180%
20
00
20
01
20
02
20
03
20
04
20
05
20
06
20
07
20
08
20
09
20
10
20
11
20
12
20
13
20
14
20
15
Residual Value to Paid-in Capital (%) Distributions to Paid-in Capital (%)
Called-up to Committed Capital (%)
Fig. 3: Closed-End Private Real Estate Funds: Median Called-up, Distributed and Residual Value Ratios by Vintage Year
Source: Preqin Real Estate Online
Vintage Year
0%
5%
10%
15%
20%
25%
3 Y
ea
rs t
o M
ar-
12
3 Y
ea
rs t
o J
un
-12
3 Y
ea
rs t
o S
ep
-12
3 Y
ea
rs t
o D
ec
-12
3 Y
ea
rs t
o M
ar-
13
3 Y
ea
rs t
o J
un
-13
3 Y
ea
rs t
o S
ep
-13
3 Y
ea
rs t
o D
ec
-13
3 Y
ea
rs t
o M
ar-
14
3 Y
ea
rs t
o J
un
-14
3 Y
ea
rs t
o S
ep
-14
3 Y
ea
rs t
o D
ec
-14
3 Y
ea
rs t
o M
ar-
15
3 Y
ea
rs t
o J
un
e-1
5
3 Y
ea
rs t
o S
ep
-15
Real Estate Buyout Venture Capital Mezzanine
Fig. 4: Three-Year Rolling Horizon IRRs, March 2012 - September 2015
Source: Preqin Real Estate Online
Thre
e-Y
ea
r H
oriz
on
IRR
-10%
-5%
0%
5%
10%
15%
20%
25%
30%
35%
20
00
20
01
20
02
20
03
20
04
20
05
20
06
20
07
20
08
20
09
20
10
20
11
20
12
20
13
Top Quartile NetIRR Boundary
Median Net IRR
Bottom QuartileNet IRR Boundary
Fig. 5: Closed-End Private Real Estate Funds: Median Net IRRs and Quartile Boundaries by Vintage Year
Source: Preqin Real Estate Online
Ne
t IR
R s
inc
e In
ce
ptio
n
Vintage Year
The Preqin Quarterly Update: Real Estate, Q2 2016
Download the data pack at:www.preqin.com/quarterlyupdate
13© 2016 Preqin Ltd. / www.preqin.com
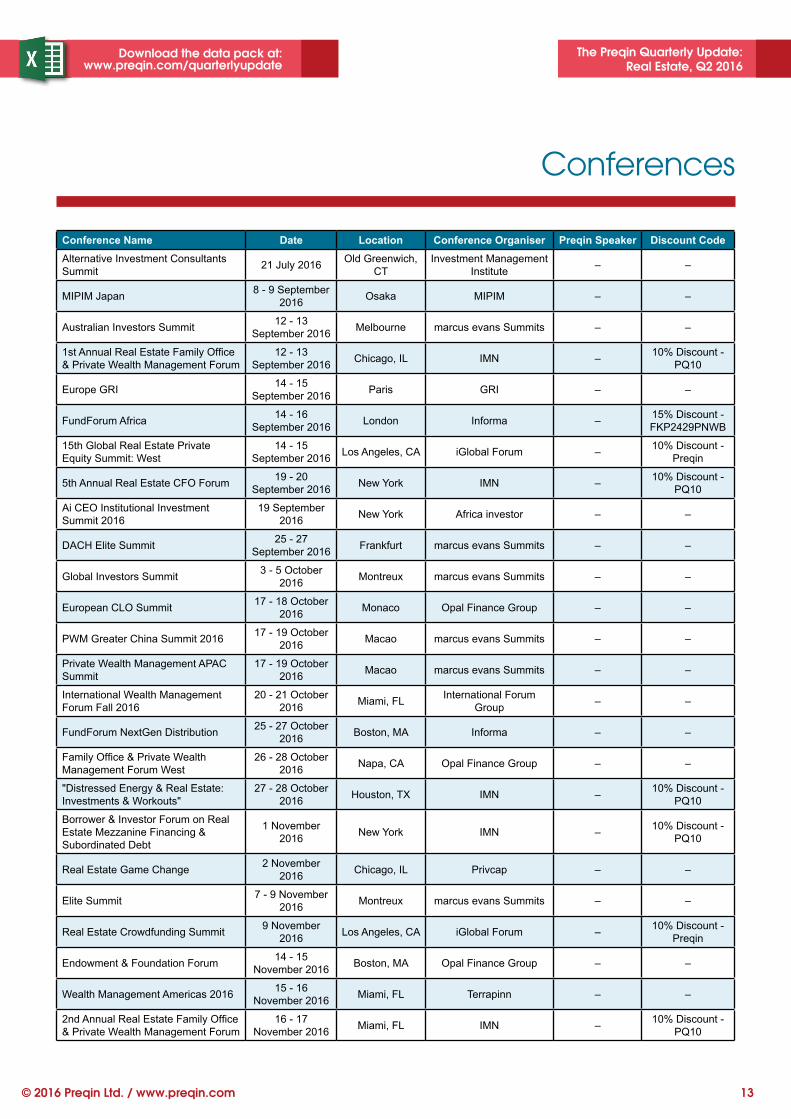
Conferences
Conference Name Date Location Conference Organiser Preqin Speaker Discount Code
Alternative Investment Consultants Summit
21 July 2016Old Greenwich,
CTInvestment Management
Institute– –
MIPIM Japan8 - 9 September
2016Osaka MIPIM – –
Australian Investors Summit12 - 13
September 2016Melbourne marcus evans Summits – –
1st Annual Real Estate Family Offi ce & Private Wealth Management Forum
12 - 13 September 2016
Chicago, IL IMN –10% Discount -
PQ10
Europe GRI14 - 15
September 2016Paris GRI – –
FundForum Africa14 - 16
September 2016London Informa –
15% Discount - FKP2429PNWB
15th Global Real Estate Private Equity Summit: West
14 - 15 September 2016
Los Angeles, CA iGlobal Forum –10% Discount -
Preqin
5th Annual Real Estate CFO Forum19 - 20
September 2016New York IMN –
10% Discount - PQ10
Ai CEO Institutional Investment Summit 2016
19 September 2016
New York Africa investor – –
DACH Elite Summit25 - 27
September 2016Frankfurt marcus evans Summits – –
Global Investors Summit3 - 5 October
2016Montreux marcus evans Summits – –
European CLO Summit17 - 18 October
2016Monaco Opal Finance Group – –
PWM Greater China Summit 201617 - 19 October
2016Macao marcus evans Summits – –
Private Wealth Management APAC Summit
17 - 19 October 2016
Macao marcus evans Summits – –
International Wealth Management Forum Fall 2016
20 - 21 October 2016
Miami, FLInternational Forum
Group– –
FundForum NextGen Distribution25 - 27 October
2016Boston, MA Informa – –
Family Offi ce & Private Wealth Management Forum West
26 - 28 October 2016
Napa, CA Opal Finance Group – –
"Distressed Energy & Real Estate:Investments & Workouts"
27 - 28 October 2016
Houston, TX IMN –10% Discount -
PQ10
Borrower & Investor Forum on Real Estate Mezzanine Financing & Subordinated Debt
1 November 2016
New York IMN –10% Discount -
PQ10
Real Estate Game Change2 November
2016Chicago, IL Privcap – –
Elite Summit7 - 9 November
2016Montreux marcus evans Summits – –
Real Estate Crowdfunding Summit9 November
2016Los Angeles, CA iGlobal Forum –
10% Discount - Preqin
Endowment & Foundation Forum14 - 15
November 2016Boston, MA Opal Finance Group – –
Wealth Management Americas 201615 - 16
November 2016Miami, FL Terrapinn – –
2nd Annual Real Estate Family Offi ce & Private Wealth Management Forum
16 - 17 November 2016
Miami, FL IMN –10% Discount -
PQ10
The Preqin Quarterly Update: Real Estate, Q2 2016
Download the data pack at:www.preqin.com/quarterlyupdate
14 © 2016 Preqin Ltd. / www.preqin.com
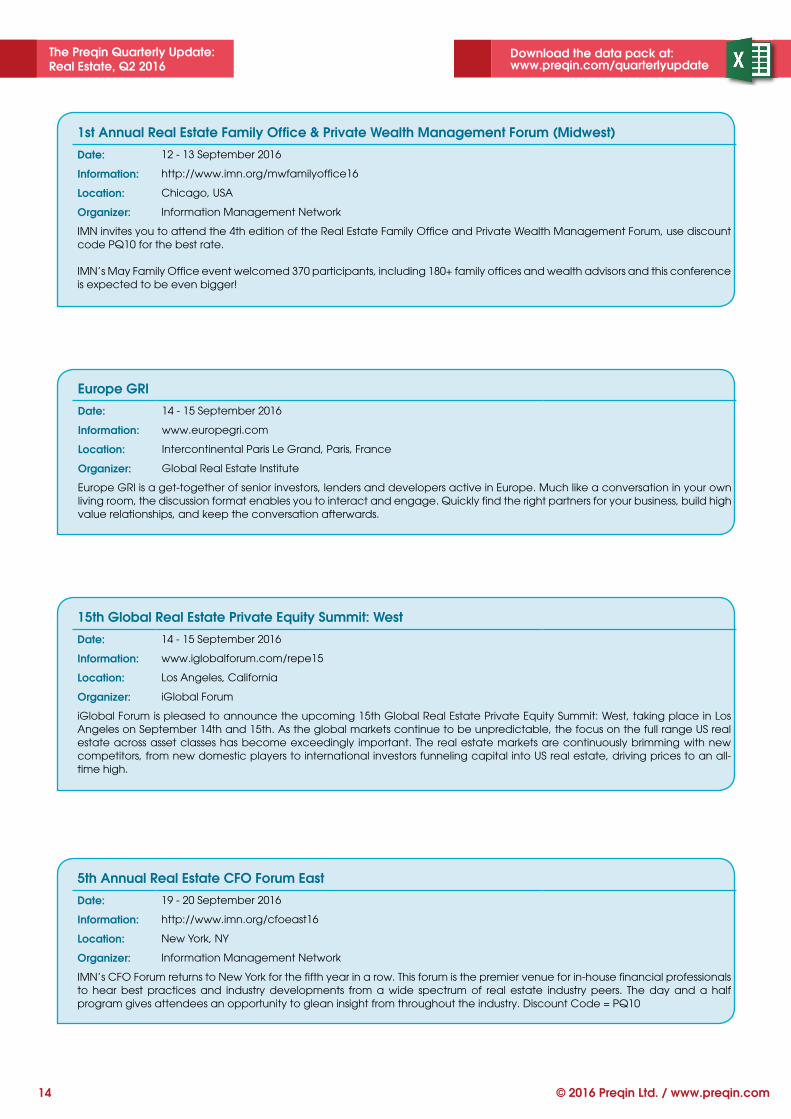
Europe GRI
Date: 14 - 15 September 2016
Information: www.europegri.com
Location: Intercontinental Paris Le Grand, Paris, France
Organizer: Global Real Estate Institute
Europe GRI is a get-together of senior investors, lenders and developers active in Europe. Much like a conversation in your own living room, the discussion format enables you to interact and engage. Quickly find the right partners for your business, build high value relationships, and keep the conversation afterwards.
15th Global Real Estate Private Equity Summit: West
Date: 14 - 15 September 2016
Information: www.iglobalforum.com/repe15
Location: Los Angeles, California
Organizer: iGlobal Forum
iGlobal Forum is pleased to announce the upcoming 15th Global Real Estate Private Equity Summit: West, taking place in Los Angeles on September 14th and 15th. As the global markets continue to be unpredictable, the focus on the full range US real estate across asset classes has become exceedingly important. The real estate markets are continuously brimming with new competitors, from new domestic players to international investors funneling capital into US real estate, driving prices to an all-time high.
5th Annual Real Estate CFO Forum East
Date: 19 - 20 September 2016
Information: http://www.imn.org/cfoeast16
Location: New York, NY
Organizer: Information Management Network
IMN’s CFO Forum returns to New York for the fifth year in a row. This forum is the premier venue for in-house financial professionals to hear best practices and industry developments from a wide spectrum of real estate industry peers. The day and a half program gives attendees an opportunity to glean insight from throughout the industry. Discount Code = PQ10
1st Annual Real Estate Family Office & Private Wealth Management Forum (Midwest)
Date: 12 - 13 September 2016
Information: http://www.imn.org/mwfamilyoffice16
Location: Chicago, USA
Organizer: Information Management Network
IMN invites you to attend the 4th edition of the Real Estate Family Office and Private Wealth Management Forum, use discount code PQ10 for the best rate.
IMN’s May Family Office event welcomed 370 participants, including 180+ family offices and wealth advisors and this conference is expected to be even bigger!

alternative assets. intelligent data.
Find out how Preqin’s range of real estate products and services can help you:
www.preqin.com/reo
The Q2 2016
Preqin Quarterly Update:
Real Estate
If you want any further information, or
would like a demo of our products,
please contact us:
New York:
One Grand Central Place
60 E 42nd Street, Suite 630
New York
NY 10165
Tel: +1 212 350 0100
Fax: +1 440 445 9595
London:
3rd Floor
Vintners’ Place
68 Upper Thames Street
London
EC4V 3BJ
Tel: +44 (0)20 3207 0200
Fax: +44 (0)87 0330 5892
Singapore:
One Finlayson Green, #11-02
Singapore 049246
Tel: +65 6305 2200
Fax: +65 6491 5365
San Francisco:
One Embarcadero Center
Suite 2850
San Francisco
CA 94111
Tel: +1 415 316 0580
Fax: +1 440 445 9595
Hong Kong:
Level 9, Central Building
1-3 Pedder Street
Central, Hong Kong
Tel: +852 3958 2819
Fax: +852 3975 2800
Manila:
Pascor Drive
Sto. Niño
Parañaque City
Metro Manila 1700
Philippines
Email: [email protected]
Web: www.preqin.com
Preqin Real Estate Online
With global coverage and detailed information on all aspects of the real estate asset class, Preqin’s industry-leading Real Estate Online service keeps you up-to-date on all the latest developments in the real estate universe.
Source new investors for funds and co-investments
Find the most relevant investors, with access to detailed profi les for over 5,300 institutional investors actively investing in real estate.
Discover and scrutinize real estate deals and exits
View detailed information on deal and exit size, type and location of assets purchased or sold, deal participants, service providers involved in the deal and much more.
Identify potential investment opportunities
View in-depth profi les for over 5,100 private real estate funds encompassing all strategies, including core, core-plus, value added, opportunistic, debt, distressed and fund of funds.
Find active fund managers in real estate
Search for fi rms actively targeting real estate investments and see how much dry powder they have available, with detailed profi les on over 3,500 fund managers globally.
Analyze the latest real estate fundraising activity
See which fund managers are currently on the road raising a real estate fund and which will be coming to market soon. Analyze fundraising by fund strategy, property type and location.
Benchmark performance
Identify which fund managers have the best track records, with performance benchmarks for real estate funds and performance details for over 1,500 individual named funds.
Examine fund terms
Use our Fund Terms Calculator to model fee changes and evaluate typical terms charged, the implications of making changes to fees and how they vary across type and strategy.