the post-anaesthetic care unit of mount sinai hospital
TRANSCRIPT

The Post-Anaesthetic Care Unit of Mount Sinai Hospital
Process Improvement Challenges and Opportunities
Laura Hofman
Toronto August, 2012

Process improvement at the PACU . Laura Hofman
2
Author
Laura Hofman
Supervisors
Prof. dr. ir. M.W. Carter
University of Toronto, Department of Mechanical and Industrial Engineering
A. Macdonald, MBA
Mount Sinai Hospital, Office of Quality and Performance Measurement
Dr. ir. E.W. Hans
University of Twente, School of Management and Governance
Dr. P.M. Carrera
University of Twente, School of Management and Governance

Process improvement at the PACU . Laura Hofman
3
Management Summary “More efficient, transparent and innovative hospitals can be achieved by introducing business and logistic perspectives in the health care sector” (TPG, 2004).
Motive
The Post-Anaesthetic Care Unit (PACU) of Mount Sinai Hospital struggles with a long length of stay of patients
in the PACU. A possible explanation is that it is not clear to the staff members when a patient is ready to go to
the Inpatient Unit. This results in many uncertainties from the time the nurse records the time ready to the
moment the bay is clean and ready to receive a new patient. The focus of this research is the time the
inpatients wait to be transferred to the IP-unit (time nurse records time ready to the moment the patient
leaves the PACU), since this time shows many inefficiencies and gives room for improvement.
Objective and approach
The objective of this research is to review the PACU processes and give suggestions to decrease the length of
stay of patients in the PACU resulting in an improved patient experience without having a negative impact on
costs. To accomplish the goal of this research, the research is divided into the following parts. First we use a
general system approach to analyse the main components of the PACU: the input and output (patient flows),
resources, and processes. With seven shadow days, and four preliminary shadow days, this research
measures the duration of these processes and identifies the inefficiencies in the process using lean
philosophy and workflow improvement tools. After this analysis, this research combines the literature and
analysis to propose practical interventions to reduce the length of stay of patients in the PACU.
Analysis
This research provides an extensive systematic analysis and starts with uncovering the black box of the PACU
by analysing the patient flow and supporting resources of the processes in the department. After the
description of this environment, we describe the performance of the current processes in terms of the length
of stay, and we identify inefficiencies by doing various measurements. The inflow and outflow shows a
relatively stable daily and weekly pattern and gives input to adapt the daily and weekly schedule to the
numbers of patients in the PACU. Currently, the PACU uses a static daily and weekly schedule for nurses,
porters and housekeepers which is not adapted to the fluctuations in demand. The length of stay of patients in
the PACU (2.75 hours for same day admits and inpatients) is strongly related to the number of patients in the
PACU of every hour of the day and every day of the week. The process of transferring the patient to the
nursing units is identified as the main cause of this relationship, since at busy times the impact of this process
is higher than at quiet times. Besides the length of stay of patients in the PACU, we also analyse the excessive
time between closing a patient to the moment the bay is clean. This analysis identifies where the PACU should
intervene their processes and how many minutes this reduces the cycle time.
Results With a focus on the processes after the time ready, the value stream map presents eight delays which give an
opportunity for improvement (3 processes and 5 waiting times). The biggest delay is between the time ready
and the moment the ward clerk calls the porter (on average 40.5 minutes). This problem is, mainly, not
controllable by the PACU, since the bottleneck appears at the IP-unit. The controllable delays by the PACU
affect the length of stay of patients in the PACU with 12.4 minutes and affect the cycle time from closing a
patient in the OR to the moment the bay is clean and a new patient can enter the bay 36.8 minutes. The non-
controllable delays affect the length of stay with 38 minutes and affect the cycle time with 52.7 minutes. This

Process improvement at the PACU . Laura Hofman
4
research identifies sixteen causes of the delays in the PACU. The main problems are that staff in the PACU act
too late, since there is no overview of the available staff and it is not clear when the patient and bay status
changes. Furthermore, the PACU performs some processes which are not necessary to accomplish their goal
of recovering patients after surgery. The last problem is that the scheduling of the nurses, housekeepers and
porters do not fit to the fluctuating demand.
To reduce the time waiting to be transferred and improve the visibility of the patient status during the
process, we suggest interventions for the PACU. The interventions are divided into three main categories
based on the identified problems. First of all, the interventions suggest eliminating some processes. Second,
the interventions suggest using a visual management system which gives clarity of the bay and patient status.
Third, the interventions are based on changing the schedules of housekeepers and porters.
Recommendations
Since the focus of this project is improving processes, we strongly recommend to do further research in
adapting the schedules of the nurses to the fluctuations in demand on different days and hours of the day.
This research does not take into account the waiting times before the time ready. The biggest time that affects
the length of stay of patients in the PACU is the recovery process. We recommend to do further research to
reduce this process, since this duration is much higher in comparison to the average time in literature.

Process improvement at the PACU . Laura Hofman
5
Preface
After 1 week of observation, 12 weeks of research and 52 weeks of organisation, this thesis in front of you is
the result. On my way from the start in Enschede with organising a project outside Europe to the moment this
project is finished in Toronto, I have gained a lot of experience and learnt a lot of the people in my
environment. This whole experience has developed my organisational skills, has given insight in the
processes and dynamics of hospitals, and last but not least, has learnt me a lot of other cultures and different
social standards.
This project in Mount Sinai Hospital in Toronto was not possible without some people. First of all, I want to
thank my cheerful supervisor Michael Carter from the University of Toronto. He was involved from the very
first beginning and has supported me in many ways. From finding a place to live, to providing his critical view
and inspiration, he was the one who was always able to help. In addition, I want to thank my supervisor
Erwin Hans from the University of Twente who was also involved from the very first beginning. He has
supported me with finding a research project, has provided useful comments, and created my enthusiasm for
industrial engineering in health care. I also want to thank my supervisor Percivil Carrera from the University
of Twente for his guidance and his contribution to this research from a more Health Science perspective.
During the 12 weeks of research, many people of Mount Sinai Hospital have supported me and given me a
really enjoyable time in Toronto. I want to thank my supervisor Allan McDonald from the Office of Quality and
Performance Measurement from MSH for guiding me in this project and spending his spare time to read and
discuss all the pages of this research. Besides his positive and pretty formulated recommendations, he also
gave me insight in management and leadership skills. I also want to thank the manager, nurses and ward
clerk of the PACU for showing me their department and our anecdotal conversations which gave insight in
many problems. Moreover, I want to thank Gréanne for filling the air with some Dutch jokes or laughs during
a hard day’s work and our very good time in Canada.
Enjoy reading!
Laura Hofman
Toronto, July 2012

Process improvement at the PACU . Laura Hofman
6
Table of contents
Management Summary ....................................................................................................................... 3
Preface ...................................................................................................................................................... 5
1. Introduction .................................................................................................................................... 8
1.1 Background .......................................................................................................................... 8
1.2 Context ............................................................................................................................... 10
1.3 Problem definition ............................................................................................................ 11
1.4 Research objective ............................................................................................................ 11
1.5 Research questions and approach ................................................................................... 11
1.6 Scope .................................................................................................................................. 13
2. Literature ....................................................................................................................................... 14
2.1 System theory .................................................................................................................... 14
2.2 Lean thinking ..................................................................................................................... 15
2.3 Workflow improvement ................................................................................................... 17
2.4 Visual Management Systems ............................................................................................ 18
2.5 Conclusion.......................................................................................................................... 18
3. Analysis of the PACU .................................................................................................................. 20
3.1 Patient flow in the PACU ................................................................................................... 20
3.2 Resources ........................................................................................................................... 24
3.3 Processes and activities .................................................................................................... 27
3.4. Scenario analyses ............................................................................................................. 42
3.5 Summary ............................................................................................................................ 46
4. Suggestions for improvement ................................................................................................. 49
4.1 Process interventions ....................................................................................................... 49
4.2 Visual Management in the PACU ...................................................................................... 53
4.3 Future state value stream map ........................................................................................ 57
4.4 Implementation of interventions ..................................................................................... 58
4.5 Conclusion.......................................................................................................................... 58
5. Discussion, Recommendations, Conclusion .......................................................................... 60
5.1 Discussion .......................................................................................................................... 60
5.2 Recommendations............................................................................................................. 62
5.3 Conclusion.......................................................................................................................... 64

Process improvement at the PACU . Laura Hofman
7
References ............................................................................................................................................. 66
Appendixes ............................................................................................................................................ 68
Appendix A: Plan research project......................................................................................... 68
Appendix B: Patient flow based on patient type ................................................................... 69
Appendix C: Patient flow based on type of surgery .............................................................. 70
Appendix D: Interview PACU manager .................................................................................. 72
Appendix E: Workflow PACU ................................................................................................. 73
Appendix F: Discharge criteria list ......................................................................................... 74
Appendix G: GRASP Workload Instrument ........................................................................... 81
Appendix H: Current and necessary staffing on each day of the week ............................... 82
Appendix I: Adapted schedules .............................................................................................. 85

Process improvement at the PACU . Laura Hofman
8
1. Introduction
This chapter is an introduction to the project which is accomplished at the Office of Quality and Performance
Measurement (OQPM) for the Post-Anaesthetic Care Unit at Mount Sinai Hospital in Toronto (Canada).
Section 1.1 gives a research background of the problems in Mount Sinai Hospital. Section 1.2 introduces
Mount Sinai Hospital and the problems they are facing. Section 1.3 states the problem definition and section
1.4 states the research objective and the methodological approach for the research questions. The last section
1.5 gives the scope of this research.
1.1 Background Health care is faced with a changing environment and a changing demand. Influencing factors are the
demographic changes, merging hospitals, the changing patient, the changing role of the government, and
scarcity of labour. These factors invariably impact on the demand and supply of health care resulting into
waiting lists, capacity problems and patient flow challenges.
Many hospitals are struggling with these problems. They have to deliver good quality of care to keep their
patients and other stakeholders satisfied while available resources are limited. To bridge the gap in health
care, hospitals should continuously improve their processes by working efficiently, effectively, and more
transparent. Business approaches and methods are increasingly used in health care as a potential solution for
improving efficiency, effectiveness, and transparency.
Patient flow problems and capacity problems also occur in Mount Sinai Hospital (MSH) in Toronto (Canada),
a teaching and research hospital specialised in maternity care. Founded in 1923 as 33-bed Hebrew Maternity
and Convalescent Hospital by four immigrants from the Jewish community, is nowadays a highly specialised
teaching and research hospital in maternity care of 472 beds.
The mission of MSH is to discover and deliver the best patient care, research and education with the heart
and values true to their heritage (Mount Sinai Hospital, Who we are, 2012). The core values of MSH linked
with their mission are described as (Mount Sinai Hospital, Who we are):
1. excellence and innovation in clinical care, teaching and research
2. patient-centred care
3. teamwork
4. collaboration
5. respect and diversity
6. leadership

Process improvement at the PACU . Laura Hofman
9
Figure 1: Geographical location MSH and their surrounding hospitals (Google Maps, 2012)
In the last three years, the number of admissions has increased from 25,358 to 26,595 admissions a year
while the number of staff remains stable and the number of beds is decreasing (see Table 1). Most of the
births in Toronto, especially the high risk cases, occur in MSH. The numbers of births have increased with
approximately 300 births in the last three years. Table 1 shows more facts of MSH from the fiscal years 2009,
2010 and 2011 (Mount Sinai Hospital, Fast facts, 2012).
Inpatient and operating room activity
Year ending March 2011
Year ending March 2010
Year ending March 2009
Admissions 26,595 25,875 25,358
Births 6,994 6,842 6,717
Surgical procedures 19,910 19,757 20,206
Beds 440 464 464
Ambulatory activity
Ambulatory care visits 688,000 674,000 665,000
Hospital Staffing
Full time 2,392 2,391 2,397
Part time 1,103 1,103 1,063
Volunteers 1,172 1,129 1,016 Table 1: Mount Sinai Hospital facts 2009, 2010 and 2011 (Mount Sinai Hospital, Fast facts, 2012)
MSH has six centres of excellence, and one of the most important centres to highlight their expertise is the
Lawrence and Frances Centre for Women’s and Infants’ Health. This centre offers a wide range of mother and
child services from general obstetrics and gynaecology to prenatal screening and maternal and infant health.
The other excellence centres are the centre for Surgical Oncology, Inflammatory Bowel Disease,
Musculoskeletal Disease and the Samuel Lunenfeld Research Institute (Mount Sinai Hospital, Centres of
Excellence, 2012).

Process improvement at the PACU . Laura Hofman
10
1.2 Context
One of the strategic objectives in the scope of this research that is linked to the mission of MSH is to improve
the patient experience. To deliver the best patient care and to improve the patient experience, the hospital
has to work efficient and effective with their available resources (financial resources, operating resources and
human resources). The problem at MSH is that the elective inpatient surgical processes at Mount Sinai
Hospital are currently disjointed which adversely affects patient experience. Symptoms of the disjointed
procedures are excess waiting time for the patient on the day of surgery, particularly in the Post-Anaesthetic
Care Unit, cancelling of surgeries, a lack of clarity for the stakeholders in the journey, delays in discharge from
the hospital and suboptimal preparation for the patient regarding the necessary care following his/her
discharge.
The PACU is an area for recovery for patients after surgery and administration of anaesthesia with special
personnel and equipment (Mount Sinai Hospital, Post-Anaesthetic Care Unit). The Post-Anaesthetic Care Unit
(PACU), one of the high-demand areas in a hospital, is often a bottle-neck in the health care delivery process
(Grant and Wilcox, 2008). Delays in this critical department have a huge impact on the performance of the
PACU and their adjacent areas: the operating rooms (ORs) and the inpatient units (IP-units). Because of the
deviation between their strategic objective and the current patient experience, the management has initiated
the project ‘Improving the elective inpatient surgical experience’ in 2011 to improve the health care
pathways and the patient satisfaction.
Once a patient reaches the PACU following their surgical procedure, there are two key time frames: the ‘time
recovering’ (‘time of arrival’ to ‘time ready to be transferred’) and the ‘time waiting to be transferred’ (‘time
ready to be transferred’ to ‘time transferred to nursing unit’). One of the problems in the PACU is that the
‘time waiting to be transferred’ is too long and it considerably affects the length of stay (LOS) (time from
enter PACU until departure PACU). This is one of the major problems MSH wants to tackle as a part of the
project ‘Improving the elective inpatient surgical experience’.
The Office of Quality and Performance Measurement has organised a meeting with the OR and PACU staff
(excluding surgeons and anaesthetists) to make them aware of the need to improve the PACU and to
operationalise the current problems at the PACU. After this meeting, the main problems, the controllable
problems for the PACU with the longest waste time, are identified. We will now discuss the main problem that
this research focuses on and can be accomplished in the time horizon of this project.
Currently a standardised workflow of the ‘time waiting to be transferred’ in the PACU does not exist. Nor is
there a standard method to visually identify to all team members when a patient is ready to go to the IP-unit.
A standardised workflow, optimising this workflow and to visually identify to all team members when the
patient is ready to go would add value to reduce the time waiting to be transferred and to the whole project
underway to help improve the patient experience for the elective surgical patient at MSH.
In this thesis, we research this problem by analysing the current situation and developing a workflow. Based
on the analysis and literature, a description of the main problems in this workflow and suggestions for
improvement follows. One of the suggestions is a visual management system that identifies to all team
members when a patient is ready and what the next steps are that need to be taken.

Process improvement at the PACU . Laura Hofman
11
1.3 Problem definition
The management of MSH realised that more insight is needed in the processes in ‘time waiting to be
transferred’ to all team members to decrease the length of stay which results in an improved patient
experience and a reduction of costs. This leads to the following problem statement:
‘The processes between ‘time ready to be transferred’ to ‘time transferred to Inpatient Unit’ are not
standardised and there is no standard method to identify to all team members when a patient is ready
to be transferred to the Inpatient Unit. To decrease the length of stay of patients in the PACU, more
insight is needed in these processes.’
1.4 Research objective
The objective of this research is:
‘To review and give suggestions for the existing processes in the time waiting to be transferred to
decrease the length of stay of patients in the PACU without making a negative impact on costs.’
1.5 Research questions and approach
In this research we use qualitative and quantitative methods. The qualitative methods give in depth insight in
the processes and their dynamics. The quantitative methods give insight in the performance of the PACU over
the last year to establish where the standard deviations in the processes are. To realise this objective, the
research answers the following research questions:
1. What are the current processes and supporting resources in the PACU and how can these
processes be organised in a workflow?
Chapter 3 gives an analysis of the current situation of the main components in the PACU in a system
approach. Section 3.1 starts with a description and analysis of the patient in- and outflows. Section 3.2
presents the involved resources as a second element of a system. Section 3.3 describes and analyses the
processes in the black box and the length of stay of patients in this black box.
The methodologies based on these approaches which we use to answer research question 1 are shadow days,
interviews, and two data sets. To get familiar with the inflow, outflow, resources and processes in the PACU,
we conduct four shadow days at the PACU and map out the current situation. To get a broad perspective of
the current situation in the PACU, interviews take place with the ward clerk, the manager and a nurse of the
PACU. We create a workflow with Microsoft Office Visio 2010 based on recent work from Christopher
Parantela, a researcher at Mount Sinai Hospital. The four shadow days serve as an instrument to validate the
workflow. After validating the model, we look into more detail and describe and analyse the processes and
their durations using data sets and seven shadow days at the PACU.
For a quantitative analysis we use the data set from the PACU of the fiscal year 2011 (March 2011 to March
2012) (data set PACU, 2011) and an OR data set of the months January 2012 to May 2012 (data set OR, 2012).

Process improvement at the PACU . Laura Hofman
12
2. Which theories can be applied to analyse and improve health care processes and workflows?
With a background of health care processes and general business logistics, we use a system approach to
structure the analysis. Furthermore, we use lean management and workflow improvement theories to review
the processes in the PACU and to give suggestions. To make the processes visible to the team members of the
PACU after the ‘time ready to be transferred’, we give suggestions based on visual management system
theories. Chapter 2 explains the theories we use, these are: system theory, lean thinking, workflow
improvement, and visual management systems.
In the sections 3.1 to 3.3 we apply system theory. In the sections 3.3, 3.4 and 4.1 we apply lean thinking and
workflow improvement theories. Section 4.2 uses visual management theory and uses this to give suggestions
for improvement.
3. Where in the current workflow are opportunities for improvement?
After identifying the processes in the PACU and analysing the current workflow, we present where in the
current workflow are opportunities for improvement. With this question the causes of the disjointed
processes are described in section 3.3 using the analysis and taking the literature into account. Answering
this research question gives input for answering the fourth research question. The method to answer this
research question is value stream mapping; a form of reengineering. We use this method to create a current
state and a desired state of the processes. Also we use the methods of research question 1 which are
mentioned before.
4. What interventions can be suggested to improve the current workflow in the PACU of Mount
Sinai Hospital?
To improve the current state of the PACU, chapter 4 gives suggestions how the department can reduce the
time waiting to be transferred and how they can work more efficiently and effectively. Section 4.1 gives the
suggestions for improvement which are based on literature in chapter 2. At the end, this chapter produces a
future state map, an adaptation of the current state map, to show the optimal situation in the PACU. We show
how the interventions can change the current situation and (almost) become the optimal situation.
The methods we use are seven shadow days to value the interventions and their applicability to the PACU.
Second, we use interviews to estimate the improvement of the interventions and involve the staff with
deciding what information the visual management system should contain.
5. Which problems in the current situation of the PACU can be addressed by using a visual
management system and what elements would a visual management system have to contain?
Currently, it is not clear to staff from the PACU which steps they have to take after a patient is ready to go
resulting in a lot of problems. A visual management system is a possible solution to some problems at the
PACU. In section 4.2 we analyse what problems can be addressed by using a visual management system in the
PACU, and the impact on reducing the waiting time. Some essential elements which it should include are
discussed and a simplified version is given. Using shadow days and interviews, we decide what the visual
management system should contain and how it should work.

Process improvement at the PACU . Laura Hofman
13
1.6 Scope
The scope of this research is limited to the processes in the part of the workflow ‘time waiting to be
transferred’. In the analysis we identify the problems in the PACU from closing a patient to the bay is clean.
Chapter 4 gives suggestions for improvement based on the analysis, but only for the problems in the ‘time
waiting to be transferred’.
The PACU admits 3 types of patients: day surgeries, inpatients and same day admits, section 3.1.1 describes
these types in more detail. In this research the scope is limited to inpatients and same day admits because
inpatients and same day admits are admitted to the hospital after recovery. Improving their processes also
benefits the next departments and has effect on more than only the PACU department. Day surgeries go home
after recovering in the PACU and improvement of these processes has no impact on the next departments.
Also these surgeries are less complex and the experience of the PACU is that these patients do not cause the
main delays in their processes.

Process improvement at the PACU . Laura Hofman
14
2. Literature
The previous chapter introduced the problem statement and the initiative to improve effectiveness and
efficiency of processes within health care. According to TPG (2004) this can be achieved by introducing
business and logistic principles in health care. In this research we use concepts and ideas of operations
research which is started in the manufacturing and nowadays increasingly being used in health care.
Operations research is the application of analytical methods to develop and interpret information that assists
management with policy formulation, making better decisions, and solving problems (Agrawal, Subramanian,
& Kapoor, 2010). To analyse the current situation in the PACU, and to give recommendations for
improvement of the processes in the PACU, we apply the central tenets of widely-accepted theories. There is
not much literature concerning PACU process optimisation that is so we use hospital-wide theories and
evidence. With this chapter we answer the following research question:
2. Which theories can be applied to analyse and improve health care processes and workflows?
Section 2.1 generally describes the system theory that we apply in section 3.1 and 3.2 to analyse the current
inflow, outflow, and resources at the PACU. Section 2.2 gives a description of lean thinking which we use to
find the waste in the processes in section 3.3 and to give suggestions for improvement in section 4.1. Lean
thinking gives tools for improvement and one of the tools is visual management. Section 2.3 describes
theories of workflow improvement. Section 3.3 and 3.4 apply this theory to map the current processes and to
find quantified opportunities for improvement. To give suggestions for improvement using a visual
management system (section 4.2), the last section (2.4) describes visual management and the application in
health care.
2.1 System theory
A system by definition is composed by interrelated parts or elements. Every system has at least two elements
which are interconnected. The system approach sees an organisation as an open system that reacts and
intertwines with the environment. The first important set of elements of this system are the input and output.
Inputs are products, raw materials or patients that/who enter the system and output are those that leave the
system. Between the input and output there is a black box which transforms a certain input into an output.
The following important elements are the processes in the black box that can transform input into output. To
be able to transform this input into output, an organisation needs resources that support the processes in the
black box (Kimberley and Zajac, 2008).
To evaluate the current operational performance of processes, organisations utilize specific performance
measures, models and approaches. In health care this includes scheduling, hospital bed allocations, predicting
waiting times, and master scheduling (Testi, Tanfani, Torre, 2007). These tools represent stand-alone efforts
and lack the systemic approach. To improve an organisation, performance measurement must be viewed
from an organisation-wide perspective (Gomes, Yasin, Yasin, 2008).
In this research, we analyse the PACU using the system theory. The PACU also deals with a certain input and
output of patients and a certain level of throughput (we discuss throughput later). The time between the
patient enters (input) to the time the patient leaves (output) the PACU is the length of stay of patients in the
PACU. According to Brown, et al. (2008), Dexter, et al. (2005), and Waddle, et al. (1998) the average length of
stay of patients in the PACU of a general hospital with general anaesthetics is 105 minutes (1.77 hours). The

Process improvement at the PACU . Laura Hofman
15
average length of stay is based on the current situation in hospitals. The medical necessary length of stay
which is identified by Waddle, et al. (1998) is less and should be 71 minutes (1.18 hours).
2.2 Lean thinking
2.2.1 Concepts and ideas
Since the beginning of process thinking in manufacturing, lean thinking, total quality management, six sigma,
and business process reengineering have been introduced as universally applicable methods to improve the
performance of enterprises through continuous process improvement. Despite certain differences, these
methods complement each other with lean thinking as the central organizing framework (Bozdogan, 2010).
Womack and Jones (2003) introduced lean management in 1990 with experience from a manufacturing company in
the car-industry, Toyota Motor Corporation. The core idea of lean is to maximise value for customers while
using fewer resources and minimising waste (Simon & Canacari, 2012). In Taiichi Ohno’s words (the former
executive Vice President of Toyota) – “All we are doing is looking at the time line from the moment the
customer gives us an order to the point when we collect the cash. And we are reducing that time line by removing
the non-value-added wastes.” (Ohno, 1988). The philosophy proposes to use a step by step method of identifying
and eliminating waste to increase the value for the end customer. Finally lean management can create interventions
for improvement (Womack and Jones, 2003) by reducing this waste.
Womack and Jones described this type of thinking in their book Lean Thinking (2003) with a main focus on
waste in processes on operational level (Muda), this research also uses this focus. Figure 2 shows the eight
types of waste (Womack and Jones, 2003) translated into a service perspective (Bicheno and Holweg, 2009).
1. Transportation 2. Inventory 3. Motion 4. Waiting
Delay on the part of
customers waiting for
service, for delivery or
for response
Duplication: having to re-
enter data, repeat details
on forms, copy
information across
Unnecessary movement:
queuing several times,
poor ergonomics in the
service encounter
Unclear communication
and the wastes of
seeking clarification,
confusion over service
use
5. Overproduction 6. Over processing 7. Defects 8. Unused talent
Incorrect inventory: out-
of-stock, unable to get
exactly what was
required
Opportunity lost to retain
or win customers, failure
to establish rapport,
ignoring customers
Errors in the service
transaction, product
defects, lost or damaged
goods.
Failure to capitalise on
the creative thinking and
talent of staff
Figure 2: The eight types of waste (Womack and Jones, 2003).
Womack and Jones defined five lean principles to implement lean management in an organisation These
principles link the concepts that organisations have to increase the value-added activities, to reduce waste

Process improvement at the PACU . Laura Hofman
16
Figure 3: The four faces of health care (Glouberman & Mintzberg, 2001)
Control Managers
Insid
er coalitio
n St
atu
s co
alit
ion
Clinical coalition
Out In
Community
Trustees
Cure Doctors
Care
Nurses
Containment coalition
Up
Down
and to continuous improve their processes into an ever-repeating process (Robinson, Radnor, Burgess and
Worthington, 2012). The principles are (Womack and Jones, 2003):
1. Specify value – Value desired by the ultimate customer
2. Identify the value stream – All the actions needed to bring a product to the customer
3. Flow – Make the value-creating steps flow
4. Pull – Let the customer pull the product from you
5. Pursue perfection – There is no end to the process of reducing time, space, and cost
2.2.2 Application of lean in health care The lean principles are also applicable to improve operations in health care and in the PACU. In the article by
Jenkins (2007) the researchers use process mapping to identify where the workflow is inconsistent and to
determine who is accountable for every action. The process map breaks the activities into the three major
patient care steps: admission, recovery and discharge. Using this process map, they have identified delays in
the different stages of the care-giving process. The main delays are waiting for the bed assignment (45
minutes), lab results (45 minutes) and for call backs (30 minutes). Before applying lean principles and tools,
we shortly describe the main differences between the health care sector and the manufacturing industry.
First of all, in health care there is more variability, resulting from the differences in the health care required
by patients and the differences in the (production and) delivery of care by providers such that there is no ‘one
fits all’ solution. On the part of the patient, his/her particular circumstance will require a unique mix of
medical goods and services even as his/her condition entail the standard treatment. On the part of the
provider, the various types of hospital facilities (general, academic and specialised) imply that each will have
different approaches to care management. And in health care processes, the patient is a customer and a
‘product’ at the same time and cannot be refused (Carter, 2005).
Another remarkable issue is that health care deals mainly with services and the manufacturing industry
nearly entirely deals with products which have other characteristics. But the health care is also a business like
no other. In health care there are many stakeholders and multiple decision makers (patients, doctors and
managers) with conflicting goals and objectives. However, it is very hard to manage this sector effectively.
Glouberman and Mintzberg (2001) illustrate the
complexity of managing hospitals with their model the
four faces of health care (see Figure 3). The four
involved parties (nurses, doctors, managers, and
trustees) form coalitions with different objectives. The
doctors and nurses form the ‘clinical coalition’. They
manage down into the clinical operations and their
objective is to deliver good patient care. Managers and
the Board of Directors manage up towards the
institutions that fund the hospital and are concerned
with budgets; they form the ‘containment coalition’. On
the left side of the model, the Board of Directors and
the doctors form the ‘status coalition’ and manage out
of the hospital because they are, generally, technically
not employees of the hospital. The right side of the
model represents the ‘insider coalition’. Managers and

Process improvement at the PACU . Laura Hofman
17
nurses work for the hospital and are concerned with the day-to-day operations within the hospital. The
different objectives and different languages between these coalitions make it hard to improve efficiency in
hospitals and create value to all members of the hospital.
2.3 Workflow improvement
A workflow is a set of tasks, grouped chronologically into processes, and the set of people who are involved to
accomplish the goal (Cain & Haque, 2008). Improving the workflow is an effective way to reduce the waiting
time in processes. Patient waiting time in hospitals can take up to 70% of the total length of stay. Creating
flow in the system reduces the cycle times of the total process and is related to much more benefits (Leone,
2010). Removing, combining and overlaying some processes are effective tools to create flow in the process.
Harders and colleagues (in Cain & Haque, 2008) used parallel processing to improve the workflow in a
tertiary care centre. The application allowed for a reduction in non-operative time.
Before lining up a workflow, it is useful to first identify the value added and the non-value added activities
(Simon & Canacari, 2012). Value stream mapping (VSM) is used to investigate the value added and non-value
added processes and to identify opportunities to improve the workflow. Value-added activities are those
activities which create value to the customer (in terms of improving their satisfaction) and the customer
wants to pay for this activity. Non-value added activities do not contribute to the customers’ satisfaction, but
customers have to pay for these activities (Montgomery, 2011). Necessary non-value added activities are
those which have to be done to make the product or service, these activities are minimised and the
unnecessary non-value added activities are removed (Sandalini, 2009) The overall goal of VSM is to move
from batch and push to one-piece flow and pull through the entire value stream (Lovelle, 2011).
In VSM we follow a process from the start to the end and measure the processes between these two times. To
demonstrate the current situation, variable blocks present the measured variables of every process. Some
processes are hard or not to measure. And the old management adage of Deming says (in Reh, 2010): ‘If you
cannot measure it, you cannot improve it’. This adage is still accurate today, since you cannot establish if the
process is getting better or worse if you cannot measure. Useful variables to measure are throughput time,
the number of people required, cycle time and value-added time. The throughput time (TH) is the average
output per unit time (like patients/hour), where the average number of output is the same as work in
progress (WIP): the numbers of production between start and endpoint of a process. The cycle time (CT) is
the time that a product spends as WIP: the time between the start and endpoint of a process. Little’s Law
illustrates how we can calculate the throughput time using WIP and CT (Hopp & Spearmann, 2000):
Throughput (TH) = Work in progress (WIP) / Cycle time (CT)
After mapping the current value stream, the next step is to create a patient flow and a pull system. A ‘future
state map’ includes these improvements and presents the redesigned map (Sandalini, 2009). After creating
the future state map, standardisation of the best way to do the work is done.
According to Buffone, Moreau and Beck (2008), a focus on workflow improvement enables hospitals to better
coordinate the use of resources and allows hospitals to preserve quality and control costs. Jenkins (2007) also
emphasizes on the fact that value streaming not only identifies delays, but it also enables the team to identify
where the resources are needed the most and where resources could be shifted.

Process improvement at the PACU . Laura Hofman
18
2.4 Visual Management Systems
In the PACU it is not standardised to all team members which processes they have to undertake after a
patient is ready to go to the IP-unit. By adding visual tools, the PACU can introduce a pull system in the
workflow, since everybody knows their responsibilities and the tasks that have to be completed. Visual
management systems have been developed to report the current state of the production, service provision
and processes usually by displaying outputs of metrics (Parry and Turner, 2007). The information availability
is usually not the problem; it is the communication and timing of this information which most of the times
cause the problem (Bilalis, Scroubelos, Antonidadis, Emiris and Koulouritotis, 2002). A fast provision of
information and early decision making, provide an opportunity to reduce cycle time and reduce the
uncertainty about the further process (Coyle, et al., 2003). Visual tools are an important part of the
communication process of lean organisations. A key driver of good visual management systems (VMS) is that
every person involved must be able to see and fully understand the status of the process at any time and
place. Making this process transparent enables to provide feedback on the current situation and indicates
where adjustments are required to enable customer pull (Womack and Jones 2003). Parry and Turner (2007)
have identified some success factors of VMS’s. The first success factor is a colourful physical visual control
system. The second factor is that a VMS has to look organised and simple that it also can be converted into an
electronic version. On the board, processes are presented clearly and metrics are secondary. The third factor
is that senior management fully has to support the use of a VMS and they have to ensure that team members
have full input and control over their own board (Parry and Turner).
A typical problem which can be improved by a VMS is bed availability. A typical patient placement requires
five calls and a dedicated staff member who continuously walks through the halls to search empty beds. The
Medical Center in Dearborn also had these problems and introduced electronic whiteboards with colour-
coded icons to present bed locations and the bed status. Within three months of automating patient
placement, they improved the bed assignment process with 33% which helped to reduce the excessive ED
wait times by 25%. Another example is an OR in a Southeast Academic Centre which made 32 phone calls on
average for every patient. With real-time access, the OR has reduced 75% of the phone calls (Mahaffey, 2004).
2.5 Conclusion
This chapter explains the literature to use when analysing (chapter 3) and suggesting interventions (chapter
4) for the PACU. Chapter 2 answers the following research question:
2. Which theories can be applied to analyse and improve health care processes and workflows?
In this research we review the current processes and give suggestions. To get familiar with the processes we
first analyse the environment of these processes with system theory. According to system theory, an
organisation is an open system that contains the following elements: input, output, processes (movement)
and resources that are interrelated. Lean thinking is a tool to identify waste in the processes and describes to
increase the value added processes and reduce the non-value added processes. Theories about workflow
improvement help to review the current situation and gives ideas to improve this situation. A useful tool to
improve the workflow is value stream mapping. The last theory gives insight in the use of visual management
systems in organisations to introduce more pull in a system. The visual management theory gives success
factors which the effectiveness of a visual management system determines.

Process improvement at the PACU . Laura Hofman
19
We agree with the statement of Gomes, Yasin and Yasin (2008) that it is important for an organisation to not
heavily focus on one department but rather have an organisation-wide view. This does not automatically
mean that tools like master scheduling and hospital bed allocation represent a stand-alone effect. In this
research we have to take into account that these tools can also influence more departments and can have an
organisation-wide influence. The eight types of waste (Womack and Jones, 2003) are useful, besides there
practical use to identify waste in processes, to make staff aware of the possible wastes in their department. By
making them aware, they rather avoid these types of waste. The visual management theory has some
statements coming from some old studies. We still use these studies, since nowadays they are still useful. This
theoretical framework does not describe many studies which are based on PACU cases which it hard to assess
the current position of the PACU of Mount Sinai Hospital and to suggest PACU specific interventions.

Process improvement at the PACU . Laura Hofman
20
3. Analysis of the PACU
This chapter maps and analyses the current situation of the PACU in Mount Sinai Hospital and identifies the
opportunities to improve the current workflow. This chapter answers the following two research questions:
1. What are the current processes and supporting resources in the PACU and how can these processes be
organised in a workflow?
3. Where in the current workflow are opportunities for improvement?
The first section is based on the system theory which was discussed in chapter 2. This theory is based on the
thought that a process is a black box. This process converts a certain input into a certain output. To get
acquaintance about the input and output of the black box, the first section (3.1) analyses the numbers of
patients who have visited the PACU in the year ending in March 2012. These numbers are based on the input
of the operating room which are out of control of the PACU. After the description of the patient flow, the
second section (3.2) describes and analyses the current resources. A description of the resources is necessary
to understand the processes of the PACU and their dynamics. Also we use this information to analyse if the
current state is appropriate to the current patient flow. Section 3.3 gives an analysis of the processes. In this
part, we map, describe, time and analyse the processes and identify where in the process are opportunities
for improvement. The last section 3.4 analyses four scenarios and their impact on the length of stay and
number of resources. Section 3.5 gives a conclusion of this chapter. To make a valid analysis of the available
data, we first have checked the data on outliers with a scatter plot. One outlier, a LOS of -3671 days, is
identified and omitted.
3.1 Patient flow in the PACU
Approaching the PACU with system theory, the PACU has an input and an output. Figure 4 gives an overview
between which departments the PACU operates (input and output) from a system approach.
Figure 4: Overview of the PACU in Mount Sinai Hospital (data set PACU, 2011)
Different types of patient enter and leave the PACU. Section 3.1.1 makes a distinction in the different patient
types based on admission. Section 3.1.2 makes a distinction based on the type of surgery. Looking at total and
numbers and average numbers per day, the inflow and outflow numbers do not differ much. Also, the patient
type does not change in the PACU, and the type of surgery does not change in the PACU. For this research we
also use patient flow to describe both the patient inflow and the patient outflow.
PACU Operating Rooms
Inpatient units
Input Output Elective patients
82%
Emergency patients
18%
Admission
70%
Discharge
30%
Hospital

Process improvement at the PACU . Laura Hofman
21
3.1.1 Numbers of patients based on admission The terms inpatient and outpatient are often used terms in Mount Sinai Hospital to distinguish different
patient types. From an organisation-wide perspective an inpatient refers to a patient who is admitted at the
hospital before or after treatment and an outpatient is a patient who is not admitted to the hospital before or
after treatment (Imaginis, 2008). These terms are used different when we look at the level of different
departments. The PACU uses three patient types based on the way of inflow in the OR and outflow at the
PACU. Based on these characteristics, we can identify 4 possible patient types in the PACU (see Figure 5).
OUTFLOW
Outpatient Inpatient
INF
LO
W
Ou
tpa
tie
nt
I
np
ati
en
t
X 2. Inpatient
(IP)
1. Day Surgery
(DS)
3. Same Day Admit
(SDA)
Figure 5: Patient types based on PACU inflow and outflow
According to the observations of the ward clerk at the PACU and the senior manager of OQPM, the amount of
patients that enter the PACU as an inpatient and leave the PACU as an outpatient, is negligible. Some hospitals
do have a little amount of this patient type. These hospitals admit the first case of a day (around 8:00 AM)
before the day of surgery to become stable or to administer medication. Based on interviews with PACU
nurses and the PACU manager, we assume that it is not possible that a patient is an inpatient as inflow and
outpatient as outflow. This results in three patient types which are used by the PACU:
1. Day Surgery (DS)
A DS is not admitted to the hospital before the day of surgery, but comes to the hospital on the day of
surgery. After surgery and recovery, the patient goes home without admission to a nursing unit.
2. Inpatient (IP)
An IP is already admitted to a nursing unit before the day of surgery. After recovery, the PACU
transfers the patient to a nursing unit and admission to this nursing unit follows (most of the times
the same unit as before surgery). Reasons for admitting a patient before surgery are giving
medications hours before surgery, making patients stable before surgery (most of the times the first
cases), and side or adverse events after (prior) surgery. Patients with side or adverse events after
prior surgery are emergency patients and count for 75% of the inpatients (data PACU, 2012).
3. Same Day Admit (SDA)
A SDA is not admitted to the hospital before the day of surgery. After recovery, the PACU transfers
the patient to an Inpatient Unit and admission to this unit follows.
Table 2 shows the total numbers of patient arrivals in the PACU and the total numbers on every day of the
week diverted into the three patient types. Focussing on daily arrivals, Table 2 shows a substantial difference
between arrivals on weekdays and arrivals on weekends. The reason is that the OR performs no DSs in the
weekends and most of the cases are emergency cases.

Process improvement at the PACU . Laura Hofman
22
Patient type DS IP SDA IP + SDA Grand Total
Sunday 0 141 1 142 142
Monday 403 315 637 952 1355
Tuesday 407 230 716 946 1353
Wednesday 346 285 835 1120 1466
Thursday 317 355 749 1104 1421
Friday 719 234 527 761 1480
Saturday 0 175 6 181 181
Maximum 719 355 835 1120 1480
Difference max-min
during weekdays 402 125 308 359 113
Grand Total 2192 1735 3471 5206 7398
Table 2: Numbers of patient arrivals based on patient type (data set PACU, 2011)
Figure 6 shows the daily arrivals. The column and graph ‘IP+SDA’ shows the numbers of arrivals from the IPs
and SDAs together because this research’ main focus is on these patients. The maximum average number of
arrivals is on Wednesday (21.5 patients) for SDAs and IPs. The high average number of DS arrivals on Friday
(14.7 patients) level the low numbers of SDA and IP cases. Nevertheless, DSs need less care than IPs and SDAs
which changes the necessary number of staff on every day of the week (also see section 3.4).
Figure 6: Average patient arrivals per day of the week (data set PACU, 2011)
After analysing the average numbers of arrivals a day, the figures in Appendix C show the hourly inflow and
outflow of every day of the week for DSs, and IPs and SDAs together. The figures show a really stable pattern
of the IPs and SDAs which is roughly the same on every day of the week. Figure 7 and 8 present these patterns
for weekdays on an hourly base.
Figure 7 shows that the inflow rate of the IPs and SDAs (the increase of the number of arrivals) is very high
between 8:00 AM and 11:00 AM (peak of 2.25 arrivals at 11:00 AM) and between 1:00 PM and 3:00 PM (peak
of 2.7 arrivals at 3:00 PM). It is plausible that the start of the ORs in the morning causes the first high inflow
rate and that the start of the ORs after lunchtime causes the second high inflow rate. The maximum number of
inflow for DSs is also at 3:00 PM with 1.3 arrivals. Both of the peaks at 3:00 PM cause a high demand of PACU
staff at 3:00 PM which gives input to adapt the staffing schedule per hour of the day.
6,8
16,7
21,5
14,7
0
5
10
15
20
25
Av
era
ge
nu
mb
er
of
arr
iva
ls
DS
IP
SDA
IP + SDA

Process improvement at the PACU . Laura Hofman
23
Figure 7: Patient inflow per hour of the day in the PACU (data set PACU, 2011)
Figure 8 presents the pattern of the outflow per hour and shows that most of the patients are discharged
between 12:00 PM and 6:00 PM (peak of 2.6 departures at 5:00 PM). After 6:00 PM the number of departures
extremely decreases. Most of shift changes in the PACU take place between 5:00 PM and 7:00 PM (see Figure
14) which are a plausible cause of the drop down. Also most of the shifts in the IP-unit change between 7:00
AM and 8:00 AM. In this time interval, the PACU is not allowed by the IP-unit to enter patients.
Figure 8: Patient outflow per hour of the day in the PACU (data set PACU, 2011)
3.1.2 Numbers of patients based on surgery
MSH is a hospital which main focus is on mother and child care with their affiliated surgery gynaecology.
Besides gynaecology, also orthopaedics and general surgery are surgical types which MSH often performs.
Based on the data set of the fiscal year 2011, the 10 specialties which are performed in MSH are: gynaecology,
obstetrics, ophthalmology, oral surgery, orthopaedics, otolaryngology, plastic surgery, general surgery,
urogynaecology and urology (data sheet PACU, 2011). Appendix C shows the total numbers of every type of
surgery that yearly take place in MSH and the hourly inflow and outflow. With 1789 surgeries (24%) a year,
orthopaedics performs most of the surgeries in a year. Urogynaecology performs with 219 surgeries (3%) a
year the least amount of surgeries.
Figure 9 presents the total numbers of patient arrivals on each weekday. The figure shows many fluctuations
per surgery per day. To see if the fluctuations of the different specialties level each other, Figure 9 shows the
total arrivals on a day (Grand Total). Looking at the Grand Total line, the figure shows a stable pattern. This
means that the jointly scheduling of the departments levels the variability in number of arrivals of the
different specialties. It does not mean that this also levels the occupation and the LOS in the PACU.
1.3
2.7
0
0,5
1
1,5
2
2,5
3
1 2 3 4 5 6 7 8 9 10 11 12 13 14 15 16 17 18 19 20 21 22 23 24
Av
era
ge
nu
mb
er
of
arr
iva
ls
Hour of the day
DS
IP + SDA
1.1
2.6
0
0,5
1
1,5
2
2,5
3
1 2 3 4 5 6 7 8 9 10 11 12 13 14 15 16 17 18 19 20 21 22 23 24
Av
era
ge
nu
mb
er
of
de
pa
rtu
res
Hour of the day
DS
IP + SDA

Process improvement at the PACU . Laura Hofman
24
Figure 9: Total patient arrivals per day of the week in the fiscal year 2011-2012 (data set PACU, 2011)
3.2 Resources
The previous section describes the PACU as a system with an input and output. As a second component of the
system, this section presents the supporting resources of the PACU. Section 3.2.1 presents the layout of the
PACU and section 3.2.2 describes and analyses the involved human resources.
3.2.1 Resources: Room
The PACU in MSH is an 18-bay recovery centre on the 5th floor of the hospital. A bay is a space where staff
from the OR places the patient after surgery. Figure 10 presents a lay-out from the PACU and the dedication of
the space. The 12 ORs, which produce the input for the PACU, are next to the PACU.
1355 1353 1466
1421 1480
0
200
400
600
800
1000
1200
1400
1600
Monday Tuesday Wednesday Thursday Friday
To
tal
nu
mb
er
of
arr
iva
ls
GYNE + OBST
OPHT
ORAL
ORTH
OTOL
PLAS
SURG
UROG
UROL
Grand Total
Figure 10: Lay-out of the PACU

Process improvement at the PACU . Laura Hofman
25
Entering IPs and SDAs from an OR to the PACU takes place through the
swing doors between the storage (S) and the washroom. DSs come into
the PACU through the sliding door next to bay 18. The different patient
types enter the PACU from another side because in the PACU the
assignment of the space is based on patient type. There is a dedicated
space for IPs and SDAs (the inpatient area) and a dedicated space for DSs
(the outpatient area). Every bay has equipment at the wall of the bay to
monitor the vitals of the patient (see Figure 11). Between the bays in the
inpatient area are 4 computers which nurses use to check patient orders
from the OR and to add patient orders. The bays 3 and 4 have the same
equipment as the other bays in the inpatient area, but are often used as
isolation bays for patients with infectious diseases. The outpatient area is
a DS-dedicated area. This area exists of 13 chairs and bays 1, 2, 17, and
18 to recover and take care of the DSs. One curtain (the dotted line in
Figure 10) separates the two areas in the PACU. Figure 11: Bay in the PACU
The main desk of the PACU is in the middle of the inpatient area. The ward clerk works at this desk and has a
good overview of the inpatient area to record the time in and time out of every IP and SDA in the inpatient
area. From this desk, there is no overview of the outpatient area what makes an accurate registration of the
DSs difficult. In addition to the ward clerk, sometimes volunteers accompany the ward clerk to do the
registration. Also nurses walk around the desk to catch sheets and to stamp these sheets. This leads to much
stuff at the desk from everybody and a lost of overview of al the incoming and outgoing patients. The nursing
station and the desk of the coordinator
are next to the main desk. The surgical
waiting room is outside the locked
doors from the PACU. Staff from the
PACU sits at the desk in the surgical
waiting room to assure that no patients
or family members enter the PACU
through the surgical waiting room. In
the PACU there are a couple of places
to store the stock. The storage (S)
between bay 4 and 5 contain most of
the disposables (see Figure 12) and the
rooms between bay 10 and 11 contain
the monitors and the housekeeping
equipment. Figure 12: Storage between bays 4 and 5
In section 3.1 we described that it is necessary to adapt the number of resources to the demand. Section 3.4
analyses the number of patients in the PACU on different times and days and the necessary numbers of bays
for SDA and IP cases in the current state. The analysis is not to give input for a reduction of bays but gives
input for the reduction of the times that the OR cannot enter patients (code R) because of a shortage of bays.
3.2.2 Resources: Staff
In the PACU the staff consists of registered nurses (RN), residents who work under supervision of a RN, a
ward clerk, housekeepers, porters and a manager. Staff who also support the care giving process in the PACU
are a pain service assistant and X-ray technicians. RN’s (often senior nurses) sometimes have besides their

Process improvement at the PACU . Laura Hofman
26
medical job also a coordinating function. In the PACU, every day there is one charge nurse, who coordinates
the daily tasks (like sending nurses on break and giving bay assignment to OR). There is also a resource nurse
who, usually, works the 9:00 AM to 5:00 PM shift and makes the scheduling of every day and does the payroll.
Sometimes there is a float nurse who covers more bays and supervises the residents in those bays. The total
numbers of nurses at the PACU is 17.7 FTE of which 11 FTE full timers and the other FTE for part timers and
over hours. The minimum costs of a nurse are 85.000 Canadian dollar (CAD) a year and the maximum costs
are 110.000 CAD a year. The average costs of a nurse are 102.000 CAD which we use in this research. Staffing
costs are 1.4 million CAD (66%), a huge amount of the total budget (2.1 million) (see Appendix D: Interview
PACU manager, 2012). Now we analyse the scheduling of the nurses, porters and housekeepers in the PACU.
Scheduling nurses
The resource nurse prepares the weekly schedules of
the nurses for 4 weeks in front. The scheduling from
weekends differs from weekdays. If it is possible, taking
into account sick nurses and holidays, the PACU
schedules every day of the workweek 10 nurses from
6:00 AM to 9:00 PM and 3 nurses from 3:00 PM to 11:00
PM during weekdays. In the weekends this differs, since
there are no elective patients. The nurses are assigned
to respectively the inpatient or outpatient area. The
nurse to patient ratio for outpatients is 1:5 and for
inpatients is 1:2 resulting in more scheduled nurses at
the inpatient area. Figure 13 shows the schedules with
the different shifts of the nurses.
According to the Collective Bargaining Agreement negotiated with the Ontario Nurses’ Association (2012),
the PACU has to fill most of the hours with full timers. Part timers fill the gaps in the schedules and work
when full timers are on holiday or are sick. Figure 14 shows the shifts and breaks (yellow) of full timers
during weekdays, and presents how many nurses work on every hour of the day.
6:00 AM
7:00 AM
8:00 AM
9:00 AM
10:00 AM
11:00 AM
12:00 PM
1:00 PM
2:00 PM
3:00 PM
4:00 PM
5:00 PM
6:00 PM
7:00 PM
8:00 PM
9:00 PM
10:00 PM
11:00 PM
1
2
3
4
5
6
7
8
9
10
11
12
13
Figure 14: Hourly nurse occupation during weekdays
Shifts Weekdays
(Mon-Fri)
Weekends
(Sat-Sun)
6:00-14:00 1 0
7:00-15:00 2 0
9:00-17:00 1 0
9:00-21:00 0 1
10:00-18:00 2 0
11:00-19:00 3 0
13:00-21:00 1 0
15:00-23:00 3 0
On call during nights 2 2
Figure 13: Shifts for PACU nurses

Process improvement at the PACU . Laura Hofman
27
Housekeepers and porters
In the PACU housekeepers and porters support the processes in the PACU. Housekeepers clean the bay after a
patient leaves the bay and sometimes clean other things in the PACU. The task of porters is to transfer
patients up to the floor with the PACU nurse. Ordinarily, the housekeepers do not porter patients and porters
do not clean the PACU. According to the agreement with the housekeepers and porters, the PACU is allowed
to let the housekeepers do 10% of their time transfer patients and let the porters do 10% of their hours clean.
Every day there are two dedicated housekeepers for the PACU. One housekeeper works from 6:00 AM to 2:00
PM and the second works from 2:00 PM to 10:00 PM. Also the PACU has two dedicated porters in the PACU.
The first porter works from 10:00 AM to 6:00 PM and the second works from 12:00 PM to 8:00 PM. When
housekeepers are not available (on break or before 6:00 AM and after 10:00 PM), the nurse who is assigned
to the bay also cleans the bay after a patient leaves. When PACU porters are not available (on break or before
10:00 AM and after 6:00 PM), the ward clerk books a porter from the hospital with the booking system.
Currently, it is a problem to let housekeepers and porters do work which they are, primarily, not assigned to.
The cause of this problem is that it is not clear what 10% of the time means and some housekeepers do not
want to porter. Another suboptimal issue is that the first housekeeper starts very early and leaves very early
which does not fit to the current situation of the outflow. During the observations it is noticed that the ward
clerk, most of the times, does not know where the dedicated housekeepers and porters are. Most of the times
they are walking through the hospital and the ward clerk has to page them if the PACU needs them. This
causes one of the waiting times which we discuss in the next section.
3.3 Processes and activities
In the previous sections, the input and output of the system and their supporting resources are described.
Since there only is a basic overview of the input and output, first, subsection 3.3.1 explores the patient LOS
and uses the system theory. The second subsection 3.3.2 shows the total workflow and describes the various
steps in this black box which change a patient from input (‘unrecovered’) to output (‘recovered’) (see Figure
4). Then subsection 3.3.3 is a more quantitative section which presents the durations of the steps, the waste
in the process, and analyses the current situation using a value stream map. The value stream map presents
the variables which are suggested by Hopp and Spearman (2000) and realises the second lean principle;
identifying the value stream (Womack & James, 2003). Since the process times were not available, after the
four shadow days to get an impression of the workflow, we measured the durations of the processes with
another seven shadow days in May 2012. The analysis in section 3.1 shows that most of the arrivals are on
Wednesday and Thursday. To measure every day and see the problems on the busiest days, the observations
took place on Monday to Friday and an additional Wednesday and Thursday. The last subsection (3.3.5)
analyses different scenario’s to assess the impact of improving the scheduling and processes at the PACU.
3.3.1 Length of stay
The patient flow through the PACU are analysed in the previous sections. Without looking at the black box
between the input and output of the system, it is possible to look what factors influence the LOS of the
different patients. This section analyses the LOS of patients in the PACU and distinguishes different times
(hours of the day and days of the week) and different types of patients (based on type of surgery) to research
if the LOS is subjected to these variables. We can only use these variables, since only these variables (besides
the patients’ age, number etc.) are available in the data sets. Also the time ready is not recorded in the data
set. Using data of the fiscal year 2011-2012 (n=7398), we calculated LOS as such:

Process improvement at the PACU . Laura Hofman
28
LOS (hours) = Admission to PACU time – Departure from PACU time
Table 3 presents the volume and LOS for DSs, IPs and SDAs. After this, the analysis focuses only on IPs and
SDAs. The maximum average LOS per patient is for SDAs (2.99 hours) and the minimum average LOS per
patient is for IPs (2.27 hours). According to interviews with the ward clerk and nurses and by observing the
patients during the shadow days, we assume that the difference in LOS is mainly based on the bed
assignment. The room in the IP-unit is known for the IPs, since these patients, most of the time, go back to the
same room after surgery as before surgery. The PACU does not know the room in the IP-unit for SDAs until
the PACU receives the bed assignment list. This results in a higher LOS for SDAs because the PACU, in most of
the cases, waits with transferring the SDAs until they receive the list. Sometimes they call the IP-unit, but this
is not usual. The maximum LOS in the fiscal year 2011 was 25.23 hours for a SDA and the minimum recorded
LOS for every patient type was 0 hours.
Patient flow
(number of patients) DS IP SDA Total
N= 2192 1735 3471 7398
Average arrivals a day 9.06 4.81 14.11 20.38
SD 5.22 2.40 4.31 13.03
LOS (hours)
Total LOS 5080.80 3938.94 10372.69 19392.43
Average LOS a patient 2.32 2.27 2.99 2.62
St. dev. 1.48 1.70 1.66 1.65
Maximum LOS 19.17 24.75 25.23 25.23
Table 3: Total and average length of stay per patient type (data set PACU, 2011)
Different types of surgeries
Figure 15 shows the LOS for IPs and SDAs in the PACU based on the type of surgery. Gynaecology and
obstetrics are, just like in Figure 9, added to each other. Most of the surgeries have a LOS of more than 2,5
hours. Only plastic surgery and ophthalmology have a LOS of approximately 1.75 hours. It is hard to analyse if
the recovery period or the non-medical processes before and after the recovery have the highest influence on
the LOS of the different types of surgery, since there are not enough specific data available of the medical
processes and non-medical processes for different types of surgery.
Figure 15: Length of stay for the different types of surgeries (data set PACU, 2011)
0,0
0,5
1,0
1,5
2,0
2,5
3,0
3,5
PLAS OPHT ORAL UROG G&O OTOL ORTH SURG UROL
LO
S i
n P
AC
U (
ho
urs
)
Average LOSin PACU

Process improvement at the PACU . Laura Hofman
29
Different days of the week
Analysing the LOS and the number of arrivals on each day is useful to discover relationships between these
variables. Figure 16 presents these variables for IPs and SDAs and shows that the trend line in the average
LOS of the IPs and SDAs has, approximately, the same trend line as the number of arrivals on each day. Also
the LOS of SDAs during weekdays is higher than the LOS of IPs and the LOS of IPs on Tuesday is
substantially higher than the Monday and Wednesday in comparison to the IP arrivals on Tuesday.
The same trend line between the numbers of arrivals and the LOS shows that there is a relationship
between these variables. A plausible cause of this relationship is that nurses spend a lot of time with the
hand-off of patients to the IP-unit. When it is busy at the PACU and the nurse is up to the IP-unit, this time has
a higher impact. That is because the nurse to patient ratio is lower during busy days (same schedule, higher
occupation), which affects more patients when a nurse is left. Conducted from interviews, nurses from the
PACU estimate that the average time of transferring a patient is 20 minutes. The time is higher when the
elevators are busy which are used for patient transfers, when the nurse of the IP-unit is not ready or when
patients (≈70% of the cases) have to be transferred from a stretcher to a bed. Using the general knowledge of
hospitals that most of the patients get discharge at the end of the week, we assume that this results in a longer
LOS at the end of the week. On Monday most of the rooms are free, since many hospitals discharge patients in
the weekends. After the weekend the rooms are getting more and more occupied resulting in a high number
of patients at the end of the week (from Thursday) in the IP-units. We cannot validate if this is the main cause
of the longer LOS at the end of the week, since we have no occupation data of the IP-units.
Based on the four shadow days and interviews, we noticed that receiving the bed assignment too late in the
PACU is a big problem. This results in a higher LOS for SDAs than IPs, since the PACU already knows the
room for IPs when they arrive in the PACU and do not know the room for SDAs before receiving the list.
The relatively high LOS on Tuesday cannot be attributed to the types of surgery on Tuesday. The surgeries
Urology and Surgery with the longest LOS show minimums on Tuesday and the numbers of surgeries with a
low LOS have maximum numbers on Tuesday (like Ophthalmology).
Figure 16: Length of stay on different days of the week (data set PACU, 2011)
1,6
2,2
2,5 2,4 2,5
2,2
1,9
1,4
2,7
3,0 3,2 3,2
2,8
1,6
0,0
0,5
1,0
1,5
2,0
2,5
3,0
3,5
0
2
4
6
8
10
12
14
16
18
Av
era
ge
LO
S (
ho
urs
)
Av
era
ge
pa
tie
nt
arr
iva
ls
Average IP arrivals
Average SDA arrivals
Average LOS IP
Average LOS SDA

Process improvement at the PACU . Laura Hofman
30
Different hours of a day
Figure 17 presents the LOS for SDAs and IPs together. The maximum LOS at 3:00 AM is very peculiar. By
eliminating the two outliers (10 hours and 20 hours) of the 23 recorded LOSs at 3:00 AM, we still have a LOS
of 4.33 hours. Using the methods of this research, we are not able to present the cause of this high LOS.
Another remarkable issue is that the LOS between 6:00 AM and 6:00 PM is relatively high in comparison to
the other hours of the day. The differences in these time periods are that between 6:00 AM and 6:00 PM most
of the cases are elective cases and before and after this time are almost all emergency cases. Other differences
are the number of staff and the number of arrivals.
Using the observations, we determine whether these times differ because of the longer ‘recovery’ period or
the longer ‘waiting to be transferred time’. Then we can determine the cause for this remarkable increase in
LOS during day hours.
Figure 17: Length of stay on different hours of the day (data set PACU, 2011)
By analysing the different steps in the in the whole process from entering the patient into the PACU to
transferring the patient to the IP-unit, we can identify the delays and see what processes cause the variations
in the LOS. By reducing these variations, the LOS of patients in the PACU can improve. The next section
describes the different steps and analyses the times of every process and their delays.
3.3.2 Current workflow in the PACU
Between the input and the output of the PACU, a whole process moves the patient from the start to the end of
the system. Using Visio 2010 we created the workflow with Business Process Modelling (BPM) shapes. The
workflow starts when the surgeon closes the patient and ends at the moment the housekeeper has cleaned
the bay. Appendix E present the different activities organised in a workflow. The processes in the PACU to
invert inflow into outflow are not always the same. The process map shows different options of the steps
usually being taken at the PACU.
Based on the total workflow by Jenkins (2007) we describe and analyse the workflow of the PACU in section
3.3.3 using three major care giving steps: admission, recovery and discharge. Using a qualitative
description and a quantitative analysis, section 3.3.3 analyses the value added and non-value added parts in
the process.
0,0
0,5
1,0
1,5
2,0
2,5
3,0
3,5
1 2 3 4 5 6 7 8 9 10 11 12 13 14 15 16 17 18 19 20 21 22 23 24
Av
era
ge
LO
S i
n P
AC
U (
ho
urs
)
Hours of the day
Average LOS

Process improvement at the PACU . Laura Hofman
31
(6) 9.5
(5) 2.1
3.3.3 Time registrations of processes
We now present the durations of the processes and indicate the value added and non-value added activities.
According Montgomery (2011) the value adding activities are those which add value to the customer’s
satisfaction and where a patient wants to pay for. Also we identify the causes of the delays in the four shadow
days. If there is a delay, we only record the delay with the maximum duration. In the consecutive seven
shadow days we measure the durations of the processes and delays. We only measure the processes and
delays that are measurable with emphasise on the discharge processes. With measurable we mean an average
duration of more than 10 seconds and a process which is good to recognise using a background in health care
management. First we present the value stream map with the value added time, non-value added time, cycle
time, throughput time and the number of people required. The first part shortly describes and analyses the
admission process, the second part describes and analyses the recovery process and the last part describes
and analyses the discharge process. The main focus of this research is on the discharge process what results
in a more comprehensive analysis of this part of the total process.
Value stream map current state
Figure 18: Value stream map of the current situation (Shadow days in the PACU, 2012)
The value stream map (VSM) in Figure 18 organises the standard processes in the PACU which occur in the
PACU for every patient from entering a patient to cleaning the bay. The map is based on 62 observations with
an average cycle time of 231.6 minutes (LOS of 190.4 minutes/3.2 hours). The VSM also shows the measured
cycle times of the processes ((min.) - average - (max.)), involved staff, waiting time (number and average
Enter patient into bay
Porter arrives at bay
CT = 0 - 0.5 – 2.0
3 people
CT = 0 – 0.2 - 1.5
1 person
Hook patient up to monitoring equipment
CT = 2.0 - 4.0 – 10.0
2 people
Recover patient (medical processes)
CT = 45.0 - 135.5 - 442.5
1 person
Transfer patient to IP-unit
CT = 11.0 - 24.0 - 2.0
2 people
Call housekeeper to clean bay
CT = 0 - 1.5 - 4.0
1 person
(2) 40.5
(3) 4.7
Clean bay
CT = 1.0 - 3.2 - 8.0
(42.0) 1 person
(4) 2.8
(1) 14.0
Call or book porter
CT = 0 - 2.2 - 16.0
1 person
VA = 142.7
NVA = 88.9
139.5 minutes
14.5 minutes
N = 62 patients
Arrivals a day =
14.3 patients
Total CT =
231.6 minutes
Throughput = 3.2 patients per hour
Current VA ratio = 61.6%
3.2 minutes
74.4 minutes

Process improvement at the PACU . Laura Hofman
32
time), value added time and non-value added time. The inventory is not added between the different
processes in the VSM, since the workflow is based on the processes for one patient at a time. The blue squares
show the processes and the red triangles show the waiting time of or between processes. The value added
(VA) ratio is (142.7/231.6=) 61.6%. This means that, approximately, 60% of the time of the process is value
added time. According to Robinson, Radnor, Burgess and Worthington (2012), we also identify opportunities
for improvement to reduce/eliminate the waste and non-value added processes to increase the value added
ratio. The following processes and waiting times are identified during the observations and are analysed
using the three main steps by Jenkins (2007):
Processes: Waiting times:
1. Enter patient into the bay 1. Before enter a patient into the bay
2. Hook patient up to monitoring equipment 2. Between recover a patient and call or book a porter
3. Recover patient 3. Between call or book a porter and porter arrives at PACU
4. Call or book porter 4. Between porter arrives and transfer patient
5. Porter arrives at bay 5. Between porter arrives at PACU and call housekeeper
6. Transfer patient to IP-unit 6. Between call housekeeper and clean bay
7. Call housekeeper to clean bay
8. Clean bay
Admission
Figure 19: Admission process (n=62, Shadow days in the PACU, 2012)
The admission of a patients starts when the surgeon has closed the patient. Sometimes the OR cannot directly
transfer the patient to the PACU because there are no bays available and/or the PACU nurse is not ready to
receive the patient (the ‘code R’). A quantitative description of the code R follows in section 3.3.3. When the
PACU is in a code R, the ward clerk calls the OR desk to not enter more patients into the PACU and the
patients have to stay in the OR for an unknown time. Accordingly, the OR desk calls every OR. Every OR which
have a patient who is ready to go to the PACU has to call the PACU. The ward clerk records the ORs which are
waiting and the time of the calls on the waiting list. When the PACU is not in a code R anymore, the ward clerk
stops the code R by calling the OR desk again and the first OR on the waiting list can enter the PACU. If there is
no code R, sometimes the OR calls before entering a patient and the PACU gives the bay assignment for the
patient. Most of the times, the OR enter the patient without calling and when the OR enter the patient, the
charge nurse gives the bay assignment. After entering, the ward clerk records the time-in and provides
blankets. The nurses (OR or PACU) hook the patient up to the monitoring equipment and the medical
information hand-off between OR nurse and PACU nurse, surgeon and PACU nurse, and anaesthetist and
PACU nurse occur. The PACU nurse records this information on the patient chart and the recovery process
starts.
Enter patient into bay
CT = 0 - 0.5 – 2.0
3 people
Hook patient up to monitoring equipment
CT = 2.0 - 4.0 – 10.0
2 people (1)
14.0
4.0 minutes
14.5 minutes
VA
NVA

Process improvement at the PACU . Laura Hofman
33
In the admission process, the ward clerk is responsible for the communication of the ‘code R’ with the OR
desk and for a reliable registration of the time in. The charge nurse is responsible for the bed assignment
when the OR enters the patient into the PACU.
Waiting time 1 : Before enter a patient into the bay Before the OR enters the patient into the PACU, we see a large waiting time from closing a patient to entering
the PACU through the swinging doors (see Figure 10). One of the reasons is that the OR takes a long time to
transfer the patient and the other reason is that there are no bays available in the PACU (code R). The code R
can influence more ORs at the same time which results in high waiting times for the OR. Significant data are
not available from the numbers and length of a code R.
To give an impression of the numbers of a code R, Figure 20 shows the numbers of arrivals where the time
from closure after surgery to arriving at the PACU are less than 30 minutes and greater or equal to 30
minutes (data sheet OR, 2011). The average time between closure and arriving at the PACU is 14 minutes
(SD = 3.7 minutes). On Thursdays the figure shows the largest time between closure and arrival at the PACU.
By interpreting a time equal to or more than 30 minutes as a code R (no bays or nurse available in the PACU),
52% of the waiting time 1 is due to a code R. There are no data from the code R which can show how many
ORs are influenced on average by a code R.
Figure 20 shows that most of the code R’s are on Thursday (102 of the 1421 arrivals) and the least code R’s
on Friday (42 of the 1480 arrivals). Just like the LOS, also the number of Code R’s is very high on Wednesday
and Thursday and the number of code R’s on a day seems to be strongly related to the numbers of patient
arrivals on a day.
Figure 20: Time between closure of a patient until arriving at the PACU (n=7398, Data set PACU, 2011)
Opportunities for improvement
The high number of code R’s on Wednesday and Thursday is, partly, due to the high occupation of beds at the
end of the week which is also discussed in section 3.1.1. Another reason for the high number of code R’s is
that the time to transfer the patient has much impact on busy days, since the average number of patients per
nurse and per porter is higher on these days (in case of same scheduling on every day). The last reason which
causes a code R is that the charge nurse many times reserves one bay. The charge nurse reserves the bay for
ORs who enter the PACU without taking into account the code R or because there is no overview of the
available nurses and bays. A reservation of a bay increases the number of code R’s.
64 78
89
102
45
1150
1200
1250
1300
1350
1400
1450
1500
Nu
mb
ers
of
pa
tie
nts
Closure till arrival >30 min.
Closure till arrival <30 min.

Process improvement at the PACU . Laura Hofman
34
Since the code R’s are not measurable and also out of the scope of this project, we do not analyse this waiting
time in more depth. Improving the processes which are in the scope of this project also have a positive impact
on the number of code R’s, since the code R’s are related with the length of stay.
Process 1: Enter patient into the bay Entering the patient into the bay is the first step and starts at the time the OR arrives at the PACU through the
swing doors to the moment a nurse grabs a cable to hook the patient up to the monitoring equipment.
Entering a patient in a bay does not add value to the customers’ satisfaction and is non-value adding activity.
The involved people are the OR nurse, the surgeon, and the anaesthetist. The cycle time of entering a patient
into the bay is on average 0.5 minutes with a maximum of 2 minutes and a minimum of 0 minutes.
Opportunity for improvement
This process shows an opportunity for improvement, since the bay assignment is not clear before/during
entering the patient. When the OR enters the patient in the OR, the charge nurse has to assign the bay which
is free. This waste takes on average 0.2 minutes. This is not a very time consuming step in the total process.
Otherwise, the nurses at the PACU see this as a very stressful step and it is waste in the system. According to
Womack and Jones’ (2003) 8 types of waste, it is a waste of waiting, since the OR seeks for clarification. It is
useful to improve the bay assignment process, since it has impact on the code R and it reduces the time spent
of the charge nurse.
Process 2: Hook patient up to monitoring equipment This process starts at the moment a nurse grabs the cables to hook a patient up and ends at when the nurse
starts to record the patient’s vitals in the chart. The cycle time for this process is on average 4.0 minutes with
a minimum of 2.0 minutes, and a maximum of 10.0 minutes. Hooking up a patient to the monitoring
equipment is a value added step, since a patient appreciates hooking up to equipment that continuously
monitors the body vitals which gives nurses input for the patient’s recovery. The involved people are most of
the times the OR nurse and/or the PACU nurse. Sometimes the surgeon and anaesthetist support them. This
time is very short and during the observations there was no motive identified to reduce this time.
Recovery
Figure 21: Recovery process (n=62, Shadow days in the PACU, 2012)
The recovery process starts when the nurse records the patient’s vitals in the patient chart. Then the nurse
fulfils the orders in the order system. The patient orders (medication, anaesthetics, etc.) are entered into the
order system by staff who is involved in the health care delivery process before the PACU. The order system
records which medication staff has to administer or which medication is administered to the patient. From
entering a patient to the time a patient is recovered, nurses check the vitals of the patient every 10 to 15
minutes to find out if a patient is recovered according to the discharge criteria list. The discharge criteria list
is a standardised list with five major groups (see Appendix F). During the recovering period of the patient,
Recover patient (medical processes)
CT = 0.8 - 135.5 - 442.5
1 person
135.5 minutes
VA
NVA

Process improvement at the PACU . Laura Hofman
35
(5) 2.1
(5) 9.5
nurses take care of the patient and do activities like positioning a patient or giving medication. The nurse
records all these activities in the GRASP Workload Instrument (see Appendix G). The patient must score at
least 7 points out of 10 from the discharge criteria list before discharge. When the nurse feels comfortable
with the patients’ vitals, the discharge criteria are met, and the nurse is ready to accompany the patient to the
IP-unit, the patient is ready to go. Then, nurse records the ‘time ready’ on the bottom of the GRASP Workload
Instrument. This time ready is not a very good representation of the time that a patient is really ready based
on the objective discharge list, since it is also based on the subjective interpretation. Otherwise, the time
ready is the only time we can use to estimate when a patient is ready, that is why we keep using this time.
The involved staff in the recovery process is only the PACU nurse. Every nurse has the responsibility of their
two assigned bays or their five assigned beds. When nurses are on break or up to the IP-units, the float nurse,
the charge nurse or a nurse with one patient covers the bay(s).
Process 3: Recover patient This process starts at the moment the nurse starts to record the patients’ vitals in the patient chart and ends
when the nurse records the ‘time ready’ on the patient chart. The recovery of a patient is the medical process
which adds value to the customers’ satisfaction. The average cycle time is 135.5 minutes with a maximum of
442 minutes (7,4 hours) and a minimum of 45 minutes. This process is marked as a value added process
which not automatically results into a full value added process, since it is hard to distinguish the medical
necessary steps from the waste in this process.
The average cycle time (135.5 minutes) is 64.5 minutes larger than the medical necessary LOS in the PACU of
71 minutes (Waddle, Evers and Piccirillo, 1998) and is 29.5 minutes larger than the average LOS of 105
minutes (Brown, et al. (2008), Dexter, et al. (2005) and Waddle, et al. (1998)). Since this step is not in the
scope of this project, we do not add this waste in the value stream map. Some causes which can explain the
delay in process 3 are that the PACU nurse is not available to transfer the patient up to the floor (on break or
up to the floor with another patient), that the nurse recovers the patient longer than based on the discharge
list, that the discharge list is not accurate anymore, or that the nurse is doing too much waste activities (like
walking inefficient).
Opportunity for improvement
There is an opportunity to improve this process which lies between the time the nurse records the patients’
vitals and the nurse records the time ready. The processes in this time frame are not in the scope of this
research but are very valuable to look at, since the measured time is very high in comparison to the literature.
Discharge and cleaning
Porter arrives at bay
CT = 0 – 0.2 - 1.5
1 person
Transfer patient to IP-unit
CT = 11.0 - 24.0 - 2.0
2 people
Call housekeeper to clean bay
CT = 0 - 1.5 - 4.0
1 person
(2) 40.5
(3) 4.7
Clean bay
CT = 1.0 - 3.2 - 8.0
(42.0) 1 person
(4) 2.8
Call or book porter
CT = 0 - 2.2 - 16.0
1 person
VA
NVA
3.2 minutes
74.4 minutes
Figure 22: Discharge and
cleaning process (n=62,
Data set PACU, 2011)

Process improvement at the PACU . Laura Hofman
36
The main focus of this research is on discharge process. This process starts with the moment the PACU nurse
writes down the time ready and finishes when the bay is cleaned. Between these steps, a lot of processes
occur. Before calling the IP-unit that the patient is ready to go, the PACU has to receive the bed assignment list
from the department bed assigning. On average, they send the bed assignment list between 1:00 and 2:00 PM.
The patients who are recovered before receiving the list are not transferred to the floor. Once received the
bed assignment list, the ward clerk calls the IP-unit and ask if the floor is ready to receive the patient. The IP-
unit is ready to receive the patient when the room is clean and the IP nurse is ready. After their feedback, the
ward clerk calls a porter to transfer the patient to the floor accompanied by the PACU nurse. For a patient on
a stretcher, one porter is necessary, and for a patient in a bed two porters are necessary. If the PACU porter(s)
is/are not available, the ward clerk books a porter with the booking system. With the booking system a
message is send to the pager of a porter with the name of a patient and the number of the room in the IP-unit.
Booking a porter with this system can sometimes take up to 30 minutes. Sometimes the PACU porter has
already transferred the patient before the booked porter arrives which creates an inefficient porter system.
When the porter(s) arrive(s) at the bay of the patient, the porter wheels the patient out of the PACU and the
nurse follows the patient to the floor to do the information hand-off with the IP-nurse. The ward clerk records
the time out and looks for a housekeeper to clean the bay. Frequently, the dedicated housekeepers to the
PACU are not in the PACU. Then the ward clerk pages the housekeepers and waits until they come. In this
time, the bay is not cleaned, so a new patient cannot come into this bay.
A calculation of the delay between the processes ‘recover patient’ and ‘call or book porter’ was possible for 54
cases (87%) because the nurse has written the time ready for 54 patients.
Waiting time 2: Time between recover a patient and call/book a porter Most of the waiting times in the VSM are in the discharge and cleaning process. Waiting time 2 is the biggest
delay in the process and is on average 40.5 minutes with a maximum of 252 minutes (4.2 hours) and a
minimum of 0 minutes. The minimum waiting time of 0 minutes is probably more, since the time ready is not
always recorded very accurate. Figure 23 shows the waiting time 2 for the patients where the nurse recorded
a time ready and the time ‘call or book porter’ is recorded (n=49) and gives the cause of this waiting time. The
graph sorts the causes per patient from the lowest average recorded waiting time to the highest recorded
waiting time. The waste is characterised as a waste of transportation, since most of the times the PACU has to
wait to transfer the patient or waits for a reaction from the IP-unit.
This research has investigated the numbers of patients with a waiting time of more than 15 minutes. Almost
half of the patients (49%) have a waiting time 2 of 15 minutes or more with a maximum of 252 minutes (4.2
hours). The average waiting time is 40.5 minutes, the median is 15 minutes and the modus is 0 minutes. Since
these indicators are different, we can conclude that this waiting time presents a skew distribution. By
calculating the skewness with the following formula: (n/n-2)*(1/n-1)*∑(xi-x/SD), we can conclude that the
data are extreme left-skew (positive skewness of 72.4). By eliminating the two extreme outliers, this heavily
changes the skewness to 5.6. This means that the outliers are misrepresenting the average. By eliminating
these outliers, the average changes into 32.1 minutes. After eliminating the outliers, this is still a huge delay.
Opportunities for improvement
The causes of waiting time 2 which we now show are also opportunities for improvement. The first problem
is that after receiving the bed assignment list, there is still no room available for the patient on an IP-unit (7
cases). The second big problem is that the PACU has not received a bed assignment list, so they cannot
transfer SDAs up to the floor (8 cases). The other problems are that the room is not cleaned (3 cases), that the

Process improvement at the PACU . Laura Hofman
37
0,0
0,5
1,0
1,5
2,0
2,5
3,0
3,5
4,0
4,5
1 3 5 7 9 11 13 15 17 19 21 23 25 27 29 31 33 35 37 39 41 43 45 47 49
Wa
itin
g t
ime
2 (
ho
urs
)
Observed patients
IP nurse is not ready (4 cases), that the PACU nurse is not ready (1 case), and that the ward clerk calls too late
(2 cases). Figure 23 shows measured data of waiting time 2 sorted by cause of waiting time (not consecutive).
.
Figure 23: Waiting time between recovery and call or book porter (n=49, Shadow days PACU, 2011)
Figure 24 shows the total waiting time (and average waiting time) in minutes for every factor which created
a waiting time between recording the time ready and call or book a porter. The total waiting time for the 23
cases with a waiting time of more than 15 minutes is 32.2 hours (in seven shadow days) of which two
problems (no bed assignment list and still no room available) counts for more than three quarter of the time.
The Figures 23 and Figure 24 show that having no bed assignment list and still having no room after receiving
the bed assignment list are the problems which cause a huge waiting time for many patients in the PACU.
Figure 24: Total time of factors causing waiting time 3 (n=49, Shadow days PACU, 2012)
4%
35%
42%
7%
7% 2% 2%
Waiting time less than 15 minutes
No bed assignment list
Still no room available
Room not cleaned
IP nurse not ready
PACU nurse not ready
Ward clerk calls too late
140 (46.7)
140 (35)
678 (84.8)
43 (43)
81 (3.5)
813 (116.1)
39 (19.5)

Process improvement at the PACU . Laura Hofman
38
Process 4: Call or book a porter If the ward clerk calls the porter, this process starts at the moment the ward clerk takes the phone to the
moment the ward clerk ends the phone call. If the ward clerk books a porter, this process starts at the
moment the ward clerk grabs the mouse to book the porter with the booking system and ends when the ward
clerk clicks on the ‘save’ button in the booking system. Sometimes the porter is in the room, which results
only in a short call to the porter. The cycle time of process 4 is on average 2.2 minutes and only the ward
clerk is involved. The minimum duration is 0 minutes and the maximum duration is 16.0 minutes. Booking a
porter causes the high maximum duration, since the booking system for porters outside the PACU is really
slow. Calling a porter is a non-value added process and a waste of over processing.
Opportunity for improvement
Currently, the porters do not know patient is ready to go to the IP-unit. Another problem is that many
patients are discharged by nurses in the afternoon and cause an increased demand for porters. This results in
a longer time because the ward clerk has to book porters.
Waiting time 3: Time between call/book a porter and porter arrives The time between the ward clerk completes the call to the time the porter enters the PACU is a waiting time
of on average 4.7 minutes. The minimum duration is 0 minutes, since sometimes the PACU porter is available
immediately, and the maximum duration is 24 minutes. Figure 25 shows the distribution of waiting time 3.
We see that 13 cases show no waiting time 3, since the PACU porter is directly available. For these cases, the
ward clerk only has to ask the porter to transfer the patient. In 26 cases the porter was not in the PACU
resulting in a waiting time.
Figure 25: Distribution of waiting time 3 (n=49, Shadow days PACU, 2012)
Opportunity for improvement
First of all, waiting time 3 is caused by the fact that the PACU porter is not at the PACU. If both of the porters
are gone and the ward clerk calls another porter, the cause is also that the PACU has to wait for the porter
from outside the PACU. The walking time for porters from outside the PACU is long resulting in a long waiting
time. Another problem is that PACU porters are not always in the PACU after transferring the patient. The
first opportunity to improve this waiting time is to adapt the scheduling of the porters or housekeepers. The
second opportunity is improving the location for porters after transporting patients.
0,00
0,05
0,10
0,15
0,20
0,25
0,30
0,35
0,40
0,45
1 3 5 7 9 11 13 15 17 19 21 23 25 27 29 31 33 35 37 39 41 43 45 47 49
Wa
itin
g t
ime
3 (
ho
urs
)
Observed patients
Waiting time
Waiting time =average waitingtime (4.7 min.)

Process improvement at the PACU . Laura Hofman
39
Process 5: Porter arrives at bay This process starts from the moment the porter enters the PACU to porter arrives at the bay. If the porter is in
the PACU already, the process starts with the moment the porter walks to the bay after the ward clerk calls
the porter. The cycle time of this process takes, rounded off 0.2 minutes with an minimum duration of 0
minutes and a maximum duration of 1.5 minutes. Sometimes the porter is at the PACU and is immediately
available which results in a cycle time of 0 minutes. That the porter arrives is not a non-value added step,
since it does not change the health situation of the patient and does not add value to the patients’ satisfaction.
Opportunity for improvement
The PACU can reduce this time slightly if the PACU porters are, usually, in the PACU after transferring patients
up to the nursing floor.
Waiting time 4: Time between porter arrives and transfer patient to IP -unit The time between the porter arrives at the bay from the patient to the time the porter starts to roll the patient
is a waiting time of on average 2.8 minutes with a minimum duration of 0 and the maximum duration is 10
minutes.
Opportunity for improvement:
The cause of this problem is that the PACU nurse has to disconnect the patient from the monitoring and that
the nurse is not at the bay. Sometimes the nurse talks with other nurses or in the worst case, the nurse is on
break while waiting for the porter. These problems are opportunities to reduce waiting time 4.
Process 6: Transfer patient to IP-unit This process starts with the moment the porter who starts to roll the bed or stretcher and ends at the
moment the PACU nurse is back on the floor after the information handoff with the IP-unit. The cycle time of
transferring a patient is on average 24 minutes with a minimum duration of 11 minutes and a maximum
duration of 42 minutes. The PACU nurse and the porter are involved and it is a non-value added process,
since it does not add value to the patients’ satisfaction.
Opportunity for improvement
The most common reasons, according to interviews with PACU nurses, are that the IP nurse is not ready to do
the information handover or that the elevators are busy, since elevators for beds also are used by individuals
(sometimes nurses wait 10 minutes for the elevator). Another issue is that some nurses of the 11th floor are
not helpful with transferring the patient to the bed and hooking the patient up. Most of the waste in this
process is a result of transportation. During a meeting with North York Hospital on June 7, 2012, we identified
that nurses from this hospital do not go up to the floor with the porter but do the information handover by
phone. The other processes like hooking up and transferring the patient to a bed, is done by the nurse in the
IP-unit. The busy elevators, availability of the IP-nurse and the processes in North York Hospital give
opportunities for improvement at the PACU. During interviews it is estimated by nurses that, without any
waste in the transportation process, the process could take half of the time. This estimates the waste on 12
minutes and the every cause has the same impact. Eliminating this process is maybe not the best way, since
that increases the work of another department and replaces the problem.
Waiting time 5: Time between porter arrives and call housekeeper This waiting time is the time between the porter starts to roll the bed or stretcher out of the PACU and the
ward clerk grabs the phone to call the housekeeper. The waiting time is on average 2.1 minutes with a
minimum duration of 0 minutes and a maximum duration of 38 minutes.

Process improvement at the PACU . Laura Hofman
40
Opportunities for improvement:
Sometimes the ward clerk does not call the housekeeper, than the housekeeper cleans the bay if he/she is in
the PACU and sees the strings of the monitoring equipment on the ground. Currently it is not clear for the
ward clerk which bays are clean and which bays are dirty. The ward clerk gets to know that by watching
every bay.
Process 7: Call housekeeper to clean the bay After the patient leaves the PACU, the ward clerk, most of the times, calls the PACU housekeeper to clean the
bay. The PACU has always one dedicated housekeeper from 6:00 AM to 10:00 PM. The process starts at the
moment the ward clerk takes the phone to the moment the ward clerk hangs the phone. Calling the
housekeeper takes on average 1.5 minute with a minimum of 0 minutes and a maximum of 4.0 minutes. Only
the ward clerk is involved in this process and it is a non-value adding process and identified as a waste of
over processing.
Opportunity for improvement
Sometimes the ward clerk calls the housekeepers more than 3 times. It is possible to reduce these times if the
housekeepers are always in the PACU and it is possible to remove this process out of the workflow if the
housekeeper can see which bays have to be cleaned.
Waiting time 6: Time between call housekeeper and clean bay
This waiting time is between the ward clerk hangs the phone to call the housekeeper to the moment the
housekeeper starts cleaning the bay. The waiting time is on average 9.5 minutes with a minimum of 0 minutes
and a maximum of 64 minutes. The maximum was measured at the end of the day when it was not busy in the
PACU.
Opportunities for improvement:
This waiting time is, mainly, caused by the fact that housekeepers are not coming on time in the PACU.
Sometimes the ward clerk has to call more than 3 times to ask where they are. During the observations it is
never happened that housekeepers where too busy which results in this waiting time. The problem that
housekeepers are not in the PACU is an opportunity for improvement.
Process 8: Clean the bay The workflow ends with the process of cleaning the bay. This starts at the moment the housekeeper starts
cleaning the bay and ends at the moment the housekeeper is not coming back to clean the bay before a new
patient arrives. This process has an average cycle time of 3.2 minutes, a minimum time of 1.0 minute, and a
maximum time of 8.0 minutes. One housekeeper is involved and it is a value added process, since patients add
value to a sterilised bay which reduces the risk on diseases.

Process improvement at the PACU . Laura Hofman
41
3.3.4 Overview of non-value added parts in the workflow
Table 4 presents the non-value added processes and waste and their cause of inefficiency.
Non-value added part in workflow Cause
Time between recovery and call/book porter No bed assignment list received
After receiving bed assignment list, still no room available in the IP-unit
Room in IP-unit not cleaned
IP nurse not ready
PACU nurse not ready
Ward clerk calls too late
Time of call or book a porter Porter does not know which patient is ready to go
Location of porters after transferring a patient
Time between call or book porter and porter
arrives
Schedules of porters and housekeepers do not fit to the demand
Location of porters after transferring a patient
Time between arrival of porter and transferring a
patient
PACU nurse has to disconnect patient
Not clear who is on break
Nurse talks with other nurses while the porter and
patient are waiting
Time a nurse and a porter transfer a patient IP nurse not ready to do the information handover
Elevators are busy
Time between porter arrives and call
housekeeper
Ward clerk does not know which bay has to be
cleaned
Time the ward clerk calls the housekeeper Housekeepers do not know which bay has to be
cleaned
Housekeepers are not in the PACU after cleaning
Time between call housekeeper and clean bay Housekeepers are not in the PACU after cleaning
Table 4: Non-value added parts in the workflow and their cause (Shadow days PACU, 2012)
3.3.5 Controllability of processes and wastes
To reduce the LOS of patients in the PACU, it is valuable to identify which delays are controllable for the PACU
and which are not. A process or waiting time is characterised as controllable for the PACU if the PACU has
influence on reducing the cycle time of the specific process or waiting time. Table 5 presents the identified
delays in the non-value added processes and waste from closing a patient in the OR to cleaning the bay. The
processes 4 and 7 are identified as delays, since this are processes which can be eliminated in the new
situation if the porters and the housekeepers know by themselves what they have to do. The total avoidable
delay which is identified in the scope of this project is 89.5 minutes of which 36.8 minutes are controllable by
the PACU. If the delay affects the LOS, the number is bold. The main focus is to reduce the time after the PACU
nurse records the time ready. The controllable delay before the time ready in the scope of this project is 7.5
minutes and after time ready is 29.3 minutes. This presents that most of the controllable waiting time by the
PACU is after recording the time ready. If this research also has focused on the delay in the medical recovery
process, the waiting time before recording the time ready was much larger than the waiting time after
recording the time ready.

Process improvement at the PACU . Laura Hofman
42
The controllable delay in the PACU is based on the percent of the delay is caused by factors in the PACU. Some
processes are fully controllable by the PACU (100%) and some processes partly. The processes which are
fully controllable by the PACU are: (1) Assigning the bay, (4) Call or book a porter, (7) Call housekeeper to
clean bay, (3) time between call/book porter and porter arrives, (4) the waiting time between porter arrives
and porter transfers patient, (5) time between porter arrives and call housekeeper, (6) time between calling
the housekeeper and housekeeper cleans the bay. The controllable time of process 1 due to the fact that the
PACU nurse is not available is estimated on 33%. The time of waiting time 1 is based on the estimation that
52% of the first waiting time is caused by the code R in the PACU. The controllable time of waiting time 2 is
the percentage of the cause that the PACU nurse is not available and the ward clerk does not call the porter
(≈6%).
The next section investigates the impact of reducing the controllable and uncontrollable delays on the LOS of
patients in the PACU.
Delay Time of delay (min) Cause
Controllable by
PACU (min.)
Process 1 0.2 Bay assignment unclear 0.2
Process 4 2.2 Waiting for PACU porter 2.2
Process 6 12.0
Elevators, IP-nurse not available, nurse
goes up to the floor 4.0
Process 7 1.5
Housekeeper does not know which bay
has to be cleaned 1.5
Waiting time 1 14.0
Delay in OR (unknown reason), code R
in PACU 7.3
Waiting time 2 40.5
No bed assignment list, still no room
available, room not cleaned, IP nurse
not ready, PACU nurse not ready, ward
clerk calls too late 2.5
Waiting time 3 4.7 No PACU porter available 4.7
Waiting time 4 2.8
PACU nurse not at bay, disconnect
patient 2.8
Waiting time 5 2.1
Not clear which bay has to be cleaned,
ward clerk calls too late 2.1
Waiting time 6 9.5 Housekeeper arrives too late 9.5
Total delay 89.5 36.8
Before time ready 14.2 7.5
After time ready 75.3 29.3
Table 5: Waiting times in the PACU (Shadow days PACU, 2012)
3.4. Scenario analyses
In this chapter we analyse the impact of different scenarios to the LOS of patients in the PACU and the
required resources. The impact is defined in terms of reducing the LOS (minutes) and in monetary terms.
First, subsection 3.4.1 presents the numbers of patients on every hour of the day and the current number of
nurses on every day. After presenting these numbers, we analyse what happens if the PACU adapts their
schedule to the current patient flow. Sub section 3.4.2 analyses what happens if the LOS in the PACU changes

Process improvement at the PACU . Laura Hofman
43
Figure 26: Occupation on Wednesdays and staffing (data set PACU, 2011)
0
2
4
6
8
10
12
14
16
PA
CU
occ
up
ati
on
(#
pa
tie
nts
) /
nu
mb
ers
of
nu
rse
s
Wednesday DS
SDA+IP
Current staffing
Total necesarrystaffingNecessary staffSDA+IPNecessary staffDS
to the average LOS and the necessary LOS based on literature. Third, we analyse the impact of eliminating the
delays which are controllable. Fourth, we analyse the impact of eliminating the delays which are controllable.
3.4.1 Impact of adapting the schedule to the current state
In this subsection we analyse the number of patients in the PACU on the days with the maximum demand of
nurses (Wednesday) and the minimum demand of nurses (Friday). We calculate the demand using the nurse
to patients ratio’s for the different patient types. The nurse to patient ratio for DSs is 1:5 and the nurse to
patient ratio for SDAs and IPs is 1:2. Both of the figures show the occupation of the PACU on every half an
hour using a 90% confidence interval and the necessary and current staffing. The 90% interval is counted by
removing the (0.05*52=) 3 busiest days (Wednesdays or Fridays) and then taking the maximum number of
arrivals on every half an hour. Currently, the staffing in the PACU is the same on every day (see Figure 14). At
night there are 2 nurses on call which is enough to cover 90% of the days. The Figures 26 and 27 analyse if
this fits to the current demand on the maximum patient arrivals on Wednesday and Friday. Appendix H
shows the current and necessary staffing for each day of the week.
Figure 26 shows the number of patients on Wednesday with a 90% confidence interval and shows that:
The current staffing and the necessary staffing show the same pattern.
From 9:30 AM to 10:00 AM the PACU needs 2 nurses more than scheduled and from 2:30 to 3:00 the
PACU needs 1 nurse more than scheduled.
The maximum difference between necessary and current staff is at 5:30 PM. The necessary number
of nurses is 4 nurses and currently the PACU schedules 8 nurses (difference of 4 nurses).
The PACU can reduce the number of staff on Wednesday by 1 nurse ($102.000) by changing the following
things in the schedules (new adapted schedules in Appendix I):
Shift 1: Move the break from 9:30 AM to 9:00 AM. Shift 5: Move the start from the shift from 10:00 AM to 9:30 AM and the break from 2:30 PM to 2:00
PM. Shift 11: Move the start from the shift from 3:00 PM to 2:30 PM. Shift 7: Eliminate this shift.

Process improvement at the PACU . Laura Hofman
44
Figure 27 shows the number of patients on Friday with a 90% confidence interval and shows that: On average, the PACU schedules on Fridays two nurses more than necessary.
Only between 11:30 PM to 12:00 PM the PACU needs 1 nurses more than scheduled.
The maximum difference between necessary and current staff is at 4:30 PM. The necessary number
of nurses is 4 nurses and currently the PACU schedules 9 nurses (difference of 5 nurses).
The PACU can reduce the number of staff on Friday with 2 nurses ($204.000) by changing the following
things in the schedules (see adapted schedules in Appendix I):
Shift 3: Eliminate this shift.
Shift 10: Move the start from the shift from 10:00 AM to 3:00 PM, move the break from 4:00 PM to
5:30 PM.
Shift 13: Move the break from 5:30 PM to 4:00 PM.
Shift 5: Move the break from 2:30 PM to 3:30 PM.
Shift 12: Eliminate this shift.
Figure 27: Occupation on Fridays and staffing (data set PACU, 2011)
In the current situation, the PACU has a maximum of 11 inpatients (SDAs + IPs) during peak hours (4:00 PM
on Thursday) which require 11 bays. Sometimes the PACU has isolation cases which need two bays instead of
one bay. Taking into account that there is one isolation case in the PACU during peak hours and that the PACU
has to cover all the patients for 90% of the days, the PACU needs (11+1=) 12 bays. The PACU has 14 bays for
inpatients (SDAs and IPs) which results in enough bays to cover 90% of the days and taking into account 1
isolation case.
3.4.2 Impact of reducing the LOS
This subsection analyses what happens if the LOS of patients in the PACU is shorter based on the LOS in
literature. The literature shows an average LOS of patients in the PACU of 105 minutes on average and a
medical necessary LOS of 71 minutes. First we analyse what happens in scenario 1 and then in scenario 2.
Scenario 1
The first scenario is that the LOS in the PACU (for IPs and SDAs) reduces for three 3 groups in the PACU. The
reduction of the LOS is based on the average LOS from the literature of 1.75 hours (105 minutes) in the PACU
(Brown, et al., 2008, Dexter, et al., 2005, and Waddle, et al., 1998). The current LOS of SDAs and IPs in the
0
2
4
6
8
10
12
PA
CU
occ
up
ati
on
(#
pa
tie
nts
) /
nu
mb
ers
of
nu
rse
s
Friday DS
SDA+IP
Current staffing
Total necesarrystaffingNecessary staffSDA+IPNecessary staffDS

Process improvement at the PACU . Laura Hofman
45
Figure 28: Occupation in the PACU and required staffing (data set PACU, 2011)
0
2
4
6
8
10
12
PA
CU
occ
up
ati
on
(#
pa
tie
nts
) /
nu
mb
er
of
nu
rse
s
DS
SDA+IP
Necessary staffingSDA + IPNecessary staffingDSTotal necesarrystaffing
PACU is 2.75 hours (165 minutes) which is a difference from 1 hour. The first group of patients has a LOS of 0
to 105 minutes (29.8%). It is unlikely that by improving the processes in the PACU these times reduce under
the average LOS of 105 minutes. The second group has a LOS of 106 to 300 minutes (61.9%). By improving
the current state, it is possible to reduce the LOS of the second group with (2.75/1.75=) 64%. The third group
has a LOS of more than 300 minutes (5 hours) (8.3%) which are extreme cases. By improving the processes in
the PACU, the bed assignment department and the IP-units, it is reasonable to reduce the LOS of these
patients to an average of 5 hours.
Figure 28 shows what happens with the occupation in the PACU if the LOS of patients in the PACU decreases
according to scenario 1. With the current number of staff on every hour of the day, the PACU has 169 nursing
hours a day. If the PACU decreases the LOS of patients and adapts the schedule of the nurses to the demand,
the necessary nursing hours a day are 62 hours (reduction of 63%). When reducing the staffing capacity with
63% (11.15 FTE), the costs would reduce with (11.51*102.000=) 1,137,402 CAD.
3.4.3 Impact of eliminating controllable delays
This subsection analyses what happens if the PACU eliminates the times of the controllable delays and the
next subsection analyses what happens if the PACU eliminates the times of the non-controllable delays. The
current LOS in the PACU and the cycle time of the whole process, which are based on the 62 observations, are
190.4 minutes respectively 231.6 minutes. Table 4 showed all the delays and the delays which are
controllable by the PACU.
Scenario 2
The controllable delays in the PACU are 36.8 minutes (15.9% of total cycle time). Reducing these delays has
impact on the total cycle time, the LOS, and the number and costs of staff. We now discuss the impact of
reducing the controllable delays.
Eliminating the controllable delays reduces the total cycle time with 36.8 minutes (15.9%). From these 36.8
minutes, 12.4 minutes affect the LOS. The time that the nurses spend in this process is the same time as the
LOS. Reducing the LOS with 6.5% (12.4 minutes) reduces the required staff also with 6.5%. Currently, the

Process improvement at the PACU . Laura Hofman
46
PACU has 17.7 FTE which costs 1,400,000 CAD a year. A reduction of the LOS of 6.5% results in a saving of
staff of (0.065*17.7 FTE=) 1.2 FTE (≈91.000 CAD a year).
3.4.4 Impact of eliminating non-controllable delays
Scenario 3
The non-controllable delays in the PACU are 56.5 minutes (23.9% of total cycle time). Reducing these delays
has impact on the total cycle time, the LOS, and the number and costs of staff. We now discuss the impact of
reducing the controllable delays.
Eliminating the non-controllable delays reduces the total cycle time with 52.7 minutes (22.3%). From these
52.7 minutes, 38.0 minutes affect the LOS. The time that the nurses spend in this process is the same time as
the LOS. Reducing the LOS with 20.0% (38.0 minutes) reduces the required staff also with 20.0%. A reduction
of the LOS of 20% results in a saving of staff of (0.2*17.7=) 3.5 FTE (≈280.000 CAD a year).
3.5 Summary
Using the methodology which is described in chapter 1 and the literature in chapter 2, we have analysed the
current situation of the PACU. This section presents the main findings to answer the next research questions:
1. What are the current processes and supporting resources in the PACU and how can these processes be
organised in a workflow?
3. Where in the current workflow are opportunities for improvement?
To give an answer to these questions, first a summary of chapter 3 follows.
Patient flow in the PACU
The PACU takes care of three patient types: day surgeries (DSs), inpatients (IPs) and same day admits
(SDAs).
The inflow and outflow patterns of patients in the PACU show many variability on different days of
the week and different hours of a day. The busiest day of the week is Wednesday (21.5 arrivals a day)
and the busiest hour of inflow on a day is at 3:00 PM (2.7 arrivals) and for outflow is at 5:00 PM (2.6
departures). The daily and hourly fluctuations give input to use dynamic schedules.
In MSH 10 specialties are performed by surgeons of the hospital. The scheduling per day for each
surgery shows much variability but the Grand Total line in Figure 9 shows a stable pattern. This
means that the jointly scheduling of the departments levels the variability.
Resources: Room
The PACU of MSH is has an inpatient area (14 bays) to cover SDAs and IPs and an outpatient area to
cover DSs (4 bays and 13 chairs).
The occupation in the PACU is the highest at 3:30 PM with a maximum of 9.1 patients (based on a
90% interval). In the current situation, the PACU has enough bays to cover all the patients on 90% of
the days.

Process improvement at the PACU . Laura Hofman
47
Resources: Staff
The PACU has 17.7 FTE of which 11 FTE full timers and 1.1 FTE part timers. The remainder FTE is for
casual nurses and overtime. The budget for staffing is 1,4 million CAD of the 2,1 million CAD total
budget of the PACU.
The nurse to patient ratio is 1:2 for IPs and SDAs and 1:5 for DSs. Looking at the current scheduling,
the actual staffing results in much lower nurse to patient ratios than necessary.
The current schedules of the nurses are not adapted to the fluctuations in demand of every hour of
the day and every day of the week which gives an opportunity for improvement. It is also not clear
who is on break which reduces the overview of the available nurses for the charge nurse. If the PACU
changes the schedules from Wednesday and Friday to the current demand, the PACU can already safe
(0.2+0.4=) 0.6 FTE (≈61,000 CAD a year). If the PACU eliminates all the controllable delays, the PACU
can even save 1.2 FTE (≈91,000 CAD a year).
The PACU has 2 dedicated porters and 2 dedicated housekeepers. The scheduling of the porters
seems to fit to the current patient arrivals and the scheduling of the housekeepers not. This gives an
opportunity for improvement.
It is not clear when staff (nurses, porters and housekeepers) is on break. This sometimes results in
code R’s and an increased LOS (which adversely affects the code R’s), since the charge nurse and
ward clerk do not know where staff from the PACU is, since there is no overview.
Length of stay (LOS)
The difference in LOS between IPs and SDAs is, principally, due to the fact that IPs have a bed
assigned before the PACU receives a bed assignment list and SDAs not. The LOS of the SDAs is 1.22
hours higher than the average LOS of 1.77 hours identified by Brown, et al. (2008), Dexter, et al.
(2005) and Waddle, et al. (1998) and 1.81 hours higher than the medical necessary LOS of 1.18 hours
identified by Waddle, et al. (1998). The LOS of IPs is 0.5 hours respectively 1.09 hours higher.
The longest LOS, based on type of surgery, is for Urology and General Surgery patients. The long LOS
and high number of arrivals increase the LOS of patients in the PACU mainly on Wednesday. This is
the current situation and the PACU has to deal with this.
The LOS has a strong correlation with the number or arrivals on each day and the hour of the day.
The more patients, the longer the average LOS. Also the LOS is much higher between 6.00 AM and
6:00 PM. It is not plausible that the medical recovery time of patients is subjected to the time they are
in the PACU, since the necessary medical recovery time is not based on time. This suggests that the
LOS is subjected to the time a patient is not recovering, but waiting in the PACU. During busy hours
and busy days of the week, the impact of transferring patients up to the floor is much higher, since
the time that a nurse is not at the PACU has impact on more patients. This clarifies the increased LOS
and gives an opportunity for improvement.
Time registration
The process from closing the patient after surgery to the moment the bay is clean has 8 processes
and 6 waiting times. The current VA ratio is 61.7%, the total cycle time is 231.4 minutes and the
throughput is 3.2 patients per hour.
The avoidable waste which is identified is (36.8+52.7=) 89.5 minutes of the total cycle time of which
36.8 minutes are controllable by the PACU. Of this waiting time (12.4+38=) 50.4 minutes affect the
LOS, since some delays are parallel to each other or measured after a patient left.
Reducing the controllable delay in the process results in a reduced LOS of 12.4 minutes (6.5% of
LOS). The main controllable factor which influences the LOS of patients in the PACU is that there is no
PACU porter available.

Process improvement at the PACU . Laura Hofman
48
Reducing the non-controllable delays in the process results in a reduced LOS of 38.0 minutes (20% of
the LOS). The main non-controllable factors which influence the LOS of patients in the PACU are that
there is no bed assignment list received or that there is no bed available in the IP-unit.
The biggest delay is the waiting time between the nurse records the time ready and the ward clerk
picks up the phone to call the porter. This waiting time is 40.5 minutes on average. After eliminating
the outliers, the average waiting time is still 31.2 minutes which has a huge impact on the LOS.
The answers to the research questions are as follows:
1. The current processes are shown in the workflow of Appendix E and in the value stream map of
Figure 14. The workflow shows the processes in more detail and how the processes are following up
each other. The supporting resources are the room of the PACU, the 17.7 FTE of nurses, 2
housekeepers and 2 porters.
3. The non-value added activities and waste are identified in the current value stream map (see Figure
14). According to Womack and Jones (2003) reducing non-value added activities and eliminating
waste reduces the cycle time and improves the value added time for the customer. The following
processes in the current workflow between entering a patient in the PACU to the moment the bay is
clean show opportunities for improvement:
Process of entering the patient in the PACU
Time between recovery and call or book porter
Process of calling or booking porter
Time between call or book porter and porter arrives
Time between porter arrives and transfer patient to IP-unit
Time between porter arrives and call housekeeper
Process of transferring patient to the IP-unit
Process of calling housekeeper
Time between call housekeeper and clean bay

Process improvement at the PACU . Laura Hofman
49
Enter patient into bay
4. Suggestions for improvement
The previous chapter explores the structure and processes of the PACU and identifies opportunities for
improvement. This chapter suggests interventions, in the scope of this project, to improve the current
workflow and answers research questions 4 and 5:
4. What interventions can be suggested to improve the current workflow at the PACU of Mount Sinai
Hospital?
5. Which problems in the current situation of the PACU can be addressed by using a visual management
system and what elements would a visual management system have to contain?
Figure 29 shows the inefficiencies in the current workflow and gives the structure of section 4.1. Section 4.2
focuses on a visual management system (VMS) what can address some of the inefficiencies.
Figure 29: Inefficiencies after recording time ready (Shadow days PACU, 2012)
4.1 Process interventions
The analysis of the PACU identifies eight areas for improvement in the current work flow after recording the
time ready by the PACU nurse. This section (4.1) suggests appropriate interventions for the opportunities.
4.1.1 Interventions to reduce waiting the time between recovery and call/book porter The waiting time between the recovery process and call/book a porter is the biggest delay. This waiting time
has six causes for a waiting time of more than 15 minutes The controllable delays in these waiting times are
that the PACU nurse is not ready and the ward clerk calls too late. According to Bilalis, et al. (2002) timing of
the information is a crucial element of an information handover. With this information, the PACU can also
influence the non-controllable delays.
We suggest the following interventions:
Meeting with nurses to create an urge of need. The manager of the PACU can schedule a short
meeting with the nurses or talk with a group of nurses every day (because of the different shifts) to
say that this period can be improved by the nurses themselves which can reduce the LOS
Porter arrives at PACU
Hook patient up to monitoring equipment
Recover patient (medical processes)
Transfer patient to IP-unit
Call housekeeper to clean bay
Call or book porter
VA
NVA
Clean bay
4.1.1 4.1.2 4.1.3 4.1.6 4.1.4 4.1.5 4.1.7 4.1.8

Process improvement at the PACU . Laura Hofman
50
Create a visual sign for ‘patient is ready to go’. The creation of a sign which gives information
about when patients are ready to go gives the ward clerk an overview of which patients need a
porter. Section 4.2 gives more information about visual management and the responsibilities.
Give sign to IP-unit after 1 hour of recovery. Creating flow in the process is one of the lean
principles in lean thinking (Womack, 2003). The first option is an electronic system which
automatically gives a sign one hour after recording the time in. When the IP-unit is ready to receive
the patient, they give a sign back. The second option is without an electronic system. The PACU nurse
calls the IP-unit after one hour of recovery. The PACU gives an estimation of the time ready and asks
to prepare the room and staff. This gives an incentive for the IP-unit to make a room and IP-nurse
ready to receive a patient. Also the nurse asks if the room is ready, if not, the IP-unit calls back.
4.1.2 Interventions to reduce the time of call or book a porter
The problems which affect the time of the process of calling or booking a porter are that the porters do not
know which patient is ready to go, and that the porters are not in the PACU after transferring the patient.
We suggest the following interventions:
Create a visual sign for ‘patient is ready to go’. Using visual signs, the PACU porters in the PACU
know which patients are ready to be transferred to the floor. This eliminates the calls from the ward
clerk to the porters.
Porters have to stay in the PACU. After transporting a patient, the porter has to stay in the PACU.
The porter can clean the PACU in the time when there are no patients to transfer to the floor.
4.1.3 Interventions to reduce the waiting time between call or book porter and porter arrives
The first opportunity for improvement is the adapting the schedules of porters and housekeepers to the
demand. A second opportunity for improvement is the location of porters after they have transferred the
patient. Section 4.1.2 gives an intervention for the last opportunity.
We suggest the following interventions:
Using the 10% hybrid effort. Housekeepers can work 10% of there time as porters. Using this
hybrid effort reduces the times that a ward clerk has to book a porter which is a very time consuming
step. It also influences the waiting time between booking a porter and the moment the porter arrives.
Currently, it is not clear how many hours the PACU can use the housekeepers as porters. Every
housekeeper can work 45 minutes (10% of 7.5 hours) as a porter. This means 90 minutes on every
day. The PACU manager has to talk with the housekeepers to make a sense of need and discussing the
new rules. The PACU should use these 90 minutes very effectively by deciding to only use these
minutes after 3:00 PM. We suggest to use 3:00 PM as a threshold, since after 3:00 PM most
transportation problems occur.
Changing the shift of the first housekeeper. Also we recommend starting the shift of the first
housekeeper later (10:00 AM instead of 6:00 AM). Then the PACU can use the first housekeeper more
effectively, since the busiest moments of cleaning and portering are in the afternoon. In the early
morning before 10:00 AM a negligible number of patients leave and for these few patients, nurses
can clean the bay.
Increasing capacity of porters in the afternoon. If the PACU still has problems with the availability
of porters, the PACU can change the job of one housekeeper into a job of porter. The PACU has more
problems with the transferring capacity than the cleaning capacity which supports the intervention
to change the job of one housekeeper into a job of a porter.

Process improvement at the PACU . Laura Hofman
51
4.1.4 Interventions to reduce waiting time between arrival of porter and transferring a patient The cause of this problem is that the nurse still has to disconnect the patient from the monitoring and that the
nurse is not at the bay because of a break or talks with another nurse. Information for the staff who has a
break and who not is also not clear.
We suggest the following interventions:
Visible board with information about the scheduling. A board which is visible for everybody
would bring clarity to the PACU and reduce the number of questions about where staff members are.
Currently, this information is on the written staffing schedule behind the desk of the ward clerk.
Meeting with nurses to create an urge of need. To decrease this time, nurses have to know that
the time they are on break and this is not clear or talk with other staff is important. The manager of
the PACU can schedule a short meeting with the nurses or talk with a group of nurses every day to
say that this period can be improved by the nurses themselves.
4.1.5 Interventions to reduce the time a nurse and a porter transfer a patient
Factors that have impact on the time of transferring a patient are that the IP nurse is not ready to do the
information handover, that the elevators are busy and that some IP nurses are less helpful with hooking up
the patient.
We suggest the following interventions:
Using a system that informs the IP-unit that the PACU starts transferring the patient. To reduce
the times that the IP-nurse is not ready to receive the patient, the PACU has to inform the IP-unit
when leaving. Option one is that when the porter starts transferring the patient, the nurse presses on
a button on an electronic board. This board gives a sign to the IP-unit that the patients comes and
automatically records the time out. Option two is without an electronic board. When the porter
arrives at the bay, the nurse asks the ward clerk to call the IP-unit. After that, the porter starts
transferring the patient and the nurse changes a button on a non-electronic board and records the
time out on the same board.
Dedicated bed transportation elevators. Currently, near the OR and PACU there are 3 elevators for
bed transportation. Sometimes these elevators are used individually. We recommend introducing big
clear signs which forbid using the elevators for individual transport. Also the OR and PACU manager
has to mail staff to inform them to not use these elevators anymore for individual transport and the
problems this creates.
Information handover by phone. Removing processes creates more flow in the process (Cain and
Haque, 2008), reduce the cycle time, and is related to much more benefits (Leone, 2010). One of the
suggestions according to this theory is removing the process of transporting patients to the IP-unit
by a nurse. Nurses from North York Hospital also do not transfer patients to the IP-unit which saves a
lot of time. We recommend to do the information handover by phone and to transport the patient file
in a dedicated tray on the head side of the bed/stretcher where the porter pushes the bed/stretcher.
Then IP-nurses do the transportation of a patient to a bed and hook the patient up to the monitoring
equipment. This intervention can result in an increased problem of availability of IP-nurses. But a
reduction of the time a nurse spends to transfer a patient (24 minutes on average) has more impact
than the time that an IP-nurse is not available (40.5*0.02=0.81 minutes on average).
4.1.6 Interventions to reduce the waiting time between porter arrives and call housekeeper
One of the suggestions in section 4.1.4 is to remove the transportation process for the nurse. The
transportation process takes 24 minutes and is more than the waiting time and processes which are parallel:

Process improvement at the PACU . Laura Hofman
52
the waiting time and processes from the moment the porter arrives until the bay is clean. Removing the
transportation process results in a replacement of the bottleneck which is now the time between the porter
arrives until the bay is clean. The main problems which cause this waiting time is that the ward clerk has no
clear overview of which bays are clean and which not.
We suggest the following suggestions:
An up to date system that presents if a bay is clean or not. A system that shows if a bay is clean or
not improves the overview of the ward clerk. The system not only eliminates the problem that the
ward clerk does not know which bay is clean and which not. Reducing cycle times is related to much
more benefits (Leone, 2010) and makes the process of calling the housekeepers unnecessary. In
section 4.1.4 we suggest that the nurse presses on a button to inform during wheeling out the patient.
This sign informs the housekeepers which bay they have to clean.
4.1.7 Interventions to reduce the time the ward clerk calls the housekeeper The problem is that housekeepers are hard to find for the ward clerk resulting in repeated calls (sometimes
more than 3 times). If the housekeepers are in the PACU and know which bay has to be cleaned, the PACU can
eliminate this process.
We suggest the following interventions:
Housekeepers have to stay in the PACU. After cleaning a bay, the housekeeper has to stay in the
PACU. The housekeeper can do other things or work as a porter. If it happens very often that a
housekeeper has nothing to do, the PACU should change the schedules.
Eliminate calling housekeepers. If the housekeepers are in the PACU and if the housekeepers have
a system which gives information about which bay has to be cleaned, the PACU can eliminate this
process. Section 4.1.6 gives the suggestion for the system.
4.1.8 Interventions to reduce the waiting time between call housekeeper and clean bay The causes for this waiting time are that the housekeepers are not in the PACU. If the housekeepers stay in
the PACU, this decreases this waiting time (and also the duration of the call). Section 4.1.7 explains this
intervention.
4.1.9 Overview of interventions Table 6 presents all the suggested interventions from section 4.1 and the estimated reduction on the cycle
time. The estimated reduction is based on the identified delays in the PACU from table 4 and the elimination
of the processes which are mentioned in section 4.1.
Section
(Chapter 4)
Suggestion for improvement (section 4.1) Reduction of cycle time
per intervention (min.)
4.1.1 Give sign to IP-unit after 1 hour of recovery 5.7
Give sign to IP-unit after 1 hour of recovery
Give sign to IP-unit after 1 hour of recovery
Meeting with nurses to create an urge of need 0.8
4.1.1 &
4.1.2
Create a visual sign for ‘patient is ready to go’ 1.0
4.1.2 Porters have to stay in the PACU 0.8
4.1.3 Using the 10% hybrid effort, changing the shift of the first 4.7

Process improvement at the PACU . Laura Hofman
53
housekeeper, increasing capacity of porters in the afternoon
4.1.4 Meeting with nurses to create an urge of need 1.4
4.1.5 Using a system that informs the IP-unit that the PACU starts
transferring the patient.
1.0
Dedicated bed transportation elevators 5.0
Information handover by phone 19.0
4.1.6/4.1.8 An up to date system that presents if a bay is clean or not 2.1
4.1.7/4.1.8 Housekeepers have to stay in the PACU 8.0
Eliminating calling housekeepers and using an up to date
system to show if a bay is clean or not
1.5
Table 6: Suggested interventions and reduction of cycle time (Shadow days PACU, 2012)
4.2 Visual Management in the PACU
Some of the interventions in section 4.1 are to use a system which creates pull in the system and reduces the
information handovers. In the PACU the ward clerk gives a lot of information to different departments and
different team members of the PACU. Currently, the PACU uses a ‘push’ system to transfer information which
results in a delay in the process. Introducing pull in the processes is one of the lean tools (Womack and Jones,
2003) and reduces the cycle time. According to Bilalis (2002) adding visual tool in organisations improve the
timing of communication.
Subsection 4.2.1 describes which problems in the current situation can be addressed by using a visual
management system (VMS). After this description we give suggestions for different visual management
systems in subsection 4.2.2.
4.2.1 Process improvement with a visual management system
A visual management system can improve many processes and can address the following problems which
section 3.3 identifies in the PACU:
Before time ready:
Reservation of bays since there is no overview of available resources
Bay assignment is not clear
After time ready:
Not clear for porter which patient is ready to go
Ward clerk calls/books the porter too late
Not clear who is on break
Not clear for the ward clerk and housekeeper which bay is clean and which not
This research only gives suggestions for improvement after recording the time ready. Also the time a VMS can
reduce in the current process is measured. Improving all the problems which can be addressed by a VMS
reduces the next processes: 1) waiting time before entering a patient (22.0 minutes), 2) entering a patient
(delay of 0.2 minutes), 3) call or book a porter (2.2 minutes), 4) waiting time between calling a porter and
porter arrives (4.7 minutes), 5) waiting time between porter arrives and transfer patient (2.8 minutes), and
6) the waiting time between a porter arrives and the ward clerk calls the housekeeper (2.1 minutes).

Process improvement at the PACU . Laura Hofman
54
The first delay can be reduced but it is hard to estimate this delay. since the delay of entering a patient is out
of the scope of this research and does not affect the cycle time in the PACU. The second delay can reduce with
0.2 minutes, since a VMS can totally eliminate this delay. The third delay can reduce the cycle time with 1.8
minutes, since sometimes the ward clerk has to book a porter. It is estimated that a VMS reduces the fourth
delay with only 0.5 minutes, since most of this time is caused by the fact that a PACU porter is busy or a porter
outside the hospital has to walk a long distance. The fifth delay can reduce also very slightly with a VMS and is
estimated on 0.5 minutes. The sixth delay can reduce with 2.1 minutes, since a housekeeper and ward clerk
directly can see with a VMS which bays need to be cleaned. This results in a reduction of time of 5.1 minutes.
This time is almost negligible but improves the clarity of the processes after the time ready.
4.2.2 Visual management systems to decrease the time waiting to be transferred
This subsection gives different visual management systems. The systems are ordered from the system which
reduces the time and increases the clarity to team members the most to the systems which improves the
least. The boards give information about the bay status and give staff information about the bay status.
A VMS improves the clarity for a nurse in the following ways:
Clarity which bay the nurse has to cover and which bays are covered by the other nurses
A VMS improves the clarity for a ward clerk in the following ways:
It eliminates recording the time out for the ward clerk.
It eliminates calling the PACU porters in the PACU.
It eliminates calling the housekeepers.
A VMS improves the clarity for a housekeeper in the following ways:
The housekeeper knows which bay has to be cleaned
It is visible for the housekeepers themselves what they have to do which gives responsibility for their
own job
A VMS improves the clarity for a porter in the following ways:
The PACU porter in the PACU knows which patient is ready to be transferred
It is visible for the PACU porters themselves what they have to do which gives responsibility for their
own job.
Large non-electronic coloured white board in the PACU
This board is not electronic and the information on different staff members in the PACU change and write
information. Most of the fields are pre-printed which reduces the work for the staff member who writes all
the information every day on the board. The board is a whiteboard and also a magnetic board and has
magnets in different colours with different functions. Now we explain the location, looks and the use of this
board.
Location
A key driver of a good VMS is a good location of the system from where everybody can see and understand
the information (Womack and Jones, 2003). The suggests that the white board needs to be visible for all the
members in the PACU in the inpatient area. There are two possibilities:
Option 1. Between bay 4 and 5 where currently the storage is located. By moving the storage to one
side, moving it to the other 2 storage locations, and/or reducing the storage gives the opportunity to
hang a board at the wall on eye level.

Process improvement at the PACU . Laura Hofman
55
Option 2. Between bay 12 and 13 on the wall and removing the fire extinguisher. This wall is small
and gives only the opportunity for a board with less information.
Looks
Succes factors for a VMS are using colours, keeping the board simple and organised, and giving the team
members full control over their own board (Parry and Turner, 2007). Keeping this in mind, the board should
contain the following fields on the board for the two different places:
Option 1. The space between bay 4 and 5 is large which gives the opportunity to make a large board.
We choose to only use basic information on the board to make the bay status visible from a large
distance. Figure 30 presents a possible layout. On the bottom of the board there is one tray for the
magnets of the bay status. The magnets have 4 colours and give information about the bay status.
o Red: Bay is occupied with a patient who is recovering.
o Green: Patient in the bay is ready to go to be transferred to the IP-unit according to the
discharge criteria.
o Blue: Bay is dirty and need to be cleaned.
o Orange: Bay is clean and free. A new patient can enter in this bay.
Bay Bay
status
Name
(initials + last name)
OR Comments In Ready Out
3 M. Johnson 5 X 10:32 11:45
4 S.K. Kennedy 3 MRSA 11:14
5
6
7
..16 [button]
Figure 30: Manual whiteboard option 1
Option 2. The space between bay 12 and 13 is limited which does not allow to use all the information
of the board in option 1. The first two columns are necessary; this gives the information of the bay
status. The name of the patient is also useful for a security check. The OR number and comments are
not necessary, since this information is not used by staff in the PACU. The nurse who has to know the
comments also can find this information in the patient file. For an accurate measurement of the three
times, we suggest to keep these times on the board. Figure 31 shows the manual board for option 2.
Bay Bay
status
Name
(Last name)
In Ready Out
3 Johnson 10:32 11:45
4 Kennedy 11:14
5
6
7
..16 [button]
Figure 31: Manual board option 2

Process improvement at the PACU . Laura Hofman
56
Use
The following steps give a short instruction to use the large board in the PACU (option 1) or the small board
(option 2).
Option 1
The nurse starting with the first shift of a day looks if the bays are free. If they are free, this nurse
checks if also the board shows only orange buttons.
If the OR enters a patient, the ward clerk records the time in on the board, writes the name of the
patient, writes the number of the OR, writes comments based on the patient schedule from the OR,
and changes the button into a red button.
If the patient is ready to go, the nurse who is assigned to the patient records the time ready on the
whiteboard and changes the red button into a green button.
If the porter wheels the patient out of the bay, the nurse records the time out and changes the green
button into a blue button. The nurse asks the ward clerk to record the times of the board on the OR
schedule in the PACU.
The ward clerk wipes the information from the board and only leaves the coloured button.
The blue button gives the housekeeper an incentive to clean the bay without being called by the ward
clerk. After the housekeeper has cleaned the bay, the housekeeper changes the blue button into an
orange button.
If a new patient enters the bay, the process starts again.
Option 2
The use of this option 2 is the same as option 1. Only the ward clerk not writes the OR number and
the comments on the board.
Large coloured electronic boards in the PACU and the IP-unit controlled by tablets
This version contains two boards: one in the PACU and one in the IP-unit. The two large boards which are
visible to all team members in the PACU and the IP-unit are connected with each other. Boards which are
connected with each other improve the performance not only in the PACU but also in the IP-unit. The number
of departments which are connected with each other can be extracted. If the moment is there that the hospital
not uses written patient files anymore, we recommend to also connect tablets for nurses with these boards.
The possible locations and looks are the same as described before for the manual board, that is why we only
describe the use of this board.
Use
The following steps give a short instruction to use an electronic board in the PACU. The board works with a
pencil which can be used for electronic boards. The buttons are not magnets but are pictograms which can be
changed by pushing on the right pictogram.
The nurse starting with the first shift of a day looks if the bays are free. If they are free, this nurse
checks if also the board shows only orange buttons.
If the OR enters a patient, the ward clerk records the time in on the board, writes the name of the
patient, writes the number of the OR, writes comments based on the patient schedule from the OR,
and changes the button into a red button. An hour after a patient enters the bay, the system sends a
message to the board in the IP-unit to let them prepare the room.
If the patient is ready to go, the nurse who is assigned to the patient records the time ready on the
whiteboard and changes the red button into a green button. When the board receives this signal of
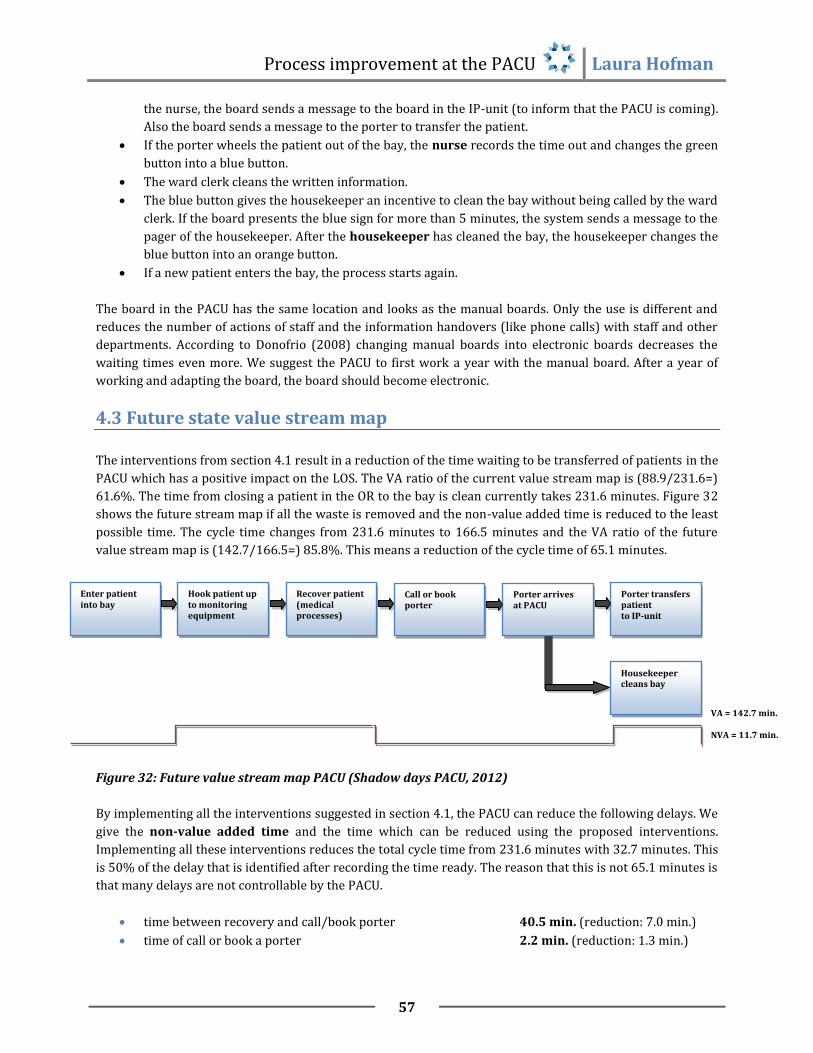
Process improvement at the PACU . Laura Hofman
57
the nurse, the board sends a message to the board in the IP-unit (to inform that the PACU is coming).
Also the board sends a message to the porter to transfer the patient.
If the porter wheels the patient out of the bay, the nurse records the time out and changes the green
button into a blue button.
The ward clerk cleans the written information.
The blue button gives the housekeeper an incentive to clean the bay without being called by the ward
clerk. If the board presents the blue sign for more than 5 minutes, the system sends a message to the
pager of the housekeeper. After the housekeeper has cleaned the bay, the housekeeper changes the
blue button into an orange button.
If a new patient enters the bay, the process starts again.
The board in the PACU has the same location and looks as the manual boards. Only the use is different and
reduces the number of actions of staff and the information handovers (like phone calls) with staff and other
departments. According to Donofrio (2008) changing manual boards into electronic boards decreases the
waiting times even more. We suggest the PACU to first work a year with the manual board. After a year of
working and adapting the board, the board should become electronic.
4.3 Future state value stream map
The interventions from section 4.1 result in a reduction of the time waiting to be transferred of patients in the
PACU which has a positive impact on the LOS. The VA ratio of the current value stream map is (88.9/231.6=)
61.6%. The time from closing a patient in the OR to the bay is clean currently takes 231.6 minutes. Figure 32
shows the future stream map if all the waste is removed and the non-value added time is reduced to the least
possible time. The cycle time changes from 231.6 minutes to 166.5 minutes and the VA ratio of the future
value stream map is (142.7/166.5=) 85.8%. This means a reduction of the cycle time of 65.1 minutes.
Figure 32: Future value stream map PACU (Shadow days PACU, 2012)
By implementing all the interventions suggested in section 4.1, the PACU can reduce the following delays. We
give the non-value added time and the time which can be reduced using the proposed interventions.
Implementing all these interventions reduces the total cycle time from 231.6 minutes with 32.7 minutes. This
is 50% of the delay that is identified after recording the time ready. The reason that this is not 65.1 minutes is
that many delays are not controllable by the PACU.
time between recovery and call/book porter 40.5 min. (reduction: 7.0 min.)
time of call or book a porter 2.2 min. (reduction: 1.3 min.)
Enter patient into bay
Porter arrives at PACU
Hook patient up to monitoring equipment
Recover patient (medical processes)
Porter transfers patient to IP-unit
Call or book porter
VA = 142.7 min.
NVA = 11.7 min.
Housekeeper cleans bay

Process improvement at the PACU . Laura Hofman
58
waiting time between call or book porter and porter arrives 4.7 min. (reduction: 4.7 min.)
time between arrival of porter and transferring a patient 2.8 min. (reduction: 1.4 min.)
time a nurse and a porter transfer a patient 24.0 min. (reduction: 19.0 min.)
waiting time between porter arrives and call housekeeper 2.1 min. (reduction: 2.1 min.)
time the ward clerk calls the housekeeper 1.5 min. (reduction: 1.5 min.)
waiting time between call housekeeper and clean bay 9.5 min. (reduction: 8.5 min.)
4.4 Implementation of interventions
In this section we shortly describe with what intervention we recommend to start with. First of all, we
recommend to start with the interventions that can be accomplished within one week. Then, we look at the
interventions that improve most of the time. Only hiring a new porter costs a certain amount and the other
things are just adaptations without significant costs. We suggest the following implementing plan:
We recommend implementing the following interventions in the first week:
Housekeepers have to stay in the PACU (reduction 8.0 min.)
Nurse gives sign after 1 hour of recovery to IP-unit (reduction 5.7 min.)
Meeting with nurses (reduction 2.2 min.)
Porters have to stay in the PACU (reduction 0.8 min.)
We recommend implementing the following interventions in the half year after the first week:
Information handover by phone (reduction 19.0 min.)
Visual management system (reduction 5.1 min.)
Dedicated bed transportation elevators (reduction 5.0 min.)
Using the 10% hybrid effort, changing the shift of the first housekeeper
(if still necessary: increasing the capacity of porters in the afternoon) (reduction 4.7 min.)
Eliminating calling housekeepers (with using the VMS) (reduction 1.5 min.)
4.5 Conclusion
This chapter answers the fourth and fifth research questions:
4. What interventions can be suggested to improve the current workflow at the PACU of Mount Sinai
Hospital?
5. Which problems in the current situation of the PACU can be addressed by using a visual management
system and what elements should a visual management system have to contain?
Table 7 summarises the interventions we suggest to reduce the time waiting to be transferred in the PACU
and answer research question 4. The first column gives the paragraph in section 4.1 which describes the
intervention in more detail, the second column gives the interventions and the third column gives the part of
the process which the suggested intervention attacks.

Process improvement at the PACU . Laura Hofman
59
Section Intervention Part of the process
4.1.1 Meeting with nurses to create an urge of need Time between recovery and
call/book porter
Create a visual sign for ‘patient is ready to go’ (with VMS)
4.1.2 Give sign to IP-unit after 1 hour of recovery (with VMS) Time of call or book a porter
Create a visual sign for ‘patient is ready to go’ (with VMS)
Porters have to stay in the PACU
4.1.3 Using the 10% hybrid effort Waiting time between call or
book porter and porter arrives
Changing the shift of the first housekeeper
Increasing capacity of porters in the afternoon
4.1.4 Visible board with information about the scheduling (with VMS) Time between arrival of porter
and transferring a patient
4.1.5 Using a system that informs the IP-unit that the PACU starts
transferring the patient (with VMS)
Time a nurse and a porter
transfer a patient
Dedicated bed transportation elevators
Information handover by phone
4.1.6 An up to date system that presents if a bay is clean or not (with
VMS)
Waiting time between porter
arrives and call housekeeper
4.1.7 Housekeepers have to stay in the PACU Time the ward clerk calls
Eliminate calling housekeepers (in combination with VMS)
4.1.8 Housekeepers have to stay in the PACU Waiting time between call
housekeeper and clean bay
Table 7: Summary of interventions and their impact in the process
A visual management system is one of the interventions which can reduce 5.1 minutes of the cycle time in the
PACU and increase the pull in the system. These are not the only thing a visual management system improves.
It also improves the communication between the PACU members (like the communication between the ward
clerk and the porters and housekeepers) and the communication between different departments (giving
signals that the patient in the PACU is (almost) ready and needs a room in the IP-unit). We recommend to first
use a manual white board between bay 4 and 5 and change this into an electronic board after one year of use
and adaptations. Section 4.2 gives possible locations, looks and the way to use the system. The following
inefficiencies in the current process can be addressed using a visual management system:
Before time ready:
Reservation of bays, since there is no overview of available resources
Bay assignment is not clear
After time ready:
Not clear for porter which patient is ready to go
Ward clerk calls/books the porter too late
Not clear who is on break
Not clear for the ward clerk and housekeeper which bay is clean and which not

Process improvement at the PACU . Laura Hofman
60
5. Discussion, Recommendations, Conclusion
Section 5.1 of this chapter discusses the methods and results of this research. Section 5.2 describes practical
recommendations and suggestions for further research. Section 5.3 presents the main findings of this
research and answers the research questions which are mentioned in chapter 1.
5.1 Discussion
This research focuses on the problem that the ‘time waiting to be transferred’ is too long. Also it is not
identified to the team members when a patient is ready to go to the Inpatient Unit. The main focus of this
research was to identify the causes of the long waiting time and to suggest interventions. One intervention for
the first problem, the visual management system, also affects the visibility to all team members when a
patient is ready to be transferred to the Inpatient Unit.
5.1.1 Limitations
The opportunities for improvement and interventions in the PACU only focuses on the two patient types same
day admits (SDAs) and inpatients (IPs). The second limitation is that this research only focuses on the time
after the nurse records the time ready. This time is not always very clear, since the time ready is subjected to
many factors and does not present the actual time that a patient is ready. Some factors which influence the
time ready are:
The PACU is not ready and does not record the time ready
The time ready is recorded better during observations resulting in misrepresented results
Sometimes nurses record the time ready after the patient is left
5.1.2 Methods
This research uses both quantitative methods and qualitative methods. This combinations was pleasant to
first see when (days, hours) the problems occurs in the system using data from the last fiscal year and then to
analyse and understand the underlying causes of the identified problems. It is hard to do the quantitative
analysis of the time waiting to be transferred, since Mount Sinai Hospital has no significant data available of
the time ready. Without data of the time ready, we are not able to analyse factors of the long time of ‘waiting
to be transferred to IP-unit’. This leads to an analysis of the factors that influence the long LOS of patients in
the PACU.
The used qualitative methods are shadow days and interviews. For the purpose of this research we first used
four shadow days to identify problems and then seven shadow days to measure the problems. The
quantitative methods are value stream mapping and data sets. To answer the research question 1 and 3, we
used shadow days which give a lot of information of the processes. During the shadow days we measured the
times of the processes and the time ready. The number of observations where the nurse has recorded the
time ready (n=49) are relatively low to measure the average time of each delay. It is plausible that because of
the observations the nurses work more efficient which misrepresents the time ready a little bit. Almost all the
nurses recorded the time ready which was according to the ward clerk and the observation of the GRASP
sheets of other weeks not a habit of the nurses. The shadow days are one from Monday to Friday with an
extra Wednesday and Thursday, since many problems occur on Wednesday and Thursday. This helps
identifying the problems but increases the average waiting times resulting in a misrepresentation of the real
state. For one waiting time a statistical analyses presented that the average was lower when removing the

Process improvement at the PACU . Laura Hofman
61
outliers. But the main focus was not on the duration of the problems but on identifying the problems and does
not affect the conclusion.
The interviews with the PACU manager and ward clerk are a very useful source for the purpose of this
research. During the shadow days also many opinions from many nurses are identified. Most of the staff
members from different positions share the same opinions which increases the reliability of the information
in this research. It was a pleasure to work with people from other countries and cultures. A difficult element
of interviews with people with another language and culture is that it is not clear if the issue which we notice
is the same as they emphasise on. This can be due to the difficulties with another language but also with
another culture of expressing the opinion in public.
The data of this research were, in general, reliable and give a good reproduction of the current state of the
PACU. One thing to mention is that the time registration after 6:00 PM and before 10:00 AM is not very
accurate, since then the ward clerk does not record the times. The nurses are in this time responsible for
recording these times and they do not care about this registration as much as the ward clerk does.
A method which could help this research was simulating the impact of changing waiting times and schedules
to the LOS. We identified this during the research and identified that it was very hard to schedule this into the
planning of the project. Based on the general backgrounds in health care and business logistics, this was not
able in the planning.
5.1.3 Results The interventions based on the analysis in the PACU are (partly) applicable to other hospitals. Many recovery
rooms and other departments in a hospital face the same problems as in the PACU of MSH. The interventions
in this research are applicable for those problems. The value stream map in this research is specific for the
PACU in MSH and this gives specific problems with specific interventions. Also the number of every type of
patient is not significant and reduces the generality to other recovery rooms. Some common problems in
hospitals are:
Porters are too late to transfer the patient. Interventions to reduce this problem are using
housekeepers as porters (in the MSH this is allowed for 10%), adapting the schedules of porters (and
housekeepers) and keeping the porters in the recovery room after they have transferred a patient.
The floor is not ready to receive the patient. The recovery room cannot eliminate this problem but
can give information on time about the status of the patient in the recovery room. By sending a signal
after 1 hour of recovery gives the IP-unit an incentive to prepare the room for receiving.
There are too many questions in the PACU and it is not clear which steps when to take. The
communication and situations when it is not clear who has to do what can be improved by a visual
management system. This system is applicable in every department of a hospital and improves the
communication and reduces the waiting times.
The research analysis and interventions are based on data of the fiscal year 2011 and current working
practices in the PACU. In the future the PACU will face some developments which change the applicability of
the interventions. Three following developments should be taken into account:
Within 5 years, the PACU will be moved to the new wing of Mount Sinai Hospital. The space in this
wing will change and the hospital expects an increase in the number of patients. This can have a
positive impact on the LOS of patients in the PACU (more technology, more resources, more staff),
but also negatively (more queuing in the OR and more queuing in the PACU for a bed assignment).

Process improvement at the PACU . Laura Hofman
62
Changing the current non-electronic whiteboard into an electronic version within one year should
incorporate this development and keep in mind that the system has to move.
Overall, we can conclude that the limitation for the specific patient types is preferable and the limitation to
the time waiting to be transferred not, since the start time is not measurable. The methods were good but the
number of patients which were incorporated during the shadow days do not present significant average
delays. During the conversations with staff from MSH the difference in language and culture are making it
interesting but make it hard to identify the real issues.
5.2 Recommendations
Chapter 4 gives suggestions for improvement which are limited to the scope of ‘time waiting to be transferred
to the inpatient unit’. This leads to fact that this research does not analyse and give suggestions for some
important waiting times and impacting factors which are out of control of the PACU. Section 5.2.1 gives the
recommendations which are worth to look at for the Office of Quality and Performance Measurement. Also
this sections gives some practical recommendations about the data. During the 10 weeks of this research,
there were some new questions for which we propose recommendations for further research.
5.2.1 Practical recommendations
The biggest delay in the processes in the PACU is the waiting time between a patient is recovered and
the ward clerk can call the porter. The main causes for this is that the bed assignment list is not
received and that, after receiving the bed assignment list is received, the room in the IP-unit is still
not ready to receive a patient. The causes of this waiting time are for almost 80% (32.4 minutes)
caused by these factors. Currently, OQPM also investigates the bed assignment process and one of the
IP-units. We strongly recommend, to give many attention to these two major inefficiencies in MSH
which we identified in this research and improve the bed assignment process within one year.
To improve the measurement of improvement of the PACU, we strongly suggest to add the time
ready to the current data report of the PACU. Adding this time would give the opportunity to analyse
the factors which influence the time waiting to be transferred in more detail. To get these data, we
recommend the PACU nurse to e-mail or talk with the nurses (in groups, since the shifts change a lot)
and ask them to record the time ready properly. Many nurses in the PACU are willing to record the
time ready but do not see the urge of this measure. The manager of the PACU should use the
information in this research to show them why this is advised. Another missing element on the data
sheet is the admission floor. During this research we noticed that different floors have a different
impact on the LOS. Adding the admission floor helps analysing the causes of the long LOS.
Another recommendation is about measuring the code R’s. Currently, sometimes the ward clerk of
the PACU writes the code R on a paper. After recording this, nobody converts this information in an
electronic version. This makes recording the code R useless. We recommend to not writing it on a
blank sheet, but directly record it in a pre-established excel sheet.
Currently the PACU uses only the fiscal data if this is temporarily necessary. We recommend OQPM to
change these parameters into more practical forms (graphs and histograms) and monthly look at the
performance of the PACU. This gives input to continuous improvement and not an ad hoc
improvement of the PACU.
A further step is to involve the management and staff from the PACU in the performance of their
work. We recommend to monthly show these data to the PACU staff members on a performance
whiteboard (like the LOS, the time waiting to be transferred, the fluctuations in occupancy). With this

Process improvement at the PACU . Laura Hofman
63
open culture, staff would earlier increase their involvement in policy and decision-making. We expect
that this idea increases the awareness of staff in the process flow of patients and, just as in
manufacturing companies, leads to better performance and employee satisfaction.
During shadow days in the PACU we followed some nurses to different floors of admission. We
noticed that it is very hard for porters to transfer patients to a room because of stuff that blocks the
corridors. The worst department was the ICU which has plenty of chairs, tables and storage in the
corridors. We recommend to improve the patient flow by cleaning up the corridor of especially the
ICU.
The desk of the ward clerk is in the middle of the PACU. This place gives the ward clerk a good
overview of the inflow and outflow of patients. The disadvantage of this place is that many nurses
also walk here where the ward clerk sits. Another thing is that the desk has too much equipment and
papers which sometimes results in a stressful situation when staff members are looking for papers.
We recommend to put the papers which are used by medical staff at the end of the desk, to clean the
desk and to not allow medical staff members enter this area.
During 7:00 PM and 8:00 PM the PACU is not allowed by the IP-unit to transfer patients to the unit.
We strongly recommend to break this shift change down into different times. Also, the IP-unit should
allow the PACU to enter patients, since keeping patients in the PACU has an impact on the LOS of
patients and overtime of staff.
We recommend the PACU to use a whiteboard with pre-printed names of the nurses in front of the
desk of the ward clerk. This makes it visible to, especially, the clerical nurse to see who is available
and who is on break. This board has to replace the current hand written schedules.
5.2.2 Further research
During the analysis this research identifies that the patient flow shows daily and weekly fluctuations.
The busy inflow hours are between 10:00 AM and 3:00 PM and the busy outflow hours are between
12:00 AM to 7:00 PM. The busiest days of the week are the Wednesday and the Thursday. In the
current situation, the scheduling of the nurses in the PACU does not fit to this demand. The
scheduling is static for every hour of the day and every day of the week. We see in this research that
the inflow shows a stable pattern which gives the opportunity to forecast the number of patients and
adapt the schedule. Possible interventions are to adapt the scheduling of the nurses and/or the
patient scheduling in the OR. We recommend to do further research to investigate if and how MSH
should adapt the schedules of the nurses in the PACU and/or patient schedules in the OR.
If the PACU records the time ready very properly in the next fiscal year, we recommend to do further
research and compare the waiting times in the PACU with factors like different hours of the day,
different days of the week, different types of surgery. In this research we were not able to analyse
these factors on the waiting times, since the number of observations (n=62) are too low to present
significant results. When the waiting times are established, we recommend to simulate the situation
and use different scenario’s to analyse the impact of different variables (hour, day, type of surgery,
admission floor, etc.).
The last, but absolutely not the least recommendation, is to do further research in the medical
recovery process. This process takes far too long in comparison to the literature. Reducing this time
which currently takes 135.5 minutes would have a big impact on the LOS.

Process improvement at the PACU . Laura Hofman
64
5.3 Conclusion
The existing processes in the time waiting to be transferred are very high. One of the reasons is that it is not
clear for staff members when a patient is ready to go to the IP-unit. To give insight in the causes of this
waiting time and suggest interventions to tackle this problem, we have the following research objective:
‘To review and give suggestions for the existing processes in the time waiting to be transferred to
decrease the length of stay of patients in the PACU which results in an improved patient experience
without a negative impact on costs.’
We now answer the research questions which are extracted from this objective:
1. What are the current processes and supporting resources in the PACU and how can these
processes be organised in a workflow?
The current processes are shown in the workflow of Appendix E and in the value stream map of Figure 18.
Section 3.3 gives a short description of the admission, recovery and discharge processes which cover the
processes in the PACU from the begin to the end in the PACU. The workflow shows the processes in detail and
how the processes are following up each other and the value stream map presents the times of the processes
and waiting times in less detail. The supporting resources are the room of the PACU, the 17.7 FTE of nurses, 2
housekeepers and 2 porters.
2. Which theories can be applied to analyse and improve health care processes and workflows?
To get familiar with the processes we analyse the environment of these processes with system theory. Lean
thinking is a tool to identify waste in the processes and describes to increase the value added processes and
reduce the non-value added processes. Theories about workflow improvement help to review the current
situation and gives ideas to improve this situation. A useful tool to improve the workflow is value stream
mapping. The last theory gives insight in the use of visual management systems in organisations to introduce
more pull in a system and increase the information availability among staff.
3. Where in the current workflow are opportunities for improvement?
The processes which show opportunities for improvement are as follows:
Process of entering the patient in the PACU
Time between recovery and call or book porter
Process of calling or booking porter
Time between call or book porter and porter arrives
Time between porter arrives and transfer patient to IP-unit
Time between porter arrives and call housekeeper
Process of transferring patient to the IP-unit
Process of calling housekeeper
Time between call housekeeper and clean bay
4. What interventions can be suggested to improve the current workflow in the PACU of Mount
Sinai Hospital?

Process improvement at the PACU . Laura Hofman
65
The combination of the literature and the conclusion of the analysis leads to overall ideas of how to reduce
the time waiting to be transferred. The interventions are based on adaptations in resources and processes.
The PACU cannot influence the input and output and has to adapt their resources and processes to these
given input and output. We now give a summary of the suggested interventions:
Resources:
Housekeepers and porters have to stay in the PACU after cleaning the bay or transferring a patient.
Using the 10% hybrid effort of housekeepers and porters
Adapting the shift of the first housekeeper
If still necessary: increasing the porter capacity in the afternoon
Meeting with nurses
Dedicated bed transportation elevators
Processes:
Nurse gives a sign after 1 hour of recovery to the IP-unit (using an electronic visual management
system or in the case the PACU uses no electronic visual management system, the nurse ward clerk
calls).
Eliminating the process of transferring the patient for the PACU nurse.
Eliminating the process of calling the housekeepers
5. Which problems in the current situation of the PACU can be addressed by using a visual
management system and what elements would a visual management system have to contain?
Chapter 3 identifies the problems in the PACU and section 4.1 gives interventions to tackle these problems.
Some problems are that the bay status is not clear for the staff members resulting in waiting times. According
to Coyle, et al. (2003) a fast provision of information reduces the cycle time and reduces uncertainty about
the further process. An intervention which makes a fast provision of information possible is a visual
management system. We suggest first using a manual whiteboard in the PACU and changing this into an
electronic board after one year of testing and adapting. We give suggestions for the location, information on
the board and the use of this board in section 4.2. A visual management can address the following
inefficiencies in the current situation:
Before time ready:
Reservation of bays, since there is no overview of available resources
Bay assignment is not clear
After time ready:
Not clear for porter which patient is ready to go
Ward clerk calls/books the porter too late
Not clear who is on break
Not clear for the ward clerk and housekeeper which bay is clean and which not
By answering these research questions we accomplish the goal of reviewing and giving suggestions to
decrease the LOS of patients in the PACU. Most of the interventions are not impacting the costs. Only the
whiteboard and employing an extra porter have a significant impact on costs, but they also result in less
overtime for the PACU. With these interventions we can conclude that we not negatively impact the costs.

Process improvement at the PACU . Laura Hofman
66
References
Agrawal, S., Subramanian, K. & Kapoor, S. (2010). Operation research: contemporary role in managerial
decision making. IJRRAS, 3, 200-208.
Bicheno, J. and Holweg, M. (2009). The Lean Toolbox (4th Ed.). PICSIE Books, Buckingham.
Bilalis, N., Scroubelos, G., Antonidadis, A., Emiris, D. and Koulouritotis, D. (2002). Visual factory: basic
principles and the zoning approach. International Journal of Production Research, 40, 3575-3588.
Bozdogan, K. (2010). ESD working paper series: Towards an integration of the lean enterprise system, total
quality management, six sigma and related enterprise process improvement methods. Cambridge:
Massachusetts institute of technology, Centre for technology, policy and industrial development.
Brown, I., Jellish, W., Kleinman, B., Fluder, E., Sawicki, K., Katsaros, J. and Rahman, R. (2008). Use of
postanesthesia discharge criteria to reduce discharge delays for inpatients in the postaenesthesia
care unit. Journal of Clinical Anaesthesia, 20, 175-9.
Boulding, K.E., (1956) General system theory - the skeleton of science. University of Michigan. Management
Science. 2, 197-208.
Buffone, G., Moreau, D. and Beck, R. (2008). Workflow computing: improving management and efficiency of
pathology diagnostic services. American Journal of Clinical Pathology, p. 17.
Carter, M.W. (2005). ESI-ORAHS. Retrieved from lecture operations management in health care.
Coyle, J., Bardi, E.J., and Langley, C.J. (2003). The management of business logistics: A supply chain
perspective. (7th ed.). Ohio: Thomson South-Western.
Dexter, F., Epstein, R.H., Marcon, E. and Matta, de, R. (2005). Strategies to reduce delays in admission into a
postanesthesia care unit from operating rooms. Journal of peri anesthesia nursing, 20, 92-102.
Donofrio, M. (2008). Visual controls improve patient flow. Nursing management, 39, 21-23.
Gomes, C.F., Yasin, M.M., Yasin, Y. (2008). Assessing operational effectiveness in health care organizations: a
systematic approach. International Journal of Health Care, Quality Assurance, 23, 127-140.
Glouberman, S. and Mintzberg, H. (2001). Managing the care of health care and the cure of disease.
Grant, D., Wilcox, D. (2008). Uncorking bottlenecks: a multi-hospital system transforms its culture and
processes to optimize patient flow. Health management technology, 29, 34-5.
Hopp, J.W. and M.L. Spearman (2000). Factory Physics, McGraw-Hill Higher Education, New York.
Imaginis. (2008). What is the difference between outpatient and inpatient medicine? Retrieved May 6, 2012, from http://www.imaginis.com/faq/difference-between-outpatient-and-inpatient-medicine.

Process improvement at the PACU . Laura Hofman
67
Jenkins, J. (2007). Eliminating common PACU delays. Journal of health care information management, 21, 53-8.
Kimberley, J.R. and Zajac, E.J. (2008). Strategic adaptation in health care organisations: implications for theory
and research. Medical Care Review, 42, 267-302.
Leone, G. (2010). The value stream maturity scale: a framework for assessing progress of your lean
health care journey. Retrieved, May 19, 2012, from http://ezinearticles.com/?The-Value-Stream-
Maturity-Scale---A-Framework-for-Assessing-Progress-of-Your-Lean-Health care-
Journey&id=5233821
Lovelle, J. (2011). Mapping the value stream. IIE Solutions, 33, 26-33.
Mahaffey, S. (2004). Optimizing patient flow in enterprise. Health Management Technology, 25, 34.
Montgomery, M. (2011). Patient throughput: technology enabled process improvement. American nurses
credentialing centre: Magnet conference.
Mount Sinai Hospital (2012). Who we are. Retrieved May 5, 2012, from
http://www.mountsinai.on.ca/about_us/who-we-are.
Mount Sinai Hospital (2012). Centres of excellence. Retrieved May 5, 2012, from
http://www.mountsinai.on.ca/about_us/who-we-are/centres.
Mount Sinai Hospital (2012). Fast facts. Retrieved May 5, 2012, from
http://www.mountsinai.on.ca/about_us/who-we-are/fast-facts.
Ohno, T. (1988). Toyota production system: beyond large-scale production. New York: Productivity Press.
Ontario nurses’ association. (2012). Collective Bargaining Agreement. Retrieved June 28, 2012, from http://www.ona.org/documents/File/pdf/cas/hospitals/MountSinaiHospital_March312014.pdf
Parry, G.C., Turner, C.E., (2007). Application of lean visual process management tools. Production Planning &
Control, 17, 77-88.
Reh, J. (2010). How can you manage what you don’t measure? About.com Management. Retrieved June 22, 2012, from http://management.about.com/b/2010/02/09/manage2measure.htm. Sandalini, M. (2009). How to do value stream mapping. Lifetime Reliability Solutions, 1-10. Simon, R.W., Canacari, E.G. (2012). A practical guide to applying lean tools and management principles to
health care improvement projects. Aorn journal, 95, 85-103. Testi, A., Tanfani, E. and Torre, G. (2007). A three-phase approach for operating theatre schedules, Health Care Management Science, 10, 163-72. TPG. (2004). Sneller Beter - De logistiek in de zorg, Eindrapportage TPG, 1-24. Womack, J.P., Jones, D.T. (2003). Lean thinking: banish waste and create wealth in your corporation (2nd ed.).
New York: Free Press, Simon & Schuster.

Process improvement at the PACU . Laura Hofman
68
Appendixes
Appendix A: Plan research project

Process improvement at the PACU . Laura Hofman
69
Appendix B: Patient flow based on patient type

Process improvement at the PACU . Laura Hofman
70
Appendix C: Patient flow based on type of surgery
1 . Total and daily patient arrivals based on the type of surgery in the fiscal year 2011 -2012 Type of
surgery Sunday Monday Tuesday Wednesday Thursday Friday Saturday
Grand
Total
GAST 1 1 1 2 3
4 12
GYNE 25 235 201 165 257 116 43 1042
OBST
2
3 3
8
OPHT 2 221 228 2 150 249 2 854
ORAL 11 7 67 100 81 7 13 286
ORTH 57 358 273 423 400 210 68 1789
OTOL 1 241 145 153 121 122 4 787
PLAS 1 1 11 5 8 325 1 352
SURG 40 221 338 448 280 376 41 1744
THOR
1
1
UROG
23 82 24 16 71 3 219
UROL 4 45 6 141 102 4 1 303
VASC
1 1
Grand
Total 142 1355 1353 1466 1421 1480 181 7398

Process improvement at the PACU . Laura Hofman
71
2. Patient arrivals and departures per hour

Process improvement at the PACU . Laura Hofman
72
Appendix D: Interview PACU manager
Interview with Farah Khan Choudhry June 19, 2012
1. How many FTE's has the PACU?
The PACU has 17.7 FTE of nurses. Of these 17.7 FTE, 11 FTE is full time, 1,1 FTE part time and the remainder
(6.6 FTE) is overtime.
2. Is it possible to work part time in the PACU? Can you shortly describe these rules?
Sure, it is possible to work part time. According to the rules of the Ontario Nurses’ Association it is allowed to
use part timers if there are at least three shifts in a week for part timers of at least 45 hours a week.
3. Is it, according to the rules of the Union, allowed as a nurse to clean a bay?
It is allowed as a nurse to clean the bay. But the end responsibility is for the housekeepers.
4. Is it, according to the rules of the Union, allowed as a porter to clean a bay and as a housekeeper
to porter patients?
It is allowed and we really want to do that because it makes a hybrid effort when they can both do the same
work. We want to schedule porters and housekeepers for 50% for both of the jobs. According to the rules of
the Union, housekeepers are allowed to work 10% of their time as a porter and a porter is allowed to work
10% of their time as a housekeeper. But 10% is very hard to measure. When we ask a housekeeper to porter a
patient, they reject it because they are not porters. To let housekeepers porter a patient is a big problem.
5. I have talked with the resource nurse about the scheduling of nurses every day. I don't know if I
am right and I hope you can correct me if I am wrong; is it right that the PACU schedules every
day the same number of nurses? And does the PACU schedule every day 10 nurses if that is
possible (based on availability and sick employees)?
That’s right, every day we schedule, if it is possible, 10 nurses until 9:00 PM. We also have 3 nurses who work
the evening shifts from 3:00 PM to 11:00 PM. We absolutely need these 3 nurses in the evening. Most of the
time we cannot schedule 10 nurses on a day, since people are sick, are on vacation or other reasons. Then we
use part timers or casual nurses.
6. How does the PACU get paid? Is it a total budget for the whole PACU or based on the rate of
surgical procedures?
We get a total budget every year. This year it is $2,1 million. $1,4 million is for the salary of staff, the
remainder is for travel costs, drug costs, and $50.000 for linen.
7. What are the costs, on average, for a PACU nurse?
The most expensive nurse is $110,000 a year and the least expensive nurse is $85,000 a year.

Process improvement at the PACU . Laura Hofman
73
Appendix E: Workflow PACU
Page 74: Patient undergoes anaesthesia and surgery in the OR
Page 75: Accompany patient into the PACU
Page 76: Record time in, hook patient up to monitoring equipment, information handover
Page 77: Perform vital checks, record information in patient chart
Page 78: Record time ready, look for porter
Page 79: Porter arrives, record time out, clean bay

Process improvement at the PACU . Laura Hofman
74
Ho
spit
alH
osp
ital
Pat
ien
t
War
d c
lerk
PA
CU
Nu
rse
An
aest
hes
iolo
gist
Po
rter
Ho
use
kee
per
OR
Nu
rse
Bed
Ass
ign
men
tIP
Nu
rse
Surg
eon
Undergo anaesthesia
Perform anaesthesia
Perform surgery
Patient awake on OR bed (1)
Code R in effect?
Alert PACU that patient has
finished surgery
Place patient on waiting list
Yes
No
(1)
Receive entrance signal from ward clerk (2)
PACU ready to receive patient
Give entrance signal to OR (2)
To B
To C
To A
Signal event(catching)
Signal event(throwing)

Process improvement at the PACU . Laura Hofman
75
Ho
spit
alH
osp
ital
PA
CU
Nu
rse
Surg
eon
An
aest
hes
iolo
gist
Po
rter
Ho
use
kee
per
OR
Nu
rse
Bed
Ass
ign
men
tIP
Nu
rse
Pat
ien
t
War
d c
lerk
Call OR that OR can bring the
patient
Accompany patient into PACU
bay
Accompany patient to PACU
Wheel patient into PACU bay
Bed assignment
known?
Yes
Give bedassignment (3)
No
From B
From C
Receive bedAssignment (3)
To E
From A To D

Process improvement at the PACU . Laura Hofman
76
H
osp
ital
Ho
spit
alP
atie
nt
War
d c
lerk
PA
CU
nu
rse
Surg
eon
An
aest
hes
iolo
gist
Po
rter
Ho
use
kee
per
OR
Nu
rse
Bed
Ass
ign
men
tIP
Nu
rse
Record ‘time-in’ Provide blanketsInform family to
visit patient
PACU nurse available?
Hook patient up to monitoring
equipment
Hook patient up to monitoring
equipment
Provide verbal report to PACU
nurse
Provide verbal report to PACU
nurse
Provide verbal report to PACU
nurse
Communicate with PACU nurse (6)
From E
1 hour
(4)
Communicate with PACU nurse (4)
Communicate with PACU nurse (5)
(5) (6) To G
From D To F

Process improvement at the PACU . Laura Hofman
77
H
osp
ital
Ho
spit
alP
atie
nt
War
d c
lerk
PA
CU
nu
rse
Surg
eon
An
aest
hes
iolo
gist
Po
rter
Ho
use
kee
per
OR
Nu
rse
Bed
Ass
ign
men
tIP
Nu
rse
Record information on
patient chartFulfill orders
Patient awake and alert (7)
(7)
Perform vitals check and record information in
patient chart
Patient stable?
Perform vitals check, record information in
patient chart
No
Yes
From G
Patient stable To H
To IPACU nurse ready to transfer patient to the nursing unit
From F
Loop terminates till signal is received

Process improvement at the PACU . Laura Hofman
78
H
osp
ital
Ho
spit
alP
atie
nt
Po
rter
Ho
use
kee
per
OR
Nu
rse
Bed
Ass
ign
men
tIP
Nu
rse
War
d c
lerk
PA
CU
Nu
rse
Surg
eon
An
aest
hes
iolo
gist
Record ‘time ready’ on patient
chart
Send bed assignment list to
PACU
Bed assignment list
received?
Call IP-unit
IP-unit ready to receive patient?
No
Yes
Yes
No
Look and ask if PACU porter is
available
No
Yes
PACU porter available?
From H To J
20-15 min. To K
IP unit ready to receive patient
Wait till bed assignment list is received
From I
To L

Process improvement at the PACU . Laura Hofman
79
Ho
spit
alH
osp
ital
Pat
ien
t
Po
rter
Ho
use
kee
per
OR
Nu
rse
Bed
Ass
ign
men
tIP
Nu
rse
War
d c
lerk
PA
CU
nu
rse
Surg
eon
An
aest
hes
iolo
gist
Book porter
Ask/page porter to transfer patient
Go to the bay of the patients that
has to be transferred
Accompany patient to IP-unit
Wheel patient to the IP-unit
Porter arrives
Record ‘time-out’
Clean bay
Look for housekeeper
Leave PACU
From J
From K
(8)
(8)
From L
Ask houskeeper to clean bay (9)
(9)

Process improvement at the PACU . Laura Hofman
80
Appendix F: Discharge criteria list
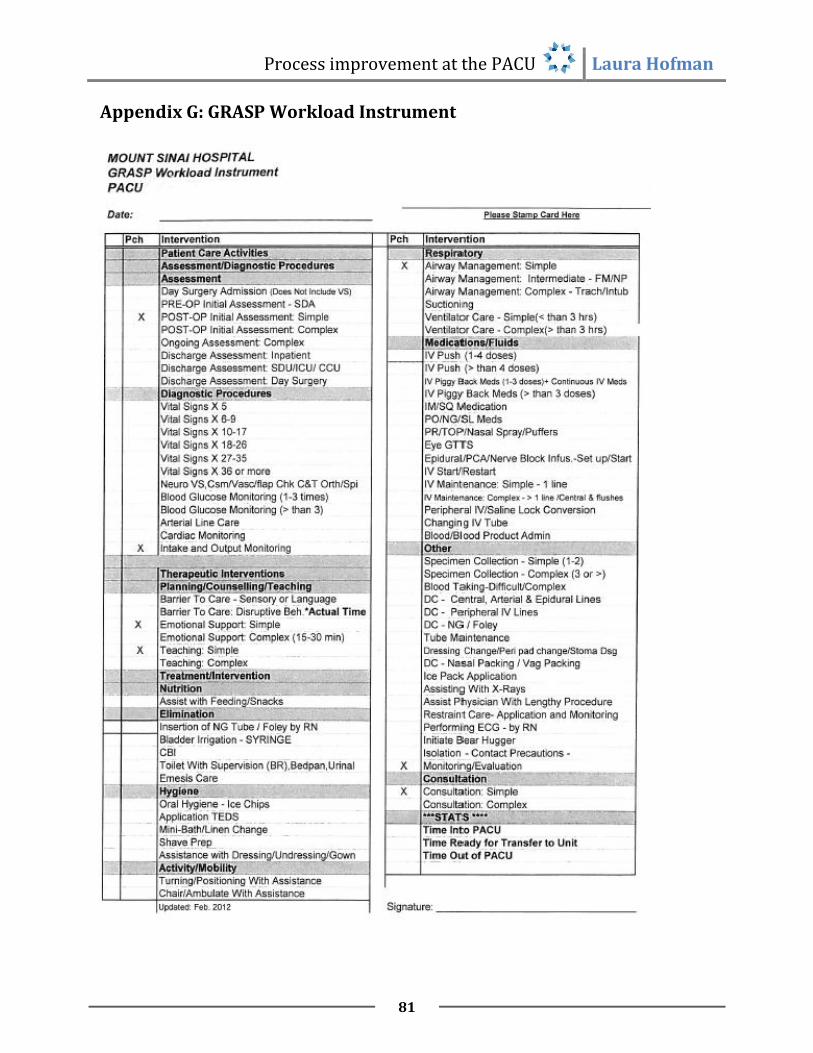
Process improvement at the PACU . Laura Hofman
81
Appendix G: GRASP Workload Instrument
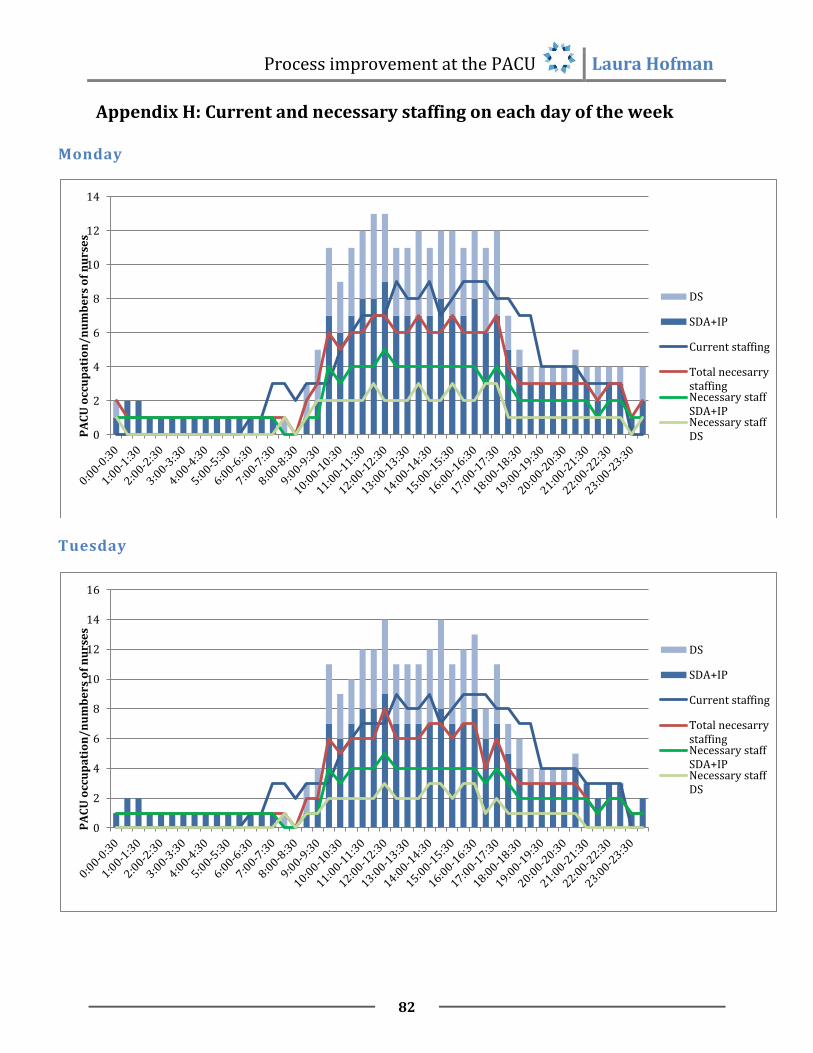
Process improvement at the PACU . Laura Hofman
82
Appendix H: Current and necessary staffing on each day of the week
Monday
Tuesday
0
2
4
6
8
10
12
14
PA
CU
occ
up
ati
on
/n
um
be
rs o
f n
urs
es
DS
SDA+IP
Current staffing
Total necesarrystaffingNecessary staffSDA+IPNecessary staffDS
0
2
4
6
8
10
12
14
16
PA
CU
occ
up
ati
on
/n
um
be
rs o
f n
urs
es
DS
SDA+IP
Current staffing
Total necesarrystaffingNecessary staffSDA+IPNecessary staffDS

Process improvement at the PACU . Laura Hofman
83
Wednesday
Thursday
0
2
4
6
8
10
12
14
16
PA
CU
occ
up
ati
on
/n
um
be
rs o
f n
urs
es
DS
SDA+IP
Current staffing
Total necesarrystaffingNecessary staffSDA+IPNecessary staffDS
0
2
4
6
8
10
12
14
16
PA
CU
occ
up
ati
on
/n
um
be
rs o
f n
urs
es
DS
SDA+IP
Current staffing
Total necesarrystaffingNecessary staffSDA+IPNecessary staffDS

Process improvement at the PACU . Laura Hofman
84
Friday
0
2
4
6
8
10
12
PA
CU
occ
up
ati
on
/n
um
be
rs o
f n
urs
es DS
SDA+IP
Current staffing
Total necesarrystaffingNecessary staffSDA+IPNecessary staffDS

Process improvement at the PACU . Laura Hofman
85
Appendix I: Adapted schedules
Wednesday
Friday
6:00 AM
7:00 AM
8:00 AM
9:00 AM
10:00 AM
11:00 AM
12:00 PM
1:00 PM
2:00 PM
3:00 PM
4:00 PM
5:00 PM
6:00 PM
7:00 PM
8:00 PM
9:00 PM
10:00 PM
11:00 PM
1
2
3
4
5
6
7
8
9
10
11
12
6:00 AM
7:00 AM
8:00 AM
9:00 AM
10:00 AM
11:00 AM
12:00 PM
1:00 PM
2:00 PM
3:00 PM
4:00 PM
5:00 PM
6:00 PM
7:00 PM
8:00 PM
9:00 PM
10:00 PM
11:00 PM
1
2
3
4
5
6
7
8
9
10
11
