the poisson distribution (not in reif’s book). the poisson probability distribution simeon denis...
TRANSCRIPT

The Poisson Distribution(Not in Reif’s book)

The Poisson Probability Distribution
Simeon Denis Poisson • "Researches on the probability
of criminal civil verdicts" 1837 • Looked at the form of the
binomial distribution
When the Number of Trials is Large.
• He derived the cumulative Poisson distribution as the
Limiting case of the Binomial When the Chance of SuccessTends to Zero.
The Poisson Probability Distribution
Simeon Denis Poisson • "Researches on the probability
of criminal civil verdicts" 1837 • Looked at the form of the
binomial distribution
When the Number of Trials is Large.
• He derived the cumulative Poisson distribution as the
Limiting case of the Binomial When the Chance of SuccessTends to Zero. Simeon Denis “Fish”!
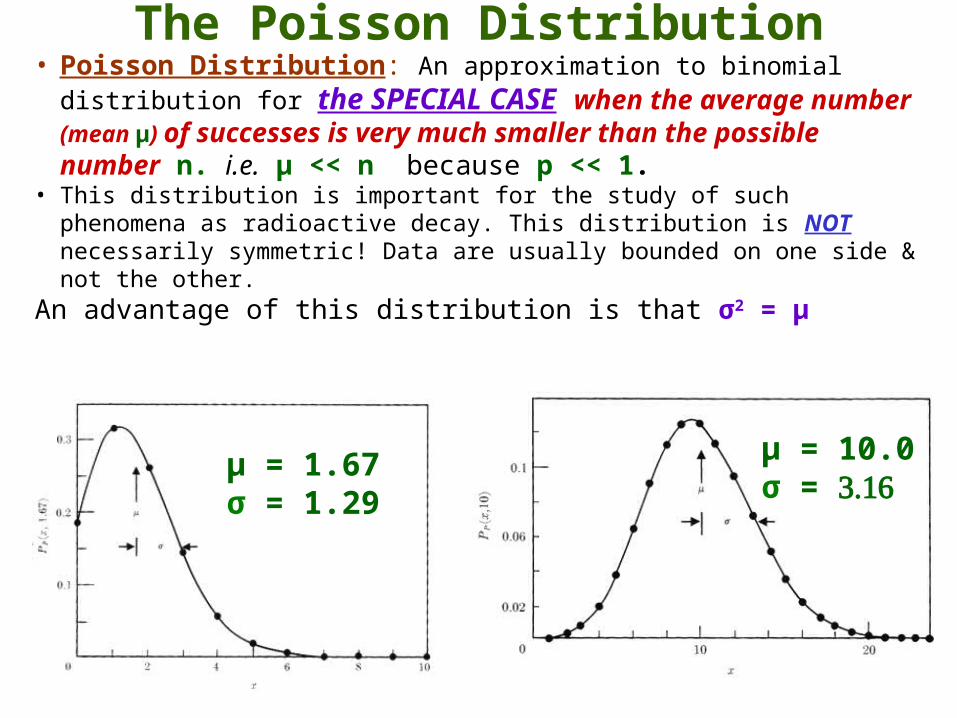
• Poisson Distribution: An approximation to binomial distribution for the SPECIAL CASE when the average number (mean µ) of successes is very much smaller than the possible number n. i.e. µ << n because p << 1.
• This distribution is important for the study of such phenomena as radioactive decay. This distribution is NOT necessarily symmetric! Data are usually bounded on one side & not the other.
An advantage of this distribution is that σ2 = μ
The Poisson Distribution
µ = 1.67σ = 1.29
µ = 10.0σ =
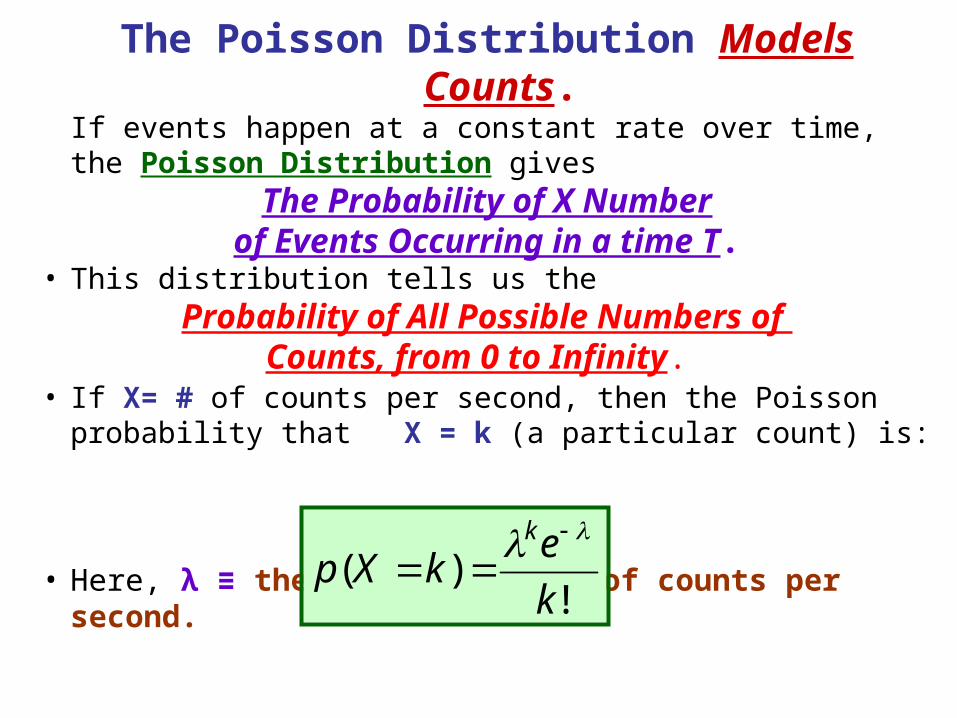
The Poisson Distribution Models Counts.If events happen at a constant rate over time, the Poisson Distribution gives
The Probability of X Numberof Events Occurring in a time T.
• This distribution tells us theProbability of All Possible Numbers of
Counts, from 0 to Infinity. • If X= # of counts per second, then the Poisson
probability that X = k (a particular count) is:
• Here, λ ≡ the average number of counts per second.
!)(
k
ekXp
k
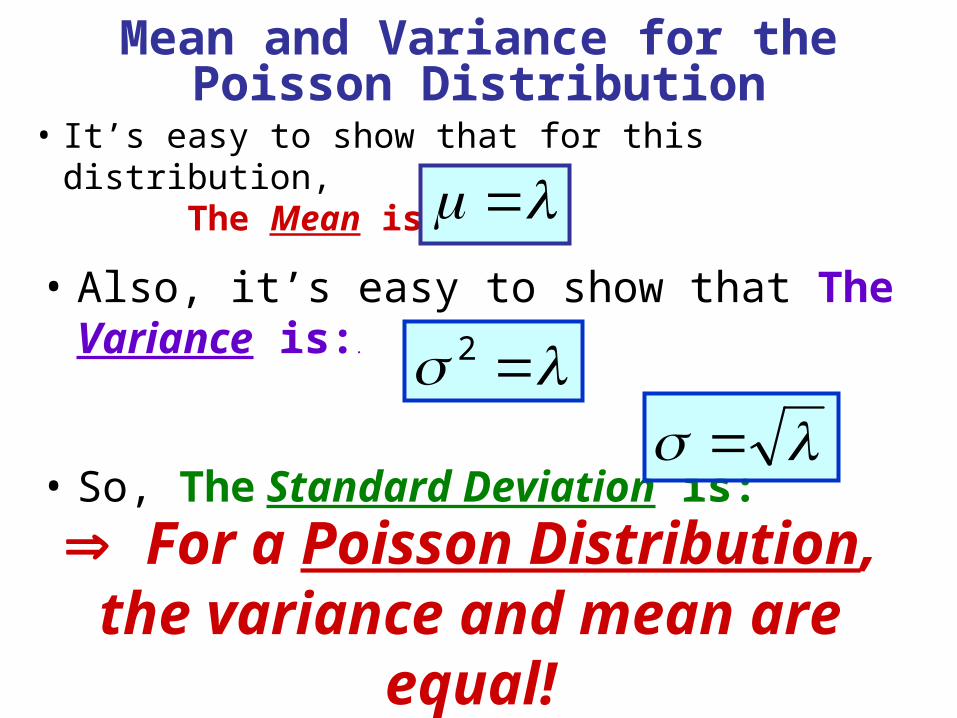
Mean and Variance for thePoisson Distribution
• It’s easy to show that for this distribution, The Mean is:
• Also, it’s easy to show that The Variance is:.
l
L
• So, The Standard Deviation is:
2
For a Poisson Distribution, the variance and mean are equal!
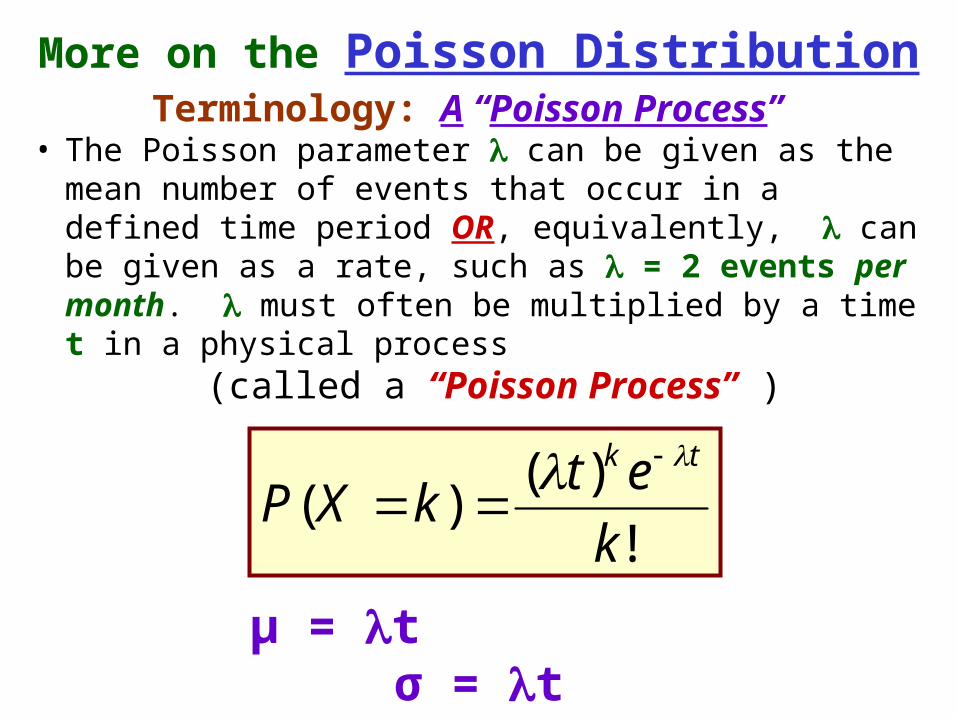
Terminology: A “Poisson Process” • The Poisson parameter can be given as the mean
number of events that occur in a defined time period OR, equivalently, can be given as a rate, such as = 2 events per month. must often be multiplied by a time t in a physical process
(called a “Poisson Process” )
!
)()(
k
etkXP
tk
μ = t σ = t
More on the Poisson Distribution
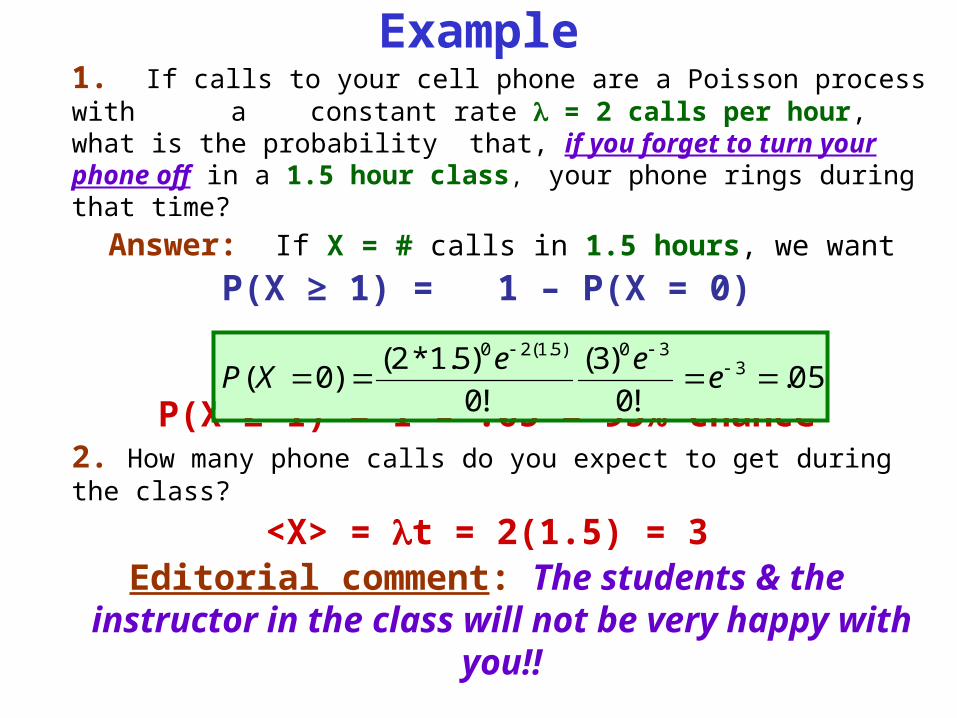
Example1. If calls to your cell phone are a Poisson process with a
constant rate = 2 calls per hour, what is the probability that, if you forget to turn your phone off in a 1.5 hour
class, your phone rings during that time?
Answer: If X = # calls in 1.5 hours, we want
P(X ≥ 1) = 1 – P(X = 0)
P(X ≥ 1) = 1 – .05 = 95% chance2. How many phone calls do you expect to get during the class?
<X> = t = 2(1.5) = 3Editorial comment: The students & the instructor
in the class will not be very happy with you!!
05.!0
)3(
!0
)5.1*2()0( 3
30)5.1(20
eee
XP
9
Conditions Requiredfor the
Poisson Distribution to hold:l
1. The rate is a constant, independent of time.
2. Two events never occur at exactly the same time.
3. Each event is independent. That is, the occurrence of one event does not make the next event more or less likely to happen.
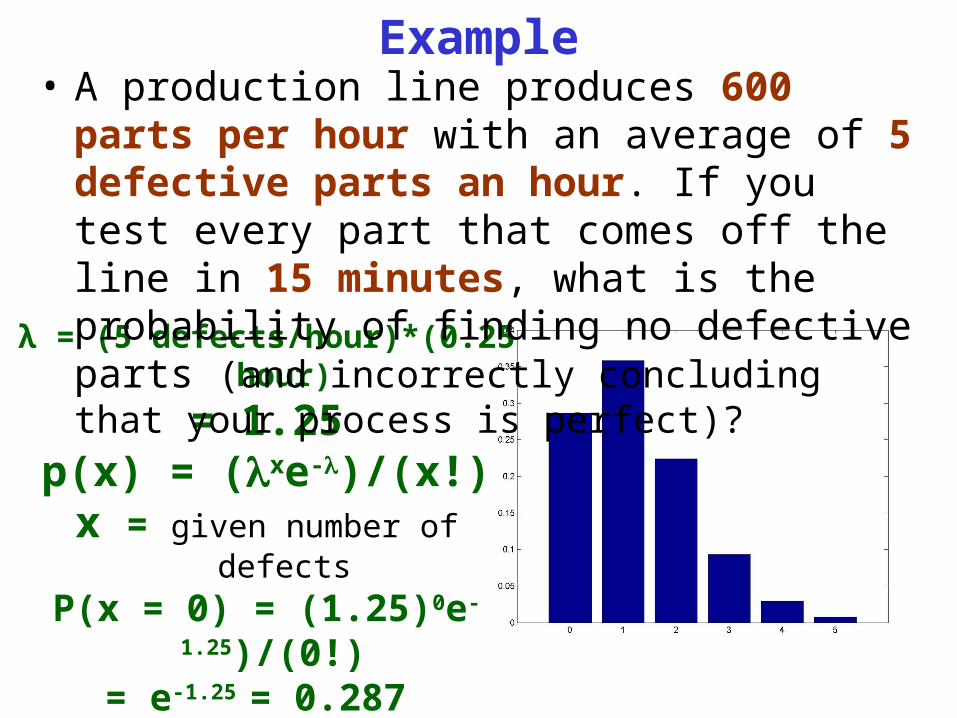
Example
λ = (5 defects/hour)*(0.25 hour)
= 1.25p(x) = (xe-)/(x!)
x = given number of defects
P(x = 0) = (1.25)0e-1.25)/(0!) = e-1.25 = 0.287
= 28.7%
• A production line produces 600 parts per hour with an average of 5 defective parts an hour. If you test every part that comes off the line in 15 minutes, what is the probability of finding no defective parts (and incorrectly concluding that your process is perfect)?

0
0.05
0.1
0.15
0.2
0.25
0.3
0.35
0.4
Pro
babi
lity
0.0 1.0 2.0 3.0 4.0 5.0 6.0 7.0
m
binomialpoisson
N=10,p=0.1
0
0.1
0.2
0.3
0.4
0.5
Pro
babili
ty
0 1 2 3 4 5m
poissonbinomial
N=3, p=1/3
Comparison of Binomial & Poisson Distributions with Mean μ = 1
Clearly, there is not much difference between them!
For N Large & m Fixed:Binomial Poisson
N N

Poisson Distribution: As λ (Average # Counts) gets large, this also approaches a Gaussian
l
λ = 5 λ = 15
λ = 25 λ = 35