the place of statistics in the study of growth and form
TRANSCRIPT

The Place of Statistics in the Study of Growth and FormAuthor(s): F. YatesSource: Proceedings of the Royal Society of London. Series B, Biological Sciences, Vol. 137, No.889 (Nov. 28, 1950), pp. 479-488Published by: The Royal SocietyStable URL: http://www.jstor.org/stable/82601 .
Accessed: 06/05/2014 08:15
Your use of the JSTOR archive indicates your acceptance of the Terms & Conditions of Use, available at .http://www.jstor.org/page/info/about/policies/terms.jsp
.JSTOR is a not-for-profit service that helps scholars, researchers, and students discover, use, and build upon a wide range ofcontent in a trusted digital archive. We use information technology and tools to increase productivity and facilitate new formsof scholarship. For more information about JSTOR, please contact [email protected].
.
The Royal Society is collaborating with JSTOR to digitize, preserve and extend access to Proceedings of theRoyal Society of London. Series B, Biological Sciences.
http://www.jstor.org
This content downloaded from 194.29.185.211 on Tue, 6 May 2014 08:15:47 AMAll use subject to JSTOR Terms and Conditions
A discussion on the measurement of growth and form A discussion on the measurement of growth and form
analysis such as that made use of by Huxley. This does not mean that it is a 'better' method. A method is good or bad as it presents more or less lucidly and directly information of the type which we want to extract from the data. If we were
specifically interested in the relationship between leg length and body length, say to provide information relevant to a study of nerve regeneration, or to guide a manufacturer in the design of armchairs or trousers, or because we were con- cerned with the hydrostatic shortcomings of the vascular supply of the feet of
very tall men, then it would clearly be unnecessary, and therefore a waste of time, to undertake a complete Thompsonian analysis.
I should like to conclude by calling attention to a very important shortcoming of the 'method of transformations '-or, rather, to a class of problems which might be expected to lie within its ambit of competence, but which in fact does not. The functions that determine the rules by which old variables are replaced by new are allowed a wide range of latitude, but beyond one limit they may not trespass: the functions must be continuous and must be single-valued both ways, i.e. must establish a one-to-one correspondence between the points of the new figure and the old. The effect of this restriction is to confine the use of the method to the com-
parison of forms which are of the same order of complexity, i.e. roughly speaking to forms which are derivable one from another by plastic deformation, however
grotesque or extreme it may be. In technical language, the forms that are to be
compared must be homeomorphic. It is unfortunately true that many of the most
interesting transformations of development do involve changes in order of com-
plexity: a frog's embryo that has produced a new closed body space by the splitting of a formerly single-layered sheet of mesoderm has increased :in order of complexity. Such changes are outside the competence of the method of transformations. From time to time new methods for describing change of complexity have been suggested, but they do appear to have had a fruitful outcome.
THE PLACE OF STATISTICS IN THE STUDY OF GROWTH AND FORM
BY F. YATES, F.R.S., Rothamsted Experimental Station, Harpenden, Herts
Much of the statistical work involved in the study of growth and form consists of the fitting of some mathematical relation to the observed data. This fitting may be carried out with a number of rather different purposes in view, which may be classified as follows:
(a) descriptive, as, for example, when a table of values is replaced by a simple equation;
(b) for the purpose of smoothing data; (c) to enable objective comparisons to be made between groups of data, similar
curves being fitted to the different groups; (d) to test whether some mathematical relation derived from other considerations
is confirmed by the data; (e) in an attempt to obtain an indication of the underlying physical laws.
479 479
This content downloaded from 194.29.185.211 on Tue, 6 May 2014 08:15:47 AMAll use subject to JSTOR Terms and Conditions
S. Zuckerman and others
These objectives are not mutually exclusive, but the types of relation and the statistical procedures that are appropriate differ somewhat in the different cases.
Three different steps are involved in the fitting process. The first consists of the choice of the type of relation, the second is the estimation of the values of the
parameters which enter into the equation representing the chosen relation, and the third is the testing of the agreement of the fitted curve with the original data.
In cases (d) or (e) above, the choice of relation is not a statistical matter-if a relation given a priori requires to be tested this must be fitted, if an indication of the underlying physical law is required relations which can bear a physical interpretation must be chosen. Thus a polynomial curve, though mathematically simple, is not usually capable of any simple physical interpretation. At best it can be regarded as an approximation, over the range of the observations, to some more
complicated relation. In cases (a), (b) and (c), on the other hand, the choice is governed by convenience
of fitting, and by the need for a relation which fits the data with sufficient accuracy for the purpose in hand. These are statistical matters. The question of convenience of fitting is an important one statistically because a convenient method will be used far more extensively than will a method which requires elaborate and tedious calculations. It is one of the advantages of the allometric equation that it is easily fitted by transformation of both sets of measurements to logarithms.
Once the type of curve has been decided, the efficient estimation of the values of the parameter, and the testing of the goodness of fit, can be dealt with by known statistical theory, though the fitting of many types of curve presents difficulties both of theory and of computational procedure. If we have knowledge of, or
hypotheses concerning, the underlying physical laws, the values of the parameters determined by the fitting will provide estimates of the undetermined physical constants, and the tests of goodness of fit can be taken as tests of the correctness of the assumed laws.
Adequacy of fit does not, however, give any definite evidence that the under-
lying physical laws are of the type represented by the relation. This is obvious in the case of empirical relations, such as polynomials, but is true also of relations based on physical laws. Such laws are only confirmed within the limits of error of the observations. Inaccurate or fragmentary observations are often taken as confirmation of a law from which more accurate and extensive data subsequently reveal significant deviations.
For comparative purposes, such as are required when the growth and form of different species have to be contrasted, and in experimental work, empirical relations are usually satisfactory, even when the fit is by no means perfect. Provided the same form of equation is fitted to different animals or groups which it is desired shall be compared, failure to fit perfectly may well be of little con-
sequence, since the resulting inaccuracies affect each of the groups similarly. Simple types of curve, such as polynomials, which are easy to fit, are of great value in this type of work. In some sampling measurements on the growth of
wheat, for example, which were carried out on replicated plots sown to a pair of varieties at different centres over a number of years, the maximum growth rate
480
This content downloaded from 194.29.185.211 on Tue, 6 May 2014 08:15:47 AMAll use subject to JSTOR Terms and Conditions
A discussion on the measurement of growth and form 481
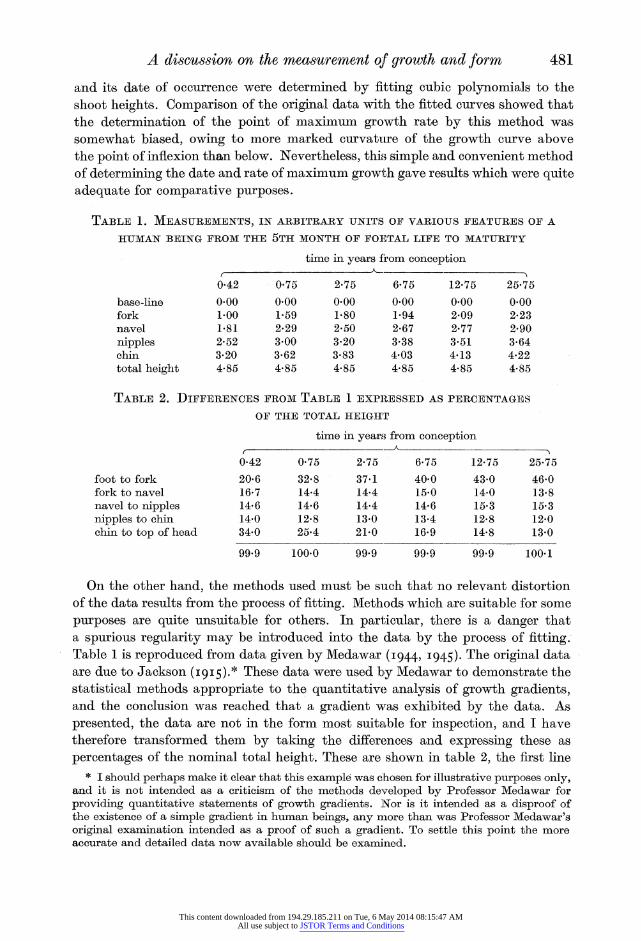
and its date of occurrence were determined by fitting cubic polynomials to the shoot heights. Comparison of the original data with the fitted curves showed that the determination of the point of maximum growth rate by this method was somewhat biased, owing to more marked curvature of the growth curve above the point of inflexion than below. Nevertheless, this simple and convenient method of determining the date and rate of maximum growth gave results which were quite adequate for comparative purposes.
TABLE 1. MEASUREMENTS, IN ARBITRARY UNITS OF VARIOUS FEATURES OF A
HUMAN BEING FROM THE 5TH MONTH OF FOETAL LIFE TO MATURITY
time in years from conception
0-42 0-75 2.75 6.75 12-75 25-75 base-line 0.00 0.00 0-00 0.00 0-00 0.00 fork 1.00 1-59 1.80 1.94 2.09 2.23 navel 1.81 2.29 2.50 2.67 2.77 2.90
nipples 2.52 3.00 3.20 3.38 3.51 3.64 chin 3.20 3.62 3-83 4-03 4-13 4-22 total height 4-85 4.85 4-85 4-85 4.85 4.85
TABLE 2. DIFFERENCES FROM TABLE 1 EXPRESSED AS PERCENTAGES
OF THE TOTAL HEIGHT
time in years from conception f -'~~~~~
foot to fork fork to navel navel to nipples nipples to chin chin to top of head
0-42 0-75 275 6-75 12-75 25-75
20-6 32-8 37-1 40-0 43-0 46*0 16-7 14-4 14-4 15-0 14-0 13-8 14-6 14-6 14-4 14-6 15-3 15-3 14-0 12-8 13-0 13-4 12-8 12-0 34-0 25-4 21-0 16-9 14-8 13-0
99.9 100.0 99*9 99*9 99'9 100-1
On the other hand, the methods used must be such that no relevant distortion of the data results from the process of fitting. Methods which are suitable for some
purposes are quite unsuitable for others. In particular, there is a danger that a spurious regularity may be introduced into the data by the process of fitting. Table 1 is reproduced from data given by Medawar (I944, I945). The original data are due to Jackson (I915).* These data were used by Medawar to demonstrate the statistical methods appropriate to the quantitative analysis of growth gradients, and the conclusion was reached that a gradient was exhibited by the data. As
presented, the data are not in the form most suitable for inspection, and I have therefore transformed them by taking the differences and expressing these as
percentages of the nominal total height. These are shown in table 2, the first line * I should perhaps make it clear that this example was chosen for illustrative purposes only,
and it is not intended as a criticism of the methods developed by Professor Medawar for providing quantitative statements of growth gradients. Nor is it intended as a disproof of the existence of a simple gradient in human beings, any more than was Professor Medawar's original examination intended as a proof of such a gradient. To settle this point the more accurate and detailed data now available should be examined.
This content downloaded from 194.29.185.211 on Tue, 6 May 2014 08:15:47 AMAll use subject to JSTOR Terms and Conditions
S. Zuckerman and others
of which, for example, indicates the percentage of the total height contributed by the legs (from foot to fork) at various ages.
It is immediately clear from inspection of these percentages that the main relative growth features are the steadily increasing proportion of the total length contributed by the legs, and the decreasing proportion contributed by the head. Subsequent to birth there is very little change in the other three percentages, but
during the pre-natal period there is a fall in the fork-to-navel percentage. If a growth gradient existed the change in this percentage should be intermediate between the changes in the first and third percentages, i.e. it should show a rise. As far as the trunk is concerned, therefore, the gradient hypothesis is not supported by the data, which in fact indicate that the whole of the trunk grows at approxi- mately the same rate. The gradient was 'read into' the data by the fitting of
polynomials to the joint plots of column 1 of table 1 (x co-ordinates) against each of the other columns in turn (y co-ordinates). In his original paper Medawar himself observes that the points representing the fork show consistent deviations from these polynomials.
Another example of distortion of the data resulting from faulty statistical
processes, which has already been mentioned by Medawar in the present discussion, is that which results from taking the mean of the growth curves of a number of individuals. Such a mean growth curve is perfectly adequate for determining the size distribution of individuals at successive ages, or the mean growth curve of the
population in the aggregate, and similar purposes. For such purposes, provided the average growth curve is not changing with time, it is immaterial whether the data relate to successive measurements on the same group of individuals, or to simultaneous measurements on groups of individuals of differing ages. The
important requirement is that the sample shall be sufficiently large to determine the required means with adequate accuracy, either directly or after smoothing the data by the fitting of suitable curves.
If, on the other hand, the growth of individuals requires to be studied such mean curves are entirely misleading. Thus if there is a sudden change in growth rate, say at the onset of puberty, and this onset occurs at different ages in different individuals, a growth curve constructed by averaging all individuals of a given age will not show a sudden change, but only a smooth transition from one growth rate to the other. The sudden change and its different ages of onset can best be
brought out by the study of growth curves of different individuals. For this we
require consecutive observations on the same individuals. Individual growth curves can then be fitted and the characteristics of these curves summarized.
If such observations are impossible little can be done unless some indication of the stage of growth reached by the individual is available. If, for example, the onset of puberty can be determined by some physical characteristic, the data can be classified according to this characteristic.
The purposes for which the fitted curves are required not only affect the choice of curve, but also the process of fitting. In particular, it is important to see that, when the fitting is used to estimate the values of undetermined physical constants, biases are not introduced into the estimated parameters. The case of a linear
482
This content downloaded from 194.29.185.211 on Tue, 6 May 2014 08:15:47 AMAll use subject to JSTOR Terms and Conditions
A discussion on the measurement of growth and form 483
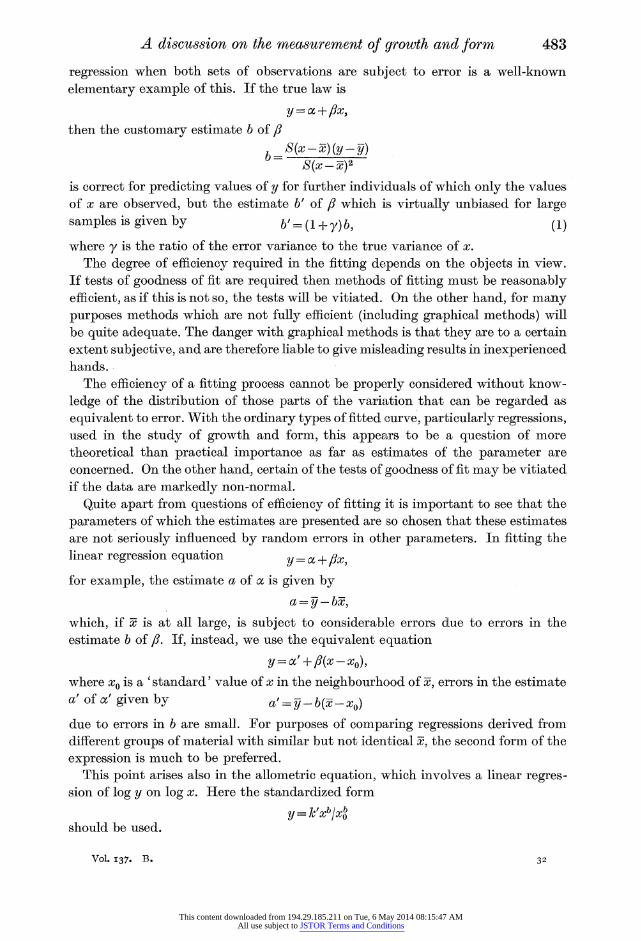
regression when both sets of observations are subject to error is a well-known
elementary example of this. If the true law is
y = c + fx, then the customary estimate b of fi
S(x-x)(y-y) S(x - )2
is correct for predicting values of y for further individuals of which only the values of x are observed, but the estimate b' of f/ which is virtually unbiased for large samples is given by b' = (1 +y)b, (1) where y is the ratio of the error variance to the true variance of x.
The degree of efficiency required in the fitting depends on the objects in view. If tests of goodness of fit are required then methods of fitting must be reasonably efficient, as if this is not so, the tests will be vitiated. On the other hand, for many purposes methods which are not fully efficient (including graphical methods) will be quite adequate. The danger with graphical methods is that they are to a certain extent subjective, and are therefore liable to give misleading results in inexperienced hands.
The efficiency of a fitting process cannot be properly considered without know-
ledge of the distribution of those parts of the variation that can be regarded as
equivalent to error. With the ordinary types of fitted curve, particularly regressions, used in the study of growth and form, this appears to be a question of more theoretical than practical importance as far as estimates of the parameter are concerned. On the other hand, certain of the tests of goodness of fit may be vitiated if the data are markedly non-normal.
Quite apart from questions of efficiency of fitting it is important to see that the
parameters of which the estimates are presented are so chosen that these estimates are not seriously influenced by random errors in other parameters. In fitting the linear regression equation =a + ix,
for example, the estimate a of a is given by a = -bx,
which, if x is at all large, is subject to considerable errors due to errors in the estimate b of f. If, instead, we use the equivalent equation
y = c' + P(x- x),
where x0 is a 'standard' value of x in the neighbourhood of x, errors in the estimate a' of a' given by a' = -b(x- x)
due to errors in b are small. For purposes of comparing regressions derived from different groups of material with similar but not identical x, the second form of the
expression is much to be preferred. This point arises also in the allometric equation, which involves a linear regres-
sion of log y on log x. Here the standardized form
y = k'xb/xob should be used.
Vol. I37. B. 32
This content downloaded from 194.29.185.211 on Tue, 6 May 2014 08:15:47 AMAll use subject to JSTOR Terms and Conditions
S. Zuckerman and others
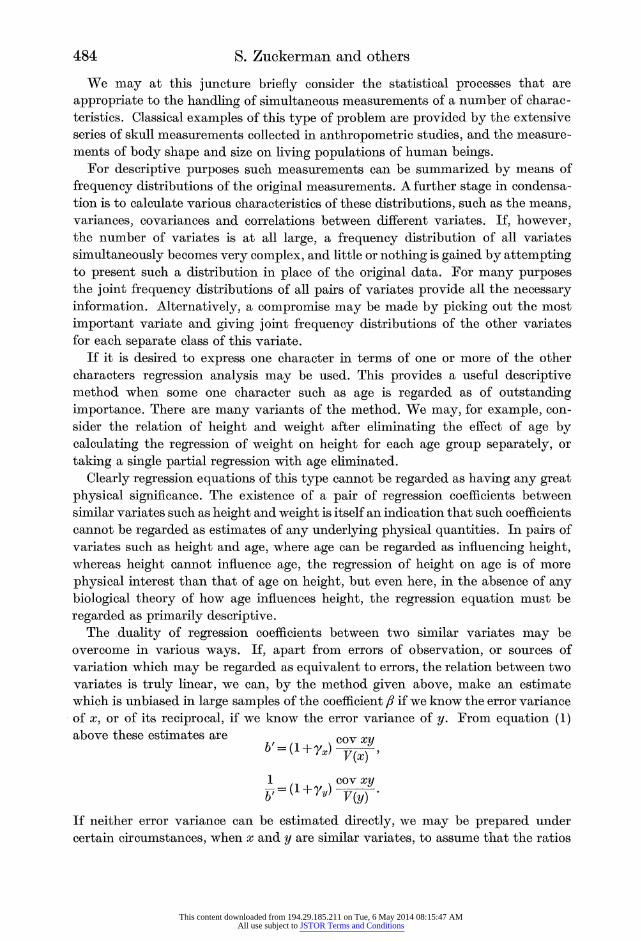
We may at this juncture briefly consider the statistical processes that are
appropriate to the handling of simultaneous measurements of a number of charac- teristics. Classical examples of this type of problem are provided by the extensive series of skull measurements collected in anthropometric studies, and the measure- ments of body shape and size on living populations of human beings.
For descriptive purposes such measurements can be summarized by means of
frequency distributions of the original measurements. A further stage in condensa- tion is to calculate various characteristics of these distributions, such as the means, variances, covariances and correlations between different variates. If, however, the number of variates is at all large, a frequency distribution of all variates
simultaneously becomes very complex, and little or nothing is gained by attempting to present such a distribution in place of the original data. For many purposes the joint frequency distributions of all pairs of variates provide all the necessary information. Alternatively, a compromise may be made by picking out the most
important variate and giving joint frequency distributions of the other variates for each separate class of this variate.
If it is desired to express one character in terms of one or more of the other characters regression analysis may be used. This provides a useful descriptive method when some one character such as age is regarded as of outstanding importance. There are many variants of the method. We may, for example, con- sider the relation of height and weight after eliminating the effect of age by calculating the regression of weight on height for each age group separately, or
taking a single partial regression with age eliminated.
Clearly regression equations of this type cannot be regarded as having any great physical significance. The existence of a pair of regression coefficients between similar variates such as height and weight is itself an indication that such coefficients cannot be regarded as estimates of any underlying physical quantities. In pairs of variates such as height and age, where age can be regarded as influencing height, whereas height cannot influence age, the regression of height on age is of more
physical interest than that of age on height, but even here, in the absence of any biological theory of how age influences height, the regression equation must be
regarded as primarily descriptive. The duality of regression coefficients between two similar variates may be
overcome in various ways. If, apart from errors of observation, or sources of variation which may be regarded as equivalent to errors, the relation between two variates is truly linear, we can, by the method given above, make an estimate which is unbiased in large samples of the coefficient , if we know the error variance of x, or of its reciprocal, if we know the error variance of y. From equation (1) above these estimates are coy xy
1 (l+ coy) V(x)y
1 , coy xy b'+(l+y) V(y)
If neither error variance can be estimated directly, we may be prepared under certain circumstances, when x and y are similar variates, to assume that the ratios
484
This content downloaded from 194.29.185.211 on Tue, 6 May 2014 08:15:47 AMAll use subject to JSTOR Terms and Conditions

A discussion on the measurement of growth and form
of the error variances to the true variances are equal, i.e. that yx-=y,. In this case we have the combined estimate
(2) b' = V(Y) = b. (2) V(X) b^ y
It would be foolish to use this estimate, however, unless yx and y, are both small, which will only occur if the correlation coefficient is nearly + 1. The two regression lines will then be nearly coincident, with by,. nearly equal to 1/bx.y.
Alternatively, a line may be chosen such that the sum of the squares of the
perpendicular distances from this line of the points representing the observations is minimum. This is, in fact, the line passing through the centroid of these points whose slope is one of the roots of the equation
A2 coV xy + A{ V(x) - V(y) - cov xy = 0.
This line is coincident with that given by equation (2) if r= + 1, or V(x) = V(y). A measure of the closeness of association between two variates is provided by
the correlation coefficient, and the effects of other variates can be eliminated by the use of partial correlation. Correlation analysis, however, has proved to be of limited use, and is generally less informative than regression analysis.
In addition to its descriptive function a regression equation also has the much more concrete function of providing an equation by means of which knowledge of one or more characters can be used to predict the most likely value of another character. The success of the prediction depends on the closeness of the relation between the different characters. There must, of course, be a basic set of measure- ments in which both characters are measured and from which the relationship can be established. Equally important, we must be confident that these measurements are carried out on material comparable to that on which a prediction is required. Thus, if the body form of human beings is established by a series of carefully conducted measurements on a more or less random sample, the distribution of these measurements on further groups of human beings can be predicted from key measurements such as weight and height, provided we are satisfied that the new
group does not differ appreciably from the original population in the relation to
weight and height of the measurements in which we are interested, even though the actual distribution of weight and height in the subgroup is somewhat different.
Suppositions of this kind are clearly unlikely to be absolutely true, but may be
sufficiently close to the truth for practical purposes. The intrinsic relationships between a set of multiple measurements, in so far as
they are linear, can be embodied in the matrix of variances and covariances, from which the correlation matrix can be immediately deduced. A correlation matrix, however, is singularly uninformative, and various forms of multivariate analysis have been devised in an endeavour to determine the influences that give rise to the observed correlations. The general principle is to see if the measurements can be represented as linear functions of a set of factors, each factor having a different value for each individual. Obviously this form of representation is only of interest if the number of factors is substantially less than the number of measurements.
32-2
485
This content downloaded from 194.29.185.211 on Tue, 6 May 2014 08:15:47 AMAll use subject to JSTOR Terms and Conditions
S. Zuckerman and others
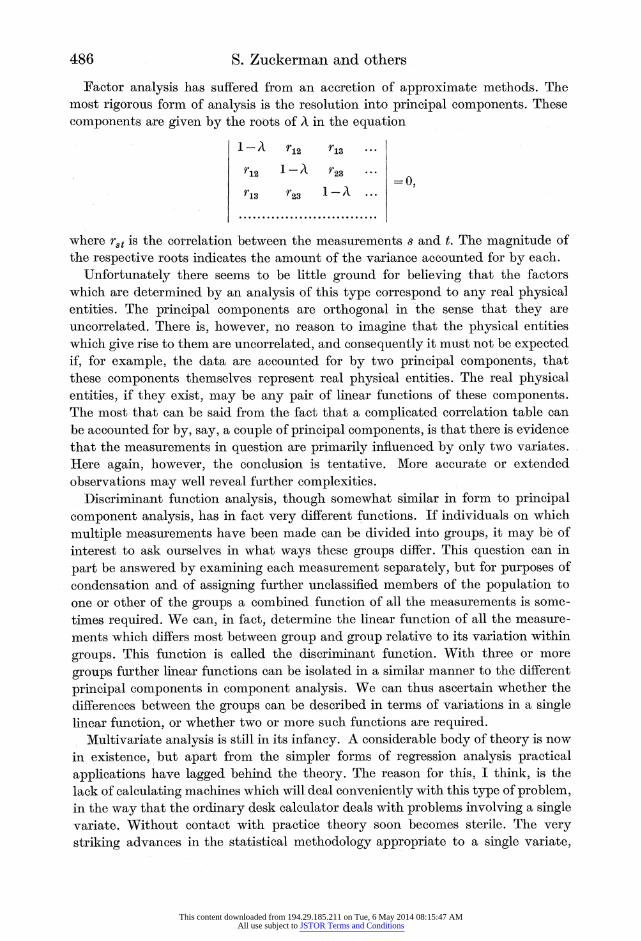
Factor analysis has suffered from an accretion of approximate methods. The most rigorous form of analysis is the resolution into principal components. These
components are given by the roots of A in the equation
1-A r r3 ...
r12 1-A r23 **
r13 r3 1- ...
where rst is the correlation between the measurements s and t. The magnitude of the respective roots indicates the amount of the variance accounted for by each.
Unfortunately there seems to be little ground for believing that the factors which are determined by an analysis of this type correspond to any real physical entities. The principal components are orthogonal in the sense that they are uncorrelated. There is, however, no reason to imagine that the physical entities which give rise to them are uncorrelated, and consequently it must not be expected if, for example, the data are accounted for by two principal components, that these components themselves represent real physical entities. The real physical entities, if they exist, may be any pair of linear functions of these components. The most that can be said from the fact that a complicated correlation table can be accounted for by, say, a couple of principal components, is that there is evidence that the measurements in question are primarily influenced by only two variates. Here again, however, the conclusion is tentative. More accurate or extended observations may well reveal further complexities.
Discriminant function analysis, though somewhat similar in form to principal component analysis, has in fact very different functions. If individuals on which
multiple measurements have been made can be divided into groups, it may be of interest to ask ourselves in what ways these groups differ. This question can in
part be answered by examining each measurement separately, but for purposes of condensation and of assigning further unclassified members of the population to one or other of the groups a combined function of all the measurements is some- times required. We can, in fact, determine the linear function of all the measure- ments which differs most between group and group relative to its variation within
groups. This function is called the discriminant function. With three or more
groups further linear functions can be isolated in a similar manner to the different
principal components in component analysis. We can thus ascertain whether the differences between the groups can be described in terms of variations in a single linear function, or whether two or more such functions are required.
Multivariate analysis is still in its infancy. A considerable body of theory is now in existence, but apart from the simpler forms of regression analysis practical applications have lagged behind the theory. The reason for this, I think, is the lack of calculating machines which will deal conveniently with this type of problem, in the way that the ordinary desk calculator deals with problems involving a single variate. Without contact with practice theory soon becomes sterile. The very striking advances in the statistical methodology appropriate to a single variate,
486
This content downloaded from 194.29.185.211 on Tue, 6 May 2014 08:15:47 AMAll use subject to JSTOR Terms and Conditions
A discussion on the measurement of growth and form
governing the fields of analysis of variance, tests of significance, sampling errors, design of experiments etc., appear to be attributable not simply to the develop- ment of the relevant theory, but to the continued interaction between theory and
practice that has resulted from the routine use of desk calculators of the modern
type. There seems every reason to expect that the modern developments in
punched card machines and electronic calculators will lead to similar progress in the multivariate field.
At the beginning of this paper, I stated that one of the purposes in the fitting of mathematical relations was to obtain an indication of the underlying physical laws. In concluding, I should perhaps make it clear that I do not personally consider that this line of attack is likely to prove very fruitful, owing to the com-
plexity of the phenomena involved, and particularly owing to genetical and
evolutionary considerations. From what we now know of genetics and evolution it seems certain that the size and form of the adults of many species are very closely controlled by selective influences. It is characteristic of such influences that when a change results in a selective advantage, any means by which this
change can be brought about, however apparently complicated, may become
incorporated in the species. In other words, in such species the actual controls
governing the final size and form are likely to be a complicated jumble of detailed controls superimposed on one another, conditioned in large part by historic
evolutionary development, rather than a simple and orderly set of controls such as might be arrived at by designing the organism completely afresh to a given specification. The embryonic development of human beings, for example, provides striking illustration of how persistent these historical factors can be.
Selective influences will, of course, also operate on growing organisms, but for
many species the total period spent in any one stage of growth is very considerably less than that spent in the adult form. A greater or less degree of protection is also often extended to the young by their parents. Consequently in such species selective influences on the young are likely to be less potent, and we may expect to find less perfect balance between the different parts of an organism during the
development stages than exists in the final adult. The form of the newly born organism, moreover, is likely to be very different
from that of the adult, since the size and shape of the different parts of the organism must be such that development in the confined space of the egg or the womb is
possible. The proportions necessary for survival in the very young may also be
very different from those in the adult form. In species in which the young are protected, therefore, growth may be looked
on as a developmental process of which the most important characteristic, from the point of view of survival, is that a given adult form shall be reached. The transition from the initial form of the newly born organism to the adult form may be governed by the somewhat general control mechanisms that are implicit in allometric relations and growth gradients, but other types of control mechanism which give the same end-results and do not lead to too violent disharmonies of form during growth will be equally satisfactory from the functional point of view. The data quoted above for human beings indicate such an alternative type of
487
This content downloaded from 194.29.185.211 on Tue, 6 May 2014 08:15:47 AMAll use subject to JSTOR Terms and Conditions
S. Zuckerman and others S. Zuckerman and others
control mechanism where the whole of the trunk appears to be growing isometrically at a different rate from the head, and from the legs. Thus the head, trunk and legs may be allometrically related (or approximately so), but without a smooth growth gradient extending over the whole body.
Another example of the complex nature of the genetical controls of growth and form is provided by Waddington's account in the present discussion of his studies of the growth of wings in Drosophila.
It seems to me improbable that any purely statistical approach will throw much
light on the underlying laws and control mechanisms that govern such complex phenomena. The proper role of statistics appears to be the much humbler but still vital one of isolating the salient features of the multiple measurements that
represent growth and form, so that their interrelations with other factors can be
appreciated. The study of other branches of science should reveal why organisms have the forms they actually have-aerodynamics, for example, already provides explanations for many of the details of bird form. Elucidation of the ways in which
growth is controlled so as to reach this form requires an experimental approach in
conjunction with other biological sciences, particularly biochemistry and genetics. Finally, it should be emphasized that, whatever the form of condensation, or
statistical analysis, the summarized information, though adequate for the purpose of the original investigation, may not be an adequate substitute for the original data, if these data are subsequently required for other purposes. It is therefore
important to take steps to preserve sets of measurements which are likely to be of
general and continued interest. In cases in which the measurements are too extensive for publication in full, copies of the original data, or the original data themselves, should be filed so that they are available to other interested workers, as for example, in the archives established at the suggestion of the Committee on Biological Measurements of the British Association at the British Museum
(Natural History) at South Kensington, or in the similar archives at the Royal Society of Edinburgh (British Association I935). If the data have been analyzed by means of punched cards, a set of these cards should be preserved (new sets can
easily be made from the original cards). At present there do not appear to be any central storage facilities available for this purpose.
THIE ACCURACY OF GROWTH CURVES
BY J. B. S. HALDANE, F.R.S., Department of Biometry,
University College, London
Most of the estimates of allometry in the literature are based on the regression of one variate on another. This is perhaps justifiable when body weight is taken as the independent variate, the weight of a small organ as the dependent one. It is
certainly unjustified when, for example, the length and breadth of the same
organism or organ are compared. The problem at issue is what line or curve
488 488
This content downloaded from 194.29.185.211 on Tue, 6 May 2014 08:15:47 AMAll use subject to JSTOR Terms and Conditions