the philippine it-bpm industry outlook & prospects · growth projections by 3% ... bpo...
TRANSCRIPT
The PhilippineIT-BPM IndustryOutlook & Prospects
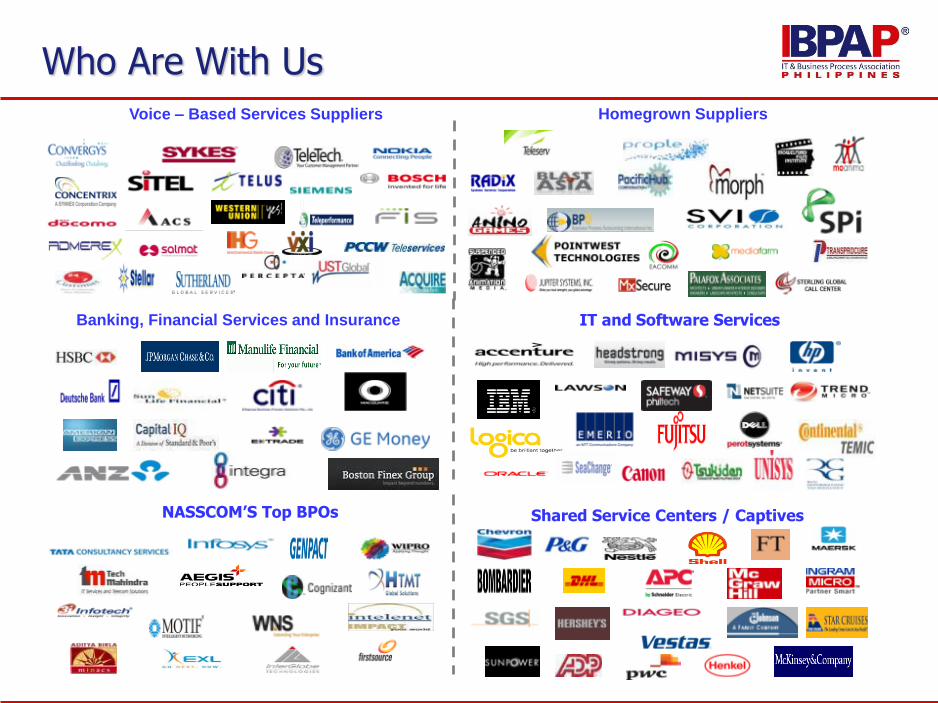
Voice – Based Services Suppliers Homegrown Suppliers
Banking, Financial Services and Insurance IT and Software Services
NASSCOM’S Top BPOs Shared Service Centers / Captives
Who Are With Us
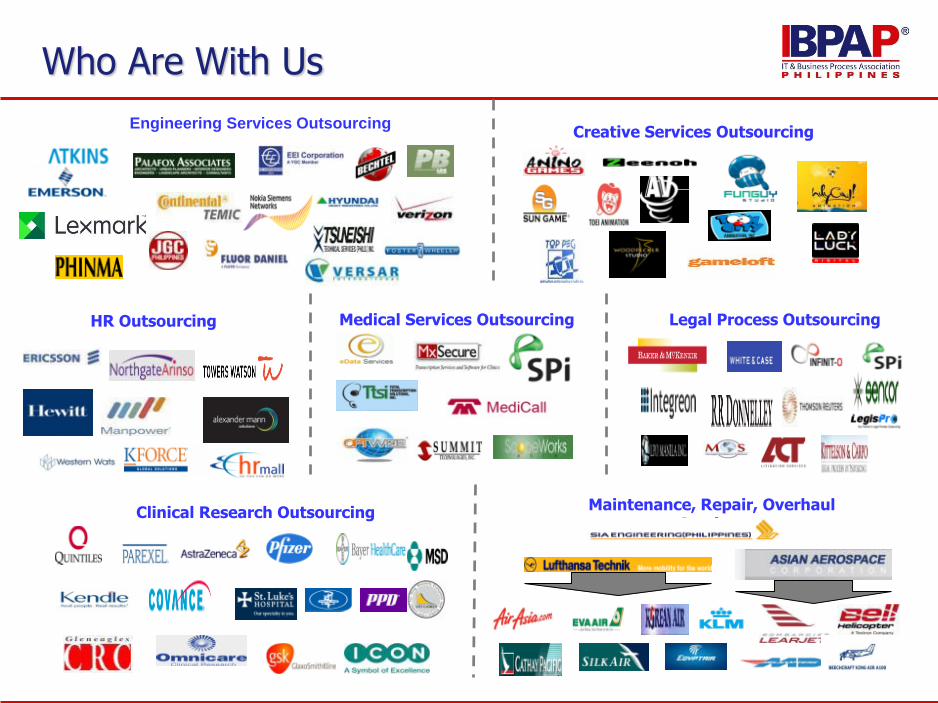
Maintenance, Repair, Overhaul Services
Clinical Research Outsourcing
HR Outsourcing Legal Process Outsourcing
Engineering Services OutsourcingCreative Services Outsourcing
Medical Services Outsourcing
Who Are With Us

O n e M i l li o n
3

Philippine IT-BPM industry size
2006–2014; US$ billionx% YoY Growth
1Philippines IT-BPM market as percentage of global offshore services market, in revenue termsSources: BPAP, ACPI, CCAP, GDAP, HIMOAP, PSIA
# FTEs
(~‘000) 236 371 424 527
3.44.5
6.17.1
8.9
11.0
13.2
16.1
18.9
2006 2007 2008 2009 2010 2011 2012 2013 2014
34%17%
25%
24%
Copyright ©2014: BPAP. All rights reserved.
19%
298 640 777
The Philippine IT-BPM 2014 Performance
31%45%
22%
917
4
1071
19%
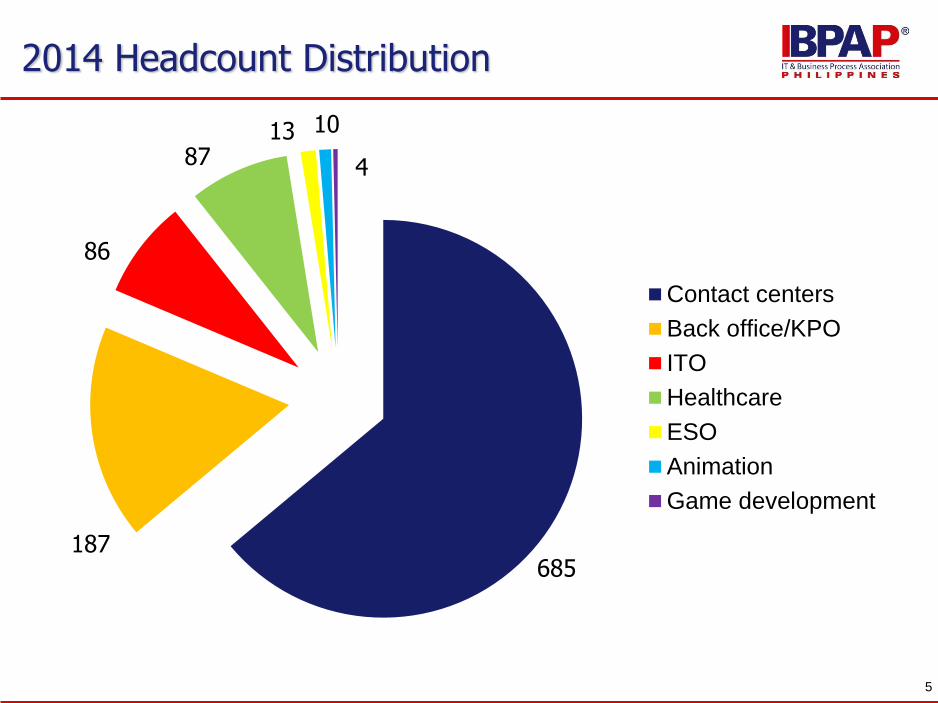
2014 Headcount Distribution
Contact centers
Back office/KPO
ITO
Healthcare
ESO
Animation
Game development
5
685187
86
8713 10
4
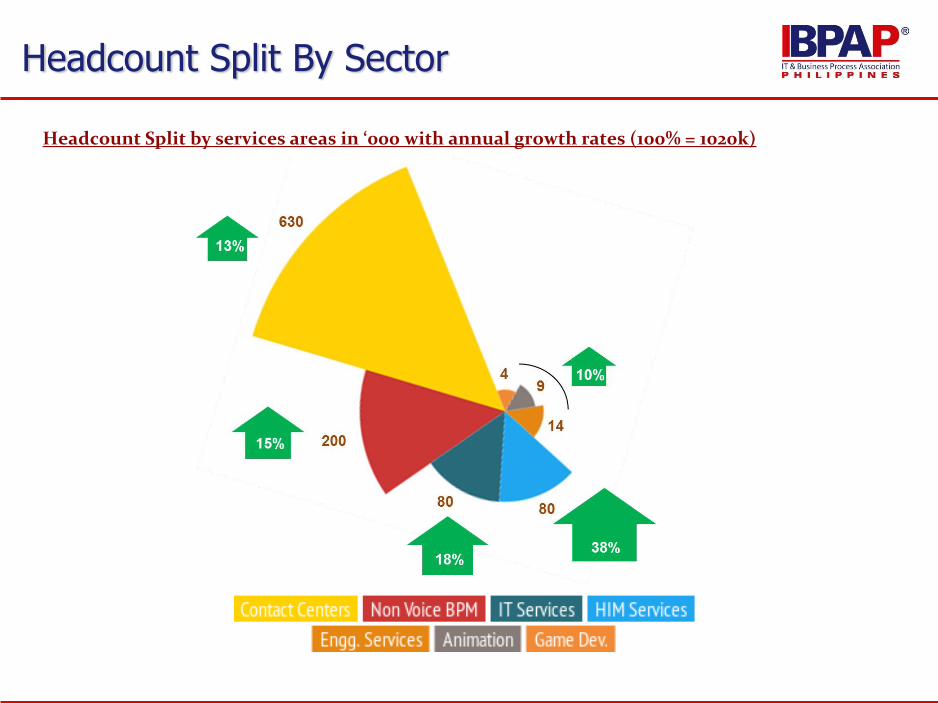
Headcount Split by services areas in ‘000 with annual growth rates (100% = 1020k)
Headcount Split By Sector
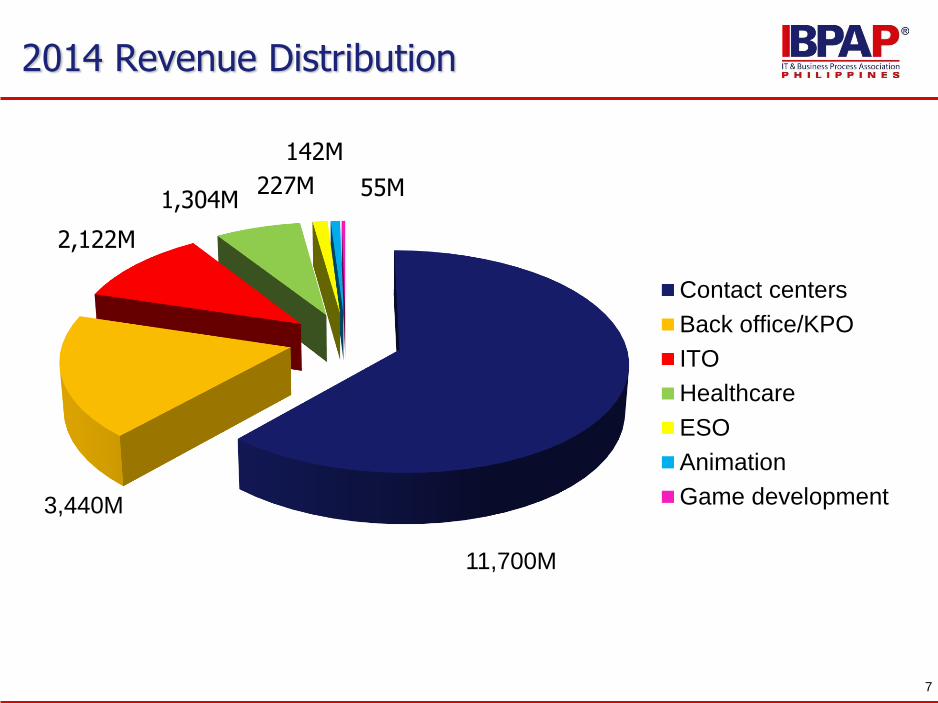
2014 Revenue Distribution
Contact centers
Back office/KPO
ITO
Healthcare
ESO
Animation
Game development
7
11,700M
3,440M
2,122M
1,304M227M
142M
55M

77% 9%
9%
5%
IBPAP, Tholons Analysis
Revenue Contribution by Regions (%, 100% = USD 18.4 BN)
Key Global Markets
9
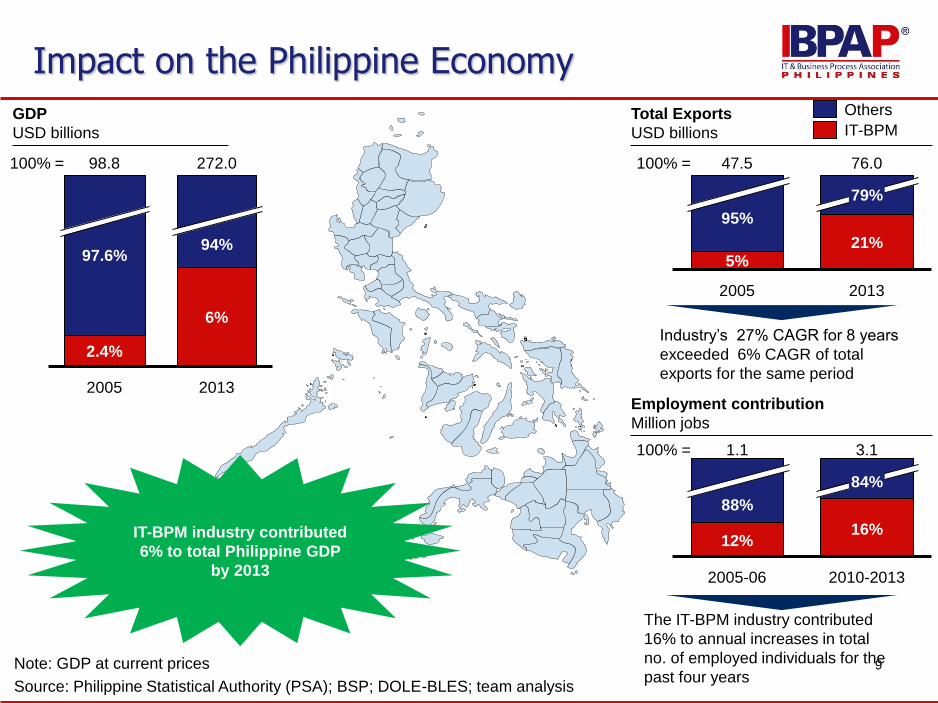
Impact on the Philippine Economy
Note: GDP at current prices
Source: Philippine Statistical Authority (PSA); BSP; DOLE-BLES; team analysis
Total Exports
USD billions
Employment contribution
Million jobs
97.6%
2.4%
98.8
2005
94%
6%
272.0
2013
100% =
95%
5%
47.5
2005
79%
21%
76.0
2013
100% =
GDP
USD billions
IT-BPM industry contributed
6% to total Philippine GDP
by 2013
Industry’s 27% CAGR for 8 years
exceeded 6% CAGR of total
exports for the same period
The IT-BPM industry contributed
16% to annual increases in total
no. of employed individuals for the
past four years
88%
12%
1.1
2005-06
84%
16%
3.1
2010-2013
100% =
Others
IT-BPM
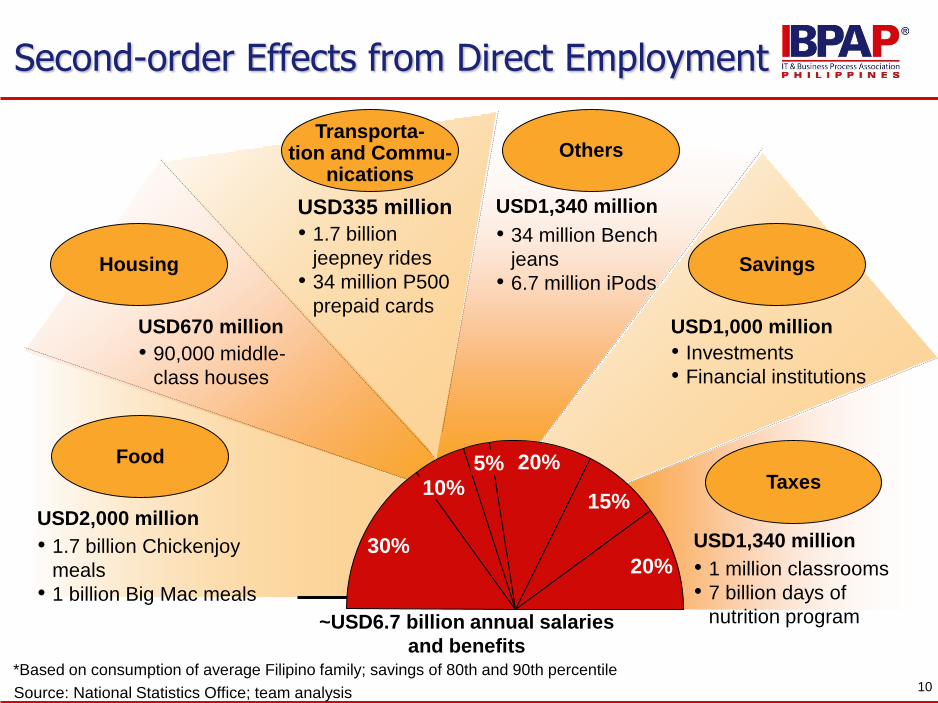
*Based on consumption of average Filipino family; savings of 80th and 90th percentile
Source: National Statistics Office; team analysis
~USD6.7 billion annual salaries
and benefits
Housing Savings
Others
• 34 million Bench
jeans
• 6.7 million iPods
USD1,340 million
• Investments
• Financial institutions
USD1,000 million
• 90,000 middle-
class houses
USD670 million
Food
• 1.7 billion Chickenjoy
meals
• 1 billion Big Mac meals
USD2,000 million
Taxes
USD1,340 million
• 1 million classrooms
• 7 billion days of
nutrition program
• 1.7 billion
jeepney rides
• 34 million P500
prepaid cards
USD335 million
Second-order Effects from Direct Employment
Transporta-tion and Commu-
nications
30%
10%5% 20%
15%
20%
10
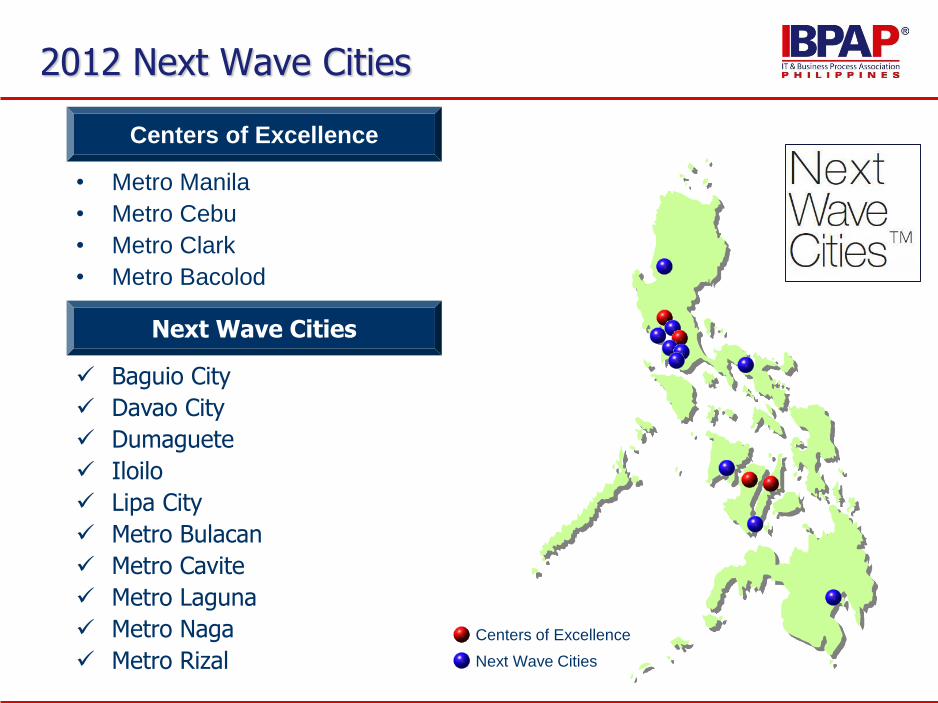
Centers of Excellence
• Metro Manila
• Metro Cebu
• Metro Clark
• Metro Bacolod
Next Wave Cities
Baguio City
Davao City
Dumaguete
Iloilo
Lipa City
Metro Bulacan
Metro Cavite
Metro Laguna
Metro Naga
Metro Rizal Next Wave Cities
Centers of Excellence
2012 Next Wave Cities
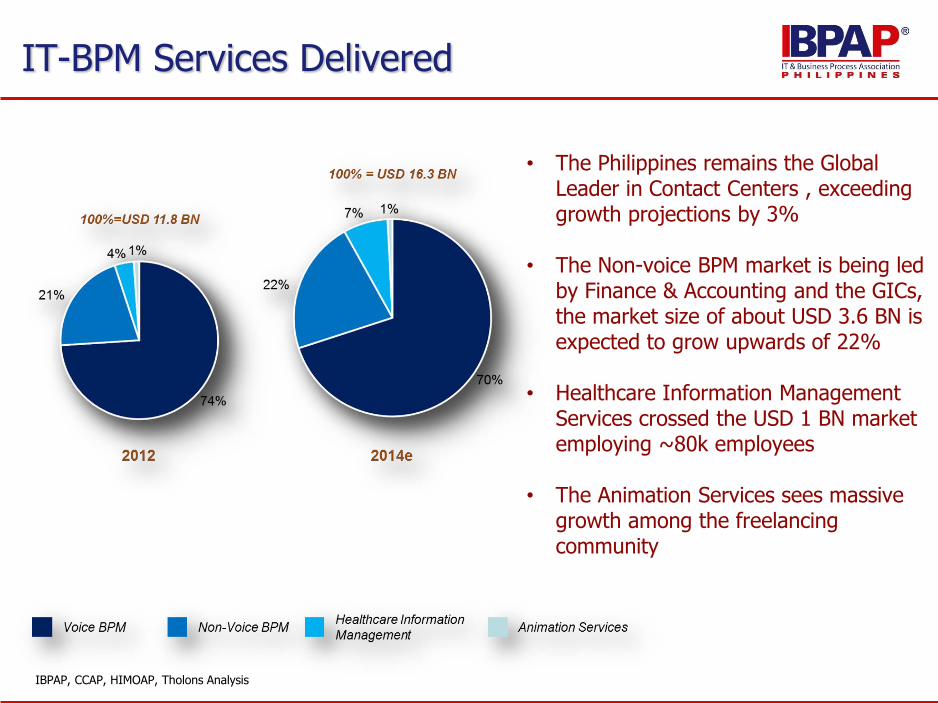
• The Philippines remains the Global Leader in Contact Centers , exceeding growth projections by 3%
• The Non-voice BPM market is being led by Finance & Accounting and the GICs, the market size of about USD 3.6 BN is expected to grow upwards of 22%
• Healthcare Information Management Services crossed the USD 1 BN market employing ~80k employees
• The Animation Services sees massive growth among the freelancing community
IBPAP, CCAP, HIMOAP, Tholons Analysis
IT-BPM Services Delivered

Contact Centers
Philippines
in the
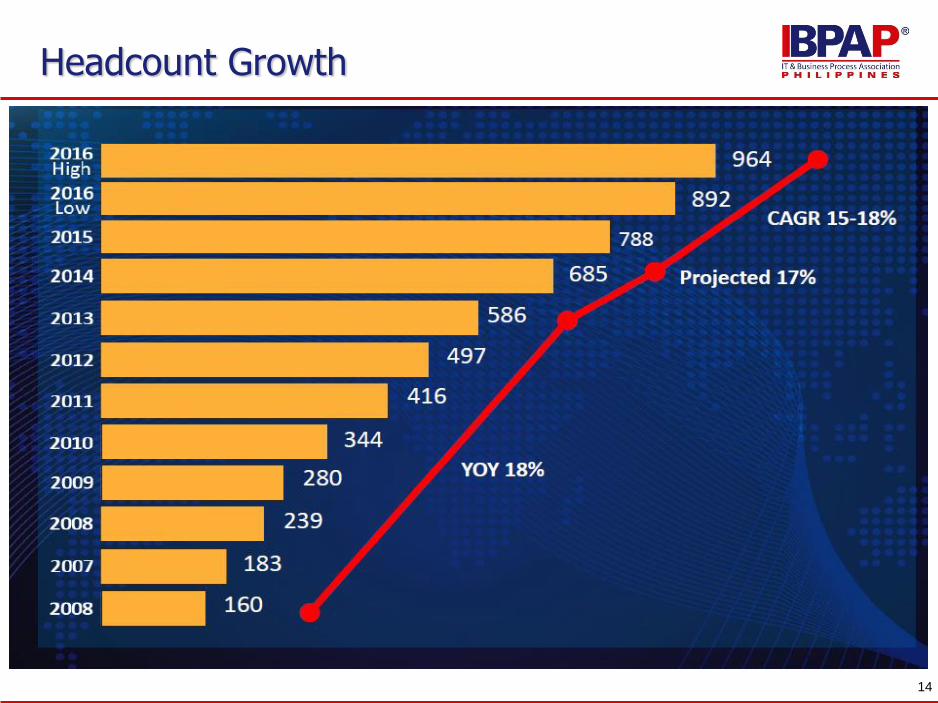
Headcount Growth
14
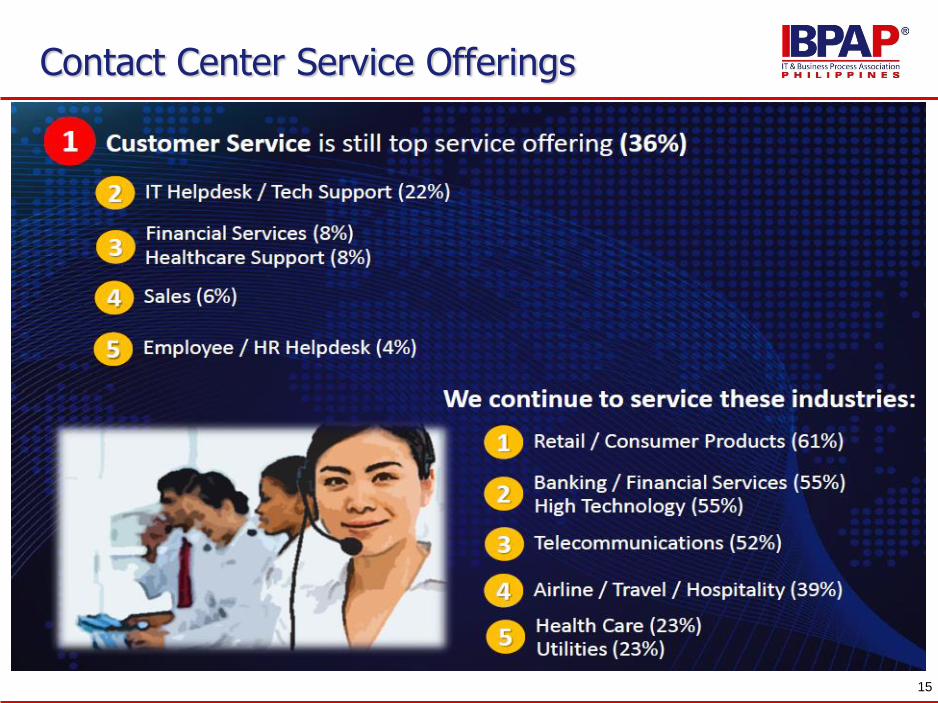
Contact Center Service Offerings
15
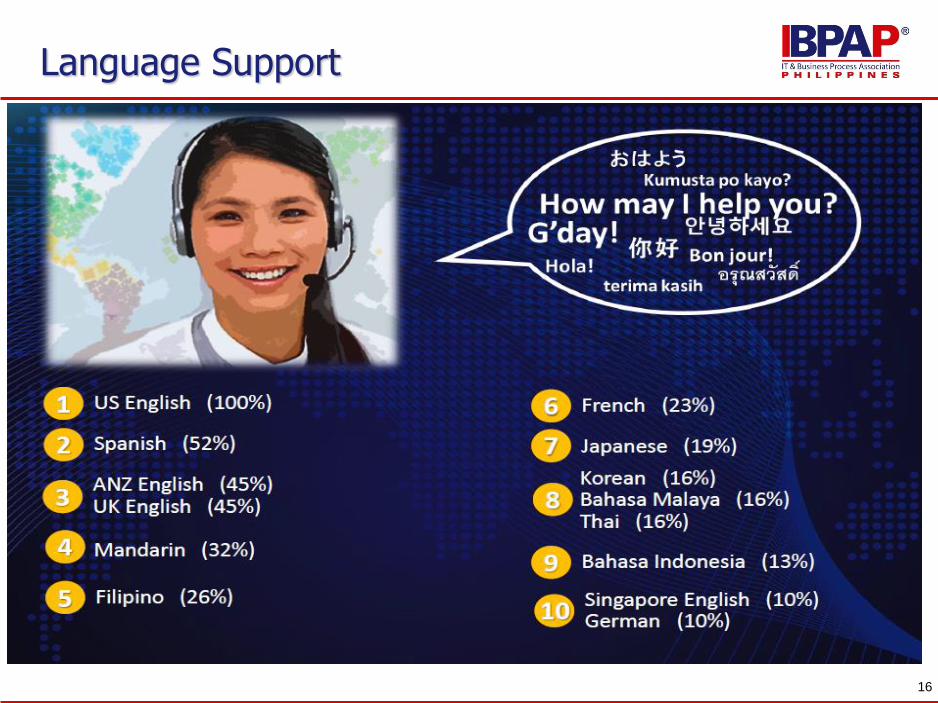
Language Support
16

GIC landscape
Philippines
in the
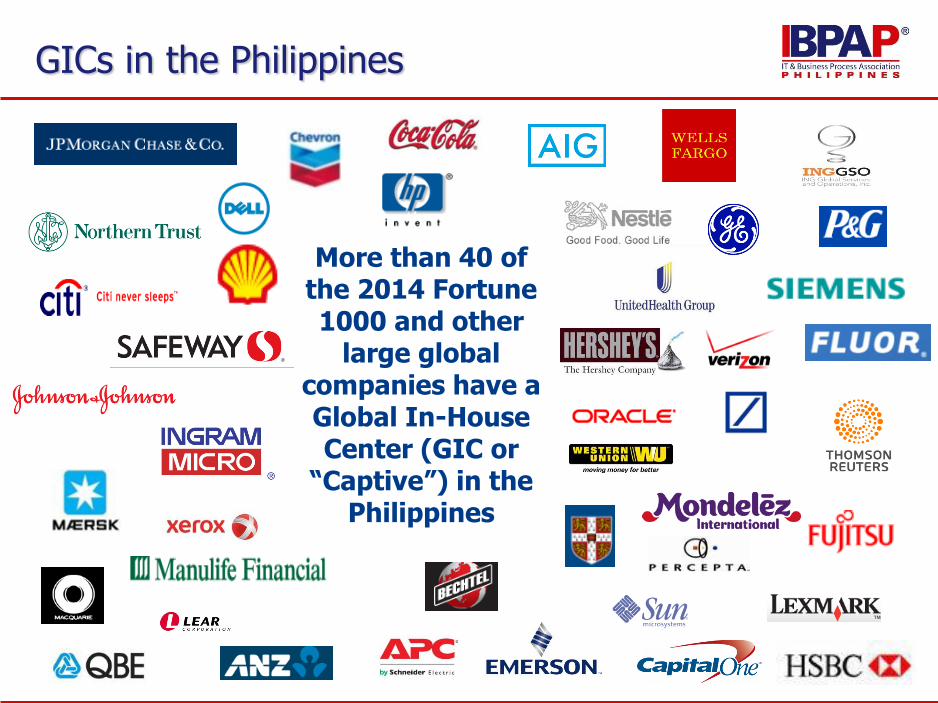
More than 40 of the 2014 Fortune 1000 and other
large global companies have a Global In-House Center (GIC or
“Captive”) in the Philippines
GICs in the Philippines

- Increasing leverage on Manila to meet shared services and back-office needs of the APAC region
- GICs have built sizeable scale in the Philippines and have been driving the growth of non-voice and complex services in the country
- Pressure to grow rapidly by taking on new activities or entirely new lines of business not originally planned
- Lack of multilingual skills (Korean, Japanese)
- Scalability challenges as companies aspire to deliver more non-voice services
GICs 2014: Highs and Lows
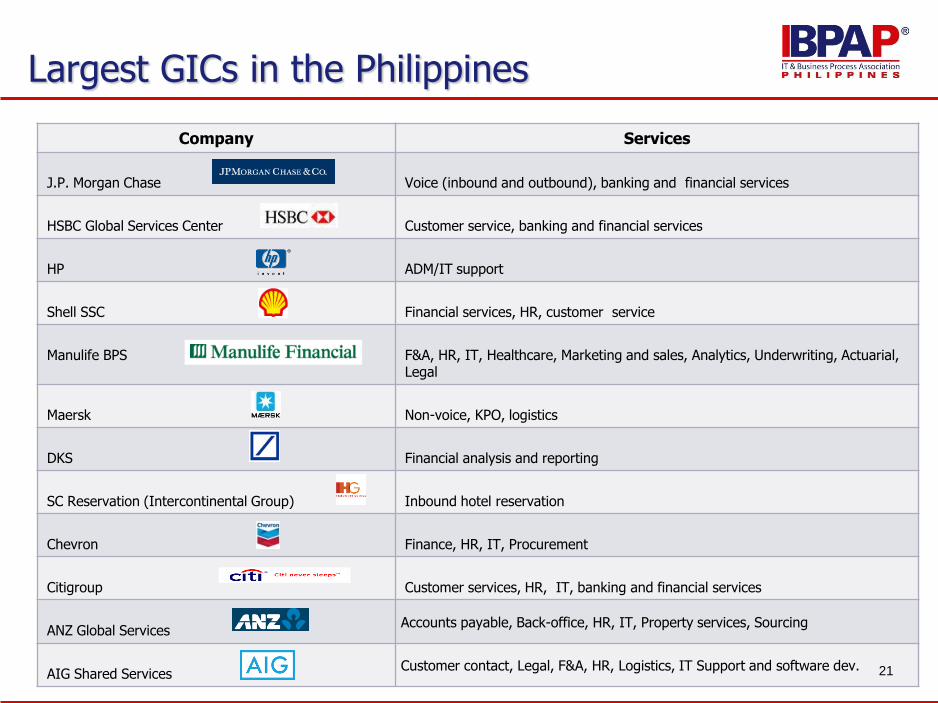
Largest GICs in the Philippines
Company Services
J.P. Morgan Chase Voice (inbound and outbound), banking and financial services
HSBC Global Services Center Customer service, banking and financial services
HP ADM/IT support
Shell SSC Financial services, HR, customer service
Manulife BPS F&A, HR, IT, Healthcare, Marketing and sales, Analytics, Underwriting, Actuarial, Legal
Maersk Non-voice, KPO, logistics
DKS Financial analysis and reporting
SC Reservation (Intercontinental Group) Inbound hotel reservation
Chevron Finance, HR, IT, Procurement
Citigroup Customer services, HR, IT, banking and financial services
ANZ Global ServicesAccounts payable, Back-office, HR, IT, Property services, Sourcing
AIG Shared ServicesCustomer contact, Legal, F&A, HR, Logistics, IT Support and software dev. 21
industry
challenges
22
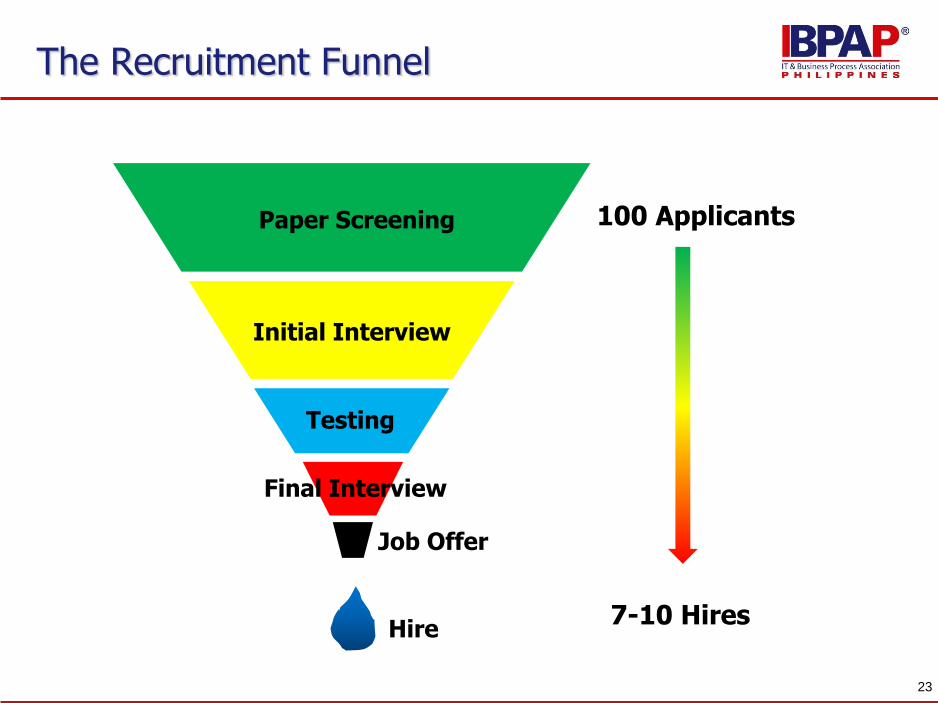
Paper Screening
Initial Interview
Testing
Final Interview
Job Offer
Hire
100 Applicants
7-10 Hires
The Recruitment Funnel
23

• Basic Skills• Learning Ability (Verbal and Numerical)• English Proficiency• Perceptual Speed and Accuracy• Computer Literacy
• Behavioral (Service Orientation)• Communication• Learning Orientation• Courtesy• Empathy• Reliability• Responsiveness
• Conducted across 3,000 agents and 20,000 students
Global Competitiveness Assessment Test (GCAT)
24
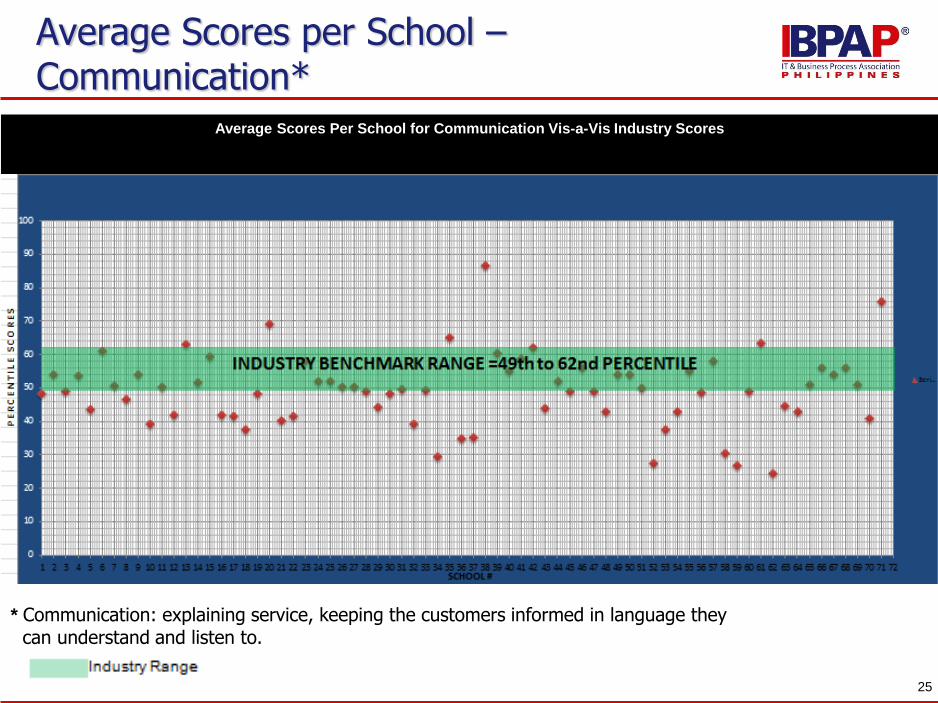
Average Scores Per School for Communication Vis-a-Vis Industry Scores
* Communication: explaining service, keeping the customers informed in language they can understand and listen to.
Average Scores per School –Communication*
25

Targets by end of Project:685 Teachers trained in SMP
2,800 Teachers trained in Language Tracks
20,000 Students enrolled in SMP
Service Management Program
26
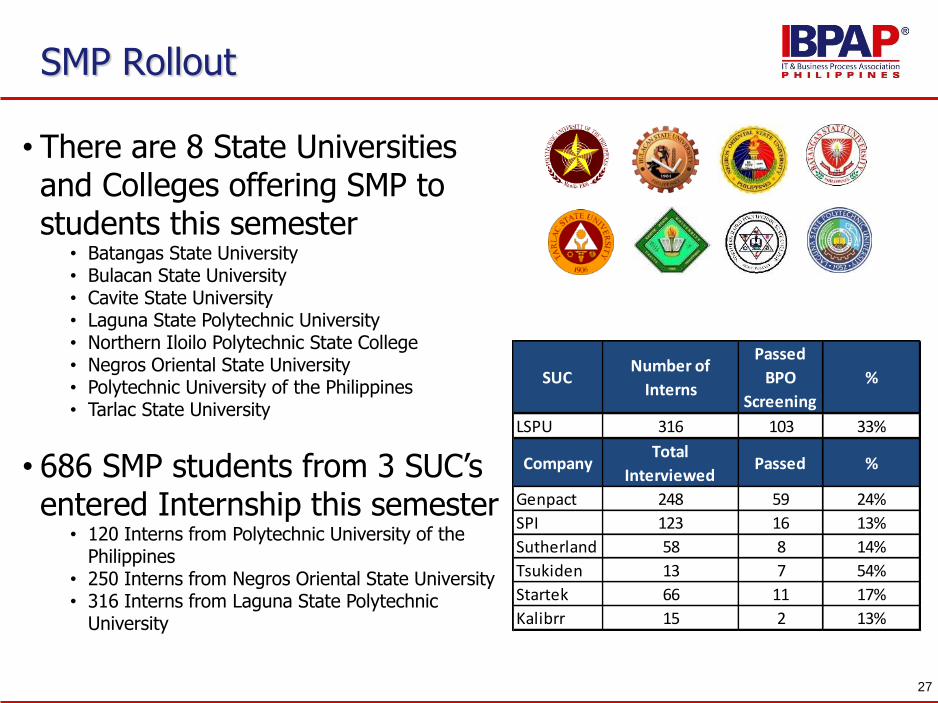
SMP Rollout
27
• There are 8 State Universities and Colleges offering SMP to students this semester
• Batangas State University• Bulacan State University• Cavite State University• Laguna State Polytechnic University• Northern Iloilo Polytechnic State College• Negros Oriental State University• Polytechnic University of the Philippines • Tarlac State University
• 686 SMP students from 3 SUC’s entered Internship this semester
• 120 Interns from Polytechnic University of the Philippines
• 250 Interns from Negros Oriental State University• 316 Interns from Laguna State Polytechnic
University
SUCNumber of
Interns
Passed
BPO
Screening
%
LSPU 316 103 33%
CompanyTotal
InterviewedPassed %
Genpact 248 59 24%
SPI 123 16 13%
Sutherland 58 8 14%
Tsukiden 13 7 54%
Startek 66 11 17%
Kalibrr 15 2 13%
Facing the Challenges
• Middle management – availability and experience
• Niche skills, ie investment banking• Growth of tourism industry• Change of leadership in 2016• Changing policies and regulations• Growth outside Metro Manila • Emergence of other countries• Rise of new technologies• Impact of ASEAN integration

The
Road ahead
29
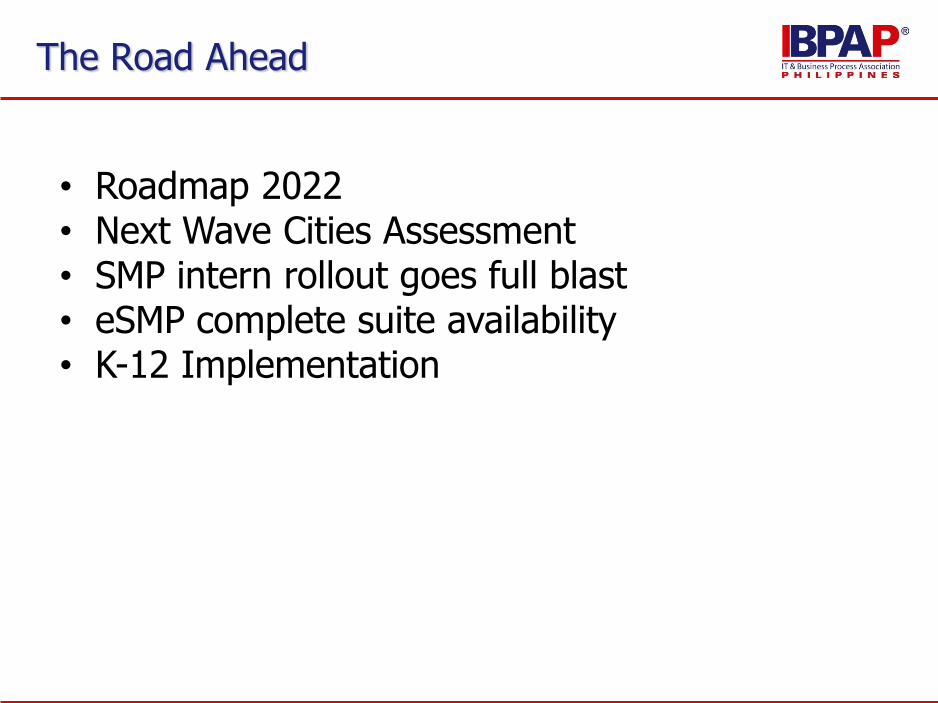
The Road Ahead
• Roadmap 2022• Next Wave Cities Assessment• SMP intern rollout goes full blast• eSMP complete suite availability• K-12 Implementation
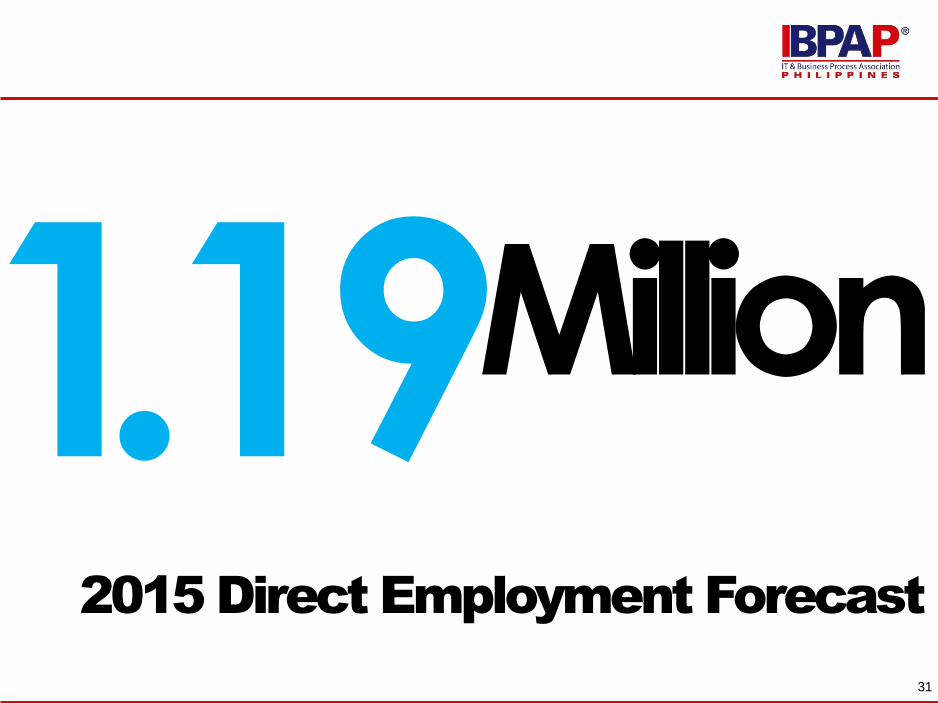
Million
2015 Direct Employment Forecast
31
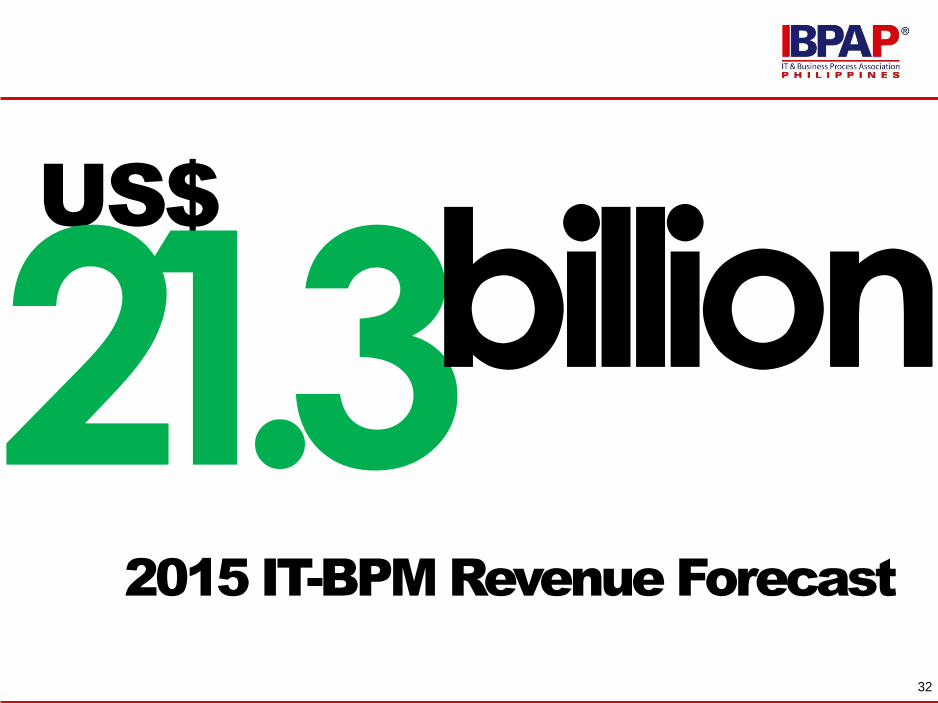
US$
billion2015 IT-BPM Revenue Forecast
32

Thank
you!!
33