the performance of the atlas inner detector … – the performance of the atlas inner detector...
TRANSCRIPT
M.Sutton – The performance of the ATLAS Inner Detector Trigger
X11 Topical Seminar IPRD, Siena - 7-10th June 2010
Mark SuttonUniversity of Sheffield
on behalf of the ATLAS Collaboration
9th June 2010
The performance of the ATLAS Inner Detector Trigger Algorithms in
pp collisions at the LHC
M.Sutton – The performance of the ATLAS Inner Detector Trigger
X11 Topical Seminar IPRD, Siena - 7-10th June 2010
Preface
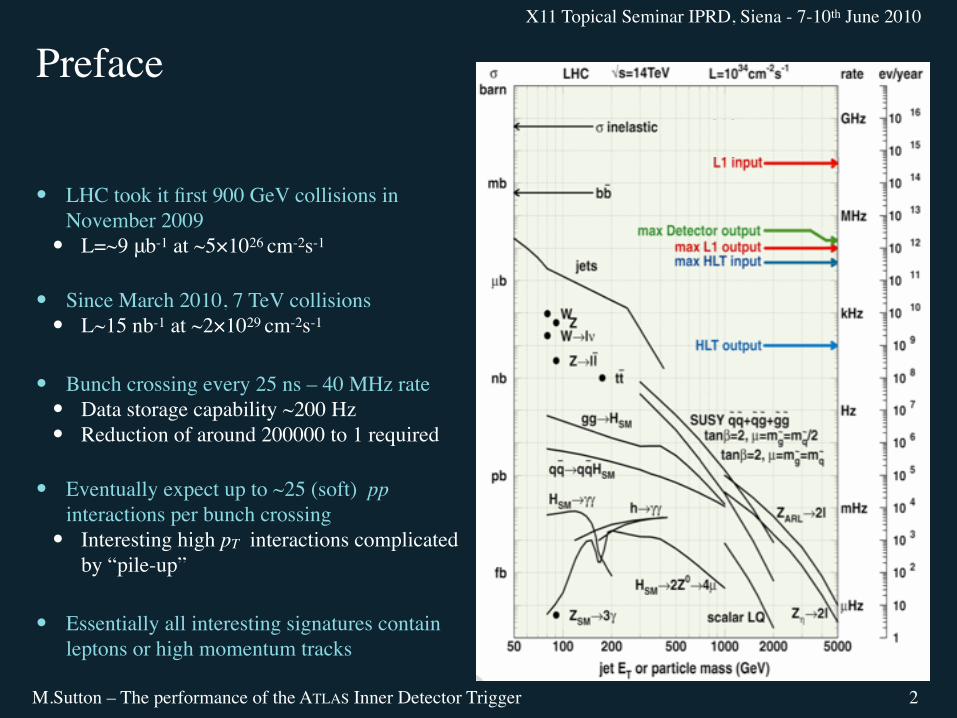
LHC took it first 900 GeV collisions in November 2009
L=~9 μb-1 at ~5×1026 cm-2s-1
Since March 2010, 7 TeV collisions L~15 nb-1 at ~2×1029 cm-2s-1
Bunch crossing every 25 ns – 40 MHz rate Data storage capability ~200 Hz Reduction of around 200000 to 1 required
Eventually expect up to ~25 (soft) pp interactions per bunch crossing
Interesting high pT interactions complicated by “pile-up”
Essentially all interesting signatures contain leptons or high momentum tracks
2
M.Sutton – The performance of the ATLAS Inner Detector Trigger
X11 Topical Seminar IPRD, Siena - 7-10th June 2010
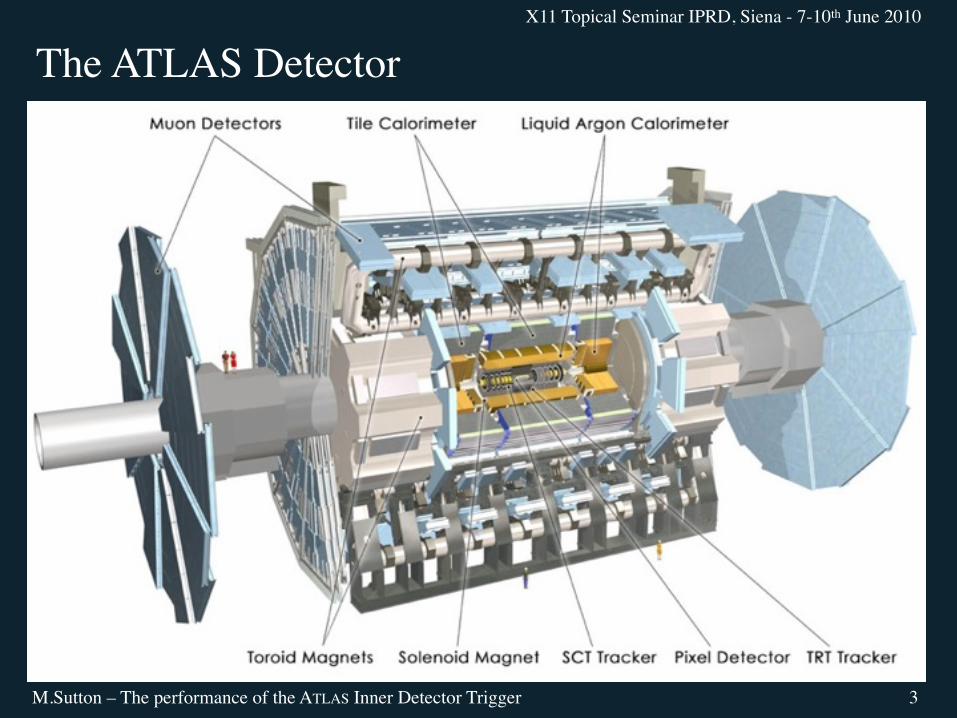
The ATLAS Detector
3
M.Sutton – The performance of the ATLAS Inner Detector Trigger
X11 Topical Seminar IPRD, Siena - 7-10th June 2010
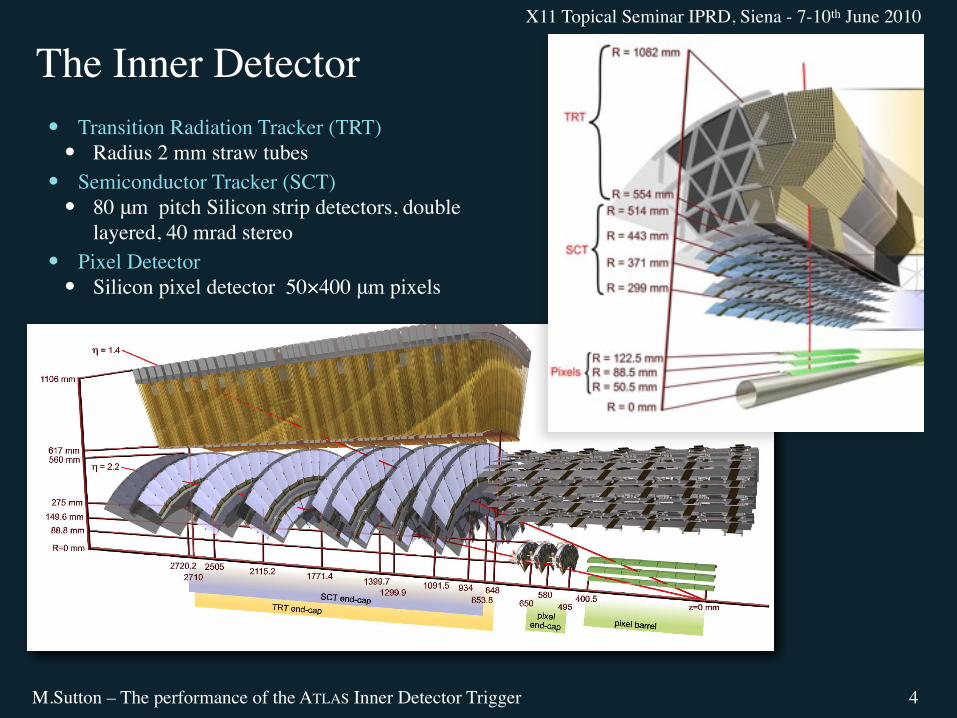
The Inner Detector Transition Radiation Tracker (TRT)
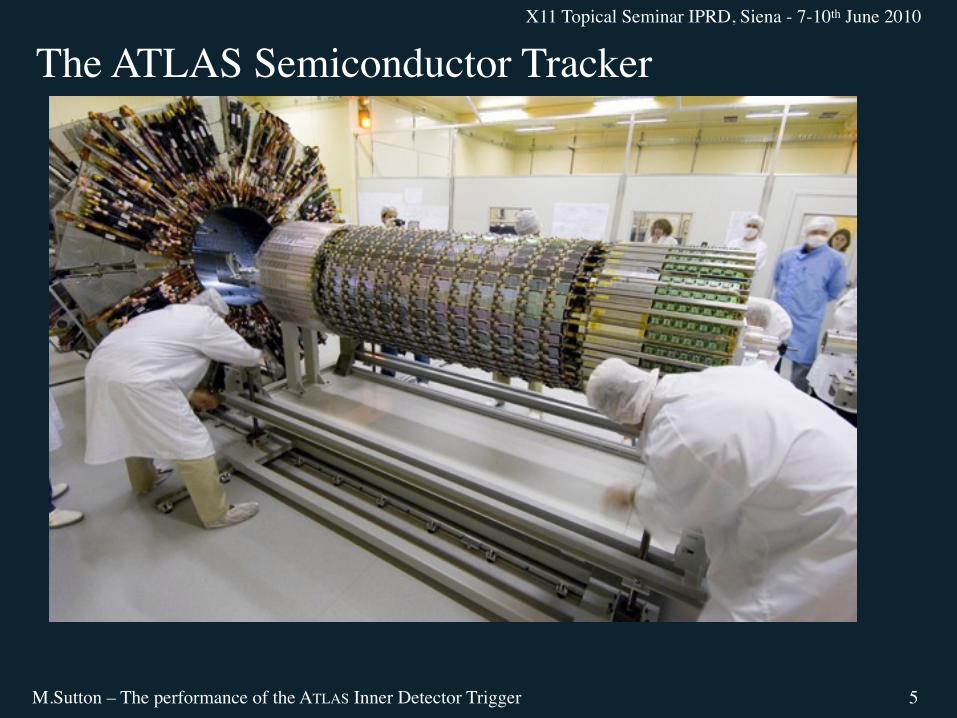
Radius 2 mm straw tubes Semiconductor Tracker (SCT)
80 μm pitch Silicon strip detectors, double layered, 40 mrad stereo
Pixel Detector Silicon pixel detector 50×400 μm pixels
4
M.Sutton – The performance of the ATLAS Inner Detector Trigger
X11 Topical Seminar IPRD, Siena - 7-10th June 2010
5
The ATLAS Semiconductor Tracker
M.Sutton – The performance of the ATLAS Inner Detector Trigger
X11 Topical Seminar IPRD, Siena - 7-10th June 2010
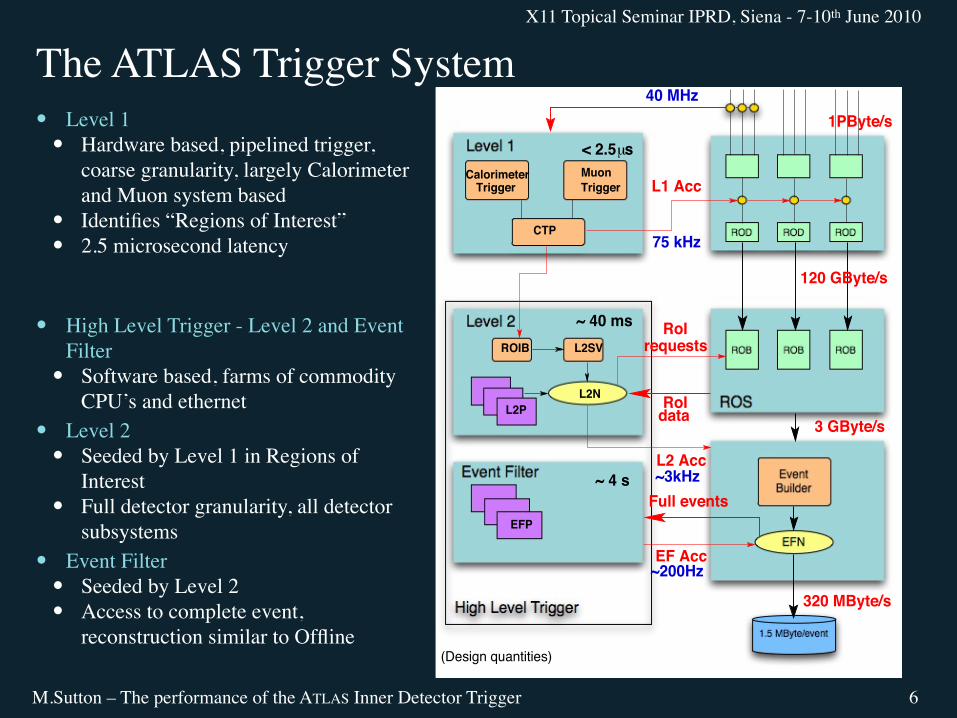
The ATLAS Trigger System Level 1
Hardware based, pipelined trigger, coarse granularity, largely Calorimeter and Muon system based
Identifies “Regions of Interest” 2.5 microsecond latency
High Level Trigger - Level 2 and Event Filter
Software based, farms of commodity CPU’s and ethernet
Level 2 Seeded by Level 1 in Regions of
Interest Full detector granularity, all detector
subsystems Event Filter
Seeded by Level 2 Access to complete event,
reconstruction similar to Offline
6
CalorimeterTrigger
MuonTrigger
CTP
ROIB L2SV
L2NL2P
EFP
µ
RoI
1PByte/s
120 GByte/s
3 GByte/s
Full events
data
requestsRoI
40 MHz
~ 40 ms
~ 4 s
EF Acc
L2 Acc
L1 Acc
75 kHz
~200Hz
320 MByte/s
~3kHz
< 2.5 s
(Design quantities)
M.Sutton – The performance of the ATLAS Inner Detector Trigger
X11 Topical Seminar IPRD, Siena - 7-10th June 2010
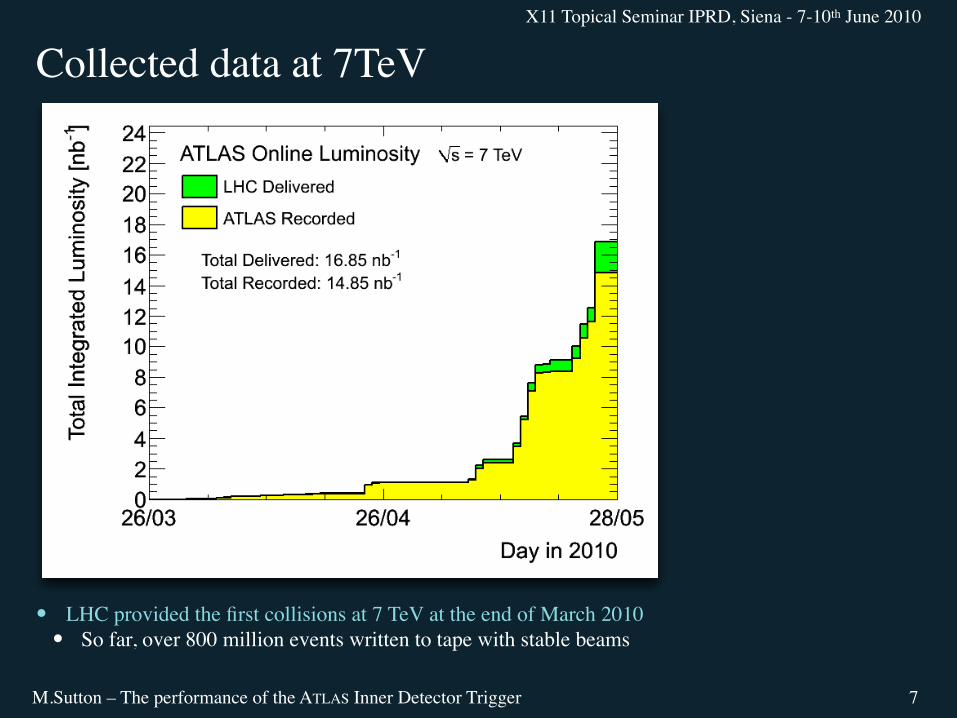
Collected data at 7TeV
LHC provided the first collisions at 7 TeV at the end of March 2010 So far, over 800 million events written to tape with stable beams
7
!"#"$"%$#" &'()*+,(-.'(/0(12345,/6(($((789*:;5<3/+(/0(=*<(>:/?@4<3/+(5<(A(B*C D
!"#"$%"&'()
! !"#"$%"&'()$%#*+,)+$)-./&'"%%)%$"''0/1,&"#)(2$3$-453$/6$+"#"$./(().#)+$#70/*87$9'0,($::
" 3;$-453$+)(,<)0)+$42$=>?$"%$/6$@"2$:A
" B)"C$,-%#"-#"-)/*%$(*&,-/%,#2$D$:$1$3E:$F $.&5:$%53
M.Sutton – The performance of the ATLAS Inner Detector Trigger
X11 Topical Seminar IPRD, Siena - 7-10th June 2010
8
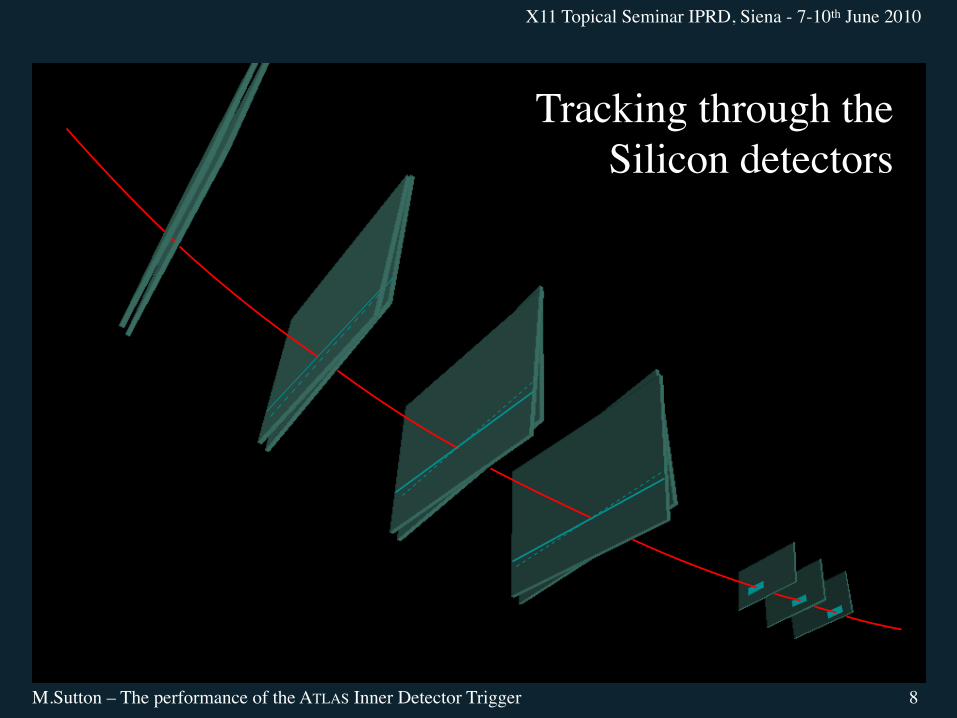
Tracking through the Silicon detectors
M.Sutton – The performance of the ATLAS Inner Detector Trigger
X11 Topical Seminar IPRD, Siena - 7-10th June 2010
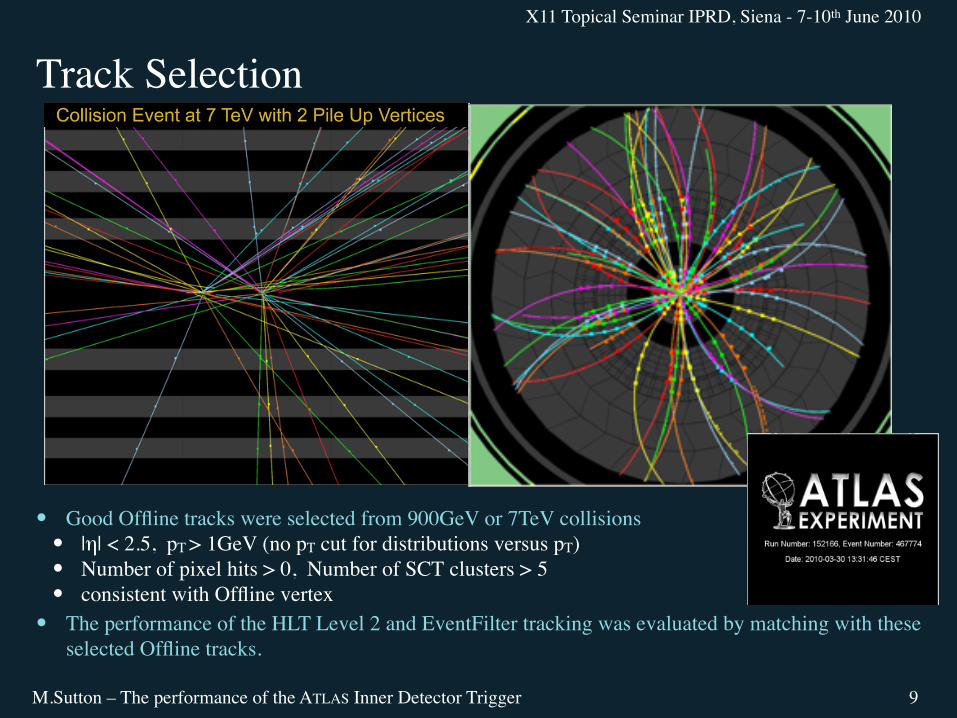
Track Selection
Good Offline tracks were selected from 900GeV or 7TeV collisions |η| < 2.5, pT > 1GeV (no pT cut for distributions versus pT) Number of pixel hits > 0, Number of SCT clusters > 5 consistent with Offline vertex
The performance of the HLT Level 2 and EventFilter tracking was evaluated by matching with these selected Offline tracks.
9
M.Sutton – The performance of the ATLAS Inner Detector Trigger
X11 Topical Seminar IPRD, Siena - 7-10th June 2010
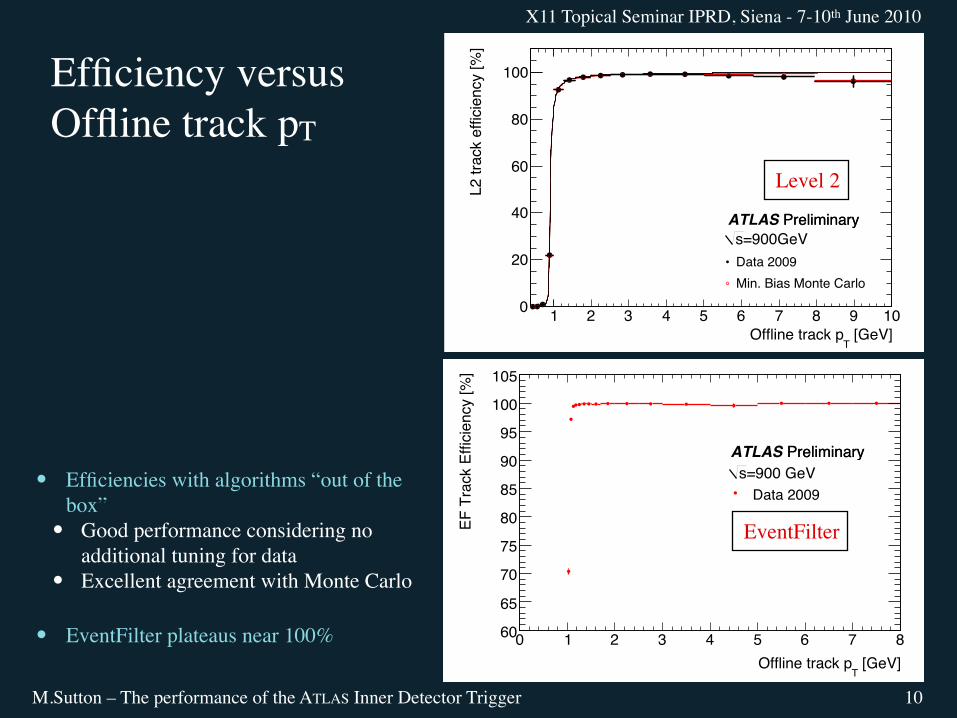
Efficiency versus Offline track pT
Efficiencies with algorithms “out of the box”
Good performance considering no additional tuning for data
Excellent agreement with Monte Carlo
EventFilter plateaus near 100%
10
[GeV]T
Offline track p
1 2 3 4 5 6 7 8 9 10
L2 tra
ck e
ffic
iency [
%]
0
20
40
60
80
100
ATLAS PreliminaryPreliminary
=900GeVs
Data 2009
Min. Bias Monte Carlo
[GeV]T
Offline track p
0 1 2 3 4 5 6 7 8
EF
Tra
ck E
ffic
iency [%
]
60
65
70
75
80
85
90
95
100
105
ATLAS preliminary
=900 GeVs
Data 2009
EventFilter
Level 2
!Offline track
-3 -2 -1 0 1 2 3
L2 tra
ck e
ffic
iency [%
]
70
75
80
85
90
95
100
105
>1GeV)T
Data 2009 (Offline p
>2GeV)T
Data 2009 (Offline p
ATLAS PreliminaryPreliminary
=900GeVs
TrigInDet 7TeV plots to be approved
Efficiency - L2
Tracking efficiency for L2 as a function of the ! of the offline tracks, measured on good offline tracks with various PT thresholds.
Trigger tracking has been run in the whole of the detector (ie. the region-of-interest is the whole of the detector). Considered tracks were identified in the Si detectors.
4
!Offline track
-3 -2 -1 0 1 2 3
L2 tra
ck e
ffic
iency [%
]
70
75
80
85
90
95
100
105
ATLAS PreliminaryPreliminary
=7 TeVs
>1 GeV)T
Data 2010 (Offline p
>2 GeV)T
Data 2010 (Offline p
The threshold behaviour of the efficiency is expected and comes from usage of specialised algorithms optimised for L2 requirements on the track reconstruction & timing constraints.
TrigInDet 7TeV plots to be approved
Efficiency - EF
5
!Offline track
-3 -2 -1 0 1 2 3
EF
tra
ck e
ffic
iency [%
]
88
90
92
94
96
98
100
102
ATLAS PreliminaryPreliminary
=7 TeVs
>1 GeV)T
Data 2010 (Offline p
>1.2 GeV)T
Data 2010 (Offline p
>2 GeV)T
Data 2010 (Offline p
Tracking efficiency for EF as a function of the ! of the offline tracks, measured on good offline tracks with various PT thresholds.
Trigger tracking has been run in the whole of the detector (ie. the region-of-interest is the whole of the detector). Considered tracks were identified in the Si detectors.
The threshold behaviour of the efficiency is expected and comes from usage of a configuration tuning optimised for EF requirements on the track reconstruction & timing constraints.
M.Sutton – The performance of the ATLAS Inner Detector Trigger
X11 Topical Seminar IPRD, Siena - 7-10th June 2010
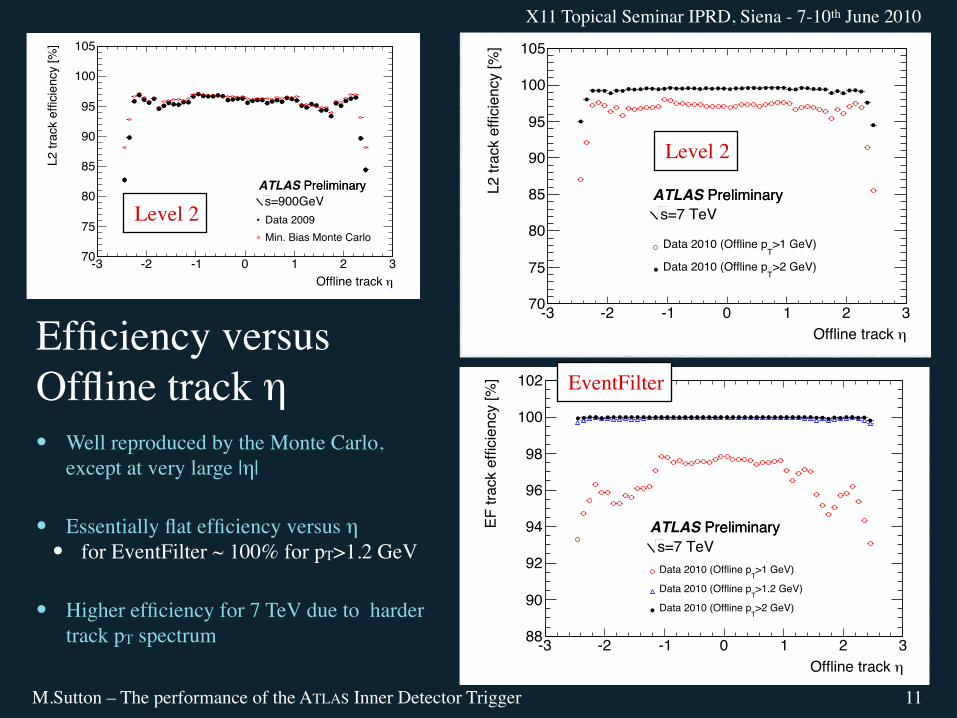
Efficiency versus Offline track η Well reproduced by the Monte Carlo,
except at very large |η|
Essentially flat efficiency versus η for EventFilter ~ 100% for pT>1.2 GeV
Higher efficiency for 7 TeV due to harder track pT spectrum
11
!Offline track
-3 -2 -1 0 1 2 3
L2
tra
ck e
ffic
ien
cy [
%]
70
75
80
85
90
95
100
105
ATLAS PreliminaryPreliminary
=900GeVs
Data 2009
Min. Bias Monte Carlo
Level 2
EventFilter
Level 2
M.Sutton – The performance of the ATLAS Inner Detector Trigger
X11 Topical Seminar IPRD, Siena - 7-10th June 2010
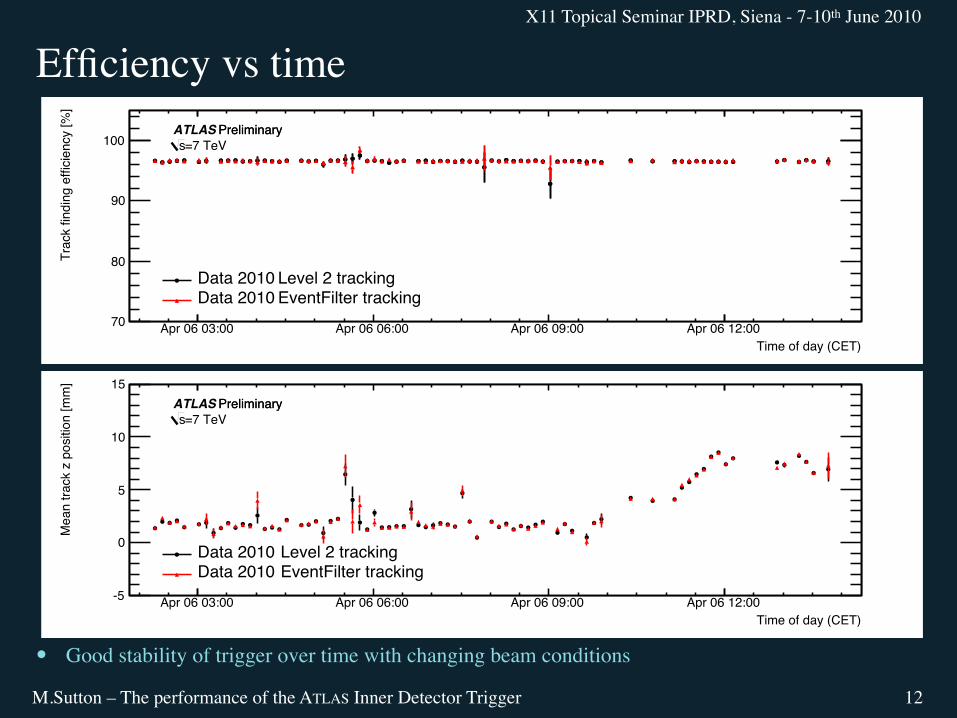
Efficiency vs time
Good stability of trigger over time with changing beam conditions
12
Time of day (CET)
Apr 06 03:00 Apr 06 06:00 Apr 06 09:00 Apr 06 12:00
Tra
ck f
ind
ing
eff
icie
ncy [
%]
70
80
90
100
>2GeV), Level 2 trackingT
Data 2010 (p>2GeV), EventFilter tracking
TData 2010 (p
ATLAS PreliminaryPreliminary
=7 TeVs
Time of day (CET)
Apr 06 03:00 Apr 06 06:00 Apr 06 09:00 Apr 06 12:00
Me
an
tra
ck z
po
sitio
n [
mm
]
-5
0
5
10
15
>2GeV), Level 2 trackingT
Data 2010 (p>2GeV), EventFilter tracking
TData 2010 (p
ATLAS PreliminaryPreliminary
=7 TeVs
Time of day (CET)
Apr 06 03:00 Apr 06 06:00 Apr 06 09:00 Apr 06 12:00
Tra
ck f
ind
ing
eff
icie
ncy [
%]
70
80
90
100
>2GeV), Level 2 trackingT
Data 2010 (p>2GeV), EventFilter tracking
TData 2010 (p
ATLAS PreliminaryPreliminary
=7 TeVs
Time of day (CET)
Apr 06 03:00 Apr 06 06:00 Apr 06 09:00 Apr 06 12:00
Tra
ck f
ind
ing
eff
icie
ncy [
%]
70
80
90
100
>2GeV), Level 2 trackingT
Data 2010 (p>2GeV), EventFilter tracking
TData 2010 (p
ATLAS PreliminaryPreliminary
=7 TeVs
M.Sutton – The performance of the ATLAS Inner Detector Trigger
X11 Topical Seminar IPRD, Siena - 7-10th June 2010
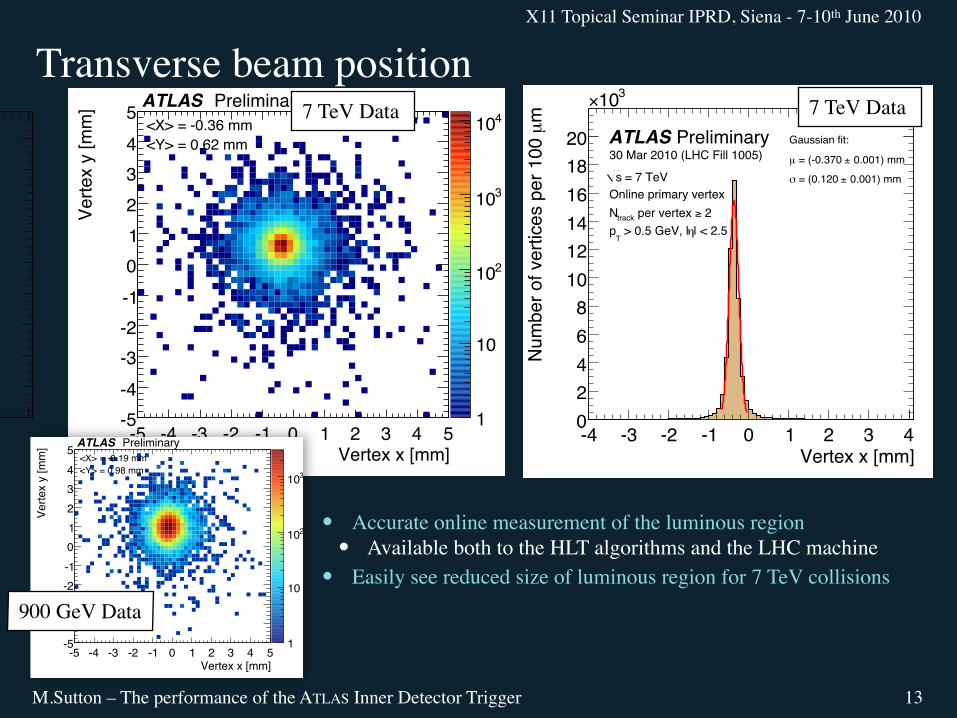
Transverse beam position
Accurate online measurement of the luminous region Available both to the HLT algorithms and the LHC machine
Easily see reduced size of luminous region for 7 TeV collisions
13
May 5, 2010 – 20 : 40 DRAFT 12
Vertex x [mm]-4 -3 -2 -1 0 1 2 3 4
mµ
Num
ber
of vert
ices p
er
100
0
1000
2000
3000
4000
5000
6000
7000
8000
9000Gaussian fit:
0.002) mm± = (-0.193 µ
0.002) mm± = (0.256 !
ATLAS Preliminary12 Dec 2009 (LHC Fill 911)
= 900 GeVs
Online primary vertex
2" per vertex trackN
| < 2.5# > 1.0 GeV, |T
p
(a) Primary vertex x (900 GeV).
Vertex y [mm]-4 -3 -2 -1 0 1 2 3 4
mµ
Num
ber
of vert
ices p
er
100
0
1000
2000
3000
4000
5000
6000
7000 Gaussian fit:
0.002) mm± = (0.990 µ
0.003) mm± = (0.328 !
ATLAS Preliminary12 Dec 2009 (LHC Fill 911)
= 900 GeVs
Online primary vertex
2" per vertex trackN
| < 2.5# > 1.0 GeV, |T
p
(b) Primary vertex y (900 GeV).
1
10
210
310
Vertex x [mm]-5 -4 -3 -2 -1 0 1 2 3 4 5
Vert
ex y
[m
m]
-5
-4
-3
-2
-1
0
1
2
3
4
5<X> = -0.19 mm
<Y> = 0.98 mm
ATLAS Preliminary
(c) Primary vertex x vs. y (900 GeV).
Vertex x [mm]-4 -3 -2 -1 0 1 2 3 4
mµ
Num
ber
of vert
ices p
er
100
0
2
4
6
8
10
12
14
16
18
20
310!
Gaussian fit:
0.001) mm± = (-0.370 µ
0.001) mm± = (0.120 "
ATLAS Preliminary30 Mar 2010 (LHC Fill 1005)
= 7 TeVs
Online primary vertex
2# per vertex trackN
| < 2.5$ > 0.5 GeV, |T
p
(d) Primary vertex x (7 TeV).
Vertex y [mm]-4 -3 -2 -1 0 1 2 3 4
mµ
Num
ber
of vert
ices p
er
100
0
2
4
6
8
10
12
14
16
18
310!
Gaussian fit:
0.001) mm± = (0.628 µ
0.001) mm± = (0.132 "
ATLAS Preliminary30 Mar 2010 (LHC Fill 1005)
= 7 TeVs
Online primary vertex
2# per vertex trackN
| < 2.5$ > 0.5 GeV, |T
p
(e) Primary vertex y (7 TeV).
1
10
210
310
410
Vertex x [mm]-5 -4 -3 -2 -1 0 1 2 3 4 5
Vert
ex y
[m
m]
-5
-4
-3
-2
-1
0
1
2
3
4
5<X> = -0.36 mm
<Y> = 0.62 mm
ATLAS Preliminary
(f) Primary vertex x vs. y (7 TeV).
Figure 4: Primary-vertex distributions in the transverse plane as produced by the ATLAS HLT, beforecorrecting for vertexing resolution. The data were recorded with unsqueezed optics (! ! = 11 m). Gaus-sian fits are used to extract the mean position and observed width; the fitting range is limited to±1 RMSso as to reduce the sensitivity to resolution tails.
Vertex z [mm]-200 -150 -100 -50 0 50 100 150 200
Num
ber
of vert
ices p
er
1 m
m
0
100
200
300
400
500
600Gaussian fit:
0.183) mm± = (-8.067 µ
0.128) mm± = (40.615 !
ATLAS Preliminary12 Dec 2009 (LHC Fill 911)
= 900 GeVsOnline primary vertex
2" per vertex trackN
> 1.0 GeVT
p
| < 2.5#|
(a) Primary vertex z (900 GeV).
Vertex z [mm]-200 -150 -100 -50 0 50 100 150 200
Num
ber
of vert
ices p
er
1 m
m
0
0.2
0.4
0.6
0.8
1
1.2
310!
Gaussian fit:
0.097) mm± = (1.030 µ
0.066) mm± = (22.143 "
ATLAS Preliminary30 Mar 2010 (LHC Fill 1005)
= 7 TeVsOnline primary vertex
2# per vertex trackN
> 0.5 GeVT
p
| < 2.5$|
(b) Primary vertex z (7 TeV).
Figure 5: Longitudinal primary-vertex distributions as produced by the ATLAS HLT. The impact of thevertexing resolution is negligible. A Gaussian fit is used to extract the luminous length and the positionof the longitudinal luminous centroid.
May 5, 2010 – 20 : 40 DRAFT 12
Vertex x [mm]-4 -3 -2 -1 0 1 2 3 4
mµ
Num
ber
of vert
ices p
er
100
0
1000
2000
3000
4000
5000
6000
7000
8000
9000Gaussian fit:
0.002) mm± = (-0.193 µ
0.002) mm± = (0.256 !
ATLAS Preliminary12 Dec 2009 (LHC Fill 911)
= 900 GeVs
Online primary vertex
2" per vertex trackN
| < 2.5# > 1.0 GeV, |T
p
(a) Primary vertex x (900 GeV).
Vertex y [mm]-4 -3 -2 -1 0 1 2 3 4
mµ
Num
ber
of vert
ices p
er
100
0
1000
2000
3000
4000
5000
6000
7000 Gaussian fit:
0.002) mm± = (0.990 µ
0.003) mm± = (0.328 !
ATLAS Preliminary12 Dec 2009 (LHC Fill 911)
= 900 GeVs
Online primary vertex
2" per vertex trackN
| < 2.5# > 1.0 GeV, |T
p
(b) Primary vertex y (900 GeV).
1
10
210
310
Vertex x [mm]-5 -4 -3 -2 -1 0 1 2 3 4 5
Ve
rte
x y
[m
m]
-5
-4
-3
-2
-1
0
1
2
3
4
5<X> = -0.19 mm
<Y> = 0.98 mm
ATLAS Preliminary
(c) Primary vertex x vs. y (900 GeV).
Vertex x [mm]-4 -3 -2 -1 0 1 2 3 4
mµ
Num
ber
of vert
ices p
er
100
0
2
4
6
8
10
12
14
16
18
20
310!
Gaussian fit:
0.001) mm± = (-0.370 µ
0.001) mm± = (0.120 "
ATLAS Preliminary30 Mar 2010 (LHC Fill 1005)
= 7 TeVs
Online primary vertex
2# per vertex trackN
| < 2.5$ > 0.5 GeV, |T
p
(d) Primary vertex x (7 TeV).
Vertex y [mm]-4 -3 -2 -1 0 1 2 3 4
mµ
Num
ber
of vert
ices p
er
100
0
2
4
6
8
10
12
14
16
18
310!
Gaussian fit:
0.001) mm± = (0.628 µ
0.001) mm± = (0.132 "
ATLAS Preliminary30 Mar 2010 (LHC Fill 1005)
= 7 TeVs
Online primary vertex
2# per vertex trackN
| < 2.5$ > 0.5 GeV, |T
p
(e) Primary vertex y (7 TeV).
1
10
210
310
410
Vertex x [mm]-5 -4 -3 -2 -1 0 1 2 3 4 5
Ve
rte
x y
[m
m]
-5
-4
-3
-2
-1
0
1
2
3
4
5<X> = -0.36 mm
<Y> = 0.62 mm
ATLAS Preliminary
(f) Primary vertex x vs. y (7 TeV).
Figure 4: Primary-vertex distributions in the transverse plane as produced by the ATLAS HLT, beforecorrecting for vertexing resolution. The data were recorded with unsqueezed optics (! ! = 11 m). Gaus-sian fits are used to extract the mean position and observed width; the fitting range is limited to±1 RMSso as to reduce the sensitivity to resolution tails.
Vertex z [mm]-200 -150 -100 -50 0 50 100 150 200
Num
ber
of vert
ices p
er
1 m
m
0
100
200
300
400
500
600Gaussian fit:
0.183) mm± = (-8.067 µ
0.128) mm± = (40.615 !
ATLAS Preliminary12 Dec 2009 (LHC Fill 911)
= 900 GeVsOnline primary vertex
2" per vertex trackN
> 1.0 GeVT
p
| < 2.5#|
(a) Primary vertex z (900 GeV).
Vertex z [mm]-200 -150 -100 -50 0 50 100 150 200
Num
ber
of vert
ices p
er
1 m
m0
0.2
0.4
0.6
0.8
1
1.2
310!
Gaussian fit:
0.097) mm± = (1.030 µ
0.066) mm± = (22.143 "
ATLAS Preliminary30 Mar 2010 (LHC Fill 1005)
= 7 TeVsOnline primary vertex
2# per vertex trackN
> 0.5 GeVT
p
| < 2.5$|
(b) Primary vertex z (7 TeV).
Figure 5: Longitudinal primary-vertex distributions as produced by the ATLAS HLT. The impact of thevertexing resolution is negligible. A Gaussian fit is used to extract the luminous length and the positionof the longitudinal luminous centroid.
7 TeV Data 7 TeV Data
1
10
210
310
Vertex x [mm]-5 -4 -3 -2 -1 0 1 2 3 4 5
Ve
rte
x y
[m
m]
-5
-4
-3
-2
-1
0
1
2
3
4
5<X> = -0.19 mm
<Y> = 0.98 mm
ATLAS Preliminary
900 GeV Data
!L2 track
-3 -2 -1 0 1 2 3
Nu
mbe
r o
f pix
el spa
ce p
oin
ts p
er
L2 tra
ck
2.4
2.6
2.8
3
3.2
3.4
3.6
3.8
4 = 900 GeVs
Data 2009
Min. Bias MC
ATLAS Preliminary
M.Sutton – The performance of the ATLAS Inner Detector Trigger
X11 Topical Seminar IPRD, Siena - 7-10th June 2010
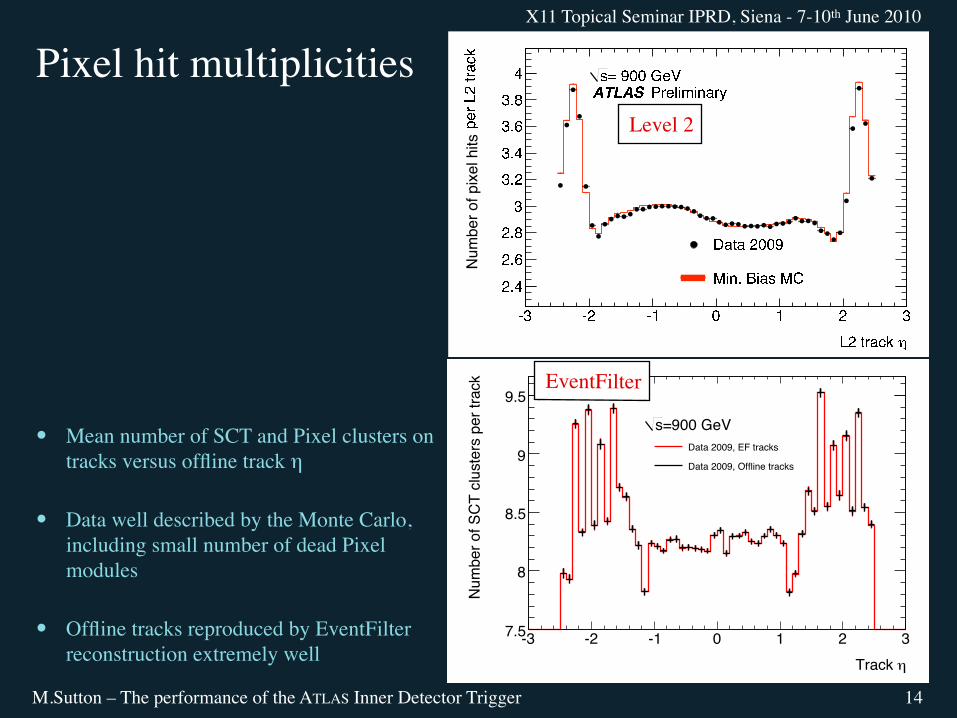
Pixel hit multiplicities
Mean number of SCT and Pixel clusters on tracks versus offline track η
Data well described by the Monte Carlo, including small number of dead Pixel modules
Offline tracks reproduced by EventFilter reconstruction extremely well
14!Track
-3 -2 -1 0 1 2 3
Num
ber
of pix
el hits p
er
track
2.6
2.8
3
3.2
3.4
3.6
3.8
4
4.2
4.4
Data 2009, EF tracks
Data 2009, Offline tracks
ATLAS preliminary
=900 GeVs
Level 2
!Track
-3 -2 -1 0 1 2 3
Num
ber
of pix
el hits p
er
track
2.6
2.8
3
3.2
3.4
3.6
3.8
4
4.2
4.4
Data 2009, EF tracks
Data 2009, Offline tracks
ATLAS preliminary
=900 GeVs
!L2 track
-3 -2 -1 0 1 2 3
Nu
mb
er
of
pix
el sp
ace
po
ints
per
L2
tra
ck
2.4
2.6
2.8
3
3.2
3.4
3.6
3.8
4 = 900 GeVs
Data 2009
Min. Bias MC
ATLAS Preliminary
!Track
-3 -2 -1 0 1 2 3
Nu
mb
er
of
SC
T c
luste
rs p
er
tra
ck
7.5
8
8.5
9
9.5
Data 2009, EF tracks
Data 2009, Offline tracks
� � � � � � � � � � � � �=900 GeVs
EventFilter
[mm]oL2-offline track d
-1.5 -1 -0.5 0 0.5 1 1.5
Num
ber
of tr
acks
310
410
510
610= 900 GeVs
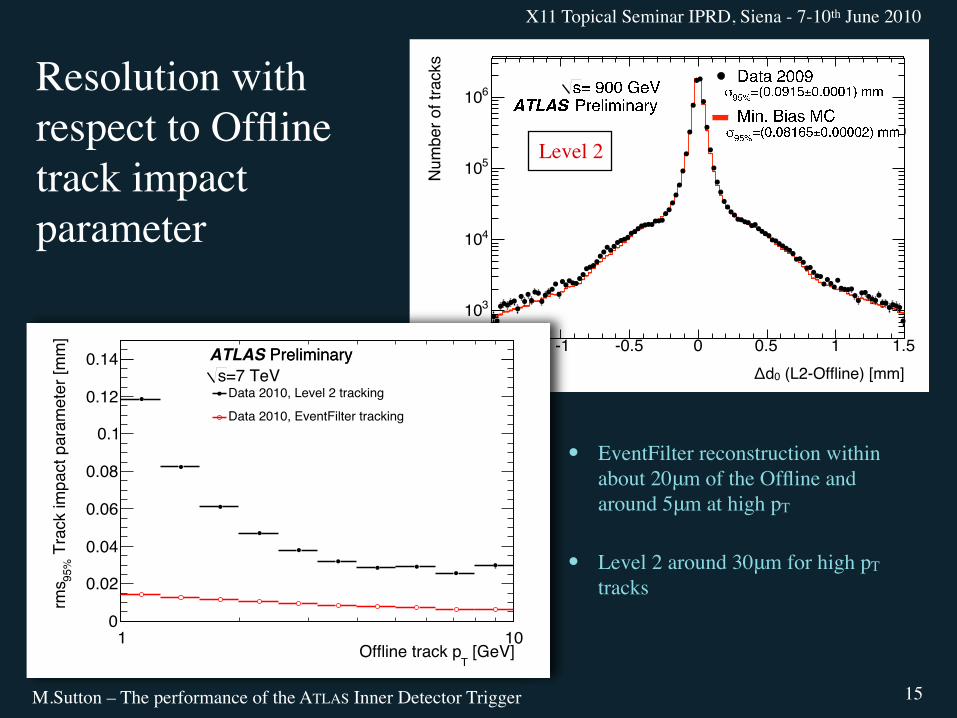
Data 20090.0001)mm±=(0.0915
95%!
Min. Bias MC0.00002)mm±=(0.08165
95%!
ATLAS Preliminary
M.Sutton – The performance of the ATLAS Inner Detector Trigger
X11 Topical Seminar IPRD, Siena - 7-10th June 2010
Resolution with respect to Offline track impact parameter
15
Δd0 (L2-Offline) [mm]
Δd0 (EF-Offline) [mm]
σ95%=(0.0258±0.0001) mm
EventFilter reconstruction within about 20μm of the Offline and around 5μm at high pT
Level 2 around 30μm for high pT tracks
(EF-offline) [mm]0d!
-1.5 -1 -0.5 0 0.5 1 1.5
Nu
mb
er
of
tra
cks
210
310
410
510
610 ATLAS PreliminaryPreliminary
=7 TeVsData 2010
0.00001) mm! = (0.01804 95%
"
[GeV]T
Offline track p1 10
Tra
ck im
pact para
mete
r [m
m]
95%
rms
0
0.02
0.04
0.06
0.08
0.1
0.12
0.14
Data 2010, Level 2 tracking
Data 2010, EventFilter tracking
ATLAS PreliminaryPreliminary
=7 TeVs
Level 2
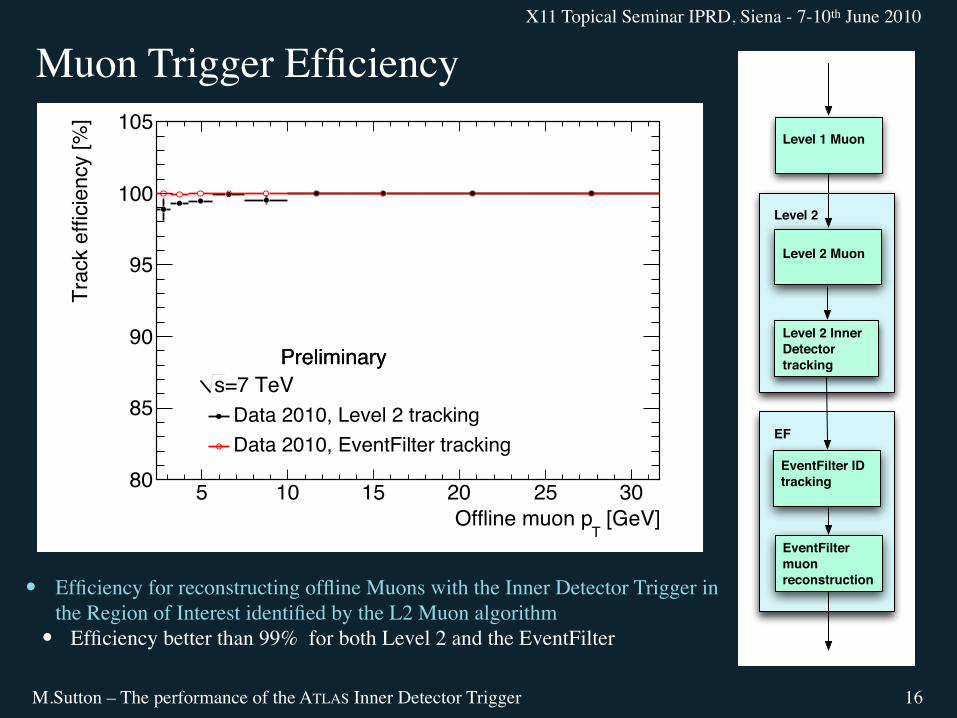
Muon Trigger Efficiency
M.Sutton – The performance of the ATLAS Inner Detector Trigger
X11 Topical Seminar IPRD, Siena - 7-10th June 2010
Efficiency for reconstructing offline Muons with the Inner Detector Trigger in the Region of Interest identified by the L2 Muon algorithm
Efficiency better than 99% for both Level 2 and the EventFilter
16
Level 1 Muon
Level 2 Muon
Level 2 Inner
Detector
tracking
Level 2
EF
EventFilter ID
tracking
EventFilter
muon
reconstruction
Level 1 Muon
Level 2 Muon
Level 2 Inner
Detector
tracking
Level 2
EF
EventFilter ID
tracking
EventFilter
muon
reconstruction
!Offline muon
-2.5 -2 -1.5 -1 -0.5 0 0.5 1 1.5 2 2.5
Tra
ck e
ffic
ien
cy [
%]
80
85
90
95
100
105
Data 2010, Level 2 tracking
Data 2010, EventFilter tracking
ATLAS PreliminaryPreliminary
=7 TeVs
6M.Sutton – Inner Detector Trigger Performance plots for approval
Trigger General Meeting 19th May 2010
Tracking efficiency - for Muons
! L2 and EF Si-tracking efficiency for offline muon tracks of |!|<2.5 and that are located inside L2 muon regions-of-interest, shown as a
function of the transverse momentum of the offline muon.
[GeV]T
Offline muon p
5 10 15 20 25 30
Tra
ck e
ffic
ien
cy [
%]
80
85
90
95
100
105
Data 2010, Level 2 tracking
Data 2010, EventFilter tracking
� � � � � PreliminaryPreliminary
=7 TeVs
M.Sutton – The performance of the ATLAS Inner Detector Trigger
X11 Topical Seminar IPRD, Siena - 7-10th June 2010
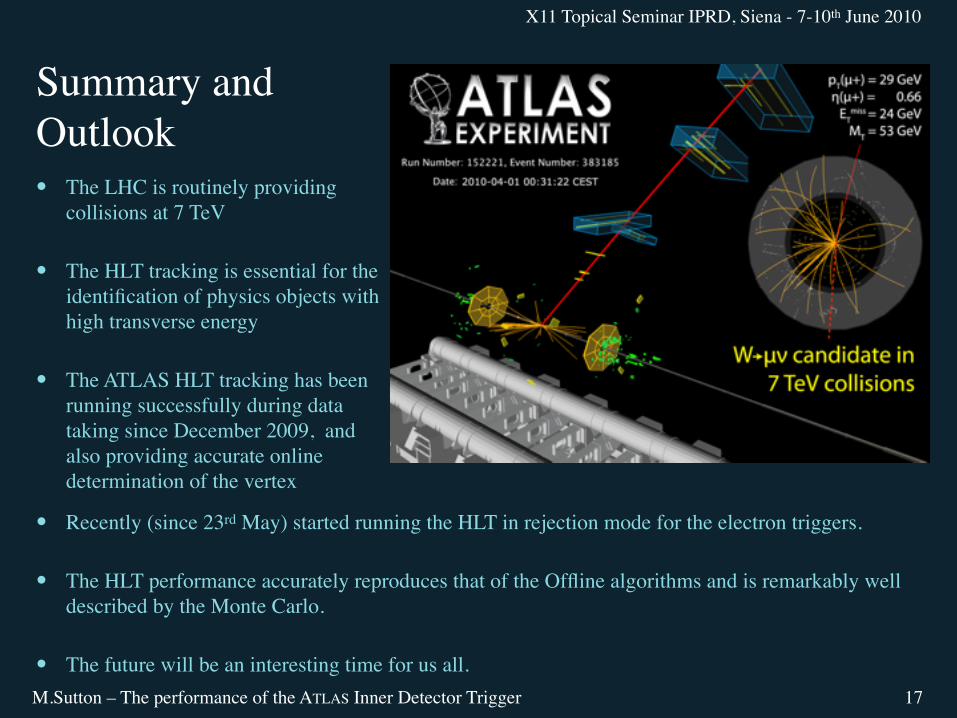
Summary and Outlook The LHC is routinely providing
collisions at 7 TeV
The HLT tracking is essential for the identification of physics objects with high transverse energy
The ATLAS HLT tracking has been running successfully during data taking since December 2009, and also providing accurate online determination of the vertex
17
Recently (since 23rd May) started running the HLT in rejection mode for the electron triggers.
The HLT performance accurately reproduces that of the Offline algorithms and is remarkably well described by the Monte Carlo.
The future will be an interesting time for us all.
M.Sutton – The performance of the ATLAS Inner Detector Trigger
X11 Topical Seminar IPRD, Siena - 7-10th June 2010
And Finally….
A very big thank you to the organisers for such a gorgeous venue for the meeting…
18