the performance of microinsurance programs: a data envelopment analysis · the performance of...
TRANSCRIPT
The Performance of Microinsurance Programs:A Data Envelopment Analysis
Christian Biener und Martin Eling
Preprint Series: 2010-09
Fakultat fur Mathematik und WirtschaftswissenschaftenUNIVERSITAT ULM
THE PERFORMANCE OF MICROINSURANCE PROGRAMS:
A DATA ENVELOPMENT ANALYSIS
Christian Biener ([email protected]), University of Ulm, Germany
Martin Eling ([email protected]), University of Ulm, Germany*
* Corresponding author:
University of Ulm
Institute of Insurance Science
Helmholtzstraße 18
89069 Ulm, Germany
Phone: +49 (0)731/50-31183
Fax: +49 (0)731/50-31188
Acknowledgments: We thank two anonymous referees, Véronique Faber, Denis Garand, Begoña
Gutiérrez-Nieto, Christian Kraus, Andreas Landmann, J. Tyler Leverty, Sebastian Marek, Bert
Opdebeeck, Richard Phillips, Gabriele Ramm, Jan-Philipp Schmidt, Carlos Serrano-Cinca, Susan
Steiner, John Wipf, and the participants of the AFIR/LIFE Colloquium 2009 in Munich, the 5th
International Microinsurance Conference in Dakar, and the World Risk and Insurance Economics
Congress 2010 in Singapore for their helpful questions and comments. We are also very grateful
to the Microinsurance Network (Performance Indicators Working Group) for providing us the
data on microinsurance programs and for their valuable suggestions.
1
THE PERFORMANCE OF MICROINSURANCE PROGRAMS:
A DATA ENVELOPMENT ANALYSIS
Abstract: The purpose of this research is to measure the performance of microinsurance
programs using data envelopment analysis and to derive implications for the viable provision of
microinsurance products. This is a worthwhile exercise given the significant limitations of the
existing performance measures used in the microinsurance industry. A single and simple to
interpret performance measure can overcome these limitations and provide a sophisticated tool
for performance measurement within a multidimensional framework. Moreover, this technique
can incorporate the important social function that microinsurers fulfill and provide powerful
managerial implications. We illustrate the capabilities of data envelopment analysis using a
sample of 20 microinsurance programs and recent innovations from the efficiency literature, such
as the bootstrapping of efficiency scores and a truncated regression analysis of efficiency
determinants.
Keywords: Efficiency, Data Envelopment Analysis, Bootstrapping, Social Output Measure
1 INTRODUCTION
The microinsurance industry today is highly dependent on donor or government subsidies, which,
for the most part, are available only temporarily. Without subsidies, all these programs are
subject to the same economic forces as commercial insurers, and this requires them to be
managed efficiently. Management goals, however, cannot be realized without a transparent
performance measurement (see Wipf and Garand, 2008). Performance measurement and
benchmarking is thus an important issue for the microinsurance industry.
In this paper, we use data envelopment analysis (DEA) to evaluate the performance of
microinsurance programs. DEA measures firm performance relative to the “best practices” of
leading firms in an industry (see Cooper, Seiford, and Tone, 2007). This technique has been
2
applied in numerous studies of traditional insurance markets (for an overview, see Eling and
Luhnen, 2010a), but we are not aware of any research that evaluates the efficiency of
microinsurance programs.
Research on the performance of microinsurance programs is still in its infancy. Industry
practitioners organized in the Microinsurance Network (formerly CGAP Working Group on
Microinsurance) have set up a Performance Indicators Working Group and initiated the
development of 10 performance ratios, which are summarized in a performance indicators
handbook (see Wipf and Garand, 2008). The performance measures can enhance comparisons of
different schemes and improve transparency, but they cannot capture the large diversity of
different microinsurance providers. For example, some projects are still in the startup phase,
whereas others are large, established programs. It is not clear what set of measures signifies poor,
average, and excellent performance; the answer depends on many factors, including the type of
product, profit orientation, location, size, and age of the program.
Frontier efficiency techniques such as DEA might be good tools for assessing the performance of
microinsurance programs and a valuable addition to traditional financial ratio analysis because
they summarize performance in a single statistic that controls for differences among firms using a
multidimensional framework (see Cummins and Weiss, 2000). The techniques are particularly
suitable for microinsurers: frontier efficiency methods were originally developed for the
benchmarking of non-profit organizations such as schools because, unlike many industries, the
production function for these institutions is unknown. Inputs and outputs used in efficiency
analysis include financial measures, but the methods can also accommodate social output
measures and thus reveal the important social function of microinsurance programs. Gutiérrez-
Nieto, Serrano-Cinca, and Mar Molinero (2009) follow this line of reasoning in a frontier
efficiency analysis for the microfinance industry; their results reveal the importance of assessing
social efficiency.
3
This paper uses new data and an innovative methodology. Our data are provided by the
Performance Indicators Working Group of the Microinsurance Network. We analyze an updated
dataset on the insurance schemes considered in the performance indicators handbook (Wipf and
Garand, 2008), which contains detailed information on 20 microinsurance programs. We use
recent innovations from the efficiency literature to account for the fact that the standard DEA
efficiency scores are sensitive to measurement errors, especially with smaller data samples such
as the one considered here. For the first-stage determination of DEA efficiency scores, we use the
bootstrapping procedure presented in Simar and Wilson (2000a). We also conduct a second-stage
regression of efficiency determinants on DEA scores using the truncated regression proposed by
Simar and Wilson (2007), thus permitting valid inferences as to the regression of contextual
variables on efficiency.
This is the first paper to analyze the efficiency of microinsurance programs. One of our
contributions is that we extend the existing key performance measures with a new, powerful
benchmarking tool that addresses the limitations of the measures currently used in the
microinsurance industry. Furthermore, we enhance the comparability of microinsurance programs
using a single and simple to interpret performance number and provide managerial implications.
Another contribution of this paper is the transfer of frontier efficiency methodologies to the
microinsurance industry and the incorporation of the social function that microinsurers fulfill; our
hope is that it encourages further research and discussion on benchmarking and performance
measurement in microinsurance.
Our empirical results indicate significant diversity and the potential for improvement in the
microinsurance industry. In our dataset, microinsurers that sell group policies are more efficient
than those that sell individual policies, a finding that might serve as an indication for managers to
direct activities toward the provision of group policies. Growth strategies and merger activities
are promising approaches toward an efficient production of insurance outputs; however, these
4
strategies must be designed so that the pure technical efficiency of operations is achieved in the
presence of increased size. We find that large microinsurers and for-profit microinsurers are best
able to improve performance when focusing on the use of state-of-the-art technology, whereas
concentrating on cost-minimizing input combinations is appropriate to address cost inefficiencies
for small and for non-profit microinsurers. Our findings should not be considered as
representative of the entire microinsurance industry, which is still very diverse in terms of
organization, size, and other characteristics. We thus see this analysis as a first step toward a
more extensive analysis of the performance of microinsurance programs.
The remainder of this paper is structured as follows. Section 2 presents an overview of
performance measurement in the field of microinsurance and an outline of related literature on
efficiency and microfinance. Section 3 introduces our methodology and the data used in the
empirical analysis. Section 4 presents the empirical results. Section 5 concludes.
2 PERFORMANCE OF MICROINSURANCE PROGRAMS AND RELATED LITERATURE
Performance of Microinsurance Programs: Review of Existing Approaches
Microinsurance programs provide insurance services to low-income populations and small
businesses in developing countries. Microinsurance is typically characterized as a financial
arrangement to protect low-income people against specific perils in exchange for regular
premium payments proportionate to the likelihood and cost of the risk involved (see Churchill,
2007). As this definition implies, microinsurance serves the low-income population based on the
same fundamentals as regular insurance. A wide range of risks is covered, and products
comparable to those in regular insurance markets are provided.1 Common types of risks covered
are life, health, disability, and property (especially agricultural insurance).
1 Insurance product specifics and its relevance for customers, however, significantly deviate from regular insurance
markets due to the different requirements of the low-income market such as, for example, irregular incomes and a higher demand for basic health and life risk coverage (Churchill, 2007; McCord, 2009).
5
Despite the growing policy interest in microinsurance, little academic attention has been paid to
this market; indeed, management of such organizations has not yet been discussed in the
literature. Recent discussion by both academics and practitioners focuses on the need for
microinsurance programs to become viable; that is, these programs need to stop relying on short-
term funding via subsidies. In the absence of this source of funding, these programs will be
subject to the same economic and market forces experienced by commercial insurers, and this
will require microinsurers to be managed professionally. Professional management, however,
requires transparent performance measurement. As a first step toward developing transparent
performance measurement processes, the Microinsurance Network set up a Performance
Indicators Working Group and initiated the development of 10 performance measures in 2006
and 2007. The 10 measures are: (1) net income ratio, (2) incurred expense ratio, (3) incurred
claims ratio, (4) renewal ratio, (5) promptness of claims settlement, (6) claims rejection ratio, (7)
growth ratio, (8) coverage ratio, (9) solvency ratio, and (10) liquidity ratio (for a definition of the
measures, see Wipf and Garand, 2008).
All these ratios are important measures of financial strength and underwriting success, and they
enhance the comparability and transparency of different schemes. Nevertheless, standard
financial ratio analysis cannot capture the diversity and various characteristics of microinsurance
providers. It is very challenging to choose a specific set of financial ratios that can accurately
indicate poor, average, and excellent performance in this sector of the insurance industry, and any
choice made implies a trade-off between the importance of specific goals.
As many microinsurance programs are set up as non-profit schemes and social organizations, not
to mention that many are to a large extent financed by governments, often their objectives are not
limited to financial performance. Like many microfinance institutions (MFIs), microinsurers have
both financial and social objectives (see Gutiérrez-Nieto, Serrano-Cinca, and Mar Molinero,
2009). The social function of microinsurers, that is, providing protection against specific perils
6
thus facilitating economic growth and mitigating poverty, inequality, and vulnerability, is a
crucial aspect in evaluating their performance. The Performance Indicators Working Group
discussed four potential social measures for reflecting the social function that many microinsurers
have a mandate to fulfill (see Wipf and Garand, 2008): (1) the social investment ratio, defined as
total expenditure on information, education, and communication divided by total expenditure of
the program; (2) the percent of insured below the poverty line, defined as the number of insured
below the poverty line divided by the total number of insured; (3) the value of incurred claims in
comparison to client annual income; and (4) the cost of benefits provided in comparison to the
annual premium.
In practice, using such measures requires a clear definition of the poverty line and guidelines as
to what should be counted as annual income because many insured people receive benefits in
kind and services instead of cash income. Besides these flaws of the social measures, we believe
that the existing 10 performance measures can also illustrate social performance in many cases.
For example, the higher the coverage ratio is, the higher the protection of the target audience,
and, consequently, the higher the social benefit. Moreover, the social measure (4) is very similar
to the performance measure (3), the incurred claims ratio. The performance measures can,
however, only partly capture the diversity of microinsurers with respect to their distinct
objectives. An advantage of the frontier efficiency methodology is that it can accommodate
traditional measures that reflect financial performance as well as other measures, for example,
reflecting social performance. A social output measure thus will be incorporated in the efficiency
analysis.
Related Literature: Efficiency and Microfinance
Our paper is related to two branches of the literature. The first is the broad literature on efficiency
in developed insurance markets. Frontier efficiency techniques have been employed in the study
7
of numerous insurance markets. In fact, efficiency measurement is one of the most rapidly
growing areas of research, particularly that involving the insurance sector. Eling and Luhnen
(2010a) surveyed 95 studies on efficiency measurement in the insurance industry. Recent work in
the field addresses methodological aspects as well as new areas of application, including
emerging markets such as China and Taiwan. Frontier efficiency methods are now widely
accepted for benchmarking in the insurance industry because, unlike many other industries, the
production function for these institutions is unknown. This is also the situation faced by
microinsurance programs. However, none of the 95 papers reviewed by Eling and Luhnen
(2010a) contain an efficiency analysis of microinsurance.
The second stream of the literature to which our paper is related is that on microfinance where
frontier efficiency techniques are already in use. One of the first works to measure the efficiency
of MFIs is Gutiérrez-Nieto, Serrano-Cinca, and Mar Molinero (2007). The authors applied DEA
to a sample of 30 Latin American MFIs for which data were obtained from the Microrate
database for 2003. They tested 21 specifications and used principal component analysis to
explain efficiency scores by means of four principal components. Hermes, Lensink, and Meesters
(2008) used stochastic frontier analysis (SFA) to evaluate the trade-off between outreach to the
poor and the efficiency of MFIs. They analyzed 435 MFIs from the Microfinance Information
eXchange (MIX) database from 1999 to 2007 and found that the outreach and efficiency of MFIs
were negatively correlated. Focusing on the country-level financial environment and using the
same dataset and methodology, Hermes, Lensink, and Meesters (2009) found a positive
relationship between measures of financial development and MFI efficiency. Bassem (2008) used
DEA to investigate the efficiency of 35 MFIs from the MIX database during the period 2004 to
2005, focusing on the Mediterranean zone and its specific characteristics. Gutiérrez-Nieto,
Serrano-Cinca, and Mar Molinero (2009), again applying DEA to the MIX database, analyzed the
efficiency of 89 MFIs for 2003. They added two measures of social performance (number of
8
women borrowers and a poverty reach index) to the traditional analysis of financial efficiency
and analyzed the relationships between social and financial efficiency as well as efficiency and
other measures, such as profitability. Finally, Haq, Skully, and Pathan (2010) examined the cost
efficiency of 39 MFIs across Africa, Asia, and Latin America using DEA and compared different
formal and semiformal organizational forms such as bank MFIs (formal) and nongovernmental
organization MFIs (semiformal).2
The literature on MFI efficiency is especially helpful in emphasizing the applicability of frontier
efficiency techniques to the micro field and in understanding how the standard financial
efficiency measures might be adapted, for example, to account for social performance measures.
To date, however, no study exists that analyzes the efficiency of microinsurance programs. Due
to differences in the business model and the measurement of efficiency between insurance and
other financial institutions,3 the methods and results found for MFIs cannot be directly transferred
to microinsurance; however, we can use various aspects from the microfinance literature in the
empirical section of this paper. The literature review also shows that there is already an
established database for empirical work in microfinance (the MIX database), which is not the
case in microinsurance. The following empirical study should serve as a first step toward filling
this gap.
2 A number of papers analyze related empirical questions using techniques other than DEA or SFA. For example,
Gutiérrez-Nieto and Serrano-Cinca (2007) analyzed factors explaining the rating of MFIs using nonparametric tests, Spearman’s coefficient correlations, and an ordinal regression. They found that larger MFIs, on average, were more profitable and less risky, which is why they had a better rating. Mersland and Strøm (2009) examined the relationship between firm performance and corporate governance in MFIs using random effects panel data estimation and a self-constructed global dataset collected from third-party rating agencies. Their results indicated that financial performance was better with local rather than international directors, an internal board auditor, and a female CEO. Caudill, Gropper, and Hartarska (2009) estimated a mixture model, which revealed that half the MFIs were able to operate with reduced costs over time.
3 For example, Yuan and Phillips (2008) outlined differences in efficiency measurements between banking and insurance, especially in the definition of inputs and outputs.
9
3 METHODOLOGY AND DATA
Methodology
DEA is the most commonly used method for analyzing frontier efficiency in insurance markets
(see Eling and Luhnen, 2010a) and is especially suitable for the small sample size available for
this analysis. We use DEA to estimate technical, allocative, and cost efficiency, assuming input
orientation and variable returns to scale (VRS). Our model specification allows us to compute
Shephard input-oriented distance functions (see Shephard, 1970), which are the reciprocals of the
Farrell (1957) input efficiency measures. We also review whether microinsurers operate at
constant returns to scale (CRS) or if there exist scale inefficiencies represented by increasing
(IRS) and decreasing returns to scale (DRS). To account for the small sample size and the
intrinsic problem of measurement error in standard DEA, we apply the bootstrapping procedure
introduced by Simar and Wilson (2000a). We thus systematically take into account the sensitivity
of efficiency measures to sampling variation and estimate bias-corrected DEA efficiency scores.
To make inferences about the development of efficiency over time, we use the definition of
Caves, Christensen, and Diewert (1982) for the Malmquist index of total factor productivity
(TFP). We subdivide TFP change into its principal sources: technical change (i.e., a change in
production technology between two periods associated with a shift of the production frontier) and
technical efficiency change (i.e., a change of the distance of microinsurers to the efficient frontier
between two periods). The latter is further separated into pure technical efficiency change,
measured relative to the VRS frontier, and scale efficiency change. Because we focus on the
input-oriented model in this paper, we estimate input-oriented TFP. Values for TFP or any of its
components greater than unity indicate progress in efficiency and values smaller than unity
regress. To allow for statistical interpretation and to account for the sensitivity of the TFP
10
measure and its decompositions to sampling variation, we use the bootstrapping procedure
proposed by Simar and Wilson (1999).
To determine the drivers of firm performance and isolate their impact on efficiency, we analyze
firm-specific environmental variables using a two-stage double bootstrap approach proposed by
Simar and Wilson (2007).4 The truncated regression of environmental variables on the bias-
corrected efficiency measures is complemented by calculating confidence intervals for the
maximum likelihood regression coefficients. This two-stage double bootstrap approach proposed
by Simar and Wilson (2007) is a recent innovation in the field of DEA that overcomes the
inference problems of classical censored (tobit) models for second-stage regressions and allows a
methodologically robust analysis of efficiency determinants.
Data
Data on 20 microinsurance schemes that provide life and health insurance is available from the
Microinsurance Network. The data contain balance sheet and statement of income information
from 2004 to 2008. An unbalanced panel of 73 firm-years is available for analysis. The financial
statements data provide an ideal basis for efficiency analysis as most of the inputs and outputs
used in efficiency analysis rely on data provided in the balance sheet and the statement of
income. We have seven companies each for Africa and Asia and six companies for Latin
America.
As is common in the literature, we use labor, business services, debt capital, and equity capital as
inputs (see Cummins, Rubio-Misas, and Zi, 2004). Labor and business services were merged into
operating expenses (including commissions) as a single variable, a frequent practice in
international efficiency studies due to limited data availability (e.g., Ennsfellner, Lewis, and
4 We follow the double bootstrap procedure proposed by Simar and Wilson (2007) using a slight variation in the
estimation of the first-stage bias correction in that we apply the bootstrapping approach introduced by Simar and Wilson (2000a). These two approaches are, however, similar and differ only in the smoothing procedure used (see Simar and Wilson, 2007, p. 43).
11
Anderson, 2004; Fenn et al., 2008). The price of labor, determined by the ILO Main Statistics
and October Inquiry, is used to proxy the price of operating expenses (see, e.g., Fenn et al., 2008;
Eling and Luhnen, 2010b). Data are not available for all countries and years, so we need to proxy
the price of labor for missing values.5 The price of debt capital is determined by region-specific
J.P. Morgan Emerging Markets Bond Indices (JPM EMBI GLOBAL index series) for each year
of the sample period. We use rolling window five-year averages of the yearly rates of total return
of regional Morgan Stanley Capital International Emerging Markets Indices (MSCI EM index
series; all data are obtained from the Thomson Datastream database) as a proxy for the price of
equity capital. To ensure the comparability of all monetary values, we deflate all inputs by the
consumer price index to the base year 2004 (see, e.g., Cummins and Zi, 1998). Annual country-
specific consumer price indices are obtained from the International Monetary Fund (IMF).
In specifying the outputs, we use the value-added approach (Grace and Timme, 1992; Berger et
al., 2000; Leverty and Grace, 2010). Accordingly, we distinguish between the three essential
services provided by insurance companies: risk-pooling/bearing, financial services, and
intermediation. To proxy risk-pooling/bearing and financial services, we follow Yuengert (1993)
and use the value of current losses paid plus additions to reserves (real incurred losses). As the
microinsurance programs included in the database provide life and health insurance coverage, the
real value of net incurred benefits best represents the risk-pooling/bearing and financial services
output (see Erhemjamts and Leverty, 2010). Benefits are highly correlated with the financial
services function, which is why we consider real incurred benefits as representing risk-
5 Price of labor for the whole observation period is available for Bangladesh, Indonesia, Mexico, and Peru from the
ILO Main Statistics and October Inquiry using average wages for occupations in the insurance industry. Values for Benin, Bolivia, Burkina Faso, Cambodia, India, Mali, Senegal, and Togo are approximated using the same data source from earlier years (1990–2003) and adjusting the latest available data point to the values needed in our analysis (2004–2008) according to the annual per capita GDP growth that is available from the IMF. The price of labor for Congo, Vietnam, and Guatemala, for which no historical data are available, is estimated by adjusting the price of labor of all other countries in the same region according to their relative difference in per capita GDP to the country we need to find a proxy price of labor. The mean of these values is then used as the price of labor. We also applied broader indices for Africa, Asia, and Latin America to check the robustness of the DEA results and found no significant deviations.
12
pooling/bearing and financial services both (see Berger et al., 2000). Microinsurers, like regular
insurers, receive funds from their customers and invest them until they are required to pay
benefits or the funds are withdrawn by the policyholder in the case of asset accumulation
products (see Cummins and Weiss, 2000). The output variable, which proxies the intermediation
function, is thus the real value of total investments.
In an additional model, we complement the technical, allocative, and cost efficiency analysis by
implementing a further output variable that represents the microinsurer’s social function. For this
purpose, we opt for a measure that reveals the capacity of microinsurers to reach their target
population. Along with the specification of a coverage ratio by the Performance Indicators
Working Group of the Microinsurance Network (see Wipf and Garand, 2008), we define the
additional output as the number of people insured relative to the target population as stated by the
respective microinsurer. Note that the coverage ratio is one of the 10 key performance measures
in the performance indicators handbook and not one of the four additional social measures.6 We
believe, however, that the coverage ratio can be interpreted as a social output measure, well
reflecting the social function of microinsurance companies. 7
6 Feedback at the 5th International Microinsurance Conference clearly confirmed the importance of adding social
measures to the “classic” efficiency measurement framework because an analysis neglecting social aspects might not be accepted by a large fraction of the microinsurance community. As mentioned, an important advantage of the frontier efficiency technique is that it can provide two types of analysis, one that is restricted to financial measures and another that also considers social measures. Thus, the method can accommodate different measurement purposes and be of relevance to different target groups, including managers, regulators, policymakers, and development aid workers. In this context, the choice of social measures is an open question and one that was critically addressed at the microinsurance conference. From a methodological point of view, however, it does not matter which measure to consider; more important is the question of data availability and whether an inclusion makes sense from a theoretical point of view. Therefore, we would be interested in an analysis of further social measures whenever such data are available. Note also that Gutiérrez-Nieto, Serrano-Cinca, and Mar Molinero (2007) in their analysis of MFIs expanded the traditional efficiency measurement approach from banking by social output measures. For this purpose they relied on a framework developed by Yaron (1994) consisting of outreach and sustainability that is popular in the performance assessment of MFIs. Outreach and sustainability are measured by the number of loans and by operating expenses, two aspects that are also included in our analysis.
7 A related discussion from the insurance literature is the question of different organizational types (stocks and mutuals), their main types of goals, and resulting agency conflicts. The two principal hypotheses in this area are the expense preference hypothesis (Mester, 1991) and the managerial discretion hypothesis (see Mayers and Smith, 1988; for more details on both hypotheses see Cummins and Weiss, 2000). Stock insurer’s primary goal is to ensure high profits with a given solvency level set by regulators or rating agencies. The primary goal of a mutual insurer is fulfilling owner demand and high-quality service. The fulfillment of owner demand is
13
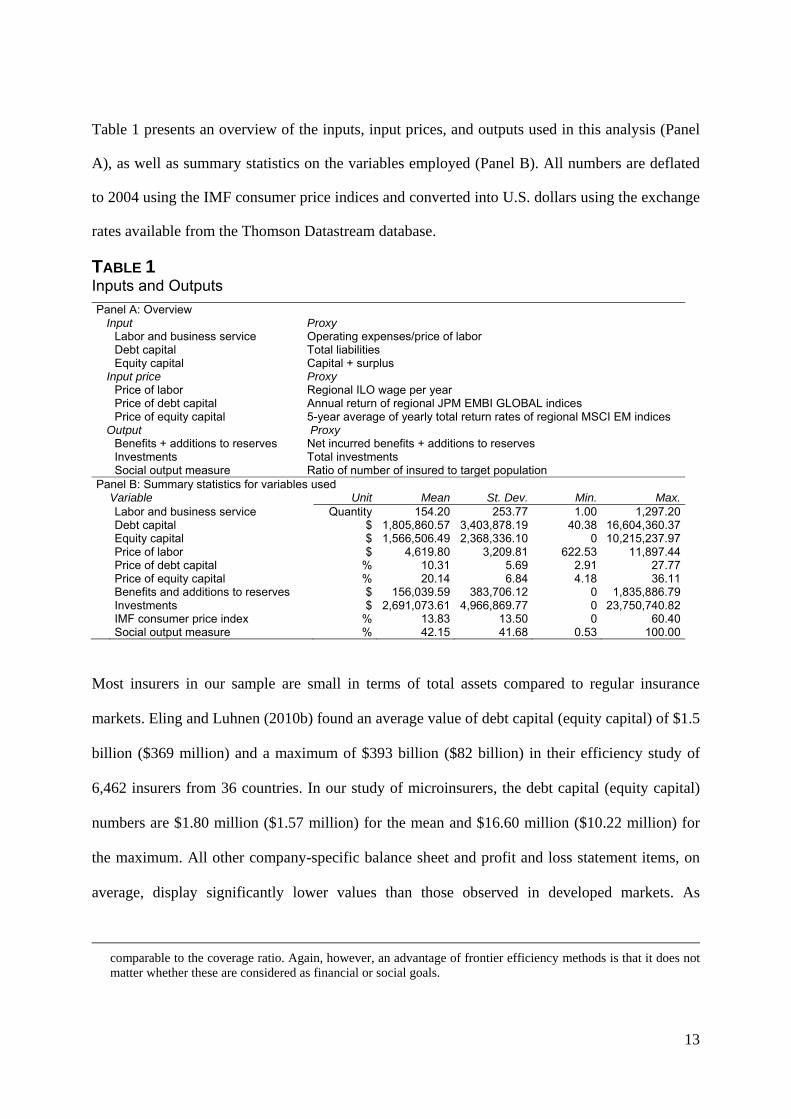
Table 1 presents an overview of the inputs, input prices, and outputs used in this analysis (Panel
A), as well as summary statistics on the variables employed (Panel B). All numbers are deflated
to 2004 using the IMF consumer price indices and converted into U.S. dollars using the exchange
rates available from the Thomson Datastream database.
TABLE 1 Inputs and Outputs
Panel A: Overview Input Proxy Labor and business service Operating expenses/price of labor Debt capital Total liabilities Equity capital Capital + surplus Input price Proxy Price of labor Regional ILO wage per year Price of debt capital Annual return of regional JPM EMBI GLOBAL indices Price of equity capital 5-year average of yearly total return rates of regional MSCI EM indices Output Proxy Benefits + additions to reserves Net incurred benefits + additions to reserves Investments Total investments Social output measure Ratio of number of insured to target population Panel B: Summary statistics for variables used Variable Unit Mean St. Dev. Min. Max. Labor and business service Quantity 154.20 253.77 1.00 1,297.20 Debt capital $ 1,805,860.57 3,403,878.19 40.38 16,604,360.37 Equity capital $ 1,566,506.49 2,368,336.10 0 10,215,237.97 Price of labor $ 4,619.80 3,209.81 622.53 11,897.44 Price of debt capital % 10.31 5.69 2.91 27.77 Price of equity capital % 20.14 6.84 4.18 36.11 Benefits and additions to reserves $ 156,039.59 383,706.12 0 1,835,886.79 Investments $ 2,691,073.61 4,966,869.77 0 23,750,740.82 IMF consumer price index % 13.83 13.50 0 60.40 Social output measure % 42.15 41.68 0.53 100.00
Most insurers in our sample are small in terms of total assets compared to regular insurance
markets. Eling and Luhnen (2010b) found an average value of debt capital (equity capital) of $1.5
billion ($369 million) and a maximum of $393 billion ($82 billion) in their efficiency study of
6,462 insurers from 36 countries. In our study of microinsurers, the debt capital (equity capital)
numbers are $1.80 million ($1.57 million) for the mean and $16.60 million ($10.22 million) for
the maximum. All other company-specific balance sheet and profit and loss statement items, on
average, display significantly lower values than those observed in developed markets. As
comparable to the coverage ratio. Again, however, an advantage of frontier efficiency methods is that it does not matter whether these are considered as financial or social goals.
14
expected, the price of labor is much lower ($4,620 vs. $29,753 in Eling and Luhnen, 2010b),
whereas the prices of debt (10.31 percent vs. 5.09 percent) and equity (20.14 percent vs. 12.84
percent) are higher compared to figures found by Eling and Luhnen (2010b). This is an
economically meaningful finding since equity and debt holders in emerging markets require a
higher risk premium compared to investors in regular markets. Moreover, inflation, reflected by
the consumer price index, is 10.09 percent higher than in Eling and Luhnen (2010b).8
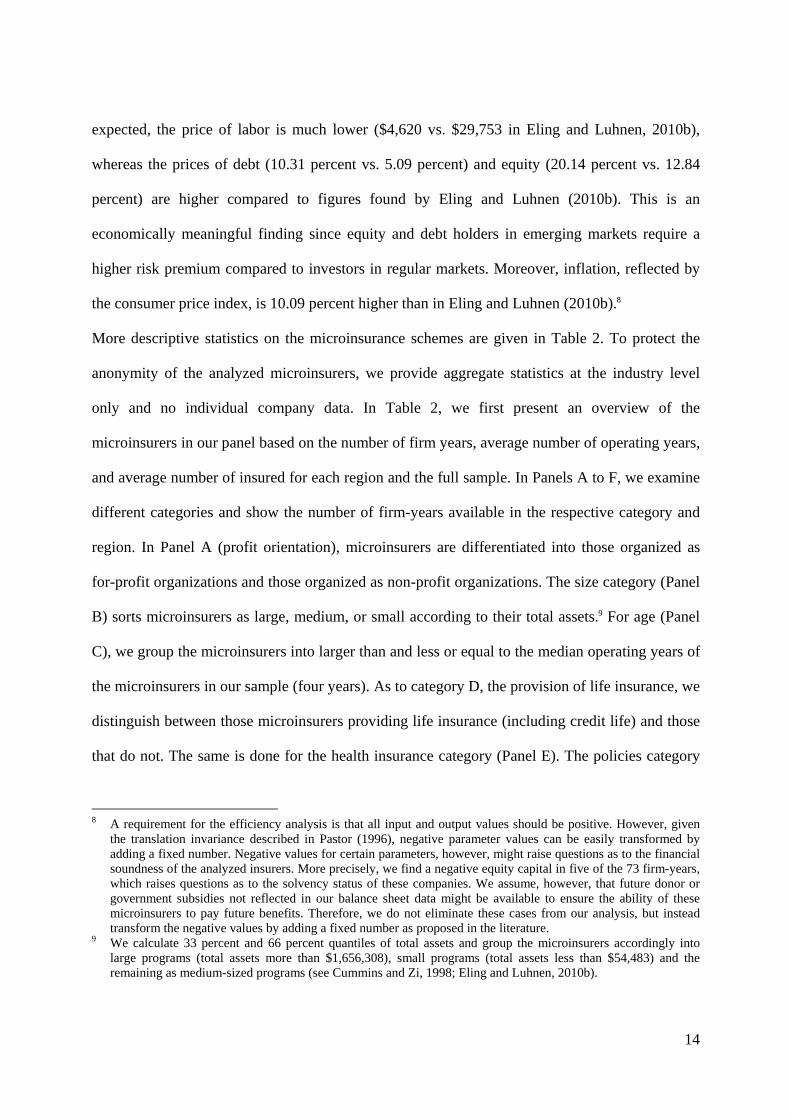
More descriptive statistics on the microinsurance schemes are given in Table 2. To protect the
anonymity of the analyzed microinsurers, we provide aggregate statistics at the industry level
only and no individual company data. In Table 2, we first present an overview of the
microinsurers in our panel based on the number of firm years, average number of operating years,
and average number of insured for each region and the full sample. In Panels A to F, we examine
different categories and show the number of firm-years available in the respective category and
region. In Panel A (profit orientation), microinsurers are differentiated into those organized as
for-profit organizations and those organized as non-profit organizations. The size category (Panel
B) sorts microinsurers as large, medium, or small according to their total assets.9 For age (Panel
C), we group the microinsurers into larger than and less or equal to the median operating years of
the microinsurers in our sample (four years). As to category D, the provision of life insurance, we
distinguish between those microinsurers providing life insurance (including credit life) and those
that do not. The same is done for the health insurance category (Panel E). The policies category
8 A requirement for the efficiency analysis is that all input and output values should be positive. However, given
the translation invariance described in Pastor (1996), negative parameter values can be easily transformed by adding a fixed number. Negative values for certain parameters, however, might raise questions as to the financial soundness of the analyzed insurers. More precisely, we find a negative equity capital in five of the 73 firm-years, which raises questions as to the solvency status of these companies. We assume, however, that future donor or government subsidies not reflected in our balance sheet data might be available to ensure the ability of these microinsurers to pay future benefits. Therefore, we do not eliminate these cases from our analysis, but instead transform the negative values by adding a fixed number as proposed in the literature.
9 We calculate 33 percent and 66 percent quantiles of total assets and group the microinsurers accordingly into large programs (total assets more than $1,656,308), small programs (total assets less than $54,483) and the remaining as medium-sized programs (see Cummins and Zi, 1998; Eling and Luhnen, 2010b).
15
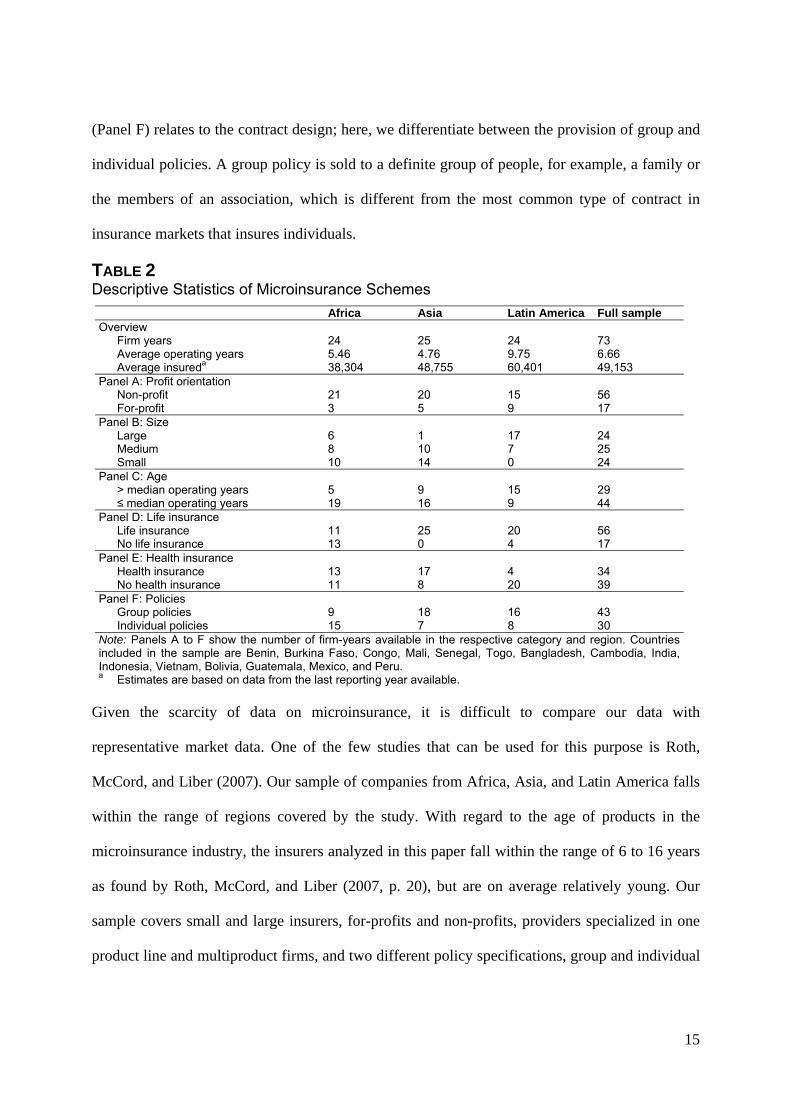
(Panel F) relates to the contract design; here, we differentiate between the provision of group and
individual policies. A group policy is sold to a definite group of people, for example, a family or
the members of an association, which is different from the most common type of contract in
insurance markets that insures individuals.
TABLE 2 Descriptive Statistics of Microinsurance Schemes
Africa Asia Latin America Full sampleOverview Firm years 24 25 24 73 Average operating years 5.46 4.76 9.75 6.66 Average insureda 38,304 48,755 60,401 49,153 Panel A: Profit orientation Non-profit 21 20 15 56 For-profit 3 5 9 17 Panel B: Size Large 6 1 17 24 Medium 8 10 7 25 Small 10 14 0 24 Panel C: Age > median operating years 5 9 15 29 ≤ median operating years 19 16 9 44 Panel D: Life insurance Life insurance 11 25 20 56 No life insurance 13 0 4 17 Panel E: Health insurance Health insurance 13 17 4 34 No health insurance 11 8 20 39 Panel F: Policies Group policies 9 18 16 43 Individual policies 15 7 8 30 Note: Panels A to F show the number of firm-years available in the respective category and region. Countries included in the sample are Benin, Burkina Faso, Congo, Mali, Senegal, Togo, Bangladesh, Cambodia, India, Indonesia, Vietnam, Bolivia, Guatemala, Mexico, and Peru. a Estimates are based on data from the last reporting year available.
Given the scarcity of data on microinsurance, it is difficult to compare our data with
representative market data. One of the few studies that can be used for this purpose is Roth,
McCord, and Liber (2007). Our sample of companies from Africa, Asia, and Latin America falls
within the range of regions covered by the study. With regard to the age of products in the
microinsurance industry, the insurers analyzed in this paper fall within the range of 6 to 16 years
as found by Roth, McCord, and Liber (2007, p. 20), but are on average relatively young. Our
sample covers small and large insurers, for-profits and non-profits, providers specialized in one
product line and multiproduct firms, and two different policy specifications, group and individual
16
policies. Thus, our data cover many of the typical characteristics found in the industry, but, given
the small sample size, it should not be considered as representative of the entire microinsurance
industry, which is very diverse and still in its infancy.
Currently, the data from the Microinsurance Network are the only data available for DEA of
microinsurers, which is why our sample is relatively small. The MIX database, which is much
larger and contains a broad spread of information regarding microfinance, does contain some
information on MFIs selling insurance products, but the data are different from what is typically
used for DEA of insurance companies. We also include traditional databases, such as A.M. Best,
in the search for data on microinsurance companies. For example, the 2007 edition of the A.M.
Best Non-U.S. dataset contains more than 600 companies from emerging or third-world
countries; however, most of these appear to be branches of large multinational companies. It
might be interesting to compare these companies with the microinsurers analyzed in this paper,
but we do not think that these 600 insurance companies can be considered “microinsurers.” Thus
we do not include them in this analysis.
To ensure data quality and avoid potential bias during the data collection, the Microinsurance
Network set up some fundamental requirements as to consistency, transparency, and accuracy of
the collected data. The data we use and the data collection process are also described in Wipf and
Garand (2008). The dataset is based on a survey conducted by the Performance Indicators
Working Group and was analyzed during the group’s workshops in 2006 and 2007 and then
expanded in 2008. To avoid a selection and a survivorship bias, we use all data collected and
include insurers that are active as well as insurers that stopped reporting during the investigation
period. As mentioned, the data represent a small, but comprehensive snapshot of the industry in
terms of geographical coverage, age, size, organization, profit orientation, and product coverage.
However, given that the full population of microinsurers is not known, we cannot definitely
eliminate the possibility that the sample is biased in some way, for example, perhaps more
17
efficient programs have more comprehensive data or only above-average microinsurers
participate in such a survey. But given the careful and transparent data collection process by the
Microinsurance Network, we believe that the data are of sufficient quality to conduct a DEA and
to yield some conclusions for the sample at hand. Whether these findings can be generalized to
microinsurers out of sample, however, needs to be validated by future research.
4 EMPIRICAL RESULTS
We analyze DEA technical, allocative, and cost efficiency values and returns to scale for the
years 2004 to 2008 for all microinsurers in our panel. We look at three regions (Africa, Asia,
Latin America), three company sizes (large, medium, small), two forms of profit orientation
(non-profit, for-profit), different stages of the life cycle (age), two product categories (life,
health), and two types of policies (individual, group). Because sensitivity to measurement error is
an intrinsic problem of standard DEA, we apply the bootstrapping procedure introduced by Simar
and Wilson (2000a). The efficiency values are estimated separately for all years. Thus, we cannot
directly make inferences about the development of efficiency over time. Therefore, we estimate
TFP and its decompositions in a second step and apply the bootstrapping procedure proposed by
Simar and Wilson (1999). In a third step, we estimate a truncated regression model to analyze
determinants of efficiency according to Simar and Wilson (2007). In the last step, we
complement the efficiency analysis by including a social output measure.
Technical, Allocative, and Cost Efficiency
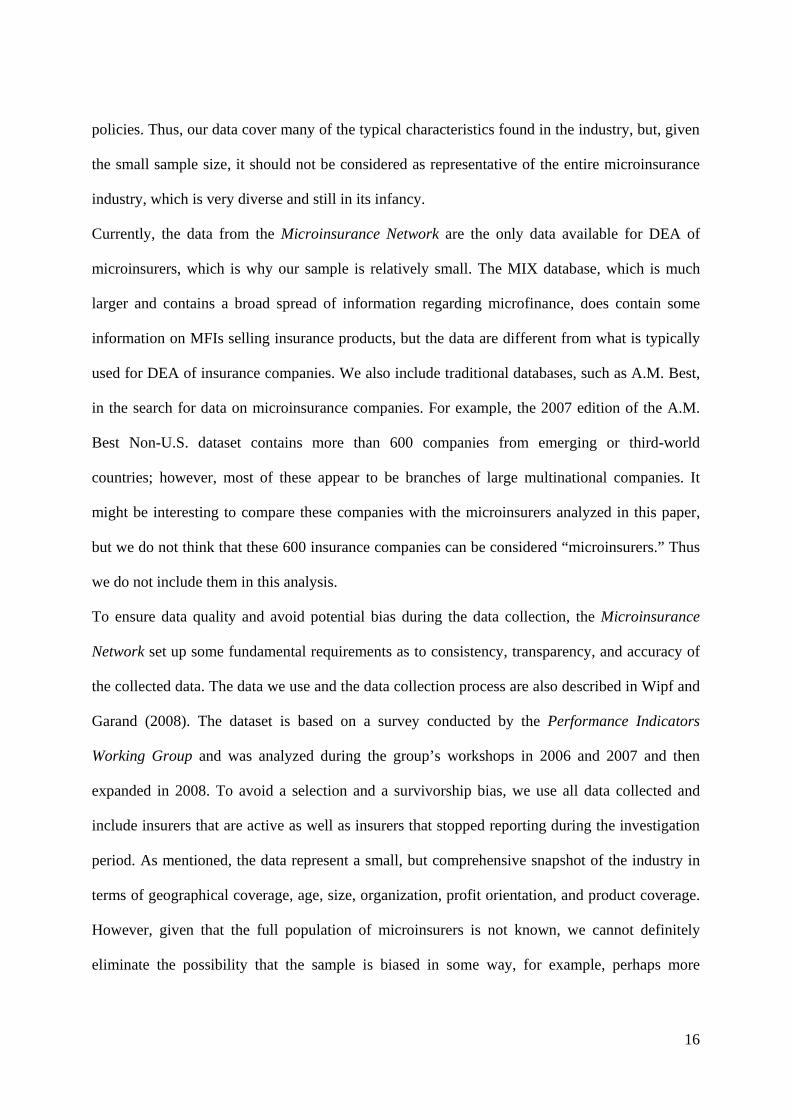
Table 3 displays the bias-corrected DEA Farrell (1957) efficiency values for technical, allocative,
and cost efficiency for 2004 to 2008. We also show mean values for each year and region in the
panel as well as for the full sample. The efficiency values are estimated separately for all years
and based on a one-world frontier. Note that in Table 3 we did not include the social output
measure; this analysis is presented later (see subsection Analysis Including Social Output
Measure).
18
TABLE 3 Results of the DEA
Technical efficiency Allocative efficiency Cost efficiency
2004 2005 2006 2007 2008 Mean 2004 2005 2006 2007 2008 Mean 2004 2005 2006 2007 2008 Mean
Panel A: Comparison of 20 microinsurance programs
Africa
1 n/a n/a 0.92 0.91 0.98 0.94 n/a n/a 0.99 0.98 1.00 0.99 n/a n/a 0.90 0.89 0.98 0.92
2 0.85 0.96 0.96 0.94 n/a 0.93 0.01 0.03 0.01 0.03 n/a 0.02 0.01 0.02 0.01 0.02 n/a 0.02
3 n/a n/a 0.91 0.91 n/a 0.91 n/a n/a 0.98 0.98 n/a 0.98 n/a n/a 0.90 0.89 n/a 0.89
4 n/a 0.90 0.91 0.91 0.98 0.93 n/a 0.98 0.99 0.86 1.00 0.96 n/a 0.88 0.90 0.78 0.98 0.89
5 0.79 0.90 0.92 0.91 0.98 0.90 0.79 0.97 0.92 0.88 1.00 0.92 0.62 0.88 0.84 0.79 0.98 0.82
6 n/a n/a n/a 0.91 0.98 0.95 n/a n/a n/a 0.18 1.00 0.61 n/a n/a n/a 0.16 0.98 0.57
7 0.79 0.90 0.92 0.91 n/a 0.88 0.87 0.92 0.96 0.87 n/a 0.91 0.69 0.83 0.88 0.79 n/a 0.80
Asia
8 0.79 0.90 0.91 0.91 n/a 0.88 0.35 0.46 0.36 0.35 n/a 0.38 0.27 0.42 0.33 0.32 n/a 0.33
9 0.78 0.90 0.91 0.91 n/a 0.88 0.91 0.44 0.46 0.56 n/a 0.58 0.71 0.40 0.42 0.51 n/a 0.51
10 n/a n/a 0.92 0.91 0.98 0.94 n/a n/a 0.98 0.98 0.57 0.84 n/a n/a 0.90 0.88 0.56 0.78
11 n/a n/a 0.91 0.91 0.98 0.94 n/a n/a 0.98 0.45 0.61 0.68 n/a n/a 0.90 0.41 0.60 0.64
12 n/a 0.90 0.92 0.91 0.98 0.93 n/a 0.37 0.33 0.07 0.16 0.23 n/a 0.33 0.30 0.07 0.16 0.21
13 0.78 0.90 0.92 0.90 0.98 0.90 0.98 0.96 0.26 0.16 0.20 0.49 0.76 0.86 0.24 0.15 0.19 0.44
14 n/a n/a n/a 0.91 0.78 0.84 n/a n/a n/a 0.18 0.23 0.20 n/a n/a n/a 0.16 0.18 0.17
Latin America
15 0.84 0.90 0.89 0.80 0.98 0.89 0.67 0.89 0.96 0.95 1.00 0.90 0.57 0.81 0.85 0.76 0.98 0.80
16 n/a n/a 0.92 0.91 n/a 0.91 n/a n/a 0.98 0.98 n/a 0.98 n/a n/a 0.90 0.89 n/a 0.89
17 0.78 0.90 0.91 0.91 n/a 0.88 0.82 0.99 0.98 0.98 n/a 0.95 0.64 0.90 0.90 0.89 n/a 0.83
18 0.80 0.90 0.62 0.59 0.98 0.78 0.67 0.77 0.88 0.87 1.00 0.84 0.54 0.70 0.55 0.51 0.98 0.66
19 0.11 0.28 0.08 0.08 n/a 0.14 0.54 0.49 0.85 0.96 n/a 0.62 0.06 0.14 0.06 0.08 n/a 0.08
20 0.79 0.90 0.92 0.91 n/a 0.88 1.00 1.00 1.00 1.00 n/a 1.00 0.79 0.90 0.92 0.90 n/a 0.88
Panel B: Comparison of regions
Africa 0.81 0.92 0.92 0.91 0.98 0.92 0.54 0.71 0.80 0.68 1.00 0.76 0.44 0.65 0.74 0.62 0.98 0.70
(t-statistic) Africa : Asia (0.88) Africa : Asia (2.69)*** Africa : Asia (2.82)***
Asia 0.78 0.90 0.92 0.91 0.94 0.90 0.74 0.56 0.56 0.39 0.36 0.49 0.58 0.50 0.52 0.36 0.34 0.44
(t-statistic) Asia : Latin America (2.67)*** Asia : Latin America (-5.77)*** Asia : Latin America (-2.87)***
Latin America
0.67 0.78 0.72 0.70 0.98 0.74 0.78 0.88 0.97 0.96 1.00 0.93 0.52 0.69 0.70 0.67 0.98 0.69
(t-statistic) Latin America : Africa (-2.91)*** Latin America : Africa (1.55) Latin America : Africa (-0.18)
Full sample 0.74 0.86 0.85 0.85 0.97 0.85 0.70 0.72 0.76 0.64 0.71 0.71 0.51 0.62 0.65 0.54 0.69 0.60
Note: * (**, ***) indicates significant differences between mean efficiency scores at 10% (5%, 1%).
Table 3 shows that cost efficiency ranges between 0.01 and 0.98 with a mean of 0.60 for the full
sample. Splitting up cost efficiency into its principal components—technical and allocative
efficiency—reveals that inefficient resource allocation makes a strong contribution to overall cost
inefficiency. Technical efficiency values range from 0.08 to 0.98 with a mean of 0.85 for the full
19
sample, indicating that microinsurers could improve technical efficiency on average by 0.15.
These values are at a relatively high level but still leave room for some microinsurers to improve
their production technology. Allocative efficiency is lower than technical efficiency with a mean
of 0.71 for the full sample, indicating that much of the cost inefficiency could be addressed by
focusing on cost-minimizing input combinations.
Overall, the DEA efficiency estimates are relatively high compared to those found in studies of
developed insurance markets (e.g., Eling and Luhnen, 2010b). Frontier efficiency analysis,
however, provides a comparison between companies in the same market; that is, the peer group
consists of the other microinsurers, so we cannot use our results to conclude that microinsurers
are more efficient compared to insurers in developed markets. We also have a relatively
heterogeneous sample, consisting of a variety of insurance schemes of different sizes, profit
orientations, regional focus, and product ranges. Statistical noise might affect our analysis. It
might thus be useful to complement the mathematical programming method (DEA) with an
econometric frontier efficiency method, such as SFA, that is able to distinguish between random
departures from efficiency and true inefficiency.10 Finally, the small sample size leads to upward-
biased efficiency estimates (see, e.g., Zhang and Bartles, 1998), a problem we address by
employing the bootstrapping procedure presented in Simar and Wilson (2000a).11
Comparing the efficiency estimates for Africa, Asia, and Latin America in Panel B of Table 3
sheds light on the differences between these three regions. In our dataset, microinsurers from
Africa (0.70) and Latin America (0.69) are the most cost efficient with Asian microinsurers
10 We conduct an SFA, but the results need to be viewed with caution given the small sample size; therefore, we do
not include them here. SFA might, however, be an interesting additional tool to complement the DEA findings in the future when more data become available. The results of the SFA are available from the authors upon request.
11 The mean absolute values of the bias estimates from 10,000 bootstrap replications are 0.18 and 0.09 for technical and cost efficiency. The lower the bias estimate and its corresponding variability, the higher the robustness of the bias-corrected efficiency estimates. The values found for this analysis are in an acceptable range (see Simar and Wilson, 2000b, p. 72), indicating that our sample is sufficient to provide meaningful results. The size of the bias estimates suggests that the bias correction is important when absolute efficiency scores are considered; however, the correlation between the original and bias-corrected estimates is 96 percent for technical efficiency and 95 percent for cost efficiency, indicating that both sets of estimates provide similar conclusions.
20
(0.44) significantly lagging behind; however, the sources of cost inefficiency are quite different.
Africa (0.92) and Asia (0.90) show strong performance in the use of state-of-the-art production
technology (i.e., technical efficiency); Latin America (0.74) is significantly less successful in
achieving efficiency in production, but dominates allocative efficiency (0.93). The sources of cost
inefficiency primarily result from allocative inefficiency for Africa and Asia and from technical
inefficiency for Latin America. The results are especially interesting on the macro level because
microinsurance markets in Africa are usually considered the least covered in the world. In Asia,
on the other hand, these markets experienced strong and steady development in recent years. This
is due at least in part to government regulation of insurance markets aimed at increasing product
distribution, especially in rural areas, for example, India.12 As the results from our efficiency
analysis indicate, microinsurers in Asia are not able to efficiently allocate the increased funds
available.13
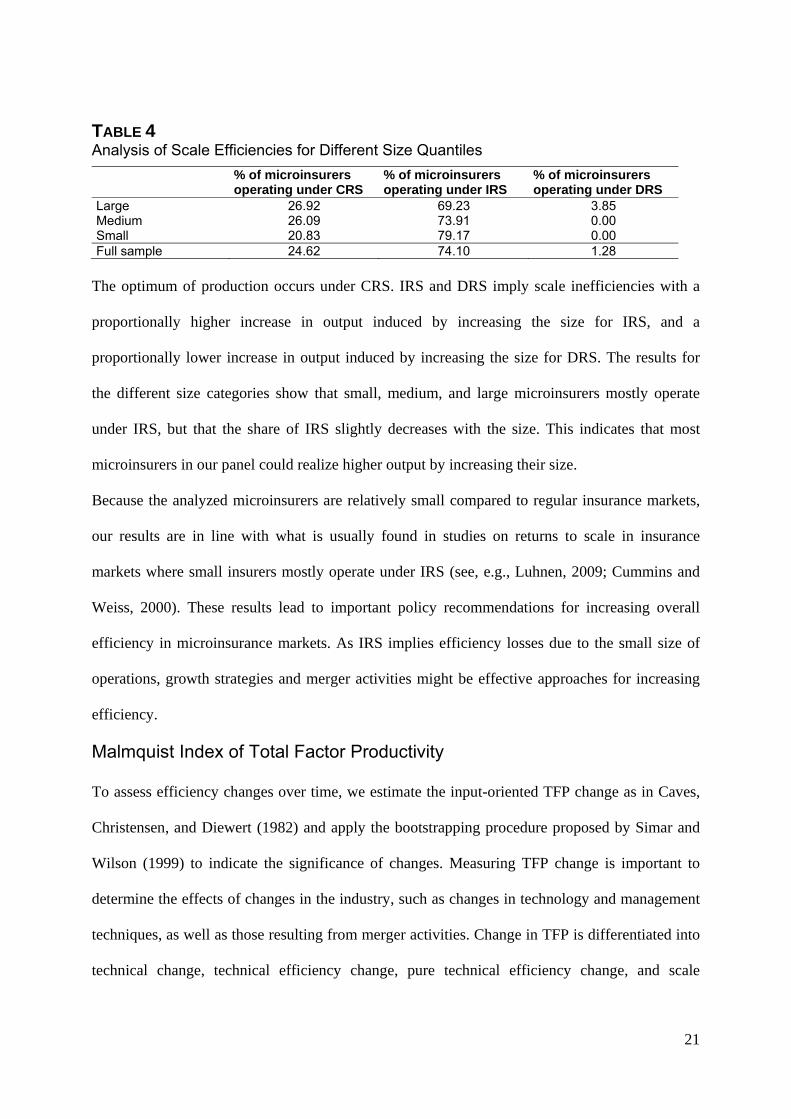
Returns to Scale
To analyze the nature of scale inefficiency, we estimate returns to scale for each microinsurer in
our sample. The results for different size categories (large, medium, small) and the full sample
are presented in Table 4. For each category, the share of microinsurers operating under CRS, IRS,
and DRS is displayed.
12 See Roth, McCord, and Liber (2007) for details on market coverage in developing countries. Eling and Luhnen
(2010b) document that the efficiency scores found in emerging markets are typically lower than those in advanced markets, which is why we expect a positive connection between market coverage and efficiency; however, this connection is only partly confirmed in this study.
13 To analyze the robustness of the efficiency values presented in Table 3, we follow Gutiérrez-Nieto, Serrano-Cinca, and Mar Molinero (2007) and estimate efficiency values for all feasible input-output combinations. Again, we consider input-oriented, bias-corrected technical efficiency values. With three inputs and two outputs, the total number of feasible input-output combinations is 21. Results for these 21 models are comparable to those in Table 3 and reported in Table A1 in the Appendix. This is an important finding because it indicates that even though the sample is small and the data might be noisy the results in Table 3 are relatively robust with regard to the model. However, no microinsurer is most (least) efficient under all specifications, illustrating that the choice of inputs and outputs is not irrelevant. This robustness test should not be interpreted as uncertainty with regard to the chosen inputs and outputs because the choice of inputs and outputs is standardized in the literature. Instead, it should serve as a test of whether the efficiency numbers are robust with regard to variations in the model setup.
21
TABLE 4 Analysis of Scale Efficiencies for Different Size Quantiles
% of microinsurers operating under CRS
% of microinsurers operating under IRS
% of microinsurers operating under DRS
Large 26.92 69.23 3.85 Medium 26.09 73.91 0.00 Small 20.83 79.17 0.00 Full sample 24.62 74.10 1.28
The optimum of production occurs under CRS. IRS and DRS imply scale inefficiencies with a
proportionally higher increase in output induced by increasing the size for IRS, and a
proportionally lower increase in output induced by increasing the size for DRS. The results for
the different size categories show that small, medium, and large microinsurers mostly operate
under IRS, but that the share of IRS slightly decreases with the size. This indicates that most
microinsurers in our panel could realize higher output by increasing their size.
Because the analyzed microinsurers are relatively small compared to regular insurance markets,
our results are in line with what is usually found in studies on returns to scale in insurance
markets where small insurers mostly operate under IRS (see, e.g., Luhnen, 2009; Cummins and
Weiss, 2000). These results lead to important policy recommendations for increasing overall
efficiency in microinsurance markets. As IRS implies efficiency losses due to the small size of
operations, growth strategies and merger activities might be effective approaches for increasing
efficiency.
Malmquist Index of Total Factor Productivity
To assess efficiency changes over time, we estimate the input-oriented TFP change as in Caves,
Christensen, and Diewert (1982) and apply the bootstrapping procedure proposed by Simar and
Wilson (1999) to indicate the significance of changes. Measuring TFP change is important to
determine the effects of changes in the industry, such as changes in technology and management
techniques, as well as those resulting from merger activities. Change in TFP is differentiated into
technical change, technical efficiency change, pure technical efficiency change, and scale
22
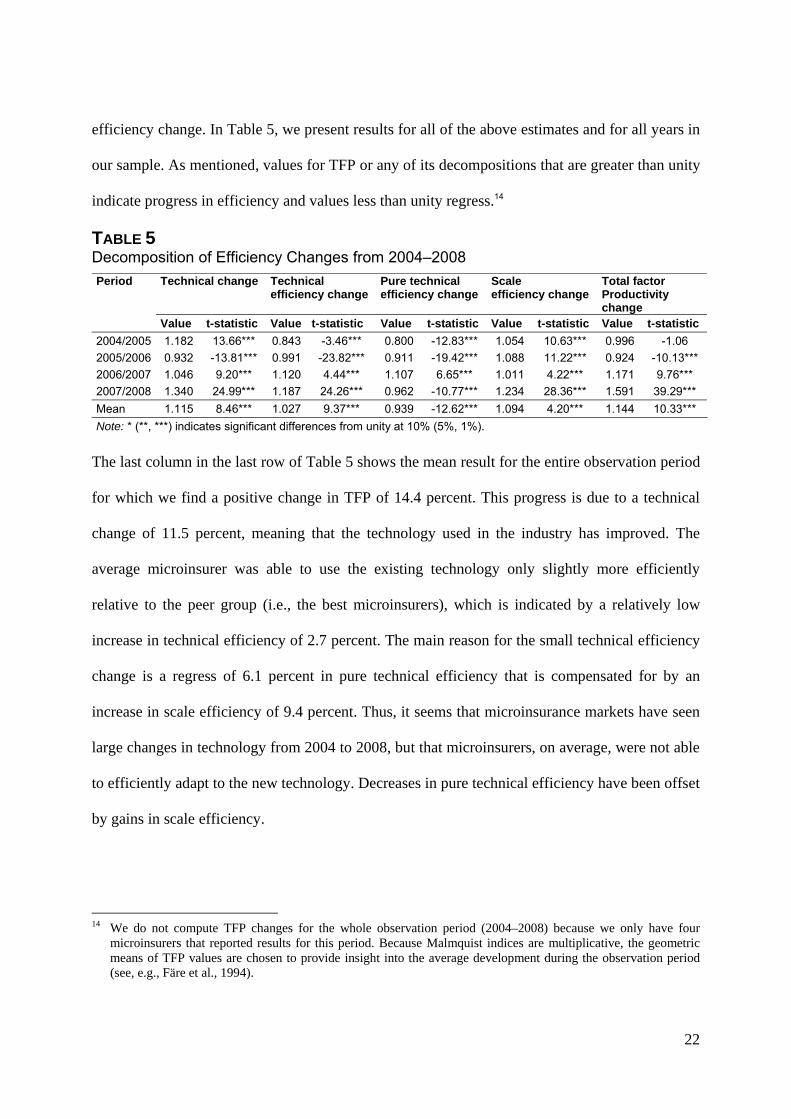
efficiency change. In Table 5, we present results for all of the above estimates and for all years in
our sample. As mentioned, values for TFP or any of its decompositions that are greater than unity
indicate progress in efficiency and values less than unity regress.14
TABLE 5 Decomposition of Efficiency Changes from 2004–2008
Period Technical change Technical efficiency change
Pure technical efficiency change
Scale efficiency change
Total factor Productivity change
Value t-statistic Value t-statistic Value t-statistic Value t-statistic Value t-statistic
2004/2005 1.182 13.66*** 0.843 -3.46*** 0.800 -12.83*** 1.054 10.63*** 0.996 -1.06
2005/2006 0.932 -13.81*** 0.991 -23.82*** 0.911 -19.42*** 1.088 11.22*** 0.924 -10.13***
2006/2007 1.046 9.20*** 1.120 4.44*** 1.107 6.65*** 1.011 4.22*** 1.171 9.76***
2007/2008 1.340 24.99*** 1.187 24.26*** 0.962 -10.77*** 1.234 28.36*** 1.591 39.29***
Mean 1.115 8.46*** 1.027 9.37*** 0.939 -12.62*** 1.094 4.20*** 1.144 10.33***
Note: * (**, ***) indicates significant differences from unity at 10% (5%, 1%).
The last column in the last row of Table 5 shows the mean result for the entire observation period
for which we find a positive change in TFP of 14.4 percent. This progress is due to a technical
change of 11.5 percent, meaning that the technology used in the industry has improved. The
average microinsurer was able to use the existing technology only slightly more efficiently
relative to the peer group (i.e., the best microinsurers), which is indicated by a relatively low
increase in technical efficiency of 2.7 percent. The main reason for the small technical efficiency
change is a regress of 6.1 percent in pure technical efficiency that is compensated for by an
increase in scale efficiency of 9.4 percent. Thus, it seems that microinsurance markets have seen
large changes in technology from 2004 to 2008, but that microinsurers, on average, were not able
to efficiently adapt to the new technology. Decreases in pure technical efficiency have been offset
by gains in scale efficiency.
14 We do not compute TFP changes for the whole observation period (2004–2008) because we only have four
microinsurers that reported results for this period. Because Malmquist indices are multiplicative, the geometric means of TFP values are chosen to provide insight into the average development during the observation period (see, e.g., Färe et al., 1994).
23
The TFP changes for separate years show a negative development for the first periods (2004 to
2006) with negative technical efficiency change. In contrast, the subsequent years (2006 to 2008)
show high progress in productivity, technology and in technical efficiency.
Determinants of Efficiency
To discover what drives firm performance, we analyze six firm-specific variables and their
influence on efficiency. The following variables are used: (A) profit orientation, (B) size of the
program, (C) age of the program, (D) provision of life insurance, (E) provision of health
insurance, and (F) provision of group policies. The variables are characterized in line with the
categories introduced in Panels A to F of Table 2.15
In a first step, we group the microinsurers according to these six variables, calculate mean
technical and cost efficiency values, and perform Welch two-sample t-tests (see Welch, 1947) to
determine significant differences in mean efficiencies. To complement these first indicative
results, we follow Simar and Wilson (2007) and perform a truncated regression analysis on the
bias-corrected technical efficiencies using the six environmental variables as covariates and
estimate confidence intervals using the proposed double bootstrap algorithm. The reason for
performing this additional analysis of determinants of efficiency is that mean efficiencies always
show combined effects for each variable and we need to isolate the effect of each variable so as
to be able to make inferences about each variable’s influence. The study design in this section—a
first indicative analysis of different groups and t-test for mean efficiencies and a second truncated
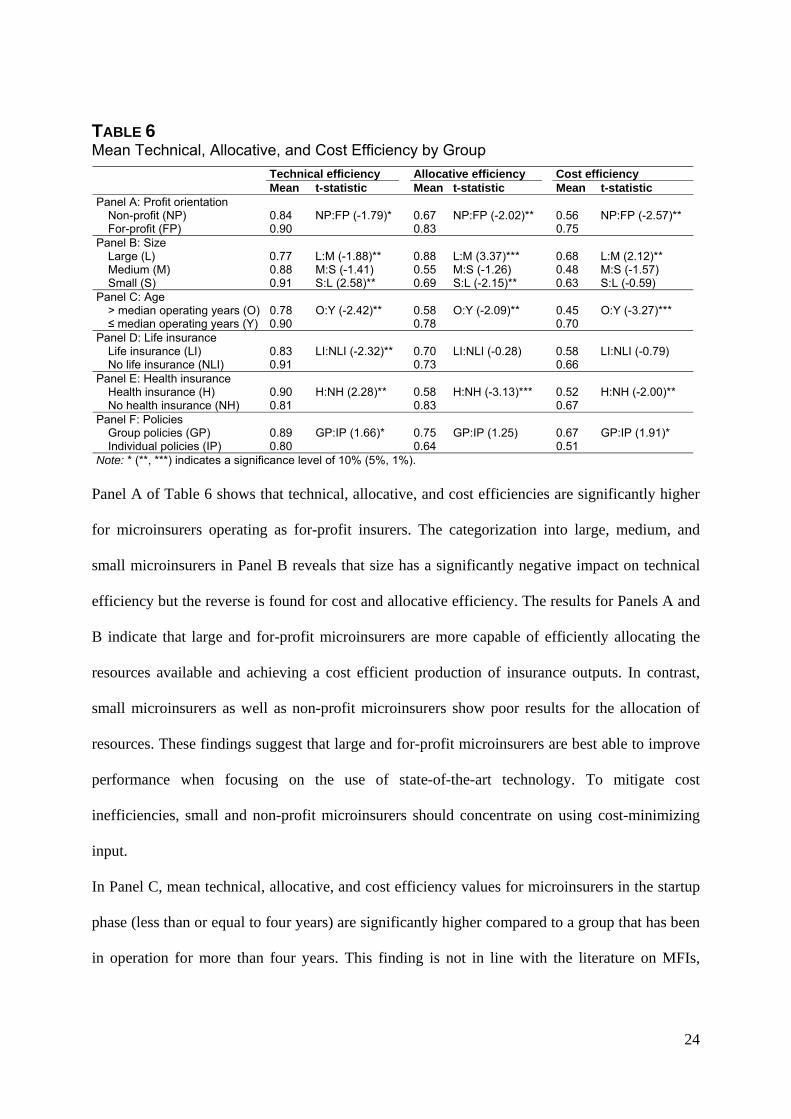
regression analysis—follows the empirical design used in Luhnen (2009). Table 6 presents mean
technical, allocative, and cost efficiencies and the results of Welch two-sample t-tests for
significance of differences in mean efficiency of the different characteristics.
15 In the truncated regression analysis, we integrate size as the logarithm of total assets standardized by the mean of
the logarithm of total assets. This is necessary because the maximum likelihood estimation requires that the covariates not differ by too many orders of magnitude from unity. All other variables are included as dummies.
24
TABLE 6 Mean Technical, Allocative, and Cost Efficiency by Group
Technical efficiency Allocative efficiency Cost efficiency Mean t-statistic Mean t-statistic Mean t-statistic
Panel A: Profit orientation Non-profit (NP) 0.84 NP:FP (-1.79)* 0.67 NP:FP (-2.02)** 0.56 NP:FP (-2.57)** For-profit (FP) 0.90 0.83 0.75 Panel B: Size Large (L) 0.77 L:M (-1.88)** 0.88 L:M (3.37)*** 0.68 L:M (2.12)** Medium (M) 0.88 M:S (-1.41) 0.55 M:S (-1.26) 0.48 M:S (-1.57) Small (S) 0.91 S:L (2.58)** 0.69 S:L (-2.15)** 0.63 S:L (-0.59) Panel C: Age > median operating years (O) 0.78 O:Y (-2.42)** 0.58 O:Y (-2.09)** 0.45 O:Y (-3.27)*** ≤ median operating years (Y) 0.90 0.78 0.70 Panel D: Life insurance Life insurance (LI) 0.83 LI:NLI (-2.32)** 0.70 LI:NLI (-0.28) 0.58 LI:NLI (-0.79) No life insurance (NLI) 0.91 0.73 0.66 Panel E: Health insurance Health insurance (H) 0.90 H:NH (2.28)** 0.58 H:NH (-3.13)*** 0.52 H:NH (-2.00)** No health insurance (NH) 0.81 0.83 0.67 Panel F: Policies Group policies (GP) 0.89 GP:IP (1.66)* 0.75 GP:IP (1.25) 0.67 GP:IP (1.91)* Individual policies (IP) 0.80 0.64 0.51 Note: * (**, ***) indicates a significance level of 10% (5%, 1%).
Panel A of Table 6 shows that technical, allocative, and cost efficiencies are significantly higher
for microinsurers operating as for-profit insurers. The categorization into large, medium, and
small microinsurers in Panel B reveals that size has a significantly negative impact on technical
efficiency but the reverse is found for cost and allocative efficiency. The results for Panels A and
B indicate that large and for-profit microinsurers are more capable of efficiently allocating the
resources available and achieving a cost efficient production of insurance outputs. In contrast,
small microinsurers as well as non-profit microinsurers show poor results for the allocation of
resources. These findings suggest that large and for-profit microinsurers are best able to improve
performance when focusing on the use of state-of-the-art technology. To mitigate cost
inefficiencies, small and non-profit microinsurers should concentrate on using cost-minimizing
input.
In Panel C, mean technical, allocative, and cost efficiency values for microinsurers in the startup
phase (less than or equal to four years) are significantly higher compared to a group that has been
in operation for more than four years. This finding is not in line with the literature on MFIs,
25
which documents that MFIs operate at reduced costs over time (see Caudill, Gropper, and
Hartarska, 2009). The age effects might be due to significant donations or government subsidies
received during the startup phase of a program that affect efficiency estimates; however, our
analysis can provide only a very preliminary indication of these efficiency effects. A larger
dataset with a substantially larger number of both young and experienced microinsurance
schemes is needed to study the efficiency of microinsurers at various stages of development.
Considering the results of Panels D and E, we find a significant impact on allocative and cost
efficiency only for health insurance. Microinsurers providing health insurance are on average
more technically efficient. The low level of cost efficiency can be explained by inefficient
resource allocation. The use of different policies (group vs. individual) analyzed in Panel F shows
that offering group policies contributes significantly to technical and cost efficiency. This is a
meaningful finding because group policies might reduce transaction costs and provide a solution
for many of the information asymmetries in microinsurance markets. For example, when all
members of an association (such as, for example, all members of a women association, which are
of high social importance in many developing countries) are insured, the insured might monitor
each other, thus reducing the potential for moral hazard. Adverse selection can also be addressed
effectively by selling group policies because it is not only the high-risk individuals of a group
(e.g., a family) that seek insurance coverage. Both these aspects of group policies might enhance
the efficiency of a microinsurance program.16
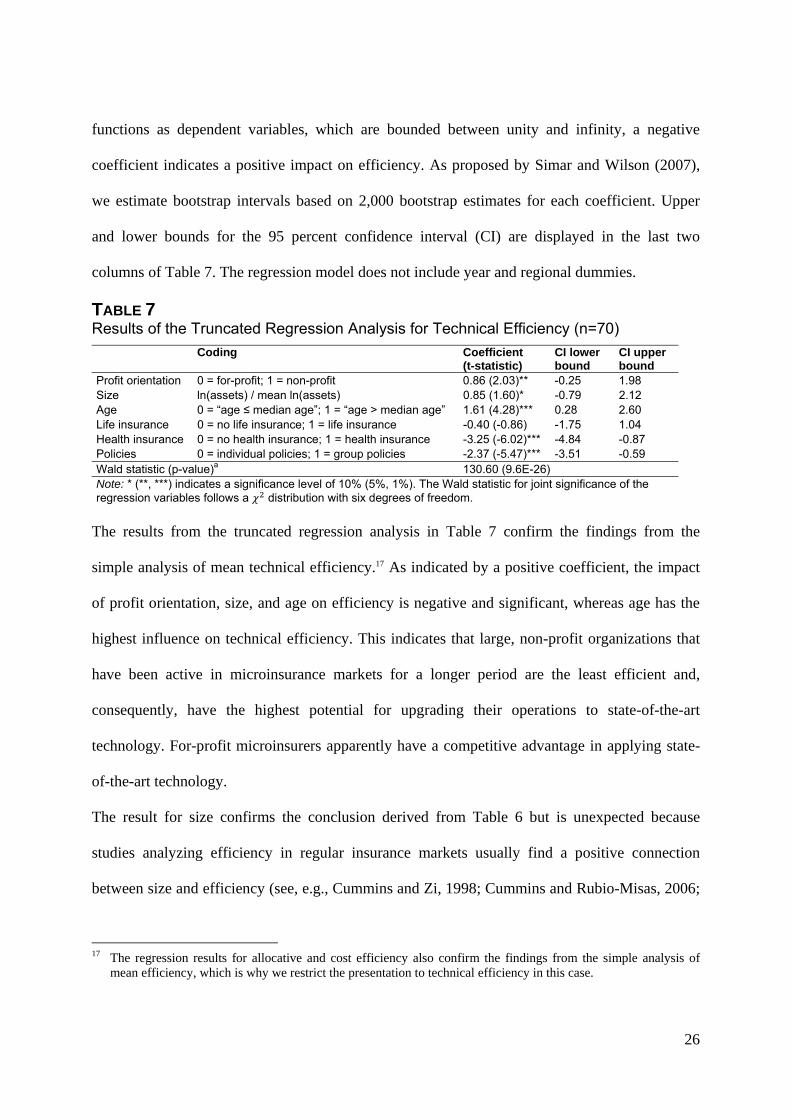
To isolate the impact of each environmental variable on technical efficiency, Table 7 shows
results of the truncated regression analysis. As we use the Shephard input-oriented distance
16 We need to be careful when interpreting group policies as a measure for decreasing moral hazard and adverse
selection effects because we include benefits as an output in the DEA. Higher efficiency may be realized, ceteris paribus, by increased benefits with microinsurers utilizing group policies. However, in our data, we also find that those microinsurers are significantly larger in terms of the number of insured, which justifies the increased benefits. Furthermore, the ability to serve more risk pooling for the clients relative to the inputs used is interpreted as higher efficiency; that is, insurers with higher benefits relative to the operating expenses and capital needed are more efficient.
26
functions as dependent variables, which are bounded between unity and infinity, a negative
coefficient indicates a positive impact on efficiency. As proposed by Simar and Wilson (2007),
we estimate bootstrap intervals based on 2,000 bootstrap estimates for each coefficient. Upper
and lower bounds for the 95 percent confidence interval (CI) are displayed in the last two
columns of Table 7. The regression model does not include year and regional dummies.
TABLE 7 Results of the Truncated Regression Analysis for Technical Efficiency (n=70)
Coding Coefficient(t-statistic)
CI lower bound
CI upper bound
Profit orientation 0 = for-profit; 1 = non-profit 0.86 (2.03)** -0.25 1.98 Size ln(assets) / mean ln(assets) 0.85 (1.60)* -0.79 2.12 Age 0 = “age ≤ median age”; 1 = “age > median age” 1.61 (4.28)*** 0.28 2.60 Life insurance 0 = no life insurance; 1 = life insurance -0.40 (-0.86) -1.75 1.04 Health insurance 0 = no health insurance; 1 = health insurance -3.25 (-6.02)*** -4.84 -0.87 Policies 0 = individual policies; 1 = group policies -2.37 (-5.47)*** -3.51 -0.59 Wald statistic (p-value)a 130.60 (9.6E-26) Note: * (**, ***) indicates a significance level of 10% (5%, 1%). The Wald statistic for joint significance of the regression variables follows a distribution with six degrees of freedom.
The results from the truncated regression analysis in Table 7 confirm the findings from the
simple analysis of mean technical efficiency.17 As indicated by a positive coefficient, the impact
of profit orientation, size, and age on efficiency is negative and significant, whereas age has the
highest influence on technical efficiency. This indicates that large, non-profit organizations that
have been active in microinsurance markets for a longer period are the least efficient and,
consequently, have the highest potential for upgrading their operations to state-of-the-art
technology. For-profit microinsurers apparently have a competitive advantage in applying state-
of-the-art technology.
The result for size confirms the conclusion derived from Table 6 but is unexpected because
studies analyzing efficiency in regular insurance markets usually find a positive connection
between size and efficiency (see, e.g., Cummins and Zi, 1998; Cummins and Rubio-Misas, 2006;
17 The regression results for allocative and cost efficiency also confirm the findings from the simple analysis of
mean efficiency, which is why we restrict the presentation to technical efficiency in this case.
27
Luhnen, 2009). The positive coefficient (i.e., a negative impact of size on technical efficiency)
that we find in Table 7 may be evidence that there are still some fundamental differences between
regular and microinsurance markets. Social cohesion is identified as an important driver for the
functioning of insurance programs in microinsurance markets (see, e.g., Dror and Jacquier,
1999), and this may explain the efficiency gain of small organizations. Concluding from these
results that increased size is always negative for the technical efficiency of a microinsurance
program would, however, be misleading. As the analysis of allocative efficiency and returns to
scale indicates, most microinsurers have a strong potential to achieve efficiency by increasing the
size of their operations. The results instead point out that efficiency gains achieved by growth
strategies need to be in line with achieving pure technical efficiency.
As found in Panels D and E in Table 6, the truncated regression analysis confirms a positive
impact of providing health insurance on technical efficiency and no significant effect for life
insurance. The finding that providing group policies is more efficient than offering individual
policies can also be confirmed by the truncated regression analysis. Thus, the offer of group
policies could play a strong role in increasing the performance of microinsurance markets.18
A number of other managerial implications can be derived from the empirical results. For
example, DEA provides information on shadow prices, slack variables, and cross-effects caused
by altering inputs and outputs (marginal rates of substitution, productivity, and transformation).
All these measures have not yet been considered in a microinsurance context and can be helpful
in evaluating the effects of different business decisions on performance. An analysis of shadow
prices, slack variables, and cross-effects is available upon request.
18 We also analyze combined effects of different firm characteristics by modeling interaction terms as separate
variables as done in Cummins, Rubio-Misas, and Zi (2004). For example, we consider the interaction between size and profit orientation (i.e., large*for-profit, small*non-profit,…). The results are available upon request.
28
Analysis Including Social Output Measure
To capture the financial and social performance of microinsurers simultaneously, we incorporate
a supplementary output variable in our analysis. For this purpose, we rely on the capacity of
microinsurers to reach their target population, defined as the number of people insured relative to
the target population (given by the microinsurer). A brief summary of the technical, allocative,
and cost efficiency estimates as well as returns to scale of microinsurers after incorporation of the
social performance variable is presented in Table A2 of the Appendix.19
We observe a high degree of correlation between the results from the original model and the
results of the model including the social performance variable (correlation of 0.80 for technical,
0.76 for allocative, and 0.81 for cost efficiency), again confirming the robustness of the
efficiency values shown in this analysis. Nevertheless, Welch two-sample t-tests suggest the
rejection of the null hypothesis of no difference in mean technical and cost efficiency at the 5
percent level, indicating that the additional social output measure has a significant effect on
technical and cost efficiency.20 The significantly higher efficiency scores, however, are not too
surprising, given that we add an additional variable to our optimization problem.
It would be interesting to observe changes in the distribution of efficiency values for separate
groups, for example, to see whether the relative difference in efficiency between non-profit and
for-profit microinsurers becomes smaller when the additional social output measure is
considered. Table A2 in the Appendix shows t-tests for differences in mean technical, allocative,
and cost efficiency for the profit orientation and size categories. When comparing the results of
the model including the social output measure with the original results (see Table 6), we observe 19 In this section, we consider an alternative output to be added to the classical efficiency measurement framework
to reflect social performance. Additionally, we might also add alternative inputs to the classical framework to reflect the distinct characteristics of microinsurers. For example, we add donors as a separate input factor in this analysis; however, we restrict our presentation to an additional social output measure because we have data on donors for only a portion of the firms in our sample.
20 Allocative efficiency for the model including the social performance variable is not significantly different from the original model.

29
no significant changes in the characteristics of the selected groups. For-profit microinsurers have
significantly higher cost and allocative efficiency in both setups and differences in technical
efficiency are not significant. In the model incorporating the social output measure, the relative
difference between non-profit and for-profit microinsurers becomes smaller with technical
efficiency, but this relative difference becomes even larger for allocative and cost efficiency. This
finding again confirms the above shown severe deficiencies in the allocative and cost efficiency
of non-profit microinsurers.
We also find only minor differences when considering the three size categories with the
exception of medium-sized microinsurer allocative and cost efficiency. Those microinsurers seem
to catch up to large microinsurers when considering the additional social output variable,
indicating that medium-sized microinsurers use more cost efficient input combinations to reach a
large share of their target population.
At first glance, incorporating the additional social output variable does not appear to significantly
differentiate the results of the efficiency analysis and does not add much information for the
dataset analyzed in this paper. However, we think it is important to consider such variables in
future work on efficiency in microinsurance markets because the social impact of such programs
is a chief consideration when serving these markets. This conclusion is supported by an analysis
of returns to scale in the setup including a social output measure. Here, we observe a larger share
of microinsurers operating at DRS and a direct (inverse) relation between the size of
microinsurers and the share of DRS (IRS) as usually found in the insurance literature (see, e.g.,
Cummins and Weiss, 2000). This suggests that an increase in size is not necessarily optimal for
all microinsurers in our panel, as suggested by the setup without the social performance variable
(see Table 4). This additional finding from the model with the social output measure points out
that we need to be cautious when making inferences about the development of microinsurance
markets. Strategies that proved successful for the development of regular insurance markets must
30
be reviewed thoroughly for their applicability to a different environment. In particular, it might
be that growth strategies that look very promising in the classical framework of financial
measures are not very promising in a modified framework that includes social measures. Further
research is needed to investigate in more detail the effect of social performance measures on
efficiency and also in relation to outputs representing financial performance only.
5 CONCLUSIONS
This is the first paper to use DEA for measuring the performance of microinsurance programs.
Early research on performance in microinsurance has focused on traditional financial ratio
analysis. We argue that frontier efficiency provides a new, powerful performance measurement
technique and a valuable addition to the existing performance measures in the field. Efficiency
techniques such as DEA might be helpful in overcoming the ambiguities of traditional financial
ratios because they summarize different characteristics of the firm in a single and easy to interpret
performance measure. Furthermore, the techniques can accommodate the important social
function that many microinsurers have and provide powerful managerial implications.
In the empirical section of this paper, we illustrate efficiency estimates for 20 microinsurance
programs in Africa, Asia, and Latin America for 2004 to 2008 based on data provided by the
Microinsurance Network. The empirical findings reveal significant potential for improvement for
many of these programs and illustrate the diversity of microinsurance programs in terms of
performance, which emphasizes the relevance of benchmarking in identifying “best practices.”21
The analysis of TFP shows an overall positive development of productivity for the sample period
with a high degree of improvement in the technology used. The returns to scale analysis for the
classical efficiency model suggests significant potential for efficiency gains through increasing
scale, which might be achieved by growth strategies and merger activities. Incorporating a social
21 As mentioned, Eling and Luhnen (2010b), in an analysis of commercial insurers, found that the efficiency scores
in emerging markets with limited capacity were typically lower than those in advanced insurance markets with relatively high capacity. Improving the capacity (i.e., both technical and business skills) might be helpful in enhancing the efficiency of microinsurers.
31
performance measure into this analysis reveals, however, that such a strategy is no longer
promising for the majority of the microinsurers in our sample. The results from the truncated
regression also confirm that an increase in size is not necessarily optimal for overall efficiency
because technical efficiency is negatively correlated with size. Growth strategies thus must be
designed so that pure technical efficiency of operations is achieved in the presence of increased
size. Moreover, in the analysis of efficiency determinants, we find that large and for-profit
microinsurers are best able to improve performance when focusing on the use of state-of-the-art
technology whereas concentrating on cost-minimizing input combinations is appropriate to
address cost inefficiencies for small and non-profit microinsurers. Another finding from the
empirical analysis is that the provision of group policies is more efficient than providing
individual policies only. Offering group policies could reduce transaction costs and help to
overcome the adverse selection and moral hazard problems that plague many of the
microinsurance markets. Information asymmetries might be reduced, for example, by selling
coverage to a family rather than to individuals (to reduce adverse selection) or by involving
members of an association in monitoring (to reduce moral hazard).
Several limitations should be kept in mind when interpreting the empirical findings. The dataset
used in this paper is the only dataset on microinsurers that is available to date, but it is still
relatively small. Furthermore, the analyzed microinsurers are in different stages of development
(i.e., some are still in the startup phase while others have been up and running for several years).
These differences are reflected, for example, in the low amount of output provided by some
schemes, which biases their efficiency scores. Thus, the findings should not be seen as
representative of the entire microinsurance industry, which is still very diverse in terms of
organization, size, and other characteristics. Nevertheless, we argue that the microinsurance
programs in our panel represent a comprehensive snapshot of the industry and that the efficiency
scores can be useful for benchmarking if these limitations are kept mind. We thus interpret the
empirical section of this paper as a first step along the path of applying frontier efficiency
32
analysis in studies of microinsurance markets. Additional research with larger datasets will be
necessary to validate the findings provided in this analysis.
A natural next step for future research would be to extend the dataset in order to provide a better
basis for the calculation of performance measures. For example, a larger dataset of programs in
both the startup and experienced phases could provide more insight into the efficiency of
microinsurers at different stages of the life cycle. A larger dataset might also be used to conduct a
cross-frontier analysis (see Cummins, Weiss, and Zi, 1999) of non-profit and for-profit
microinsurers to draw conclusions on the potential use of different production technologies. Once
a broader database is available, the efficiency values could be used to derive management advice
and recommendations for levers to increase efficiency, but given the relatively small sample we
think that future research is necessary to strengthen and confirm the implications drawn from the
empirical results. Future research can provide solutions to important issues surrounding
microinsurance such as appropriate mechanisms to control adverse selection and moral hazard,
suitable distribution and risk sharing mechanisms, and proper regulatory policies.
Another promising avenue for future research is to refine the methodology, for example, to
reflect different social output measures, or to define additional inputs that reflect the distinct
characteristics of microinsurance programs. In this context, discussions with academics as well as
with practitioners from the microinsurance industry are necessary to develop a theoretically
sound and acceptable set of input and output measures. Moreover, from a methodological point
of view, SFA might be a promising way to complement DEA findings in the future when more
data become available.
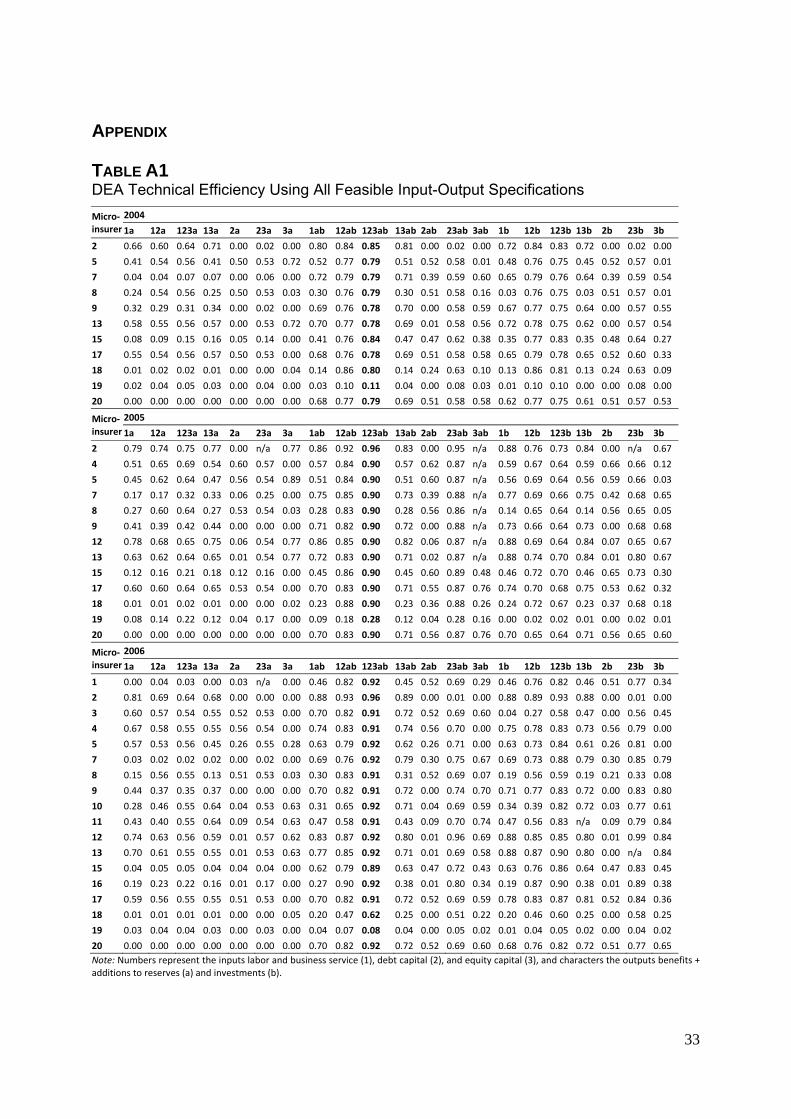
33
APPENDIX
TABLE A1
DEA Technical Efficiency Using All Feasible Input-Output Specifications
Micro‐insurer
2004
1a 12a 123a 13a 2a 23a 3a 1ab 12ab 123ab 13ab 2ab 23ab 3ab 1b 12b 123b 13b 2b 23b 3b
2 0.66 0.60 0.64 0.71 0.00 0.02 0.00 0.80 0.84 0.85 0.81 0.00 0.02 0.00 0.72 0.84 0.83 0.72 0.00 0.02 0.00
5 0.41 0.54 0.56 0.41 0.50 0.53 0.72 0.52 0.77 0.79 0.51 0.52 0.58 0.01 0.48 0.76 0.75 0.45 0.52 0.57 0.01
7 0.04 0.04 0.07 0.07 0.00 0.06 0.00 0.72 0.79 0.79 0.71 0.39 0.59 0.60 0.65 0.79 0.76 0.64 0.39 0.59 0.54
8 0.24 0.54 0.56 0.25 0.50 0.53 0.03 0.30 0.76 0.79 0.30 0.51 0.58 0.16 0.03 0.76 0.75 0.03 0.51 0.57 0.01
9 0.32 0.29 0.31 0.34 0.00 0.02 0.00 0.69 0.76 0.78 0.70 0.00 0.58 0.59 0.67 0.77 0.75 0.64 0.00 0.57 0.55
13 0.58 0.55 0.56 0.57 0.00 0.53 0.72 0.70 0.77 0.78 0.69 0.01 0.58 0.56 0.72 0.78 0.75 0.62 0.00 0.57 0.54
15 0.08 0.09 0.15 0.16 0.05 0.14 0.00 0.41 0.76 0.84 0.47 0.47 0.62 0.38 0.35 0.77 0.83 0.35 0.48 0.64 0.27
17 0.55 0.54 0.56 0.57 0.50 0.53 0.00 0.68 0.76 0.78 0.69 0.51 0.58 0.58 0.65 0.79 0.78 0.65 0.52 0.60 0.33
18 0.01 0.02 0.02 0.01 0.00 0.00 0.04 0.14 0.86 0.80 0.14 0.24 0.63 0.10 0.13 0.86 0.81 0.13 0.24 0.63 0.09
19 0.02 0.04 0.05 0.03 0.00 0.04 0.00 0.03 0.10 0.11 0.04 0.00 0.08 0.03 0.01 0.10 0.10 0.00 0.00 0.08 0.00
20 0.00 0.00 0.00 0.00 0.00 0.00 0.00 0.68 0.77 0.79 0.69 0.51 0.58 0.58 0.62 0.77 0.75 0.61 0.51 0.57 0.53
Micro‐insurer
2005
1a 12a 123a 13a 2a 23a 3a 1ab 12ab 123ab 13ab 2ab 23ab 3ab 1b 12b 123b 13b 2b 23b 3b
2 0.79 0.74 0.75 0.77 0.00 n/a 0.77 0.86 0.92 0.96 0.83 0.00 0.95 n/a 0.88 0.76 0.73 0.84 0.00 n/a 0.67
4 0.51 0.65 0.69 0.54 0.60 0.57 0.00 0.57 0.84 0.90 0.57 0.62 0.87 n/a 0.59 0.67 0.64 0.59 0.66 0.66 0.12
5 0.45 0.62 0.64 0.47 0.56 0.54 0.89 0.51 0.84 0.90 0.51 0.60 0.87 n/a 0.56 0.69 0.64 0.56 0.59 0.66 0.03
7 0.17 0.17 0.32 0.33 0.06 0.25 0.00 0.75 0.85 0.90 0.73 0.39 0.88 n/a 0.77 0.69 0.66 0.75 0.42 0.68 0.65
8 0.27 0.60 0.64 0.27 0.53 0.54 0.03 0.28 0.83 0.90 0.28 0.56 0.86 n/a 0.14 0.65 0.64 0.14 0.56 0.65 0.05
9 0.41 0.39 0.42 0.44 0.00 0.00 0.00 0.71 0.82 0.90 0.72 0.00 0.88 n/a 0.73 0.66 0.64 0.73 0.00 0.68 0.68
12 0.78 0.68 0.65 0.75 0.06 0.54 0.77 0.86 0.85 0.90 0.82 0.06 0.87 n/a 0.88 0.69 0.64 0.84 0.07 0.65 0.67
13 0.63 0.62 0.64 0.65 0.01 0.54 0.77 0.72 0.83 0.90 0.71 0.02 0.87 n/a 0.88 0.74 0.70 0.84 0.01 0.80 0.67
15 0.12 0.16 0.21 0.18 0.12 0.16 0.00 0.45 0.86 0.90 0.45 0.60 0.89 0.48 0.46 0.72 0.70 0.46 0.65 0.73 0.30
17 0.60 0.60 0.64 0.65 0.53 0.54 0.00 0.70 0.83 0.90 0.71 0.55 0.87 0.76 0.74 0.70 0.68 0.75 0.53 0.62 0.32
18 0.01 0.01 0.02 0.01 0.00 0.00 0.02 0.23 0.88 0.90 0.23 0.36 0.88 0.26 0.24 0.72 0.67 0.23 0.37 0.68 0.18
19 0.08 0.14 0.22 0.12 0.04 0.17 0.00 0.09 0.18 0.28 0.12 0.04 0.28 0.16 0.00 0.02 0.02 0.01 0.00 0.02 0.01
20 0.00 0.00 0.00 0.00 0.00 0.00 0.00 0.70 0.83 0.90 0.71 0.56 0.87 0.76 0.70 0.65 0.64 0.71 0.56 0.65 0.60
Micro‐insurer
2006
1a 12a 123a 13a 2a 23a 3a 1ab 12ab 123ab 13ab 2ab 23ab 3ab 1b 12b 123b 13b 2b 23b 3b
1 0.00 0.04 0.03 0.00 0.03 n/a 0.00 0.46 0.82 0.92 0.45 0.52 0.69 0.29 0.46 0.76 0.82 0.46 0.51 0.77 0.34
2 0.81 0.69 0.64 0.68 0.00 0.00 0.00 0.88 0.93 0.96 0.89 0.00 0.01 0.00 0.88 0.89 0.93 0.88 0.00 0.01 0.00
3 0.60 0.57 0.54 0.55 0.52 0.53 0.00 0.70 0.82 0.91 0.72 0.52 0.69 0.60 0.04 0.27 0.58 0.47 0.00 0.56 0.45
4 0.67 0.58 0.55 0.55 0.56 0.54 0.00 0.74 0.83 0.91 0.74 0.56 0.70 0.00 0.75 0.78 0.83 0.73 0.56 0.79 0.00
5 0.57 0.53 0.56 0.45 0.26 0.55 0.28 0.63 0.79 0.92 0.62 0.26 0.71 0.00 0.63 0.73 0.84 0.61 0.26 0.81 0.00
7 0.03 0.02 0.02 0.02 0.00 0.02 0.00 0.69 0.76 0.92 0.79 0.30 0.75 0.67 0.69 0.73 0.88 0.79 0.30 0.85 0.79
8 0.15 0.56 0.55 0.13 0.51 0.53 0.03 0.30 0.83 0.91 0.31 0.52 0.69 0.07 0.19 0.56 0.59 0.19 0.21 0.33 0.08
9 0.44 0.37 0.35 0.37 0.00 0.00 0.00 0.70 0.82 0.91 0.72 0.00 0.74 0.70 0.71 0.77 0.83 0.72 0.00 0.83 0.80
10 0.28 0.46 0.55 0.64 0.04 0.53 0.63 0.31 0.65 0.92 0.71 0.04 0.69 0.59 0.34 0.39 0.82 0.72 0.03 0.77 0.61
11 0.43 0.40 0.55 0.64 0.09 0.54 0.63 0.47 0.58 0.91 0.43 0.09 0.70 0.74 0.47 0.56 0.83 n/a 0.09 0.79 0.84
12 0.74 0.63 0.56 0.59 0.01 0.57 0.62 0.83 0.87 0.92 0.80 0.01 0.96 0.69 0.88 0.85 0.85 0.80 0.01 0.99 0.84
13 0.70 0.61 0.55 0.55 0.01 0.53 0.63 0.77 0.85 0.92 0.71 0.01 0.69 0.58 0.88 0.87 0.90 0.80 0.00 n/a 0.84
15 0.04 0.05 0.05 0.04 0.04 0.04 0.00 0.62 0.79 0.89 0.63 0.47 0.72 0.43 0.63 0.76 0.86 0.64 0.47 0.83 0.45
16 0.19 0.23 0.22 0.16 0.01 0.17 0.00 0.27 0.90 0.92 0.38 0.01 0.80 0.34 0.19 0.87 0.90 0.38 0.01 0.89 0.38
17 0.59 0.56 0.55 0.55 0.51 0.53 0.00 0.70 0.82 0.91 0.72 0.52 0.69 0.59 0.78 0.83 0.87 0.81 0.52 0.84 0.36
18 0.01 0.01 0.01 0.01 0.00 0.00 0.05 0.20 0.47 0.62 0.25 0.00 0.51 0.22 0.20 0.46 0.60 0.25 0.00 0.58 0.25
19 0.03 0.04 0.04 0.03 0.00 0.03 0.00 0.04 0.07 0.08 0.04 0.00 0.05 0.02 0.01 0.04 0.05 0.02 0.00 0.04 0.02
20 0.00 0.00 0.00 0.00 0.00 0.00 0.00 0.70 0.82 0.92 0.72 0.52 0.69 0.60 0.68 0.76 0.82 0.72 0.51 0.77 0.65
Note: Numbers represent the inputs labor and business service (1), debt capital (2), and equity capital (3), and characters the outputs benefits + additions to reserves (a) and investments (b).
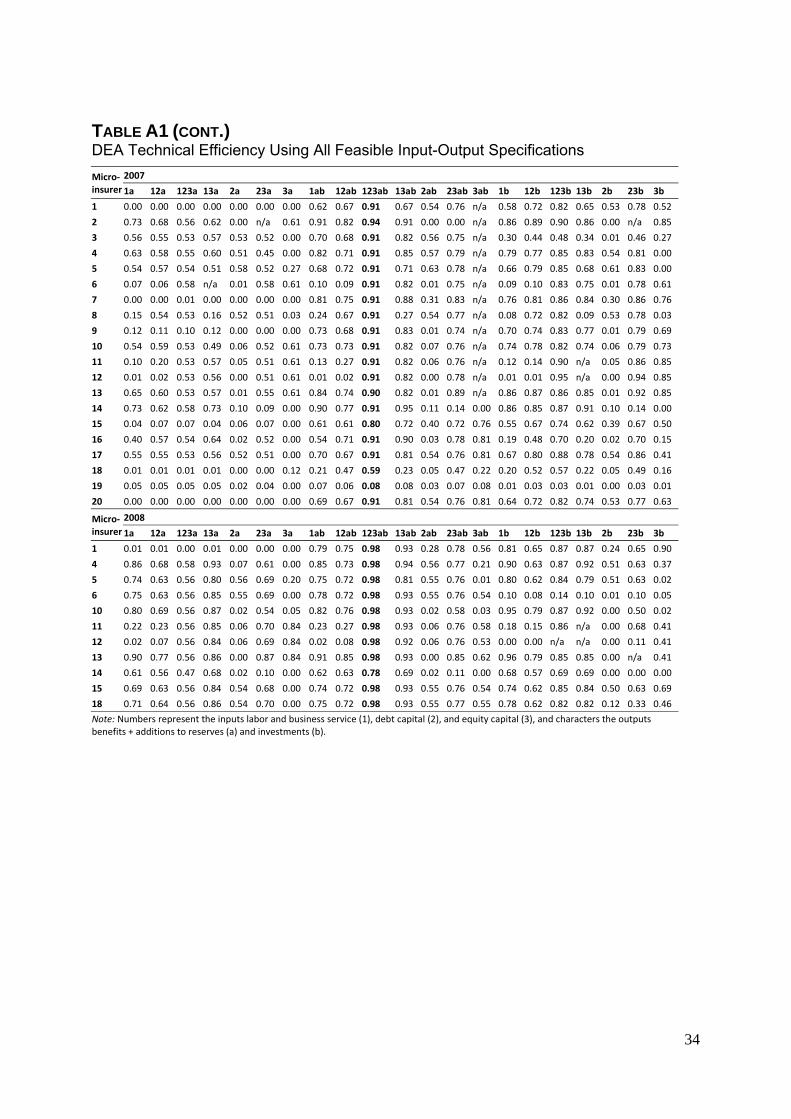
34
TABLE A1 (CONT.)
DEA Technical Efficiency Using All Feasible Input-Output Specifications
Micro‐insurer
2007
1a 12a 123a 13a 2a 23a 3a 1ab 12ab 123ab 13ab 2ab 23ab 3ab 1b 12b 123b 13b 2b 23b 3b
1 0.00 0.00 0.00 0.00 0.00 0.00 0.00 0.62 0.67 0.91 0.67 0.54 0.76 n/a 0.58 0.72 0.82 0.65 0.53 0.78 0.52
2 0.73 0.68 0.56 0.62 0.00 n/a 0.61 0.91 0.82 0.94 0.91 0.00 0.00 n/a 0.86 0.89 0.90 0.86 0.00 n/a 0.85
3 0.56 0.55 0.53 0.57 0.53 0.52 0.00 0.70 0.68 0.91 0.82 0.56 0.75 n/a 0.30 0.44 0.48 0.34 0.01 0.46 0.27
4 0.63 0.58 0.55 0.60 0.51 0.45 0.00 0.82 0.71 0.91 0.85 0.57 0.79 n/a 0.79 0.77 0.85 0.83 0.54 0.81 0.00
5 0.54 0.57 0.54 0.51 0.58 0.52 0.27 0.68 0.72 0.91 0.71 0.63 0.78 n/a 0.66 0.79 0.85 0.68 0.61 0.83 0.00
6 0.07 0.06 0.58 n/a 0.01 0.58 0.61 0.10 0.09 0.91 0.82 0.01 0.75 n/a 0.09 0.10 0.83 0.75 0.01 0.78 0.61
7 0.00 0.00 0.01 0.00 0.00 0.00 0.00 0.81 0.75 0.91 0.88 0.31 0.83 n/a 0.76 0.81 0.86 0.84 0.30 0.86 0.76
8 0.15 0.54 0.53 0.16 0.52 0.51 0.03 0.24 0.67 0.91 0.27 0.54 0.77 n/a 0.08 0.72 0.82 0.09 0.53 0.78 0.03
9 0.12 0.11 0.10 0.12 0.00 0.00 0.00 0.73 0.68 0.91 0.83 0.01 0.74 n/a 0.70 0.74 0.83 0.77 0.01 0.79 0.69
10 0.54 0.59 0.53 0.49 0.06 0.52 0.61 0.73 0.73 0.91 0.82 0.07 0.76 n/a 0.74 0.78 0.82 0.74 0.06 0.79 0.73
11 0.10 0.20 0.53 0.57 0.05 0.51 0.61 0.13 0.27 0.91 0.82 0.06 0.76 n/a 0.12 0.14 0.90 n/a 0.05 0.86 0.85
12 0.01 0.02 0.53 0.56 0.00 0.51 0.61 0.01 0.02 0.91 0.82 0.00 0.78 n/a 0.01 0.01 0.95 n/a 0.00 0.94 0.85
13 0.65 0.60 0.53 0.57 0.01 0.55 0.61 0.84 0.74 0.90 0.82 0.01 0.89 n/a 0.86 0.87 0.86 0.85 0.01 0.92 0.85
14 0.73 0.62 0.58 0.73 0.10 0.09 0.00 0.90 0.77 0.91 0.95 0.11 0.14 0.00 0.86 0.85 0.87 0.91 0.10 0.14 0.00
15 0.04 0.07 0.07 0.04 0.06 0.07 0.00 0.61 0.61 0.80 0.72 0.40 0.72 0.76 0.55 0.67 0.74 0.62 0.39 0.67 0.50
16 0.40 0.57 0.54 0.64 0.02 0.52 0.00 0.54 0.71 0.91 0.90 0.03 0.78 0.81 0.19 0.48 0.70 0.20 0.02 0.70 0.15
17 0.55 0.55 0.53 0.56 0.52 0.51 0.00 0.70 0.67 0.91 0.81 0.54 0.76 0.81 0.67 0.80 0.88 0.78 0.54 0.86 0.41
18 0.01 0.01 0.01 0.01 0.00 0.00 0.12 0.21 0.47 0.59 0.23 0.05 0.47 0.22 0.20 0.52 0.57 0.22 0.05 0.49 0.16
19 0.05 0.05 0.05 0.05 0.02 0.04 0.00 0.07 0.06 0.08 0.08 0.03 0.07 0.08 0.01 0.03 0.03 0.01 0.00 0.03 0.01
20 0.00 0.00 0.00 0.00 0.00 0.00 0.00 0.69 0.67 0.91 0.81 0.54 0.76 0.81 0.64 0.72 0.82 0.74 0.53 0.77 0.63
Micro‐insurer
2008
1a 12a 123a 13a 2a 23a 3a 1ab 12ab 123ab 13ab 2ab 23ab 3ab 1b 12b 123b 13b 2b 23b 3b
1 0.01 0.01 0.00 0.01 0.00 0.00 0.00 0.79 0.75 0.98 0.93 0.28 0.78 0.56 0.81 0.65 0.87 0.87 0.24 0.65 0.90
4 0.86 0.68 0.58 0.93 0.07 0.61 0.00 0.85 0.73 0.98 0.94 0.56 0.77 0.21 0.90 0.63 0.87 0.92 0.51 0.63 0.37
5 0.74 0.63 0.56 0.80 0.56 0.69 0.20 0.75 0.72 0.98 0.81 0.55 0.76 0.01 0.80 0.62 0.84 0.79 0.51 0.63 0.02
6 0.75 0.63 0.56 0.85 0.55 0.69 0.00 0.78 0.72 0.98 0.93 0.55 0.76 0.54 0.10 0.08 0.14 0.10 0.01 0.10 0.05
10 0.80 0.69 0.56 0.87 0.02 0.54 0.05 0.82 0.76 0.98 0.93 0.02 0.58 0.03 0.95 0.79 0.87 0.92 0.00 0.50 0.02
11 0.22 0.23 0.56 0.85 0.06 0.70 0.84 0.23 0.27 0.98 0.93 0.06 0.76 0.58 0.18 0.15 0.86 n/a 0.00 0.68 0.41
12 0.02 0.07 0.56 0.84 0.06 0.69 0.84 0.02 0.08 0.98 0.92 0.06 0.76 0.53 0.00 0.00 n/a n/a 0.00 0.11 0.41
13 0.90 0.77 0.56 0.86 0.00 0.87 0.84 0.91 0.85 0.98 0.93 0.00 0.85 0.62 0.96 0.79 0.85 0.85 0.00 n/a 0.41
14 0.61 0.56 0.47 0.68 0.02 0.10 0.00 0.62 0.63 0.78 0.69 0.02 0.11 0.00 0.68 0.57 0.69 0.69 0.00 0.00 0.00
15 0.69 0.63 0.56 0.84 0.54 0.68 0.00 0.74 0.72 0.98 0.93 0.55 0.76 0.54 0.74 0.62 0.85 0.84 0.50 0.63 0.69
18 0.71 0.64 0.56 0.86 0.54 0.70 0.00 0.75 0.72 0.98 0.93 0.55 0.77 0.55 0.78 0.62 0.82 0.82 0.12 0.33 0.46
Note: Numbers represent the inputs labor and business service (1), debt capital (2), and equity capital (3), and characters the outputs benefits + additions to reserves (a) and investments (b).
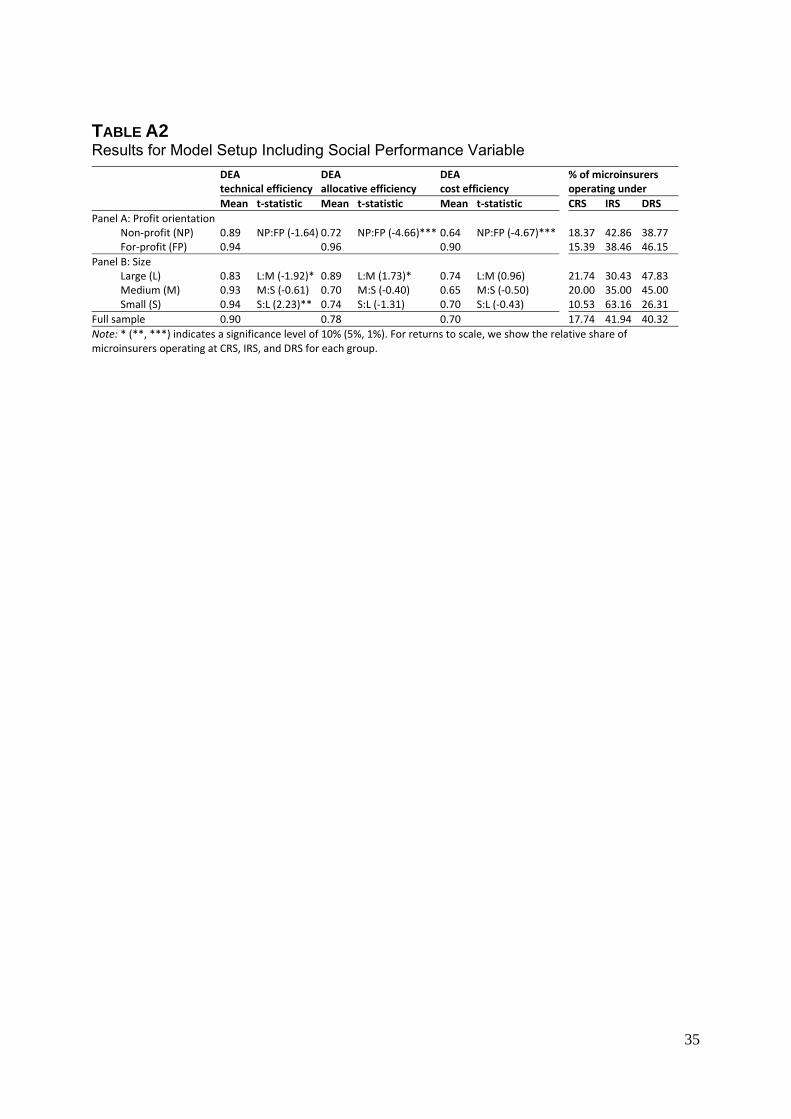
35
TABLE A2
Results for Model Setup Including Social Performance Variable
DEA technical efficiency
DEA allocative efficiency
DEA cost efficiency
% of microinsurers operating under
Mean t‐statistic Mean t‐statistic Mean t‐statistic CRS IRS DRS
Panel A: Profit orientation Non‐profit (NP) 0.89 NP:FP (‐1.64) 0.72 NP:FP (‐4.66)*** 0.64 NP:FP (‐4.67)*** 18.37 42.86 38.77 For‐profit (FP) 0.94 0.96 0.90 15.39 38.46 46.15
Panel B: Size Large (L) 0.83 L:M (‐1.92)* 0.89 L:M (1.73)* 0.74 L:M (0.96) 21.74 30.43 47.83 Medium (M) 0.93 M:S (‐0.61) 0.70 M:S (‐0.40) 0.65 M:S (‐0.50) 20.00 35.00 45.00 Small (S) 0.94 S:L (2.23)** 0.74 S:L (‐1.31) 0.70 S:L (‐0.43) 10.53 63.16 26.31
Full sample 0.90 0.78 0.70 17.74 41.94 40.32
Note: * (**, ***) indicates a significance level of 10% (5%, 1%). For returns to scale, we show the relative share of microinsurers operating at CRS, IRS, and DRS for each group.
36
REFERENCES
Bassem, B. S., 2008, Efficiency of Microfinance Institutions in the Mediterranean: An
Application of DEA, Transition Studies Review, 15: 343-354.
Berger, A. N., J. D. Cummins, M. A. Weiss, and H. Zi, 2000, Conglomeration Versus Strategic
Focus: Evidence from the Insurance Industry, Journal of Financial Intermediation, 9(4): 323-
362.
Caudill, S. B., D. M. Gropper, and V. Hartarska, 2009, Which Microfinance Institutions Are
Becoming More Cost Effective with Time? Evidence from a Mixture Model, Journal of
Money, Credit and Banking, 41(4): 651-672.
Caves, D. W., L. R. Christensen, and W. E. Diewert, 1982, The Economic Theory of Index
Numbers and the Measurement of Input, Output, and Productivity, Econometrica, 50(6):
1393-1414.
Churchill, C., 2007, Insuring the Low-Income Market: Challenges and Solutions for Commercial
Insurers, Geneva Papers on Risk and Insurance, 32: 401-412.
Cooper, W. W., L. M. Seiford, and K. Tone, 2007, Data Envelopment Analysis, 2nd edition (New
York: Springer).
Cummins, J. D., M. Rubio-Misas, and H. Zi, 2004, The Effect of Organizational Structure on
Efficiency: Evidence from the Spanish Insurance Industry, Journal of Banking and Finance,
28(12): 3113-3150.
Cummins, J. D., and M. Rubio-Misas, 2006, Deregulation, Consolidation, and Efficiency:
Evidence from the Spanish Insurance Industry, Journal of Money, Credit, and Banking, 38:
323-355.
37
Cummins, J. D., M. A. Weiss, and H. Zi, 1999, Organizational Form and Efficiency: The
Coexistence of Stock and Mutual Property-Liability Insurers, Management Science, 45(9):
1254-1269.
Cummins, J. D., and M. A. Weiss, 2000, Analyzing Firm Performance in the Insurance Industry
Using Frontier Efficiency and Productivity Methods, in: G. Dionne, ed., Handbook of
Insurance (Boston: Kluwer Academic Publishers), pp. 767-830.
Cummins, J. D., and H. Zi, 1998, Comparison of Frontier Efficiency Methods: An Application to
the U.S. Life Insurance Industry, Journal of Productivity Analysis, 10(2): 131-152.
Dror, D. M., and C. Jacquier, 1999, Micro-insurance: Extending Health Insurance to the
Excluded, International Social Security Review, 52(1): 71-97.
Eling, M., and M. Luhnen, 2010a, Frontier Efficiency Methodologies to Measure Performance in
the Insurance Industry: Overview, Systematization, and Recent Developments, Geneva
Papers on Risk and Insurance, 35(2): 217-265.
Eling, M., and M. Luhnen, 2010b, Efficiency in the International Insurance Industry: A Cross-
Country Comparison, Journal of Banking and Finance, 34(7): 1497-1509.
Ennsfellner, K. C., D. Lewis, and R. I. Anderson, 2004, Production Efficiency in the Austrian
Insurance Industry: A Bayesian Examination, Journal of Risk and Insurance, 71(1): 135-159.
Erhemjamts, O., and J. T. Leverty, 2010, The Demise of the Mutual Organizational Form: An
Investigation of the Life Insurance Industry, Journal of Money, Credit and Banking, 42(6):
1011-1036.
Färe, R., S. Grosskopf, M. Norris, and Z. Zhang, 1994, Productivity Growth, Technical Progress,
and Efficiency Change in Industrialized Countries, American Economic Review, 84(1): 66-83.
Farrell, M. J., 1957, The Measurement of Productive Efficiency, Journal of the Royal Statistical
Society A, 120: 253-281.
38
Fenn, P., D. Vencappa, S. Diacon, P. Klumpes, and C. O’Brien, 2008, Market Structure and the
Efficiency of European Insurance Companies: A Stochastic Frontier Analysis, Journal of
Banking and Finance, 32(1): 86-100.
Grace, M. F., and S. G. Timme, 1992, An Examination of Cost Economies in the United States
Life Insurance Industry, Journal of Risk and Insurance, 59(1): 72-103.
Gutiérrez-Nieto, B., and C. Serrano-Cinca, 2007, Factors Explaining the Rating of Microfinance
Institutions, Non-profit and Voluntary Sector Quarterly, 36: 439-464.
Gutiérrez-Nieto, B., C. Serrano-Cinca, and C. Mar Molinero, 2007, Microfinance Institutions and
Efficiency, Omega, 35(2): 131-142.
Gutiérrez-Nieto, B., C. Serrano-Cinca, and C. Mar Molinero, 2009, Social Efficiency in
Microfinance Institutions, Journal of the Operational Research Society, 60(1): 104-119.
Haq, M., M. Skully, and S. Pathan, 2010, Efficiency of Microfinance Institutions: A Data
Envelopment Analysis, Asia-Pacific Financial Markets, 17: 63-97.
Hermes, N., R. Lensink, and A. Meesters, 2008, Outreach and Efficiency of Microfinance
Institutions, Working Paper, University of Groningen, available at SSRN:
http://ssrn.com/abstract=1143925.
Hermes, N., R. Lensink, and A. Meesters, 2009, Financial Development and the Efficiency of
Microfinance Institutions, Working Paper, University of Groningen, available at SSRN:
http://ssrn.com/abstract=1396202.
Leverty, J. T., and M. F. Grace, The robustness of output measures in property-liability insurance
efficiency studies, Journal of Banking and Finance, 34(7): 1510-1524.
Luhnen, M., 2009, Determinants of Efficiency and Productivity in German Property-Liability
Insurance: Evidence for 1995–2006, Geneva Papers on Risk and Insurance, 34: 483-505.
Mayers, D., and C. W. Smith, 1988, Ownership Structure Across Lines of Property-Casualty
Insurance, Journal of Law and Economics, 31(2): 351-378.

39
McCord, M. J., 2009, Microinsurance: Providing Profitable Risk Management Possibilities for
the Low-Income Market, in: I. Matthäus-Maier and J. D. von Pischke, eds., New Partnerships
for Innovation in Microfinance (Berlin: Springer), pp. 279-298.
Mersland, R., and R. Strøm, 2009, Performance and Governance in Microfinance Institutions,
Journal of Banking and Finance, 33: 662-669.
Mester, L. J., 1991, Agency Costs Among Savings and Loans, Journal of Financial
Intermediation, 1(3): 257-278.
Pastor, J. T., 1996, Translation Invariance in Data Envelopment Analysis: A Generalization,
Annals of Operations Research, 66: 93-102.
Roth, J., M. J. McCord, and D. Liber, 2007, The Landscape of Microinsurance in the World’s
100 Poorest Countries, Report of the Microinsurance Centre, Appleton.
Shephard, R. W., 1970, Theory of Cost and Production Function (Princeton: Princeton
University Press).
Simar, L., and P. W. Wilson, 1999, Estimating and bootstrapping Malmquist indices, European
Journal of Operational Research, 115: 459-471.
Simar, L., and P. W. Wilson, 2000a, A general methodology for bootstrapping in nonparametric
frontier models, Journal of Applied Statistics, 27: 779-802.
Simar, L., and P. W. Wilson, 2000b, Statistical Inference in Nonparametric Frontier Models: The
State of the Art, Journal of Productivity Analysis, 13: 49-78.
Simar, L., and P. W. Wilson, 2007, Estimation and Inference in Two-Stage, Semi-Parametric
Models of Production Processes, Journal of Econometrics, 136: 31-64.
Welch, B. A., 1947, The Generalization of “Student’s” Problem when Several Different
Population Variances are Involved, Biometrika, 34: 28-35.
Wipf, J., and D. Garand, 2008, Performance Indicators for Microinsurance: A Handbook for
Microinsurance Practitioners. Luxembourg: Appui au Développement Autonome (ADA).
40
Yaron, J., 1994, Successful Rural Financial Institutions, The World Bank Research Observer,
9(1): 49-70.
Yuan, Y., and R. D. Phillips, 2008, Financial Integration and Scope Efficiency in U.S. Financial
Services Post Gramm-Leach-Bliley, Working Paper, University of Wisconsin–Whitewater
and Georgia State University, available at: http://fic.wharton.upenn.edu/
fic/papers/08/0832.pdf.
Yuengert, A. M., 1993, The Measurement of Efficiency in Life Insurance: Estimates of a Mixed
Normal-Gamma Error Model, Journal of Banking and Finance, 17(2-3): 483-496.
Zhang, Y., and R. Bartles, 1998, The Effect of Sample Size on the Mean Efficiency in DEA with
an Application to Electricity Distribution in Australia, Sweden and New Zealand, Journal of
Productivity Analysis, 9(3): 187-204.