the pennsylvania promise - pennsylvania budget and … · the pennsylvania promise making college...
TRANSCRIPT
The Pennsylvania PromiseMaking College Affordable and Securing
Pennsylvania’s Economic Future
By Mark Price, Stephen Herzenberg,
and Diana PolsonJanuary 2018
About the Authors
Mark Price is a labor economist at the Keystone Research Center; Stephen Herzenberg is an economist and Executive Director of the Keystone Research Center; Diana Polson is a Policy Analyst at Pennsylvania Budget and Policy Center.
Acknowledgements
The authors want to thank Sara Goldrick-Rab of Temple University and Lindsay C. Page of the University of Pittsburgh for sharing their research and thoughts about ways to improve this proposal. Thanks also to staff at the Association of Pennsylvania State College and University Faculties, the State System of Higher Education, the Pennsylvania Commission for Community Colleges, and Pennsylvania Higher Education Assistance Agency, and the Pennsylvania Department of Revenue for assistance locating data and/or providing feedback on early drafts of the proposal. Thanks to Aidan Davis and the rest of the staff at the Institute on Taxation and Economic Policy (ITEP) for providing estimates on the tax incidence of changes to the personal income tax. Thanks to John Neurohr for editing and Stephanie Frank for layout and cover design.
1
Table of Contents Executive Summary ....................................................................................................................................... 2
The Pennsylvania Promise ............................................................................................................................ 4
Promoting Upward Mobility ......................................................................................................................... 7
Changes in the Net Total Cost of College Under the Pennsylvania Promise ................................................ 8
Public Institutions of Higher Education: Successful, Accountable & Cost Effective ..................................... 9
Promoting Training and Education for Adults ............................................................................................ 10
Funding the Pennsylvania Promise ............................................................................................................. 10
Technical Appendix ..................................................................................................................................... 12
Section I: State System of Higher Education ........................................................................................... 13
$2,500 Mobility Grants in the State System of Higher Education ...................................................... 15
Section II: Community Colleges .............................................................................................................. 15
$1,000 Mobility Grants in Community Colleges ................................................................................. 17
Section III: State‐Related Universities ..................................................................................................... 17
$2,500 Mobility Grants in State‐Related Universities ......................................................................... 19
Section IV: Work Study ........................................................................................................................... 19
Section V: Adult Education Assistance .................................................................................................... 20
Section VI: Office of Income Mobility ..................................................................................................... 20
2
Executive Summary Three recent briefs by the Keystone Research Center laid out the case for more affordable access to post‐secondary education in Pennsylvania.1 The global race for raising incomes and increasing opportunity hinges critically on access to post‐secondary education and training. If Pennsylvania does not expand access to higher education to more of its citizens, the Commonwealth’s economy will suffer and living standards will lag growth elsewhere. With a modest and smart investment, Pennsylvania can build a more prosperous future for its citizens and reinvigorate the American Dream in every corner of the Keystone State. “The Pennsylvania Promise,” outlined below, shows how. The Need for Investment. There is a pressing need for reinvestment in post‐secondary education and training in Pennsylvania.
Thirty‐five years of state disinvestment have left Pennsylvania ranked worst in the nation when it comes to higher education, sunk in the rankings by students’ high debt at graduation and the state’s high tuition and fees, according to U.S. News and World Report.2
The state ranks 40th for the share of adults 25‐64 with an education beyond high school.3
In over half of Pennsylvania counties (35), the share of adults with more than a high‐school degree is lower than in any of the 50 states (i.e., lower than West Virginia’s 48.1%).4
A large body of economic research shows that lagging educational attainment translates to lower wages and incomes for individuals and slower economic growth for regions.5
The Wall Street Journal has already labeled rural America the “new inner city,” the nation’s most troubled regions. Rural Pennsylvania has so far escaped the fates of some parts of West Virginia and Kentucky.6 But if Pennsylvania’s rural counties remain higher education deserts,7 it would guarantee their accelerating decline over the next generation.
The Pennsylvania Promise. For about a billion per year, Pennsylvania could:
cover two years of tuition and fees for any recent high school graduate enrolled full‐time at one of the Commonwealth’s 14 public community colleges;
cover four years of tuition and fees for any recent high school graduate with a family income less than or equal to $110,000 per year accepted into one of the 14 universities in the State System of Higher Education;
provide 4 years of grants ranging from $2,000 up to $11,000, depending on family income, for students accepted into a state‐related university.8
Provide free college tuition and fees for adults without a college degree, with priority going to those seeking in‐demand skills and industry‐recognized credentials, as well as college credit.
Currently per capita funding for higher education in Pennsylvania ranks 47th out of 50 states.9 The increase in state spending required under the Pennsylvania Promise would raise Pennsylvania’s rank to 36th.
Our Previous Work on Higher Education in Pennsylvania
Pennsylvania’s Great Working‐Class Colleges (https://goo.gl/NHhtqn)
At Student’s Expense: Rising Costs Threaten Pennsylvania Public Universities’ Role in Upward Mobility (https://goo.gl/gwXphr)
Pennsylvania Higher Education at a Crossroads: To Boost Opportunity and Growth, Pennsylvania Needs to Invest in Higher Education (https://goo.gl/fr3cBU)
3
The Pennsylvania Promise would cost:
One fourth of the revenue raised from increasing the Pennsylvania personal income tax rate by one percentage point.10
About half of the revenue raised by a progressive tax proposal that cuts the personal income tax rate on wages and interest while raising it on the income derived from wealth. This is a proposal that would lower taxes for most Pennsylvanians, including a large majority of the rural Pennsylvanians who would especially benefit from the Pennsylvania Promise.11
Roughly the money raised by a severance tax like West Virginia’s. The added appeal of using a severance tax to fund a portion of the Pennsylvania Promise would be that many drilling regions lack a low‐cost local community college, making attendance at two and four‐year institutions a particularly burdensome proposition for low income students from those regions.12
The amount raised by a 0.054 percent flat tax on financial wealth (“net worth”) – $540 annually for a taxpayer with $1 million in financial assets.13 Investing these revenues in the Pennsylvania Promise, thereby addressing Pennsylvania’s chronic higher education investment deficit, would increase wealth in Pennsylvania long‐term. Funding this investment solely through a wealth/net worth tax paid almost entirely by the highest‐income Pennsylvanians would place the burden of financing expanded access to higher education on those individuals who have benefited most from changes to tax and economic policy in the last several decades. It would also generate profound improvements in opportunity and quality of life for Pennsylvanians generally.
After running the numbers, the question that emerges is “what are we waiting for?” Anyone who cares about Pennsylvania, particularly those parts of the state underserved by affordable, accessible higher education – most of the state outside the Philadelphia metro area and parts of the Pittsburgh metro area – should be leading the charge for Pennsylvania to enact the Pennsylvania Promise.
4
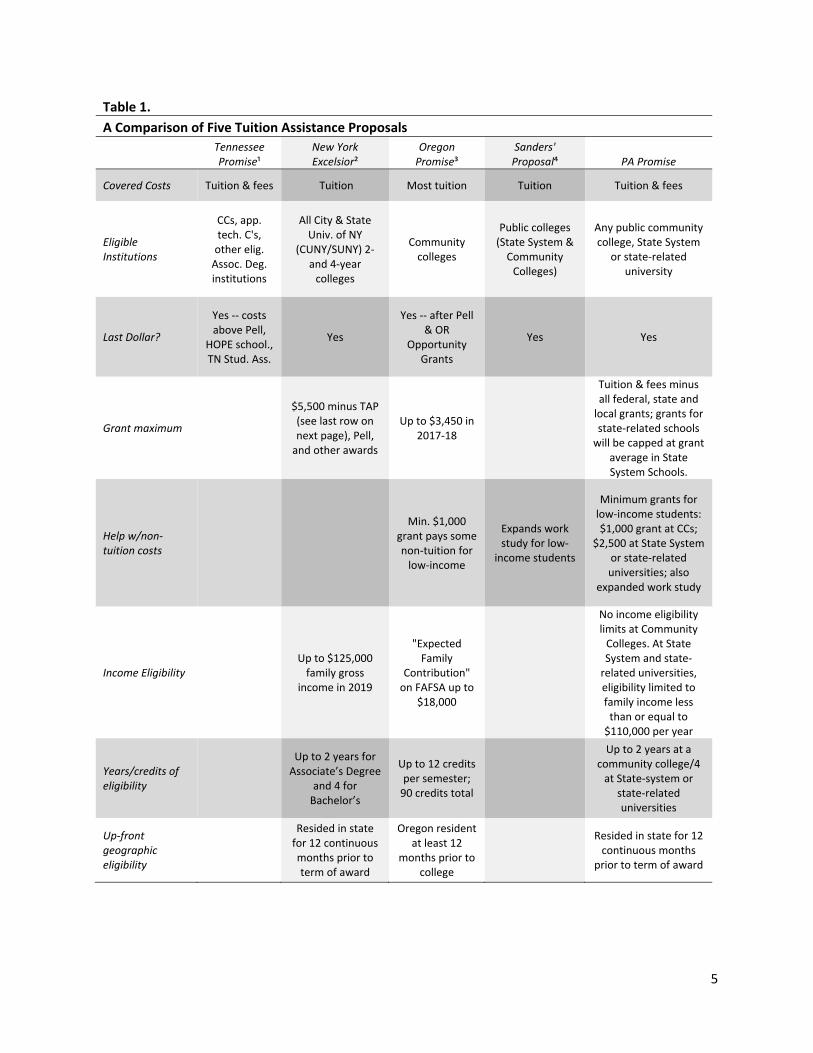
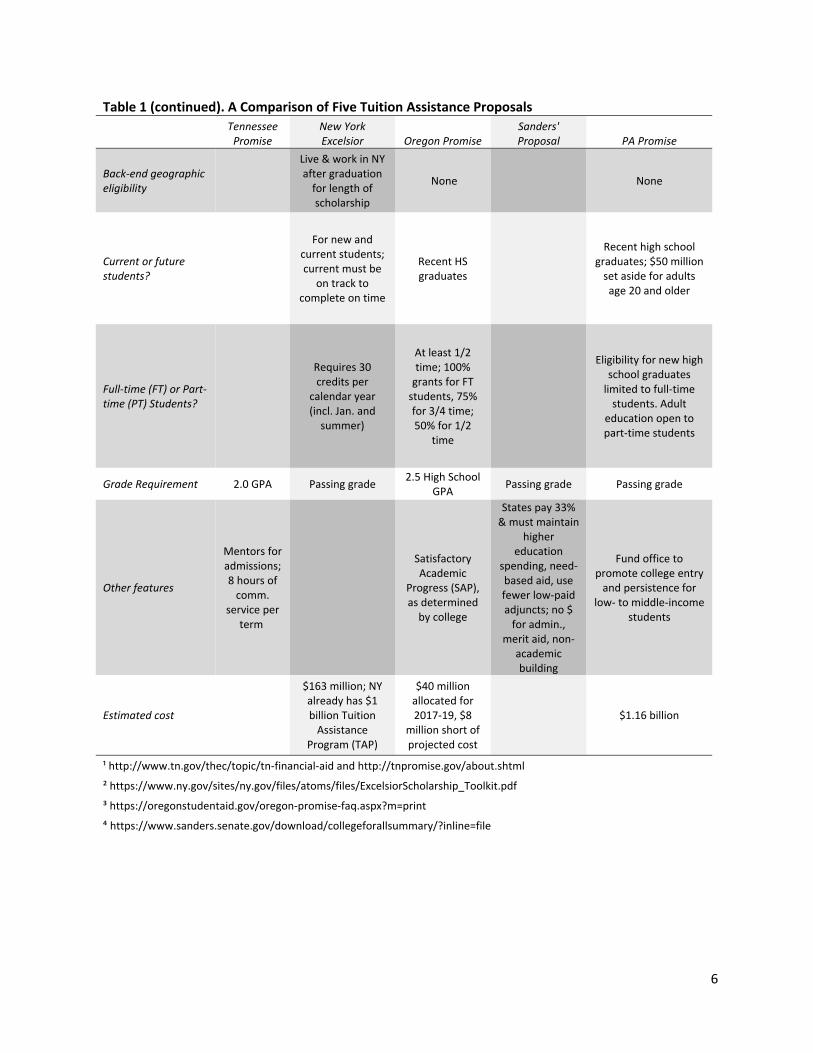
The Pennsylvania Promise In recent years, in the context of rising costs of attending college and mushrooming student debt, proposals have emerged nationally and in several states to increase funding for higher education. Table 1 (on the next two pages) profiles four of the most visible proposals (the Tennessee Promise, the Oregon Promise, New York’s Excelsior Scholarship program, and Senator Bernie Sanders’ proposal) and compares them to the Pennsylvania Promise. (The Technical Appendix has more detail on the methodology and data sources for the cost estimates of our proposal.) Our proposal:
Provides grants for two years at one of the Commonwealth’s 14 public community colleges or four years at one of 14 universities in the State System of Higher Education (State System) or four years at a state‐related university.
Would make these grants available to any recent high school graduate from Pennsylvania enrolled full‐time in a community college or to full‐time students enrolled in a State System or state‐related university with a family income less than or equal $110,000.
Would make these grants cover the “last dollar” of tuition and fees remaining after accounting for all other federal, state, and institutional grants awarded to a student. This is a design like the existing Tennessee, Oregon, and New York programs. Eligible students would need to complete a FAFSA application and access federal Pell grants and state Pennsylvania Higher Education Assistance Agency (PHEAA) grants before Pennsylvania Promise grants pay their remaining tuition and fees.
Would provide an amount capped initially at $50 million for adults (20 and over) without a college degree who have a family income less than or equal to $110,000 to earn, ultimately, up to four years of postsecondary credit. Priority would go to programs that lead to an industry‐recognized credential that is articulated with college credit, ordinarily at a community college or State System or state‐related university.14
Would establish the Office of Income Mobility within the Pennsylvania Department of Education. The office would coordinate with colleges, high schools, and local communities in implementing evidence‐based solutions designed to lower barriers to college attendance and completion for high achieving low‐ and middle‐income students.
Would include for income‐eligible students – those with family incomes less than or equal to $48,000 – a minimum grant of $1,000 for those enrolled in a community college and a minimum grant of $2,500 for those enrolled in the State System or state‐related university. For students with federal and state aid that covers all or a substantial portion of tuition and fees, these minimum grants provide some additional assistance in covering other college costs including books and room and board.
Would add a state supplement to federal work‐study programs that gives income eligible students – those with family incomes less than or equal to $48,000 – access to 500 hours of employment annually at a wage level that would phase up to $15 per hour by 2024. As proposed by Sara Goldrick‐Rab, an expansion of work study could seek to increase student participation in community service and in career training via apprenticeships, internships, and co‐op programs.15 This would benefit employers and regional economies as well as students, particularly in regions underserved by affordable higher education currently.
5
Table 1.
A Comparison of Five Tuition Assistance Proposals
Tennessee Promise¹
New York Excelsior²
Oregon Promise³
Sanders' Proposal⁴ PA Promise
Covered Costs Tuition & fees Tuition Most tuition Tuition Tuition & fees
Eligible Institutions
CCs, app. tech. C's, other elig. Assoc. Deg. institutions
All City & State Univ. of NY
(CUNY/SUNY) 2‐ and 4‐year colleges
Community colleges
Public colleges (State System & Community Colleges)
Any public community college, State System
or state‐related university
Last Dollar?
Yes ‐‐ costs above Pell,
HOPE school., TN Stud. Ass.
Yes
Yes ‐‐ after Pell & OR
Opportunity Grants
Yes Yes
Grant maximum
$5,500 minus TAP (see last row on next page), Pell, and other awards
Up to $3,450 in 2017‐18
Tuition & fees minus all federal, state and local grants; grants for state‐related schools will be capped at grant
average in State System Schools.
Help w/non‐tuition costs
Min. $1,000 grant pays some non‐tuition for low‐income
Expands work study for low‐
income students
Minimum grants for low‐income students: $1,000 grant at CCs;
$2,500 at State System or state‐related universities; also
expanded work study
Income Eligibility Up to $125,000 family gross
income in 2019
"Expected Family
Contribution" on FAFSA up to
$18,000
No income eligibility limits at Community Colleges. At State System and state‐related universities, eligibility limited to family income less than or equal to $110,000 per year
Years/credits of eligibility
Up to 2 years for Associate’s Degree
and 4 for Bachelor’s
Up to 12 credits per semester; 90 credits total
Up to 2 years at a community college/4 at State‐system or
state‐related universities
Up‐front geographic eligibility
Resided in state for 12 continuous months prior to term of award
Oregon resident at least 12
months prior to college
Resided in state for 12 continuous months
prior to term of award
6
Table 1 (continued). A Comparison of Five Tuition Assistance Proposals
Tennessee Promise
New York Excelsior Oregon Promise
Sanders' Proposal PA Promise
Back‐end geographic eligibility
Live & work in NY after graduation for length of scholarship
None None
Current or future students?
For new and current students; current must be
on track to complete on time
Recent HS graduates
Recent high school graduates; $50 million set aside for adults age 20 and older
Full‐time (FT) or Part‐time (PT) Students?
Requires 30 credits per
calendar year (incl. Jan. and summer)
At least 1/2 time; 100% grants for FT students, 75% for 3/4 time; 50% for 1/2
time
Eligibility for new high school graduates limited to full‐time students. Adult
education open to part‐time students
Grade Requirement 2.0 GPA Passing grade 2.5 High School
GPA Passing grade Passing grade
Other features
Mentors for admissions; 8 hours of comm.
service per term
Satisfactory Academic
Progress (SAP), as determined by college
States pay 33% & must maintain
higher education
spending, need‐based aid, use fewer low‐paid adjuncts; no $ for admin.,
merit aid, non‐academic building
Fund office to promote college entry and persistence for
low‐ to middle‐income students
Estimated cost
$163 million; NY already has $1 billion Tuition Assistance
Program (TAP)
$40 million allocated for 2017‐19, $8
million short of projected cost
$1.16 billion
¹ http://www.tn.gov/thec/topic/tn‐financial‐aid and http://tnpromise.gov/about.shtml
² https://www.ny.gov/sites/ny.gov/files/atoms/files/ExcelsiorScholarship_Toolkit.pdf
³ https://oregonstudentaid.gov/oregon‐promise‐faq.aspx?m=print
⁴ https://www.sanders.senate.gov/download/collegeforallsummary/?inline=file
7
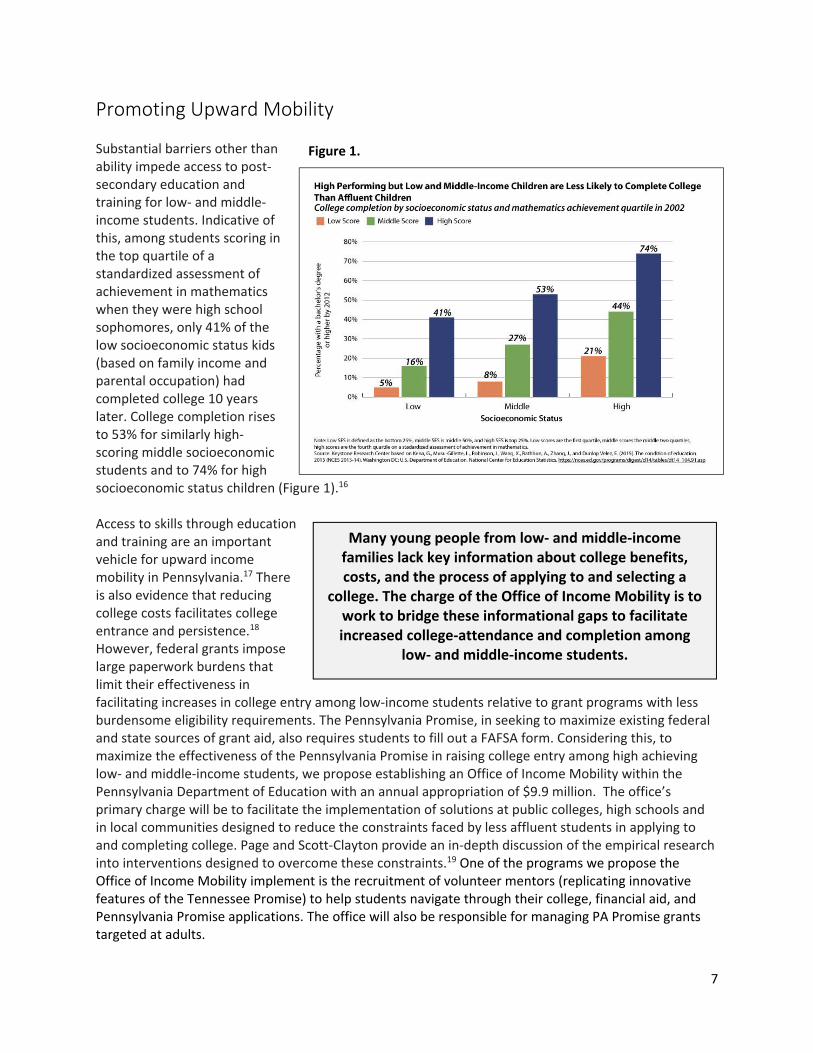
Promoting Upward Mobility Substantial barriers other than ability impede access to post‐secondary education and training for low‐ and middle‐income students. Indicative of this, among students scoring in the top quartile of a standardized assessment of achievement in mathematics when they were high school sophomores, only 41% of the low socioeconomic status kids (based on family income and parental occupation) had completed college 10 years later. College completion rises to 53% for similarly high‐scoring middle socioeconomic students and to 74% for high socioeconomic status children (Figure 1).16 Access to skills through education and training are an important vehicle for upward income mobility in Pennsylvania.17 There is also evidence that reducing college costs facilitates college entrance and persistence.18 However, federal grants impose large paperwork burdens that limit their effectiveness in facilitating increases in college entry among low‐income students relative to grant programs with less burdensome eligibility requirements. The Pennsylvania Promise, in seeking to maximize existing federal and state sources of grant aid, also requires students to fill out a FAFSA form. Considering this, to maximize the effectiveness of the Pennsylvania Promise in raising college entry among high achieving low‐ and middle‐income students, we propose establishing an Office of Income Mobility within the Pennsylvania Department of Education with an annual appropriation of $9.9 million. The office’s primary charge will be to facilitate the implementation of solutions at public colleges, high schools and in local communities designed to reduce the constraints faced by less affluent students in applying to and completing college. Page and Scott‐Clayton provide an in‐depth discussion of the empirical research into interventions designed to overcome these constraints.19 One of the programs we propose the Office of Income Mobility implement is the recruitment of volunteer mentors (replicating innovative features of the Tennessee Promise) to help students navigate through their college, financial aid, and Pennsylvania Promise applications. The office will also be responsible for managing PA Promise grants targeted at adults.
Many young people from low‐ and middle‐income families lack key information about college benefits, costs, and the process of applying to and selecting a
college. The charge of the Office of Income Mobility is to work to bridge these informational gaps to facilitate increased college‐attendance and completion among
low‐ and middle‐income students.
Figure 1.
8
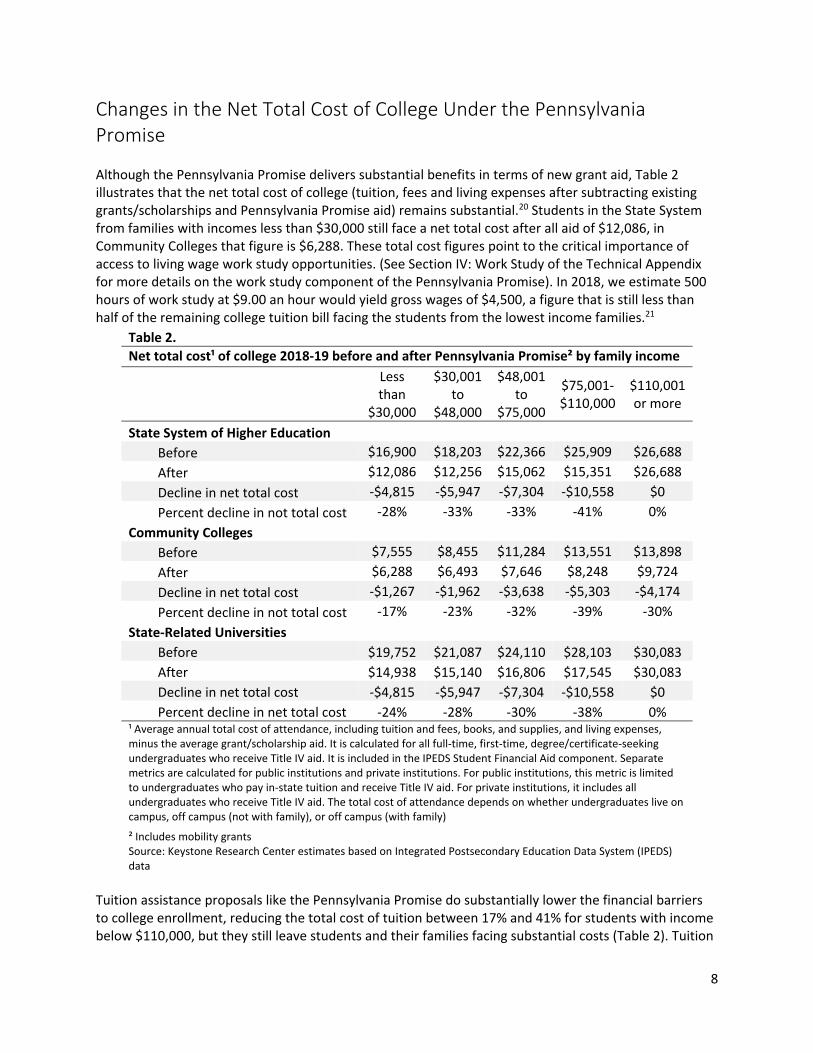
Changes in the Net Total Cost of College Under the Pennsylvania Promise Although the Pennsylvania Promise delivers substantial benefits in terms of new grant aid, Table 2 illustrates that the net total cost of college (tuition, fees and living expenses after subtracting existing grants/scholarships and Pennsylvania Promise aid) remains substantial.20 Students in the State System from families with incomes less than $30,000 still face a net total cost after all aid of $12,086, in Community Colleges that figure is $6,288. These total cost figures point to the critical importance of access to living wage work study opportunities. (See Section IV: Work Study of the Technical Appendix for more details on the work study component of the Pennsylvania Promise). In 2018, we estimate 500 hours of work study at $9.00 an hour would yield gross wages of $4,500, a figure that is still less than half of the remaining college tuition bill facing the students from the lowest income families.21
Table 2.
Net total cost¹ of college 2018‐19 before and after Pennsylvania Promise² by family income
Less than
$30,000
$30,001 to
$48,000
$48,001 to
$75,000
$75,001‐$110,000
$110,001 or more
State System of Higher Education
Before $16,900 $18,203 $22,366 $25,909 $26,688
After $12,086 $12,256 $15,062 $15,351 $26,688
Decline in net total cost ‐$4,815 ‐$5,947 ‐$7,304 ‐$10,558 $0
Percent decline in not total cost ‐28% ‐33% ‐33% ‐41% 0%
Community Colleges
Before $7,555 $8,455 $11,284 $13,551 $13,898
After $6,288 $6,493 $7,646 $8,248 $9,724
Decline in net total cost ‐$1,267 ‐$1,962 ‐$3,638 ‐$5,303 ‐$4,174
Percent decline in not total cost ‐17% ‐23% ‐32% ‐39% ‐30%
State‐Related Universities
Before $19,752 $21,087 $24,110 $28,103 $30,083
After $14,938 $15,140 $16,806 $17,545 $30,083
Decline in net total cost ‐$4,815 ‐$5,947 ‐$7,304 ‐$10,558 $0
Percent decline in net total cost ‐24% ‐28% ‐30% ‐38% 0% ¹ Average annual total cost of attendance, including tuition and fees, books, and supplies, and living expenses, minus the average grant/scholarship aid. It is calculated for all full‐time, first‐time, degree/certificate‐seeking undergraduates who receive Title IV aid. It is included in the IPEDS Student Financial Aid component. Separate metrics are calculated for public institutions and private institutions. For public institutions, this metric is limited to undergraduates who pay in‐state tuition and receive Title IV aid. For private institutions, it includes all undergraduates who receive Title IV aid. The total cost of attendance depends on whether undergraduates live on campus, off campus (not with family), or off campus (with family)
² Includes mobility grants Source: Keystone Research Center estimates based on Integrated Postsecondary Education Data System (IPEDS) data
Tuition assistance proposals like the Pennsylvania Promise do substantially lower the financial barriers to college enrollment, reducing the total cost of tuition between 17% and 41% for students with income below $110,000, but they still leave students and their families facing substantial costs (Table 2). Tuition
9
assistance proposals by no stretch of the imagination make college free, but they do drive the total cost of college back down in the direction of the lower cost of college faced by previous generations of students that attended public colleges in Pennsylvania.
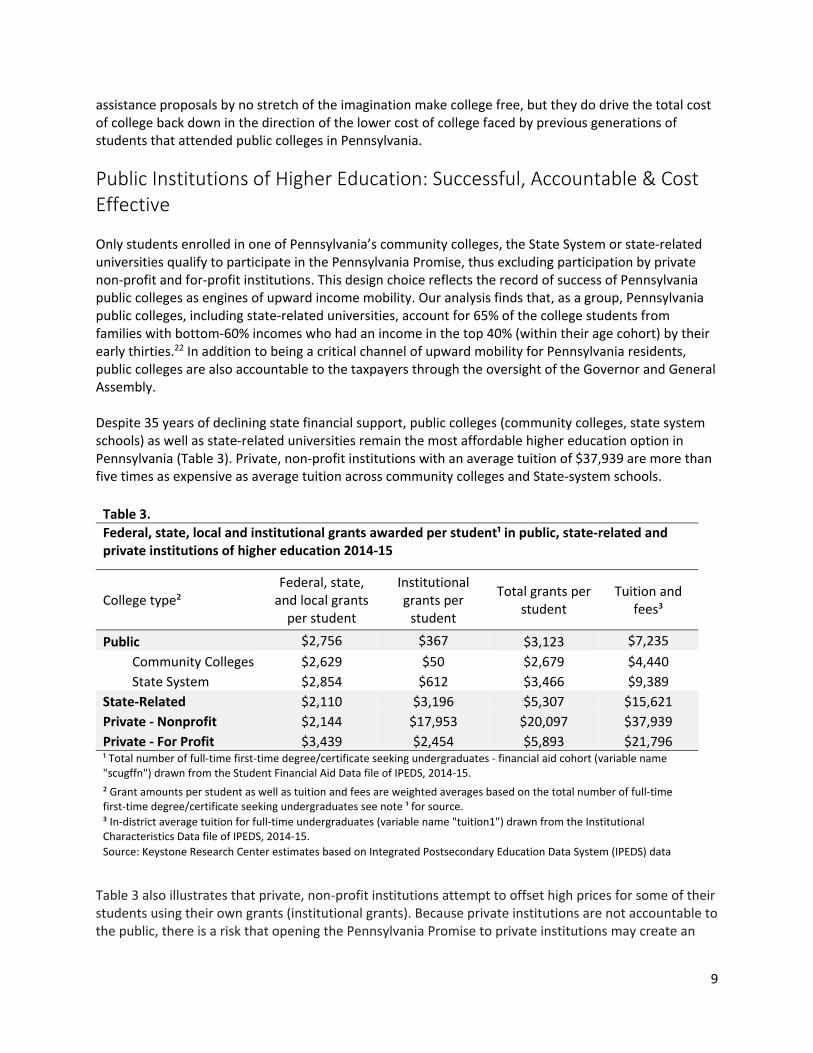
Public Institutions of Higher Education: Successful, Accountable & Cost Effective Only students enrolled in one of Pennsylvania’s community colleges, the State System or state‐related universities qualify to participate in the Pennsylvania Promise, thus excluding participation by private non‐profit and for‐profit institutions. This design choice reflects the record of success of Pennsylvania public colleges as engines of upward income mobility. Our analysis finds that, as a group, Pennsylvania public colleges, including state‐related universities, account for 65% of the college students from families with bottom‐60% incomes who had an income in the top 40% (within their age cohort) by their early thirties.22 In addition to being a critical channel of upward mobility for Pennsylvania residents, public colleges are also accountable to the taxpayers through the oversight of the Governor and General Assembly. Despite 35 years of declining state financial support, public colleges (community colleges, state system schools) as well as state‐related universities remain the most affordable higher education option in Pennsylvania (Table 3). Private, non‐profit institutions with an average tuition of $37,939 are more than five times as expensive as average tuition across community colleges and State‐system schools.
Table 3.
Federal, state, local and institutional grants awarded per student¹ in public, state‐related and private institutions of higher education 2014‐15
College type² Federal, state, and local grants per student
Institutional grants per student
Total grants per student
Tuition and fees³
Public $2,756 $367 $3,123 $7,235
Community Colleges $2,629 $50 $2,679 $4,440
State System $2,854 $612 $3,466 $9,389
State‐Related $2,110 $3,196 $5,307 $15,621
Private ‐ Nonprofit $2,144 $17,953 $20,097 $37,939
Private ‐ For Profit $3,439 $2,454 $5,893 $21,796 ¹ Total number of full‐time first‐time degree/certificate seeking undergraduates ‐ financial aid cohort (variable name "scugffn") drawn from the Student Financial Aid Data file of IPEDS, 2014‐15.
² Grant amounts per student as well as tuition and fees are weighted averages based on the total number of full‐time first‐time degree/certificate seeking undergraduates see note ¹ for source.
³ In‐district average tuition for full‐time undergraduates (variable name "tuition1") drawn from the Institutional Characteristics Data file of IPEDS, 2014‐15.
Source: Keystone Research Center estimates based on Integrated Postsecondary Education Data System (IPEDS) data
Table 3 also illustrates that private, non‐profit institutions attempt to offset high prices for some of their students using their own grants (institutional grants). Because private institutions are not accountable to the public, there is a risk that opening the Pennsylvania Promise to private institutions may create an
10
incentive for these institutions to rely on the Pennsylvania Promise to fund more socio‐economic diversity on their campuses and thus redirect current institutional grant aid to other less meritorious institutional priorities.
Promoting Training and Education for Adults Pennsylvania ranks 40th out of 50 states for the share of adults age 25‐64 with more than a high school education.23 The Pennsylvania Promise seeks to boost educational attainment among adults without a college degree, with an initial investment in grants of $12.5 million in 2018‐19 that rises to $50 million by 2021‐22.
We recommend priority in funding go to programs that lead to an industry‐recognized credential that is articulated with college credit, ordinarily at a community college, State‐system school or state‐relative university.
Adult learners would be eligible for up to two years of tuition assistance at community colleges or up to four years at a State‐system school.
Eligibility would be limited to adults with family income less than or equal to $110,000 a year.
We would recommend NOT limiting eligibility to students attending college full‐time.
Based on average tuition and fees at the states community colleges, we estimate the program could provide grants to 1,975 adult learners in 2018‐19, with the number of grants rising to 7,301 by 2021‐22.
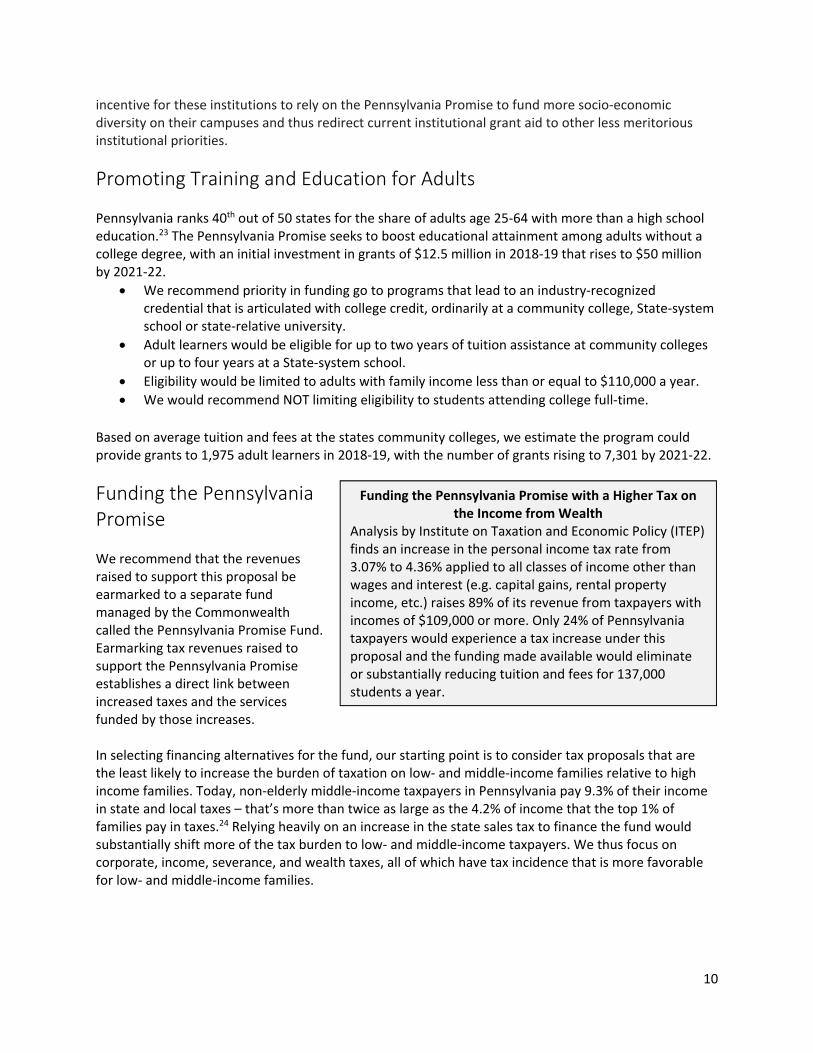
Funding the Pennsylvania Promise We recommend that the revenues raised to support this proposal be earmarked to a separate fund managed by the Commonwealth called the Pennsylvania Promise Fund. Earmarking tax revenues raised to support the Pennsylvania Promise establishes a direct link between increased taxes and the services funded by those increases. In selecting financing alternatives for the fund, our starting point is to consider tax proposals that are the least likely to increase the burden of taxation on low‐ and middle‐income families relative to high income families. Today, non‐elderly middle‐income taxpayers in Pennsylvania pay 9.3% of their income in state and local taxes – that’s more than twice as large as the 4.2% of income that the top 1% of families pay in taxes.24 Relying heavily on an increase in the state sales tax to finance the fund would substantially shift more of the tax burden to low‐ and middle‐income taxpayers. We thus focus on corporate, income, severance, and wealth taxes, all of which have tax incidence that is more favorable for low‐ and middle‐income families.
Funding the Pennsylvania Promise with a Higher Tax on the Income from Wealth
Analysis by Institute on Taxation and Economic Policy (ITEP) finds an increase in the personal income tax rate from 3.07% to 4.36% applied to all classes of income other than wages and interest (e.g. capital gains, rental property income, etc.) raises 89% of its revenue from taxpayers with incomes of $109,000 or more. Only 24% of Pennsylvania taxpayers would experience a tax increase under this proposal and the funding made available would eliminate or substantially reducing tuition and fees for 137,000 students a year.
11
We present below a menu of possible funding options with each tax rate scaled up to entirely fund the Pennsylvania Promise at $1.16 billion:
An increase in the corporate net income tax rate (CNI) from 9.99% to 13.99%.
Reenacting the Capital Stock and Franchise Tax at 3 mills.
A natural gas severance tax at a rate similar to the 5% in West Virginia.25
A higher personal income tax rate of 4.36% on unearned income (excluding interest).26
An across‐the‐board increase in the personal income tax rate of from 3.07% to 3.32%.27
A wealth tax of 0.054%.28
The revenue impact on the state budget of corporate tax cuts enacted since 2002 has increased four times since 2003‐04 from $796 million to $3.25 billion per year.29 The top 1% of earners have captured 40% of income growth since 1979.30 Because tax policy and economic growth have favored both corporate and high‐income taxpayers, relying on tax increases that ask more of these taxpayers than other groups is fair and given the cost of the Pennsylvania Promise, a modest amount relative to the tax cuts and income growth these tax payers have enjoyed in the past 38 years. These investments may mean slightly higher taxes now for those with the greatest ability to pay. Long‐term they will lead to a more prosperous and profitable Pennsylvania economy, with benefits even for those affluent Pennsylvanians asked to invest in our common future.
12
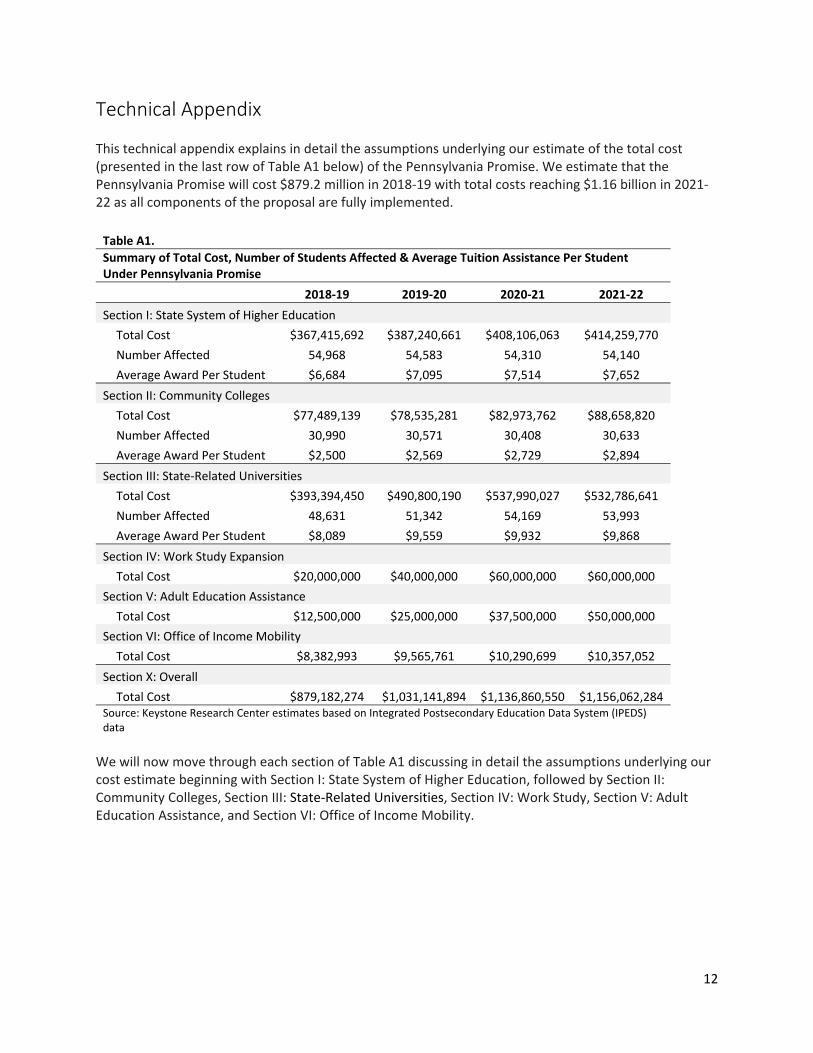
Technical Appendix This technical appendix explains in detail the assumptions underlying our estimate of the total cost (presented in the last row of Table A1 below) of the Pennsylvania Promise. We estimate that the Pennsylvania Promise will cost $879.2 million in 2018‐19 with total costs reaching $1.16 billion in 2021‐22 as all components of the proposal are fully implemented.
Table A1.
Summary of Total Cost, Number of Students Affected & Average Tuition Assistance Per Student Under Pennsylvania Promise
2018‐19 2019‐20 2020‐21 2021‐22
Section I: State System of Higher Education
Total Cost $367,415,692 $387,240,661 $408,106,063 $414,259,770
Number Affected 54,968 54,583 54,310 54,140
Average Award Per Student $6,684 $7,095 $7,514 $7,652
Section II: Community Colleges
Total Cost $77,489,139 $78,535,281 $82,973,762 $88,658,820
Number Affected 30,990 30,571 30,408 30,633
Average Award Per Student $2,500 $2,569 $2,729 $2,894
Section III: State‐Related Universities
Total Cost $393,394,450 $490,800,190 $537,990,027 $532,786,641
Number Affected 48,631 51,342 54,169 53,993
Average Award Per Student $8,089 $9,559 $9,932 $9,868
Section IV: Work Study Expansion
Total Cost $20,000,000 $40,000,000 $60,000,000 $60,000,000
Section V: Adult Education Assistance
Total Cost $12,500,000 $25,000,000 $37,500,000 $50,000,000
Section VI: Office of Income Mobility
Total Cost $8,382,993 $9,565,761 $10,290,699 $10,357,052
Section X: Overall
Total Cost $879,182,274 $1,031,141,894 $1,136,860,550 $1,156,062,284 Source: Keystone Research Center estimates based on Integrated Postsecondary Education Data System (IPEDS) data
We will now move through each section of Table A1 discussing in detail the assumptions underlying our cost estimate beginning with Section I: State System of Higher Education, followed by Section II: Community Colleges, Section III: State‐Related Universities, Section IV: Work Study, Section V: Adult Education Assistance, and Section VI: Office of Income Mobility.
13
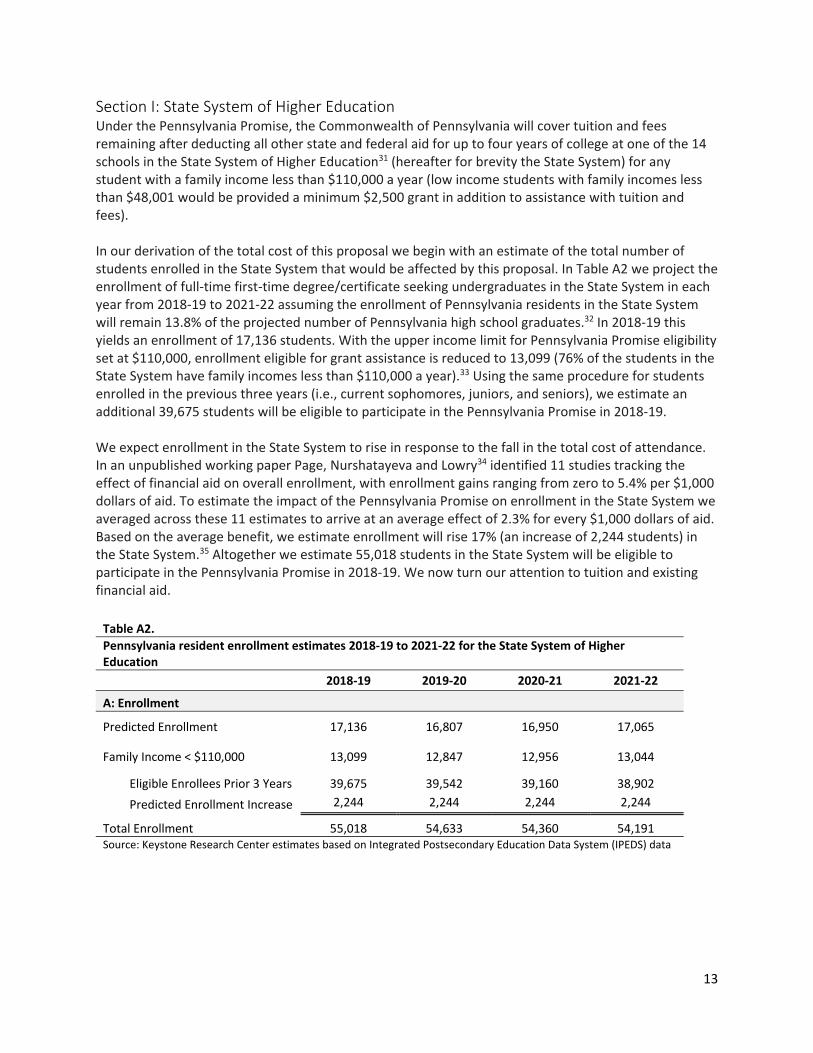
Section I: State System of Higher Education Under the Pennsylvania Promise, the Commonwealth of Pennsylvania will cover tuition and fees remaining after deducting all other state and federal aid for up to four years of college at one of the 14 schools in the State System of Higher Education31 (hereafter for brevity the State System) for any student with a family income less than $110,000 a year (low income students with family incomes less than $48,001 would be provided a minimum $2,500 grant in addition to assistance with tuition and fees). In our derivation of the total cost of this proposal we begin with an estimate of the total number of students enrolled in the State System that would be affected by this proposal. In Table A2 we project the enrollment of full‐time first‐time degree/certificate seeking undergraduates in the State System in each year from 2018‐19 to 2021‐22 assuming the enrollment of Pennsylvania residents in the State System will remain 13.8% of the projected number of Pennsylvania high school graduates.32 In 2018‐19 this yields an enrollment of 17,136 students. With the upper income limit for Pennsylvania Promise eligibility set at $110,000, enrollment eligible for grant assistance is reduced to 13,099 (76% of the students in the State System have family incomes less than $110,000 a year).33 Using the same procedure for students enrolled in the previous three years (i.e., current sophomores, juniors, and seniors), we estimate an additional 39,675 students will be eligible to participate in the Pennsylvania Promise in 2018‐19. We expect enrollment in the State System to rise in response to the fall in the total cost of attendance. In an unpublished working paper Page, Nurshatayeva and Lowry34 identified 11 studies tracking the effect of financial aid on overall enrollment, with enrollment gains ranging from zero to 5.4% per $1,000 dollars of aid. To estimate the impact of the Pennsylvania Promise on enrollment in the State System we averaged across these 11 estimates to arrive at an average effect of 2.3% for every $1,000 dollars of aid. Based on the average benefit, we estimate enrollment will rise 17% (an increase of 2,244 students) in the State System.35 Altogether we estimate 55,018 students in the State System will be eligible to participate in the Pennsylvania Promise in 2018‐19. We now turn our attention to tuition and existing financial aid.
Table A2.
Pennsylvania resident enrollment estimates 2018‐19 to 2021‐22 for the State System of Higher Education
2018‐19 2019‐20 2020‐21 2021‐22
A: Enrollment
Predicted Enrollment 17,136 16,807 16,950 17,065
Family Income < $110,000 13,099 12,847 12,956 13,044
Eligible Enrollees Prior 3 Years 39,675 39,542 39,160 38,902
Predicted Enrollment Increase 2,244 2,244 2,244 2,244
Total Enrollment 55,018 54,633 54,360 54,191 Source: Keystone Research Center estimates based on Integrated Postsecondary Education Data System (IPEDS) data
14
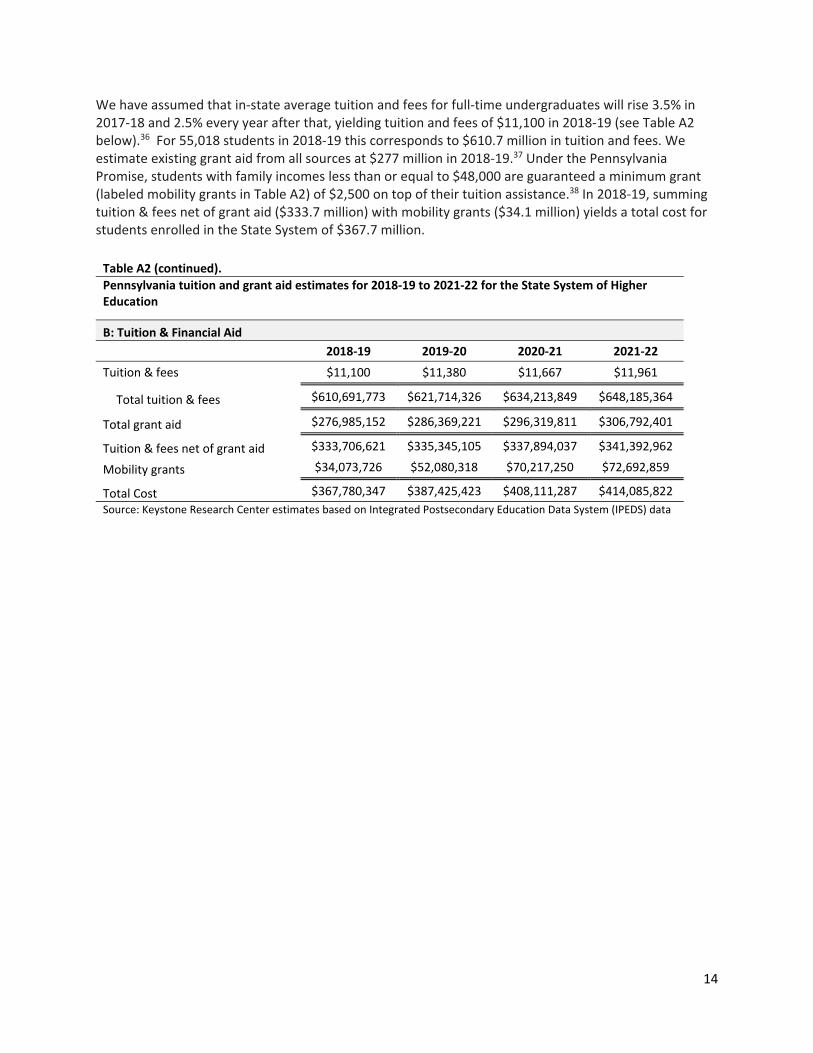
We have assumed that in‐state average tuition and fees for full‐time undergraduates will rise 3.5% in 2017‐18 and 2.5% every year after that, yielding tuition and fees of $11,100 in 2018‐19 (see Table A2 below).36 For 55,018 students in 2018‐19 this corresponds to $610.7 million in tuition and fees. We estimate existing grant aid from all sources at $277 million in 2018‐19.37 Under the Pennsylvania Promise, students with family incomes less than or equal to $48,000 are guaranteed a minimum grant (labeled mobility grants in Table A2) of $2,500 on top of their tuition assistance.38 In 2018‐19, summing tuition & fees net of grant aid ($333.7 million) with mobility grants ($34.1 million) yields a total cost for students enrolled in the State System of $367.7 million.
Table A2 (continued).
Pennsylvania tuition and grant aid estimates for 2018‐19 to 2021‐22 for the State System of Higher Education
B: Tuition & Financial Aid
2018‐19 2019‐20 2020‐21 2021‐22
Tuition & fees $11,100 $11,380 $11,667 $11,961
Total tuition & fees $610,691,773 $621,714,326 $634,213,849 $648,185,364
Total grant aid $276,985,152 $286,369,221 $296,319,811 $306,792,401
Tuition & fees net of grant aid $333,706,621 $335,345,105 $337,894,037 $341,392,962
Mobility grants $34,073,726 $52,080,318 $70,217,250 $72,692,859
Total Cost $367,780,347 $387,425,423 $408,111,287 $414,085,822
Source: Keystone Research Center estimates based on Integrated Postsecondary Education Data System (IPEDS) data
15
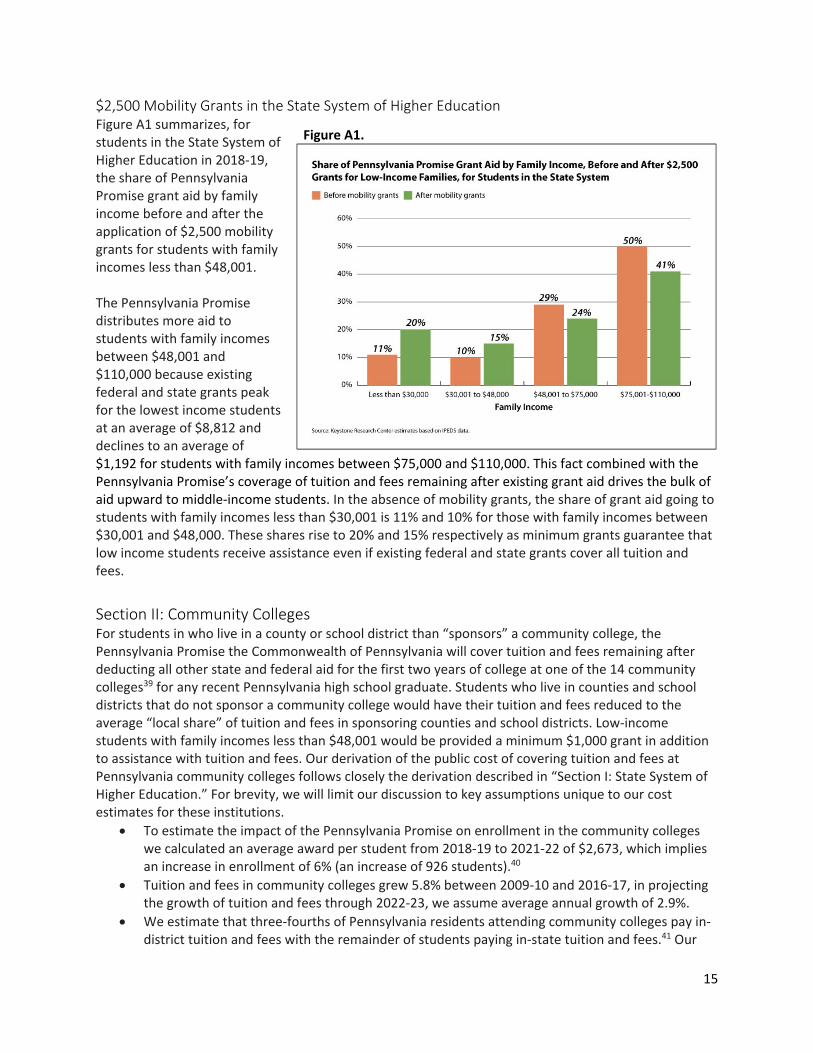
$2,500 Mobility Grants in the State System of Higher Education Figure A1 summarizes, for students in the State System of Higher Education in 2018‐19, the share of Pennsylvania Promise grant aid by family income before and after the application of $2,500 mobility grants for students with family incomes less than $48,001. The Pennsylvania Promise distributes more aid to students with family incomes between $48,001 and $110,000 because existing federal and state grants peak for the lowest income students at an average of $8,812 and declines to an average of $1,192 for students with family incomes between $75,000 and $110,000. This fact combined with the Pennsylvania Promise’s coverage of tuition and fees remaining after existing grant aid drives the bulk of aid upward to middle‐income students. In the absence of mobility grants, the share of grant aid going to students with family incomes less than $30,001 is 11% and 10% for those with family incomes between $30,001 and $48,000. These shares rise to 20% and 15% respectively as minimum grants guarantee that low income students receive assistance even if existing federal and state grants cover all tuition and fees.
Section II: Community Colleges For students in who live in a county or school district than “sponsors” a community college, the Pennsylvania Promise the Commonwealth of Pennsylvania will cover tuition and fees remaining after deducting all other state and federal aid for the first two years of college at one of the 14 community colleges39 for any recent Pennsylvania high school graduate. Students who live in counties and school districts that do not sponsor a community college would have their tuition and fees reduced to the average “local share” of tuition and fees in sponsoring counties and school districts. Low‐income students with family incomes less than $48,001 would be provided a minimum $1,000 grant in addition to assistance with tuition and fees. Our derivation of the public cost of covering tuition and fees at Pennsylvania community colleges follows closely the derivation described in “Section I: State System of Higher Education.” For brevity, we will limit our discussion to key assumptions unique to our cost estimates for these institutions.
To estimate the impact of the Pennsylvania Promise on enrollment in the community colleges we calculated an average award per student from 2018‐19 to 2021‐22 of $2,673, which implies an increase in enrollment of 6% (an increase of 926 students).40
Tuition and fees in community colleges grew 5.8% between 2009‐10 and 2016‐17, in projecting the growth of tuition and fees through 2022‐23, we assume average annual growth of 2.9%.
We estimate that three‐fourths of Pennsylvania residents attending community colleges pay in‐district tuition and fees with the remainder of students paying in‐state tuition and fees.41 Our
Figure A1.
16
cost estimates subtract existing aid from in‐district tuition, which we estimate at $5,379 in 2018‐19. We estimate in‐state but out‐of‐district tuition at community colleges will be $9,086 in 2018‐19. The difference reflects the subsidy that sponsoring school districts and county governments pay for their residents to attend community college, with non‐residents paying higher in‐state tuition. These out‐of‐district (but in‐state) students in our estimates will have the cost of tuition covered up to the maximum tuition paid by in district students. We recommend counties and school districts that do not have their own community colleges reimburse students for the difference and/or establish their own community colleges. We estimate the total cost of covering the remaining tuition and fees of out‐of‐district students in Pennsylvania is $30 million per year. One alternative to consider is state legislation that requires county governments and school districts to reimburse these students for tuition costs not covered by grant aid if districts and counties do not already financially support a community college.
We recommend that legislation establishing the Pennsylvania Promise make participation by community colleges contingent on school districts and county governments maintaining their current financial support relative to the state’s pre‐Pennsylvania Promise financial support.
Under the Pennsylvania Promise community college students with family incomes less than or equal to $48,000 are guaranteed a minimum grant (labeled mobility grants in Table A3) of $1,000 on top of their tuition assistance.
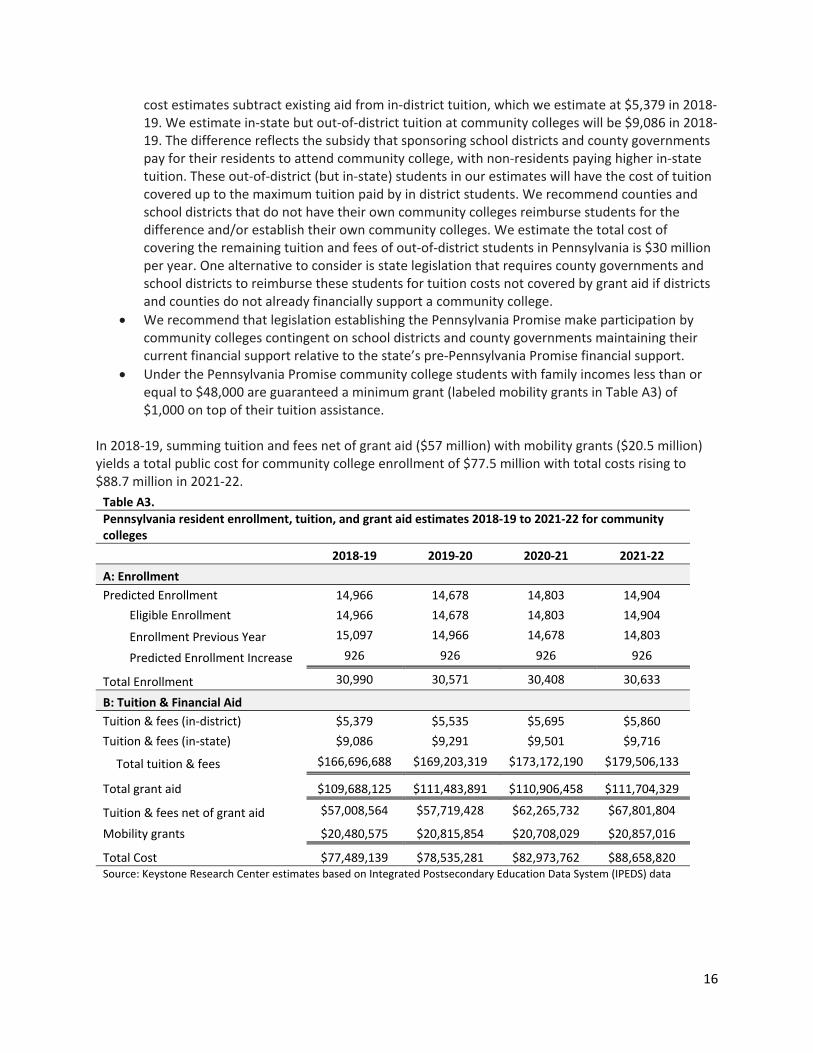
In 2018‐19, summing tuition and fees net of grant aid ($57 million) with mobility grants ($20.5 million) yields a total public cost for community college enrollment of $77.5 million with total costs rising to $88.7 million in 2021‐22.
Table A3.
Pennsylvania resident enrollment, tuition, and grant aid estimates 2018‐19 to 2021‐22 for community colleges
2018‐19 2019‐20 2020‐21 2021‐22
A: Enrollment
Predicted Enrollment 14,966 14,678 14,803 14,904
Eligible Enrollment 14,966 14,678 14,803 14,904
Enrollment Previous Year 15,097 14,966 14,678 14,803
Predicted Enrollment Increase 926 926 926 926
Total Enrollment 30,990 30,571 30,408 30,633
B: Tuition & Financial Aid
Tuition & fees (in‐district) $5,379 $5,535 $5,695 $5,860
Tuition & fees (in‐state) $9,086 $9,291 $9,501 $9,716
Total tuition & fees $166,696,688 $169,203,319 $173,172,190 $179,506,133
Total grant aid $109,688,125 $111,483,891 $110,906,458 $111,704,329
Tuition & fees net of grant aid $57,008,564 $57,719,428 $62,265,732 $67,801,804
Mobility grants $20,480,575 $20,815,854 $20,708,029 $20,857,016
Total Cost $77,489,139 $78,535,281 $82,973,762 $88,658,820 Source: Keystone Research Center estimates based on Integrated Postsecondary Education Data System (IPEDS) data
17
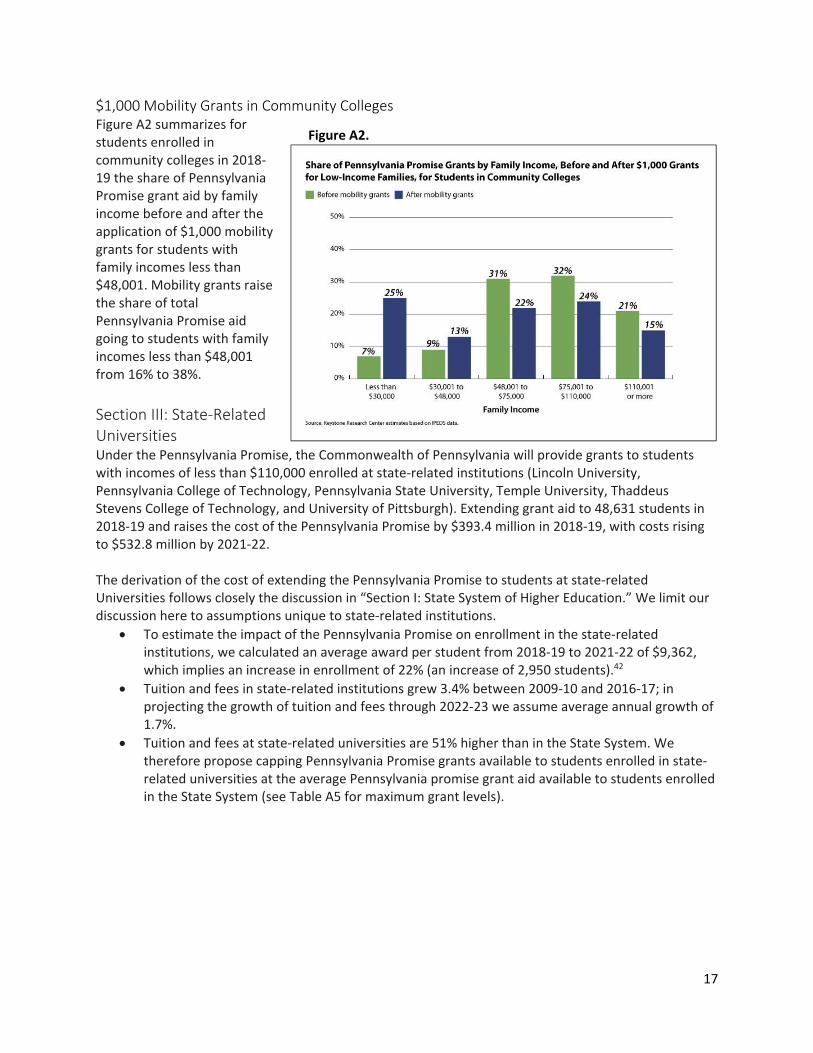
$1,000 Mobility Grants in Community Colleges Figure A2 summarizes for students enrolled in community colleges in 2018‐19 the share of Pennsylvania Promise grant aid by family income before and after the application of $1,000 mobility grants for students with family incomes less than $48,001. Mobility grants raise the share of total Pennsylvania Promise aid going to students with family incomes less than $48,001 from 16% to 38%.
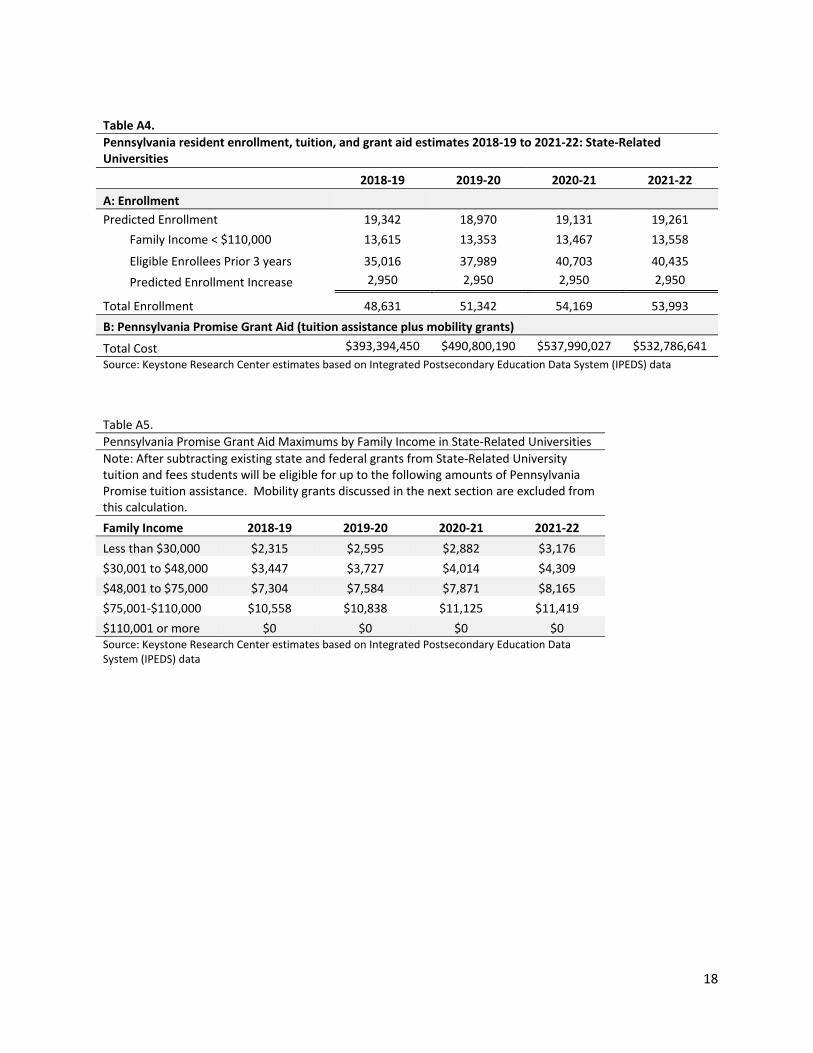
Section III: State‐Related Universities Under the Pennsylvania Promise, the Commonwealth of Pennsylvania will provide grants to students with incomes of less than $110,000 enrolled at state‐related institutions (Lincoln University, Pennsylvania College of Technology, Pennsylvania State University, Temple University, Thaddeus Stevens College of Technology, and University of Pittsburgh). Extending grant aid to 48,631 students in 2018‐19 and raises the cost of the Pennsylvania Promise by $393.4 million in 2018‐19, with costs rising to $532.8 million by 2021‐22. The derivation of the cost of extending the Pennsylvania Promise to students at state‐related Universities follows closely the discussion in “Section I: State System of Higher Education.” We limit our discussion here to assumptions unique to state‐related institutions.
To estimate the impact of the Pennsylvania Promise on enrollment in the state‐related institutions, we calculated an average award per student from 2018‐19 to 2021‐22 of $9,362, which implies an increase in enrollment of 22% (an increase of 2,950 students).42
Tuition and fees in state‐related institutions grew 3.4% between 2009‐10 and 2016‐17; in projecting the growth of tuition and fees through 2022‐23 we assume average annual growth of 1.7%.
Tuition and fees at state‐related universities are 51% higher than in the State System. We therefore propose capping Pennsylvania Promise grants available to students enrolled in state‐related universities at the average Pennsylvania promise grant aid available to students enrolled in the State System (see Table A5 for maximum grant levels).
Figure A2.
18
Table A4.
Pennsylvania resident enrollment, tuition, and grant aid estimates 2018‐19 to 2021‐22: State‐Related Universities
2018‐19 2019‐20 2020‐21 2021‐22
A: Enrollment
Predicted Enrollment 19,342 18,970 19,131 19,261
Family Income < $110,000 13,615 13,353 13,467 13,558
Eligible Enrollees Prior 3 years 35,016 37,989 40,703 40,435
Predicted Enrollment Increase 2,950 2,950 2,950 2,950
Total Enrollment 48,631 51,342 54,169 53,993
B: Pennsylvania Promise Grant Aid (tuition assistance plus mobility grants)
Total Cost $393,394,450 $490,800,190 $537,990,027 $532,786,641
Source: Keystone Research Center estimates based on Integrated Postsecondary Education Data System (IPEDS) data
Table A5.
Pennsylvania Promise Grant Aid Maximums by Family Income in State‐Related Universities
Note: After subtracting existing state and federal grants from State‐Related University tuition and fees students will be eligible for up to the following amounts of Pennsylvania Promise tuition assistance. Mobility grants discussed in the next section are excluded from this calculation.
Family Income 2018‐19 2019‐20 2020‐21 2021‐22
Less than $30,000 $2,315 $2,595 $2,882 $3,176
$30,001 to $48,000 $3,447 $3,727 $4,014 $4,309
$48,001 to $75,000 $7,304 $7,584 $7,871 $8,165
$75,001‐$110,000 $10,558 $10,838 $11,125 $11,419
$110,001 or more $0 $0 $0 $0 Source: Keystone Research Center estimates based on Integrated Postsecondary Education Data System (IPEDS) data
19
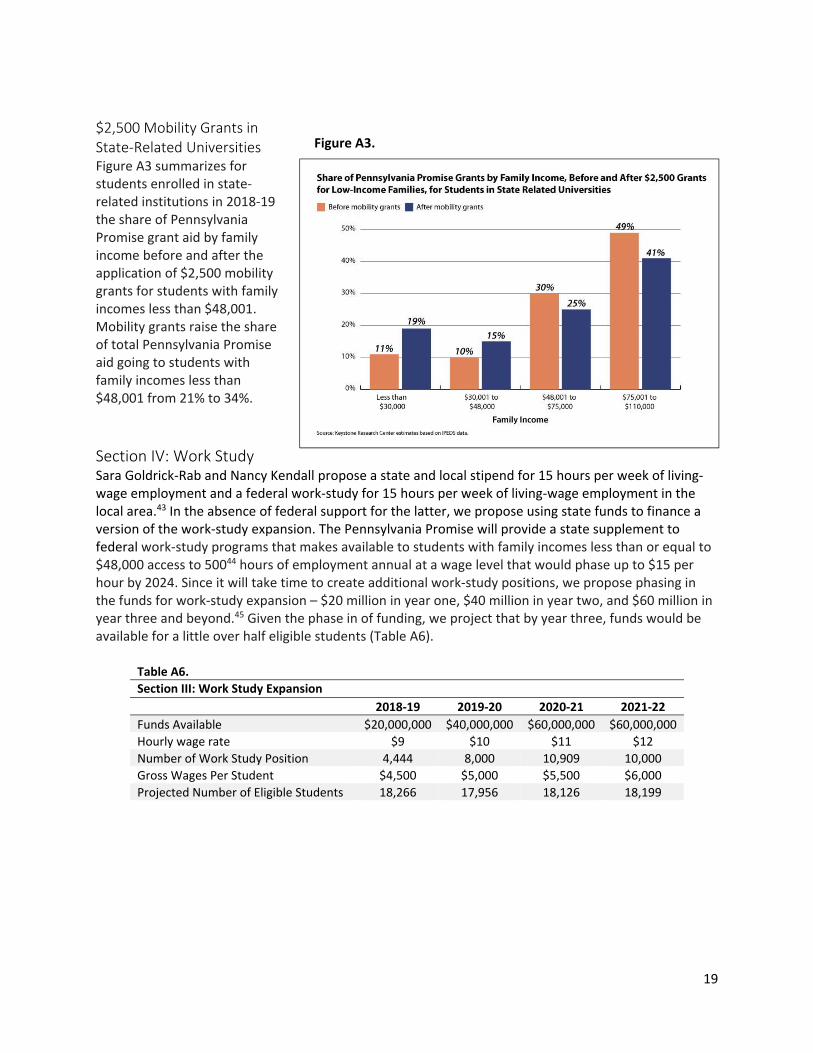
$2,500 Mobility Grants in State‐Related Universities Figure A3 summarizes for students enrolled in state‐related institutions in 2018‐19 the share of Pennsylvania Promise grant aid by family income before and after the application of $2,500 mobility grants for students with family incomes less than $48,001. Mobility grants raise the share of total Pennsylvania Promise aid going to students with family incomes less than $48,001 from 21% to 34%.
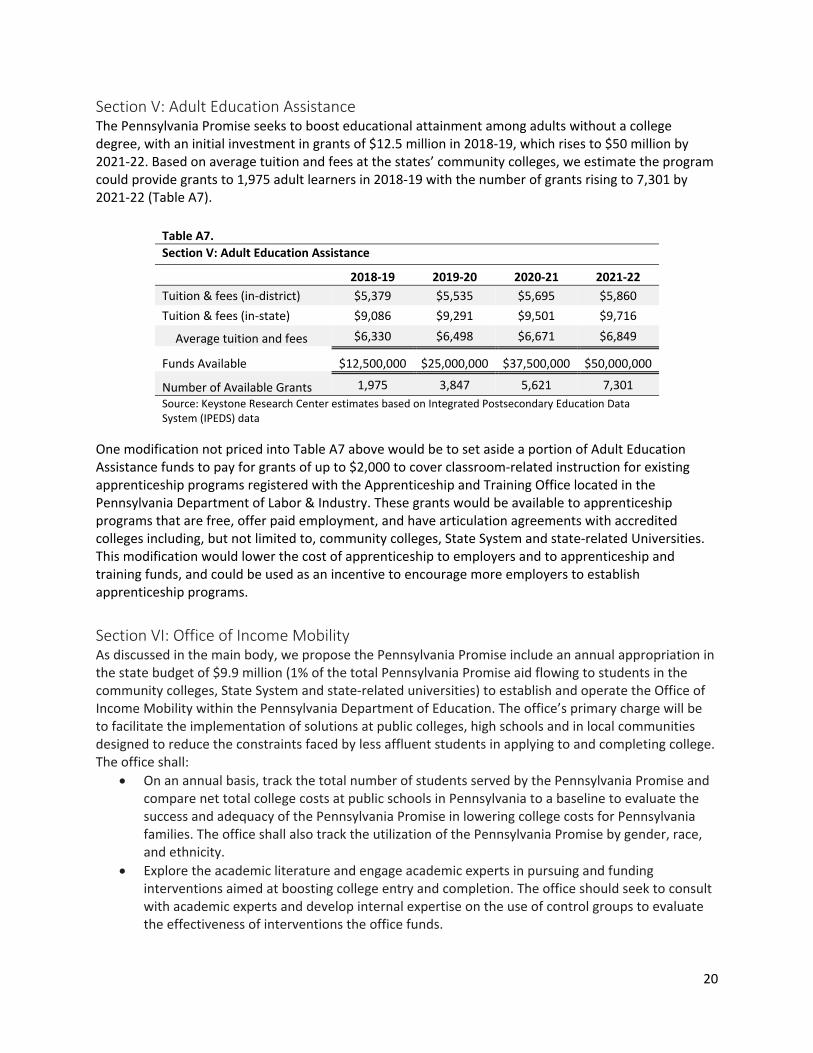
Section IV: Work Study Sara Goldrick‐Rab and Nancy Kendall propose a state and local stipend for 15 hours per week of living‐wage employment and a federal work‐study for 15 hours per week of living‐wage employment in the local area.43 In the absence of federal support for the latter, we propose using state funds to finance a version of the work‐study expansion. The Pennsylvania Promise will provide a state supplement to federal work‐study programs that makes available to students with family incomes less than or equal to $48,000 access to 50044 hours of employment annual at a wage level that would phase up to $15 per hour by 2024. Since it will take time to create additional work‐study positions, we propose phasing in the funds for work‐study expansion – $20 million in year one, $40 million in year two, and $60 million in year three and beyond.45 Given the phase in of funding, we project that by year three, funds would be available for a little over half eligible students (Table A6).
Table A6.
Section III: Work Study Expansion
2018‐19 2019‐20 2020‐21 2021‐22
Funds Available $20,000,000 $40,000,000 $60,000,000 $60,000,000
Hourly wage rate $9 $10 $11 $12
Number of Work Study Position 4,444 8,000 10,909 10,000
Gross Wages Per Student $4,500 $5,000 $5,500 $6,000
Projected Number of Eligible Students 18,266 17,956 18,126 18,199
Figure A3.
20
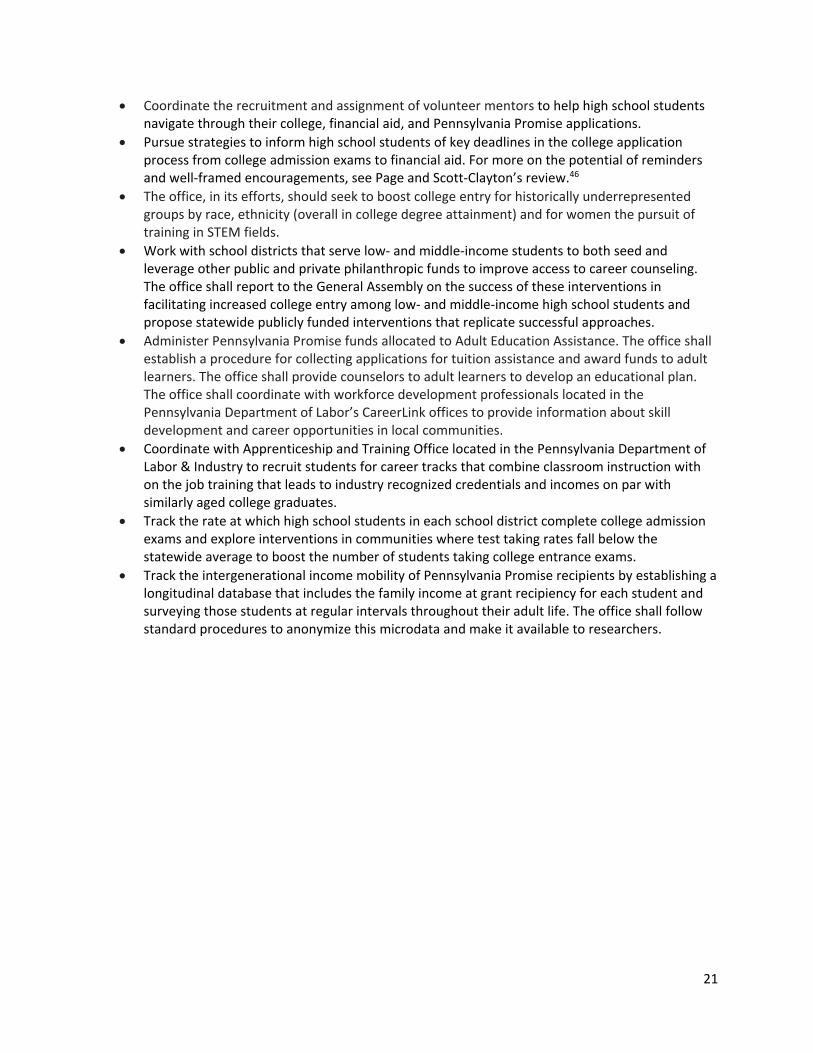
Section V: Adult Education Assistance The Pennsylvania Promise seeks to boost educational attainment among adults without a college degree, with an initial investment in grants of $12.5 million in 2018‐19, which rises to $50 million by 2021‐22. Based on average tuition and fees at the states’ community colleges, we estimate the program could provide grants to 1,975 adult learners in 2018‐19 with the number of grants rising to 7,301 by 2021‐22 (Table A7).
Table A7.
Section V: Adult Education Assistance
2018‐19 2019‐20 2020‐21 2021‐22
Tuition & fees (in‐district) $5,379 $5,535 $5,695 $5,860
Tuition & fees (in‐state) $9,086 $9,291 $9,501 $9,716
Average tuition and fees $6,330 $6,498 $6,671 $6,849
Funds Available $12,500,000 $25,000,000 $37,500,000 $50,000,000
Number of Available Grants 1,975 3,847 5,621 7,301
Source: Keystone Research Center estimates based on Integrated Postsecondary Education Data System (IPEDS) data
One modification not priced into Table A7 above would be to set aside a portion of Adult Education Assistance funds to pay for grants of up to $2,000 to cover classroom‐related instruction for existing apprenticeship programs registered with the Apprenticeship and Training Office located in the Pennsylvania Department of Labor & Industry. These grants would be available to apprenticeship programs that are free, offer paid employment, and have articulation agreements with accredited colleges including, but not limited to, community colleges, State System and state‐related Universities. This modification would lower the cost of apprenticeship to employers and to apprenticeship and training funds, and could be used as an incentive to encourage more employers to establish apprenticeship programs.
Section VI: Office of Income Mobility As discussed in the main body, we propose the Pennsylvania Promise include an annual appropriation in the state budget of $9.9 million (1% of the total Pennsylvania Promise aid flowing to students in the community colleges, State System and state‐related universities) to establish and operate the Office of Income Mobility within the Pennsylvania Department of Education. The office’s primary charge will be to facilitate the implementation of solutions at public colleges, high schools and in local communities designed to reduce the constraints faced by less affluent students in applying to and completing college. The office shall:
On an annual basis, track the total number of students served by the Pennsylvania Promise and compare net total college costs at public schools in Pennsylvania to a baseline to evaluate the success and adequacy of the Pennsylvania Promise in lowering college costs for Pennsylvania families. The office shall also track the utilization of the Pennsylvania Promise by gender, race, and ethnicity.
Explore the academic literature and engage academic experts in pursuing and funding interventions aimed at boosting college entry and completion. The office should seek to consult with academic experts and develop internal expertise on the use of control groups to evaluate the effectiveness of interventions the office funds.
21
Coordinate the recruitment and assignment of volunteer mentors to help high school students navigate through their college, financial aid, and Pennsylvania Promise applications.
Pursue strategies to inform high school students of key deadlines in the college application process from college admission exams to financial aid. For more on the potential of reminders and well‐framed encouragements, see Page and Scott‐Clayton’s review.46
The office, in its efforts, should seek to boost college entry for historically underrepresented groups by race, ethnicity (overall in college degree attainment) and for women the pursuit of training in STEM fields.
Work with school districts that serve low‐ and middle‐income students to both seed and leverage other public and private philanthropic funds to improve access to career counseling. The office shall report to the General Assembly on the success of these interventions in facilitating increased college entry among low‐ and middle‐income high school students and propose statewide publicly funded interventions that replicate successful approaches.
Administer Pennsylvania Promise funds allocated to Adult Education Assistance. The office shall establish a procedure for collecting applications for tuition assistance and award funds to adult learners. The office shall provide counselors to adult learners to develop an educational plan. The office shall coordinate with workforce development professionals located in the Pennsylvania Department of Labor’s CareerLink offices to provide information about skill development and career opportunities in local communities.
Coordinate with Apprenticeship and Training Office located in the Pennsylvania Department of Labor & Industry to recruit students for career tracks that combine classroom instruction with on the job training that leads to industry recognized credentials and incomes on par with similarly aged college graduates.
Track the rate at which high school students in each school district complete college admission exams and explore interventions in communities where test taking rates fall below the statewide average to boost the number of students taking college entrance exams.
Track the intergenerational income mobility of Pennsylvania Promise recipients by establishing a longitudinal database that includes the family income at grant recipiency for each student and surveying those students at regular intervals throughout their adult life. The office shall follow standard procedures to anonymize this microdata and make it available to researchers.
22
End Notes
1 1) Pennsylvania's Great Working‐Class Colleges https://goo.gl/uysc3F 2) At Students’ Expense: Rising Costs Threaten Pennsylvania Public Universities’ Role in Upward Mobility https://goo.gl/zxEQuJ 3) Pennsylvania Higher Education at a Crossroads: To Boost Opportunity and Growth, Pennsylvania Needs to Invest in Higher Education https://goo.gl/TH5KFy 2 Ranked from best (1) to worst (50) Pennsylvania ranked 47 on low debt at graduate, 48 on tuition and fees and 37 on 2‐year college graduation rate with an overall ranking of 50 for higher education see Best States for Higher Education, U.S. News & World Report, https://www.usnews.com/news/best‐states/rankings/education/higher‐education 3 Eugene Henninger‐Voss and Stephen Herzenberg, “Pennsylvania Higher Education at a Crossroads: To Boost Opportunity and Growth, Pennsylvania Needs to Invest in Higher Education,” Keystone Research Center and Pennsylvania Budget and Policy Center, August 18, 2017, https://www.keystoneresearch.org/publications/research/pennsylvania‐higher‐education‐crossroads‐boost‐opportunity‐and‐growth‐pennsylv see Page 10. 4 Ibid., 11. 5 For further discussion and references, see Stephen Herzenberg, Mark Price, and Michael Wood, “A Must Have for Education, Part Two: Investment in Higher Education for Growth and Opportunity,” Keystone Research Center and Pennsylvania Budget and Policy Center, October 2014, pp. 3‐6; https://www.keystoneresearch.org/publications/research/investment‐higher‐education 6 Wall Street Journal, May 30, 2017; https://www.wsj.com/articles/rural‐america‐is‐the‐new‐inner‐city‐1495817008 7 Nicholas Hillman and Taylor Weichman, “Education Deserts: The continued significance of “Place” in the Twenty‐First Century”, American Council on Education & Center for Policy Research and Strategy, 2016, https://goo.gl/WnfNB8, label 15 counties in central, northern, and western PA as “education deserts”. These are areas where either 1. Zero colleges or universities located nearby or 2. One community college “is the only public broad access institution near‐by.” “Broad access” is defined as having an acceptance rate of greater than 75%. “Near‐by” is defined as located within the same Commuting Zone (from the 1990 census), metropolitan, or metropolitan statistical area. 8 State Related Universities include Lincoln University, Pennsylvania College of Technology, Pennsylvania State University, Temple University, Thaddeus Stevens College of Technology, and University of Pittsburgh 9 The source for this ranking and for our estimates of the change in ranking with alternative proposals for providing free tuition is the University of Illinois Grapevine data base online at https://education.illinoisstate.edu/grapevine/. For a bar graph comparing funding per capita in all 50 states, see Diana Polson, Stephen Herzenberg, and Mark Price, “At Students’ Expense: Rising Costs Threaten Pennsylvania Public Universities’ Role in Upward Mobility,” Keystone Research Center and Pennsylvania Budget and Policy Center, June 2017, Figure 1; https://goo.gl/zxEQuJ 10 According to the 2017‐18 Governor’s Executive Budget, p. B‐3, the Pennsylvania 3.07% Personal Income Tax is projected to raise $14.28 billion in 2018‐19. Thus, each point raises 4.65 billion, one fourth of which is $1.16 billion. 11 The Fair Share Tax increases the tax on income from dividends; net income [from a business, profession, or farm]; capital gains; net income from rents, royalties, patents, and copyrights; gambling and lottery winnings; and income from estates or trusts. from 3.07% to 6.5% and decreases the tax on wages and interest from 3.07% to 2.8%. In total the Fair Share Tax raises $2 billion in new revenue. For more see Marc Stier, “A Fair Share Tax to Support Public Investment in Pennsylvania,” Pennsylvania Budget and Policy Center, March 22, 2017, http://www.pennbpc.org/sites/pennbpc.org/files/20170321_FairShareTaxReport.pdf 12 Based on Independent Fiscal Office analysis (April 2017), we calculate that a severance tax matching the West Virginia severance tax would have raised over and above existing impact fee revenues another $912 million in 2010 in Pennsylvania. 13 Financial assets of households and non‐profit organizations equaled $78.3 trillion in the second quarter of 2017 (https://www.federalreserve.gov/releases/z1/current/html/b101.htm). We assume that the Pennsylvania share of U.S. financial assets equals the Pennsylvania share (2.78%) of the net worth held by people with more than $2 million in assets in 2007 (http://www.irs.gov/file_source/pub/irs‐soi/07in06pw.xls). (The year 2007 was the last
23
time these personal wealth statistics by state are reported; https://www.irs.gov/statistics/soi‐tax‐stats‐personal‐wealth‐statistics#2.) Thus, Pennsylvania financial wealth equals $2,179 billion. A 0.054% tax on this amount would raise $1.18 billion. 14 One possible modification from the baseline for the Pennsylvania Promise would be to offer grants of up to $2,000 to cover classroom related instruction for adults enrolled in apprenticeship program registered with the Apprenticeship and Training Office in the Pennsylvania Department of Labor & Industry. Eligible apprenticeship programs would be free to students, provide paid employment associated with the apprenticeship and have articulation agreements with accredited colleges including but not limited to community colleges and State System schools. 15 Sara Goldrick‐Rab and Nancy Kendall, “F2CO: Redefining College Affordability: Security America’s Future with a Free Two‐year College Option,” April 2014, http://wihopelab.com/publications/Redefining_College_Affordability.pdf, see especially p. 21. 16 For a compelling summary of changes in college enrollment and persistence by income see Sara Goldrick‐Rab and Nancy Kendall, “F2CO: Redefining College Affordability: Securing America’s Future with a Free Two Year College Option”, The EduOptimists, April 2014, http://theeduoptimists.com/2014/04/redefining‐college‐affordability‐securing‐americas‐future‐with‐a‐free‐two‐year‐college‐option.html 17 Mark Price, “Pennsylvania's Great Working‐Class Colleges”, Keystone Research Center, April 24, 2017, https://goo.gl/uysc3F 18 For a review of the literature see David Deming and Susan Dynarski, “Into College, Out of Poverty? Policies To Increase The Postsecondary Attainment of the Poor”, NBER Working Paper 15387, September 2009, http://www.nber.org/papers/w15387 see also Lindsay C. Page and Judith Scott‐Clayton, “Improving college access in the United States: Barriers and policy response”, NBER Working Paper No. 21781, December 2015, http://www.nber.org/papers/w21781 19 Lindsay C. Page and Judith Scott‐Clayton, “Improving college access in the United States: Barriers and policy response,” NBER Working Paper No. 21781, December 2015, http://www.nber.org/papers/w21781 20 The net total cost of college is defined as the average annual total cost of attendance, including tuition and fees, books, and supplies, and living expenses, minus the average grant/scholarship aid. It is calculated for all full‐time, first‐time, degree/certificate‐seeking undergraduates who receive Title IV aid. It is included in the IPEDS Student Financial Aid component. Separate metrics are calculated for public institutions and private institutions. For public institutions, this metric is limited to undergraduates who pay in‐state tuition and receive Title IV aid. For private institutions, it includes all undergraduates who receive Title IV aid. The total cost of attendance depends on whether undergraduates live on campus, off campus (not with family), or off campus (with family) 21 Gross wages would climb to $7,500 for 500 hours of work at $15 per hour in 2024. The proposed wage levels follow our proposed schedule for increases in the Pennsylvania minimum wage see Mark Price and Stephen Herzenberg, “The State of Working Pennsylvania”, Keystone Research Center, September 2017, https://www.keystoneresearch.org/publications/research/state‐working‐pennsylvania‐2017 22 Based on our analysis of Mobility Report Cards: The Role of Colleges in Intergenerational Mobility http://www.equality‐of‐opportunity.org/college/ 23 Based on our analysis of American Community Survey 2011‐2015 data https://goo.gl/JAN1wL 24 We are defining middle‐income taxpayers here as families with incomes between $60,000 and $95,000. Data on tax incidence is provided by the Institute on Taxation and Economic Policy, “Who Pays?”, January 2015, https://itep.org/whopays/pennsylvania/ 25 Based on Independent Fiscal Office analysis (April 2017), we calculate that a severance tax matching the West Virginia severance tax would have raised over and above existing impact fee revenues another $912 million in 2010 in Pennsylvania. 26 Analysis by the Institute on Taxation and Economic Policy (ITEP) finds that leaving the current personal income tax rate fixed at 3.07% on all wage and interest income while raising the personal income tax rate to 4.36% on all other classes of income including dividends, capital gains, net profits would raises taxes on average in 2018 by: $2 on families with incomes less than $23,000, $8 on families with incomes between $22,000 and $42,000, $19 on families with incomes between $42,000 and $66,000, $62 on families with incomes between $66,000 and $109,000, $162 on families with income between $109,000 and $226,000, $787 on families with incomes between $215,000 and $563,000 and $8,455 on families with an income over $563,000. In total this tax change would raise in $1 billion in 2018.
24
27 Analysis by the Institute on Taxation and Economic Policy (ITEP) finds that raising the current personal income tax rate from 3.07% to 3.32% in 2018 would raises taxes on average by $15 on families with incomes less than $23,000, $40 on families with incomes between $22,000 and $42,000, $79 on families with incomes between $42,000 and $66,000, $155 on families with incomes between $66,000 and $109,000, $294 on families with income between $109,000 and $226,000, $654 on families with incomes between $215,000 and $563,000 and $3,056 on families with an income over $563,000. In total this tax change would raise $1 billion in 2018. 28 Financial assets of households and non‐profit organizations equaled $78.3 trillion in the second quarter of 2017 (https://www.federalreserve.gov/releases/z1/current/html/b101.htm). We assume that the Pennsylvania share of U.S. financial assets equals the Pennsylvania share (2.78%) of the net worth held by people with more than $2 million in assets in 2007 (http://www.irs.gov/file_source/pub/irs‐soi/07in06pw.xls). (The year 2007 was the last time these personal wealth statistics by state are reported; https://www.irs.gov/statistics/soi‐tax‐stats‐personal‐wealth‐statistics#2.) Thus, Pennsylvania financial wealth equals $2,179 billion. A 0.054% tax on this amount would raise $1.18 billion. A 0.054% wealth tax for a taxpayer with $1 million in financial assets would mean an annual tax bill of $540. This wealth tax for a taxpayer with $50,000 in financial assets would mean an annual tax bill of $27. 29 Stephen Herzenberg, “Corporate Tax Cuts Since 2002 Now Cost PA $3.25 Billion Yearly”, Pennsylvania Budget and Policy Center, Forthcoming. 30 This is a comparison of the split income growth between 1979 and 2007 with 2007 being the most recent peak of the business cycle. Those that prefer a more recent estimate the top 1% of earners have 44% of income growth between 1979 and 2014 (the most recent year of data available). As the current business cycle has not yet peaked the income split between the top 1% and the bottom 99% measured for 2015, 2016 and 2017 will likely improve moving closer to the average measured from 1979 to 2007. 31 State System schools include: Bloomsburg, California, Cheyney, Clarion, East Stroudsburg, Edinboro, Indiana, Kutztown, Lock Haven, Mansfield, Millersville, Shippensburg, Slippery Rock, and West Chester 32 Full‐time first‐time degree/certificate seeking undergraduates in State System schools from 2010‐11 to 2014‐15 averaged 13.8% of high school graduates over the same period. Data on full‐time first‐time degree/certificate seeking undergraduates paying in‐state tuition rates is tracked in the Student Financial Aid data file (variable named “scfa12n”) of the Integrated Postsecondary Education Data System (IPEDS). The total number of high school graduates through 2015‐16 and projections from 2016‐17 to 2021‐22 were generously provided by Alan Shay at the State System of Higher Education. Shay’s data and estimates are based on Pennsylvania Department of Health "Pennsylvania Vital Statistics 1997‐2015.”; Pennsylvania Department of Education Public High School Graduates 2003‐2016; Pennsylvania Department of Education Public High School Enrollment 2003‐2016; projections of high school graduates from 2016‐17 to 2021‐22 were based on Western Interstate Commission for Higher Education (WICHE) "Knocking at the College Door: Projections of High School Graduates." Issued December 2012. Updated by the Office of Educational Intelligence May 22, 2017. 33 Based on the Student Financial Aid data file for 2014‐15 from IPEDS we estimate that 76% of the students enrolled in the state system have family incomes less than $110,000 (summing across State System schools the variables (gis4n12+gis4n22+gis4n32 +gis4n42)/gis4n2). 34 Lindsay C. Page ([email protected]), Aizat Nurshatayeva, and Danielle Lowry, “The private labor market returns from decreasing the financial cost of college for low‐income students”, Unpublished Working Paper, April 14, 2017 35 We estimate an average award per student over four years of (see Table A1) of $7,402. 36 In‐state tuition and fees rose at an average annual rate of 5% in the state system from 2009‐10 to 2016‐17. Assuming increased state support for higher education tuition is assumed to rise at half that pace (2.5%) over the period of our analysis. 37 Based on data from the Student Financial Aid data file of the Integrated Postsecondary Education Data System (IPEDS) for 2014‐15 (variables “gis4n12”, “gis4n22”, “gis4n32”, & “gis4n42”) we distribute enrollment (row 3 of panel A of Table A2) for each year assuming the same distribution by family income. We adjust these figures by the percent of students in each income group in 2014‐15 that were awarded any grant/scholarship aid (variables “gis4g12”, “gis4g22”, “gis4g32”, “gis4g42”). We distribute the predicted increase in enrollment (row 4 of panel A of Table A2) assuming the same distribution of students by family income in 2014‐15. We then multiply our total enrollment figure within each income group by the average amount of grant and scholarship aid awarded in 2014‐15 (variables “gis4a12”, “gis4a22”, “gis4a32”, and “gis4a42”). Multiplying by enrollment for each income group and summing across those groups we arrive a total dollar value of existing grant aid for first‐time full‐time students
25
who are PA residents. We arrive at a total for two years of students by repeating the same procedure for the previous year; in effect we are assuming that grant amounts for students in their second year are identical to their first‐year award. Staff at the State System confirmed that grant amounts for their students in their second year were almost identical. We were not able to determine if the same pattern prevails among students enrolled in community colleges and state‐related institutions. Another key and related assumption here is that federal and state grant aid will remain fixed at 2014‐15 levels. If other federal and state grant sources fall or increase over time that will introduce error into our cost estimates. 38 Average grant aid for State System students by family income in 2014‐15 was $8,812 for family incomes less than $30,000; $7,710 for those with incomes between $30,001 and $48,000; $4,189 for those with incomes between $48,001 and $75,000 and $1,192 for family incomes between $75,001 and $110,000. Given this distribution of grant aid a free college plan that covers tuition and fees after all other existing federal and state grants distributes a larger share of financial aid to students with family incomes between $48,001 and $110,00 (see Figure A2 in the main body). Students with family incomes less than $48,001 account for 22% of new aid while students with family incomes over $48,000 capturing the remaining 78% of aid. Instituting a minimum grant of $2,000 for students with incomes less than $48,001 raises their share of total grant aid to 32%. As illustrated in Table 2 in the main body of the paper, the total cost of attendance (note we assume that the total cost of attendance rises at the same rate of tuition and fees between 2014‐15 and 2018‐19) for State System students falls in a range between 26% and 30% for the two lowest income groups of students (those earnings less than $48,001). The total cost of attendance falls 32% for students with family incomes between $48,001 and $75,000 and falls 40% for family incomes between $75,001 and $110,00. 39 Community colleges include: Bucks County Community College, Butler County Community College, Community College of Allegheny County, Community College of Beaver County, Community College of Philadelphia, Delaware County Community College, Harrisburg Area Community College, Lehigh Carbon Community College, Luzerne County Community College, Montgomery County Community College, Northampton County Area Community College, Pennsylvania Highlands Community College, Reading Area Community College, and Westmoreland County Community College. 40 Lindsay C. Page ([email protected]), Aizat Nurshatayeva, and Danielle Lowry, “The private labor market returns from decreasing the financial cost of college for low‐income students,” Unpublished Working Paper, April 14, 2017 41 Data on the number of students paying in‐district (variable “scfa11n”) and in‐state (variable “scfa12n”) tuition is derived from the Student Financial Aid data file for 2014‐15 of the Integrated Postsecondary Education Data System (IPEDS). 42 Lindsay C. Page ([email protected]), Aizat Nurshatayeva, and Danielle Lowry, “The private labor market returns from decreasing the financial cost of college for low‐income students”, Unpublished Working Paper, April 14, 2017 43 Goldrick‐Rab and Kendall, “F2CO: Redefining College Affordability: Security America’s Future with a Free Two‐year College Option,” p. 21. 44 Five hundred hours equals approximately 15 hours of employment per week for 34 weeks during the school year. 45 In 2016‐17, Pennsylvania drew down $50.1 million for federal work study across all public and private colleges, of which $3.8 million and $14.6 million were for public two‐year and public four‐year institutions (see Table 8 at https://www2.ed.gov/finaid/prof/resources/data/databook2016/databook2016.html). If a bit less than half the $14.6 million goes to State System students, these data suggest that our proposal would be twice the scale of work study at community colleges and State System schools in year one and six times by year three. If expanding the number of positions this quickly proves, the cap for individual awards could be increased to 1,000 hours, potentially allowing students to work full‐time during the summer as well as 15 hours per week in the school year. 46 Lindsay C. Page and Judith Scott‐Clayton, “Improving college access in the United States: Barriers and policy response,” NBER Working Paper No. 21781, December 2015, http://www.nber.org/papers/w21781