the past, present, and future of economic growth the past, present, and future of economic growth...
TRANSCRIPT

1
The Past, Present, and Future of
Economic Growth
Dani Rodrik
Abstract Developing countries will face stronger headwinds in the decades ahead, both because the global
economy is likely to be significantly less buoyant than in recent decades and because technological
changes are rendering manufacturing more capital and skill intensive. Desirable policies will continue to
share features that have served successful countries well in the past, but growth strategies will differ in
their emphasis. Ultimately, growth will depend primarily on what happens at home. The challenge is
therefore to design an architecture that respects the domestic priorities of individual countries while
ensuring that major cross-border spillovers and global public goods are addressed.
Keywords: Economic growth, cross-border spillovers, income distribution, China, income
inequality, industrialization, global supply chains, natural resource exporters
WORKING PAPER 1 JUNE 2013 Global Citizen Foundation
Phone: +41 (0) 225 18 0265
e-mail: [email protected]

2
The Past, Present, and Future of Economic Growth
Dani Rodrik
1. Introduction
The last decade has been an extraordinarily good one for developing countries and their mostly
poor citizens—so good in fact that it has become commonplace to look upon them as potential
saviors of the world economy. Their economies have expanded at unprecedented rates, resulting
both in a large reduction in extreme poverty and a significant expansion of the middle class.
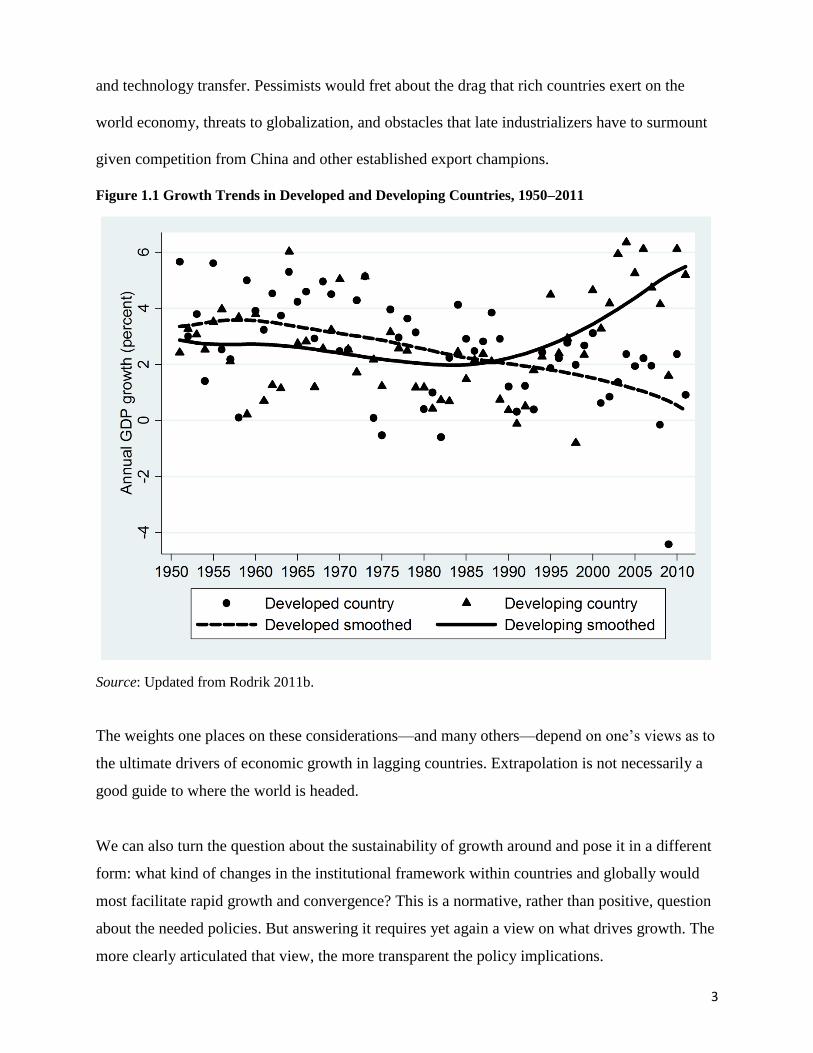
Recently, the differential between the growth rates of developing and advanced countries
expanded to more than 5 percentage points, assisted in part by the decline in the economic
performance of the rich countries (figure 1.1). China, India, and a small number of other Asian
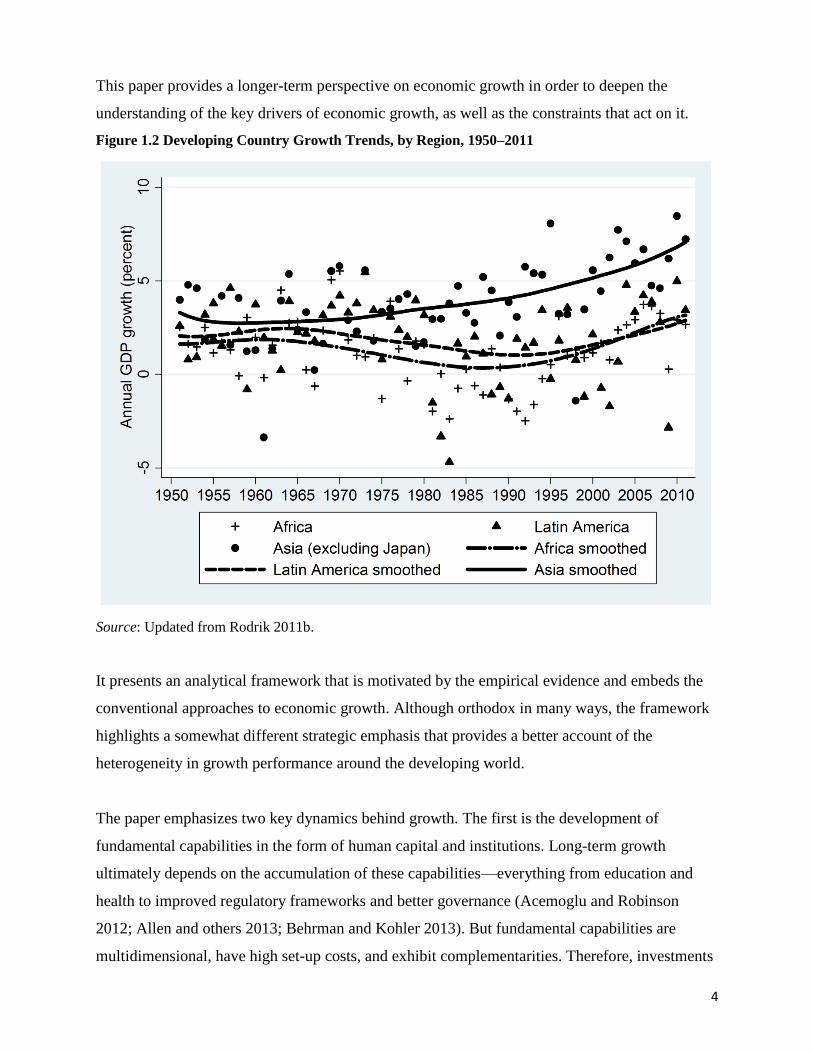
countries were responsible for the bulk of this superlative performance. But Latin America and
Africa resumed growth as well, catching up with (and often surpassing) the growth rates they
experienced during the 1950s and 1960s (figure 1.2).
Economic growth is a precondition for the improvement of living standards and lifetime
possibilities for the “average” citizen of the developing world. Can this recent performance be
sustained into the future, decisively reversing the “great divergence” that split the world into rich
and poor countries since the 19th century?
In answering this question, optimists would point to improvements in governance and
macroeconomic policy in developing countries and to the still not-fully exploited potential of
economic globalization to foster new industries in the poor regions of the world by outsourcing
Dani Rodrik is the Rafiq Hariri Professor of International Political Economy at the John F. Kennedy
School of Government, Harvard University. He is grateful for comments and suggestion by all the
participants in the Towards a Better Global Economy project, especially Jere Behrman, Kemal Derviş,
and Chang-Tai Hsieh. This paper was prepared for the Towards a Better Global Economy Project funded
by the Global Citizen Foundation. The author alone is responsible for its content. Comments or questions
should be directed to [email protected].
3
and technology transfer. Pessimists would fret about the drag that rich countries exert on the
world economy, threats to globalization, and obstacles that late industrializers have to surmount
given competition from China and other established export champions.
Figure 1.1 Growth Trends in Developed and Developing Countries, 1950–2011
Source: Updated from Rodrik 2011b.
The weights one places on these considerations—and many others—depend on one’s views as to
the ultimate drivers of economic growth in lagging countries. Extrapolation is not necessarily a
good guide to where the world is headed.
We can also turn the question about the sustainability of growth around and pose it in a different
form: what kind of changes in the institutional framework within countries and globally would
most facilitate rapid growth and convergence? This is a normative, rather than positive, question
about the needed policies. But answering it requires yet again a view on what drives growth. The
more clearly articulated that view, the more transparent the policy implications.
4
This paper provides a longer-term perspective on economic growth in order to deepen the
understanding of the key drivers of economic growth, as well as the constraints that act on it.
Figure 1.2 Developing Country Growth Trends, by Region, 1950–2011
Source: Updated from Rodrik 2011b.
It presents an analytical framework that is motivated by the empirical evidence and embeds the
conventional approaches to economic growth. Although orthodox in many ways, the framework
highlights a somewhat different strategic emphasis that provides a better account of the
heterogeneity in growth performance around the developing world.
The paper emphasizes two key dynamics behind growth. The first is the development of
fundamental capabilities in the form of human capital and institutions. Long-term growth
ultimately depends on the accumulation of these capabilities—everything from education and
health to improved regulatory frameworks and better governance (Acemoglu and Robinson
2012; Allen and others 2013; Behrman and Kohler 2013). But fundamental capabilities are
multidimensional, have high set-up costs, and exhibit complementarities. Therefore, investments
5
in them tend to yield paltry growth payoffs until a sufficiently broad range of capabilities has
already been accumulated—that is, until relatively late in the development process. Growth
based on the accumulation of fundamental capabilities is a slow, drawn-out affair.
The second is structural transformation—the birth and expansion of new (higher-productivity)
industries and the transfer of labor from traditional or lower-productivity activities to modern
ones. With the exception of natural-resource bonanzas, extraordinarily high growth rates are
almost always the result of rapid structural transformation, industrialization in particular. Growth
miracles are enabled by the fact that industrialization can take place in the presence of a low
level of fundamental capabilities: poor economies can experience structural transformation even
when skills are low and institutions weak. This process helps explains the rapid take-off of East
Asian countries in the postwar period, from Taiwan in the late 1950s to China in the late 1970s.
The policies needed to accumulate fundamental capabilities and those required to foster
structural change naturally overlap, but they are distinct. The first types of policies entail a much
broader range of investments in skills, education, administrative capacity, and governance; the
second can take the form of narrower, targeted remedies. Without some semblance of
macroeconomic stability and property rights protection, new industries cannot emerge. But a
country does not need to attain Sweden’s level of institutional quality in order to be able to
compete with Swedish producers on world markets in many manufactures. Furthermore, as I
discuss below, fostering new industries often requires second-best, unconventional policies that
are in tension with fundamentals. When successful, heterodox policies work precisely because
they compensate for weakness in those fundamentals.
As an economy develops, the dualism between modern and traditional sectors disappears and
economic activities become more complex across the board. Correspondingly, these two drivers
merge, along with the sets of policies that underpin them. Fundamentals become the dominant
force over structural transformation. Put differently, if strong fundamentals do not eventually
come into play, growth driven by structural transformation runs out of steam and falters.
This paper is organized as follows. The next section describes the consequences of recent growth
performance on the global income distribution. The salient facts that emerge from the analysis
are that growth in developing countries (especially China) has been a boon to the “average
6
citizen” of the world and created a new global middle class. Section 3 examines economic
history. It highlights the role of differential patterns of industrialization in shaping the great
divergence in the world economy between a rich core and a poor periphery. Section 4
summarizes the growth record to date in the form of six empirical regularities (“stylized facts”).
Key among them is the presence of unconditional labor-productivity convergence in
manufacturing industries. Section 5 interprets the policy experience of successful economies in
light of this empirical background. Section 6 presents an explicit analytical framework that
distinguishes distinction among three types of economic sectors: a traditional sector with
stagnant technology; a modern service sector, where productivity depends on (slow-moving)
fundamental capabilities; and an industrial sector that benefits in addition from an
unconventional convergence dynamic. Section 7 uses the framework to present a 2 x 2 typology
of growth outcomes based on the evolution of capabilities and the speed of structural
transformation. The analysis yields four cases: no growth, slow growth, episodic growth, and
rapid sustained growth. Section 8 formally defines the limits to industrialization. Section 9
examines the quantitative limits to industrialization. Extensions of the framework to global
supply chains (section 9) and natural resource exporters (section 10) are followed by a prognosis
(section 11) and discussion of policy implications (section 12).
2. How Is the “Average” Person Doing? Growth and the Global Income Distribution
The “average individual” can be defined as the person in the middle of the global income
distribution—that is, the individual who receives the median level of income in the global
economy. One way of gauging the extent of global inequality is to compare the income of the
average individual to average global income (that is, global gross domestic product [GDP] per
capita). Were income distributed evenly, median and average incomes would coincide. The more
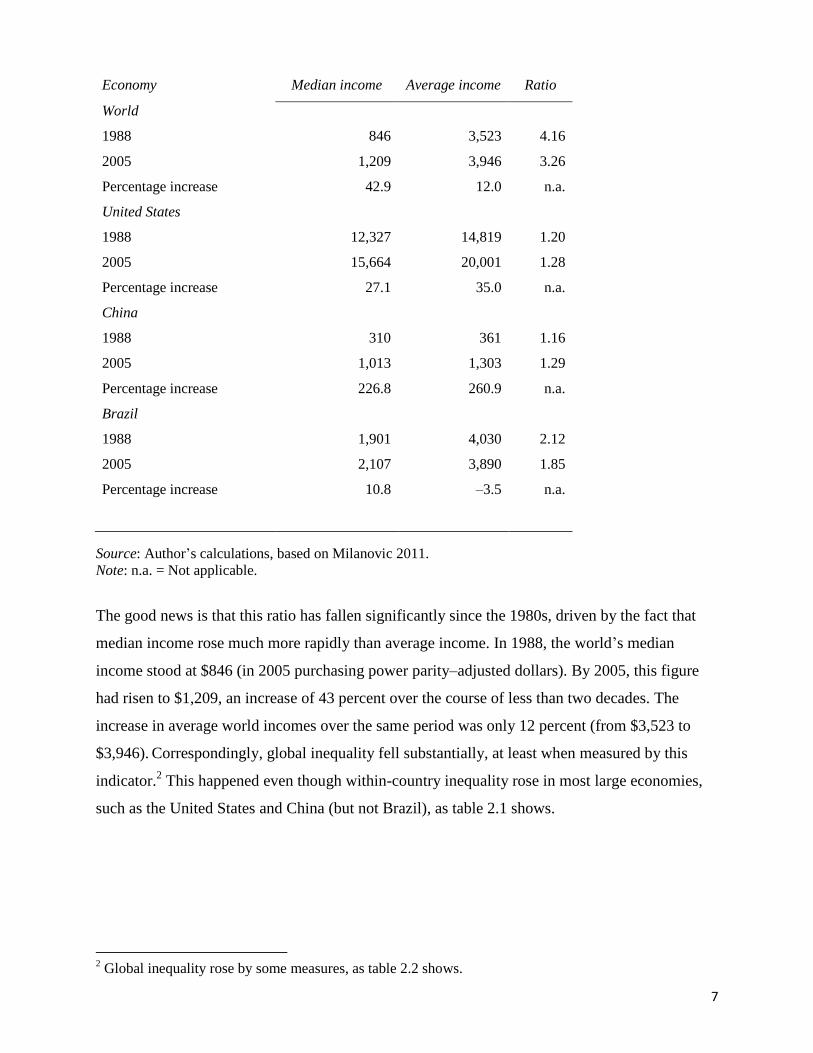
unequal the world economy is, the larger is the gap between the two. As the figures in table 2.1
show, the ratio between average and median income is very large for the world as a whole,
roughly twice what is observed in the world’s most unequal societies (such as Brazil). Global
inequality is thus much higher than within-country inequality.1
Table 2.1 Median and Average Income in World and Selected Countries, 1988 and 2005
1 These numbers were calculated from data put together by Branko Milanovic of the World Bank
(Milanovic 2011). Because they derive from national household surveys, they do not match (and in
general are lower than) income levels reflected in GDP per capita statistics.
7
Economy Median income Average income Ratio
World
1988 846 3,523 4.16
2005 1,209 3,946 3.26
Percentage increase 42.9 12.0 n.a.
United States
1988 12,327 14,819 1.20
2005 15,664 20,001 1.28
Percentage increase 27.1 35.0 n.a.
China
1988 310 361 1.16
2005 1,013 1,303 1.29
Percentage increase 226.8 260.9 n.a.
Brazil
1988 1,901 4,030 2.12
2005 2,107 3,890 1.85
Percentage increase 10.8 –3.5 n.a.
Source: Author’s calculations, based on Milanovic 2011.
Note: n.a. = Not applicable.
The good news is that this ratio has fallen significantly since the 1980s, driven by the fact that
median income rose much more rapidly than average income. In 1988, the world’s median
income stood at $846 (in 2005 purchasing power parity–adjusted dollars). By 2005, this figure
had risen to $1,209, an increase of 43 percent over the course of less than two decades. The
increase in average world incomes over the same period was only 12 percent (from $3,523 to
$3,946). Correspondingly, global inequality fell substantially, at least when measured by this
indicator.2 This happened even though within-country inequality rose in most large economies,
such as the United States and China (but not Brazil), as table 2.1 shows.
2 Global inequality rose by some measures, as table 2.2 shows.

8
Figure 2.1 shows the change in the global interpersonal distribution of income between 1988 and
2005.3 It shows a rightward-shift in the distribution, indicating a rise in average incomes. Much
more noticeable is the change in the shape of the distribution. In 1988, the global distribution
exhibited clear humps at each end, one for poor countries and another for rich countries (the
latter with a much smaller mass). By 2005, the two humps had virtually disappeared, merging in
the middle of the distribution. What happened in between those dates is that China, which
housed a substantial proportion of the world’s poor in the 1980s, filled out the middle of the
distribution. Since the 1980s, China has transformed itself from a poor country, in which the bulk
of its population stood below the global median, into a middle-income country, in which median
income has caught up with the global median (see table 2.1). Today, China’s income distribution
is centered at the middle of the global income distribution. The result is that the global economy
now has a much larger middle class, with Chinese households making up a large part of it.
Figure 2.1 Global Income Distribution, 1988 and 2005
Source: Author’s calculations, based on Milanovic 2011.
3 The distribution is generated by fitting a kernel smoothing on the ventile or decile data (depending on
availability) for incomes within countries.
9
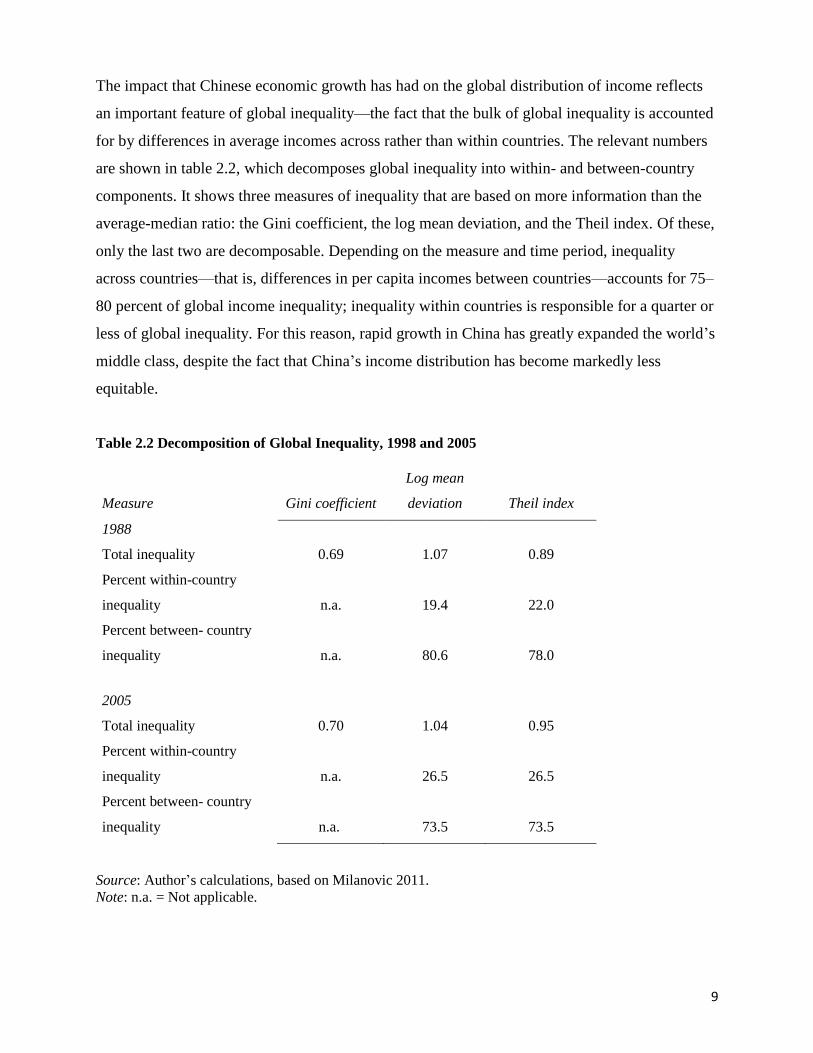
The impact that Chinese economic growth has had on the global distribution of income reflects
an important feature of global inequality—the fact that the bulk of global inequality is accounted
for by differences in average incomes across rather than within countries. The relevant numbers
are shown in table 2.2, which decomposes global inequality into within- and between-country
components. It shows three measures of inequality that are based on more information than the
average-median ratio: the Gini coefficient, the log mean deviation, and the Theil index. Of these,
only the last two are decomposable. Depending on the measure and time period, inequality
across countries—that is, differences in per capita incomes between countries—accounts for 75–
80 percent of global income inequality; inequality within countries is responsible for a quarter or
less of global inequality. For this reason, rapid growth in China has greatly expanded the world’s
middle class, despite the fact that China’s income distribution has become markedly less
equitable.
Table 2.2 Decomposition of Global Inequality, 1998 and 2005
Measure Gini coefficient
Log mean
deviation Theil index
1988
Total inequality 0.69 1.07 0.89
Percent within-country
inequality n.a. 19.4 22.0
Percent between- country
inequality n.a. 80.6 78.0
2005
Total inequality 0.70 1.04 0.95
Percent within-country
inequality n.a. 26.5 26.5
Percent between- country
inequality n.a. 73.5 73.5
Source: Author’s calculations, based on Milanovic 2011.
Note: n.a. = Not applicable.

10
A longer-term perspective can be obtained by combining these data with the historical evidence
on global income distribution provided by Bourguignon and Morrisson (2002), which goes back
to the early part of the 19th century. The within-country component of global inequality
remained relatively stable over the long term. But the between-country component rose sharply,
from 5 log-points in 1820 to 33 log-points in 1929 to 76 log-points in 2005 (figure 2.2). The
share of global inequality that is accounted for by between-country inequality rose from 12
percent in 1820 to 73 percent in 2005. Thanks to differential patterns of economic growth in
different parts of the world, it is increasingly the country in which one is born that determines
one’s economic fortunes (Milanovic 2011).
Figure 2.2 Global Income Inequality, 1820–2005
Source: Author’s calculations, based on Milanovic 2011.
To drive the point home, I often ask audiences to consider whether it is better to be rich in a poor
country or poor in a rich country. To clarify the question, I spell out what I mean by “rich” and
“poor.” I tell them that they should think of a rich person as someone in the top 10 percent of a
country’s income distribution and a poor person as someone in the bottom 10 percent. Similarly,
a rich country is in the top decile of all countries ranked by average income per person, and a
poor country is in the bottom decile of that list. Which would they choose?

11
Most people have little hesitation in responding that they’d rather be rich in a poor country,
which is the wrong answer. The correct answer is “poor in a rich country”—and it’s not even
close. The average poor person in a rich country, defined along the lines above, earns three times
more than the average rich person in a poor country, adjusted for differences in purchasing
power across countries (Rodrik 2011b). Disparities in other aspects of well-being, such as infant
mortality, go the same way. The poor in a rich country have it much, much better than the rich in
the poor country.
Poor countries, of course, have their own superrich. But these superrich families represent a
minute share of the population in a poor country—no more than perhaps one-hundredth of 1
percent of the population. When we travel down the income distribution scale to include the top
10 percent of a typical poor country, we reach income levels that are a fraction of what most
poor people in rich countries earn. Disparities in income (as well as health and other indicators of
well-being) are much larger across than within countries. The country you are born in largely
determines your life possibilities.
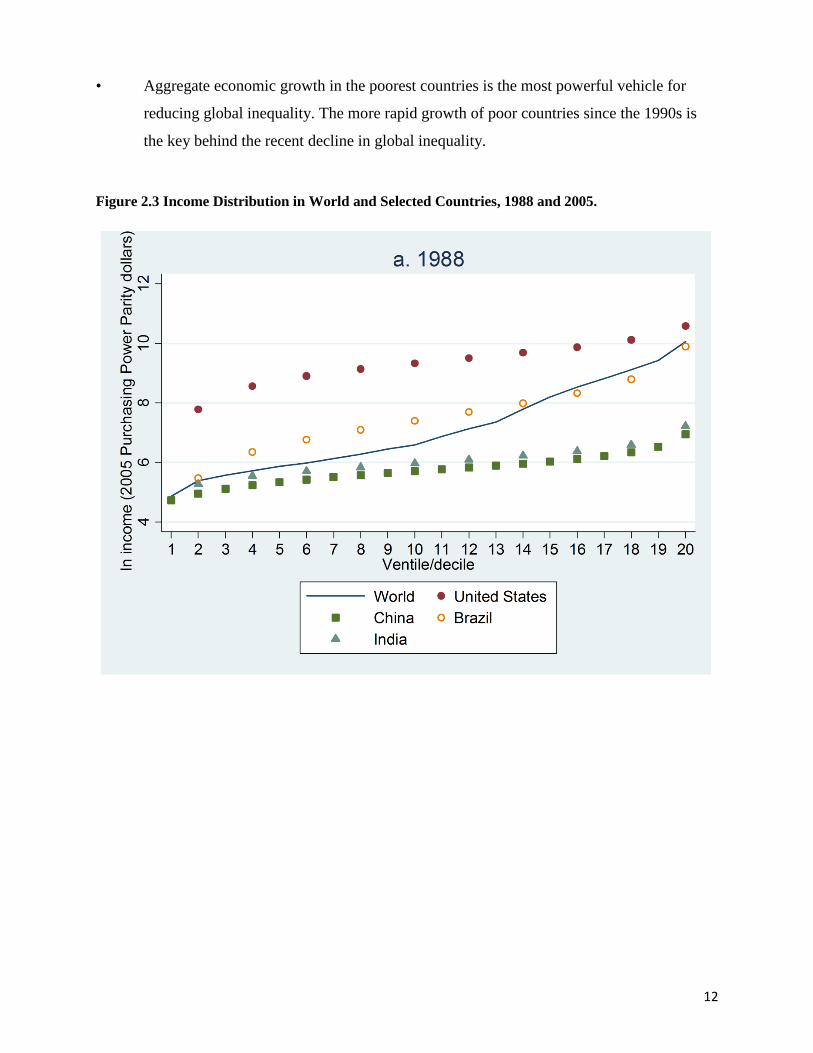
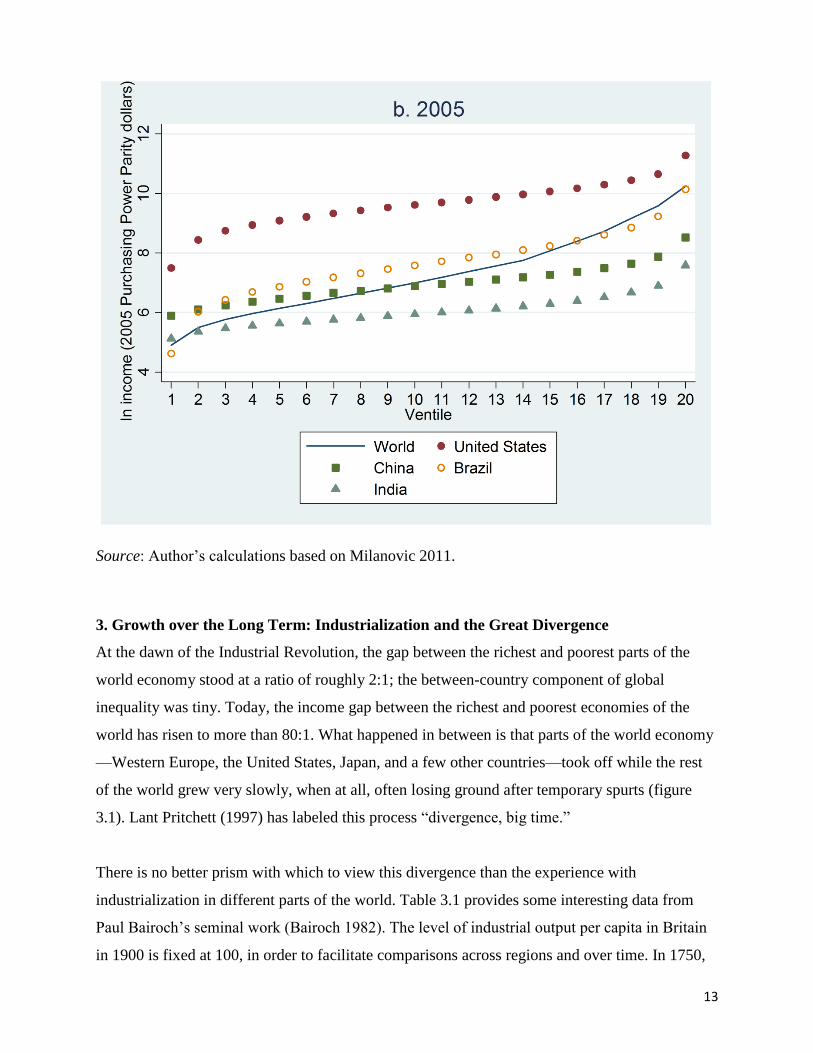
Another way to observe the powerful impact of aggregate growth at the country level is to
compare income levels over time at different points in the distribution. Figure 2.3 depicts income
levels by decile or ventile (depending on data availability) in Brazil, China, India, and the United
States in 1988 and 2005. The India-China comparison is especially telling. In 1988, each Indian
decile was slightly richer than the corresponding decile in China. By 2005, Chinese incomes had
vastly overtaken India’s at all points along the income distribution. Similarly, in 1988 each
Chinese ventile was poorer than the corresponding global ventile. By 2005, the poorer half of the
Chinese economy had become richer than the world’s bottom half.
Three conclusions can be drawn from recent evidence on the global distribution of income:
• The middle of the global income distribution has filled out in recent decades, thanks
largely to China’s rise.
• Differences across average incomes of countries remain the dominant force behind global
inequality.
12
• Aggregate economic growth in the poorest countries is the most powerful vehicle for
reducing global inequality. The more rapid growth of poor countries since the 1990s is
the key behind the recent decline in global inequality.
Figure 2.3 Income Distribution in World and Selected Countries, 1988 and 2005.
13
Source: Author’s calculations based on Milanovic 2011.
3. Growth over the Long Term: Industrialization and the Great Divergence
At the dawn of the Industrial Revolution, the gap between the richest and poorest parts of the
world economy stood at a ratio of roughly 2:1; the between-country component of global
inequality was tiny. Today, the income gap between the richest and poorest economies of the
world has risen to more than 80:1. What happened in between is that parts of the world economy
—Western Europe, the United States, Japan, and a few other countries—took off while the rest
of the world grew very slowly, when at all, often losing ground after temporary spurts (figure
3.1). Lant Pritchett (1997) has labeled this process “divergence, big time.”
There is no better prism with which to view this divergence than the experience with
industrialization in different parts of the world. Table 3.1 provides some interesting data from
Paul Bairoch’s seminal work (Bairoch 1982). The level of industrial output per capita in Britain
in 1900 is fixed at 100, in order to facilitate comparisons across regions and over time. In 1750,

14
at the onset of the Industrial Revolution, this index stood at 10 in Britain and at 8 in today’s
developed countries: there was virtually no difference between these countries and what later
came to be called developing countries. China’s level of industrialization was comparable to that
of Western Europe.
Figure 3.1 Economic Growth since 1700, by Region
Source: Maddison 2010.
From the 19th century on, the numbers began to diverge in a striking fashion. Industrial output
per capita in Britain rose from 10 in 1750 to 64 in 1860 and 115 on the eve of World War I.
Developed countries as a whole followed a similar, if less steep, trajectory. But what is really
striking is not just that the gap between these countries and the countries of Latin America and
Asia (except Japan) opened wide. It is that today’s developing countries typically experienced
deindustrialization. Industrial output per capita in China shrunk from 8 in 1750 to 3 in 1913;
India’s plummeted from 7 to 2 over the same period. These figures fell because industrial output
failed to keep up with population growth.

15
Table 3.1 Per Capita Index of Industrialization before World War I
(United Kingdom = 100 in 1900)
Country 1750 1800 1830 1860 1880 1900 1913
Developed countries 8 8 11 16 24 35 55
United Kingdom 10 16 25 64 87 100 115
United States 4 9 14 21 38 69 126
Germany 8 8 9 15 25 52 85
Japan 7 7 7 7 9 12 20
Developing countries 7 6 6 4 3 2 2
China 8 6 6 4 4 3 3
India 7 6 6 3 2 1 2
Brazil — — — 4 4 5 7
Mexico — — — 5 4 5 7
Source: Bairoch 1982.
Note: — = Not available.
The culprit was the global division of labor that the first era of globalization fostered during the
19th century. Cheap manufactures from Europe and later the United States, particularly cotton
textiles, flooded the markets of peripheral regions, which specialized in commodities and natural
resources. In the Ottoman Empire, for example, imports captured nearly 75 percent of the
domestic textile market by the 1870s, up from a mere 3 percent in the 1820s (Pamuk and
Williamson 2009). This global division of labor was imposed not just by markets but also by the
forces of informal and formal empire: European powers, and later the United States, prevailed on
India, China, Japan, and the Ottoman Empire to open their markets, and their navies ensured
security for merchant and financiers.
Parts of the world that proved receptive to the forces of the Industrial Revolution shared two
advantages.4 First, they had a large enough stock of relatively educated and skilled workers to fill
up and run the new factories. Second, they had sufficiently good institutions—well-functioning
legal systems, stable politics, and restraints on expropriations by the state—to generate
incentives for private investment and market expansion. With these preconditions, much of
4 The rest of this section draws heavily on chapter 7 of Rodrik (2011b).
16
continental Europe was ready to absorb the new production techniques developed and applied in
Britain. Elsewhere, industrialization depended on “importing” skills and institutions.
Intercontinental labor mobility was a tremendous advantage. Where Europeans settled in large
numbers, they brought with them both the skills and the drive for more representative, market-
friendly institutions that would promote economic activity alongside their interests. The
consequences were disastrous for the native populations, who perished in large numbers courtesy
of European aggression and germs. But the regions of the world that the economic historian
Angus Maddison (2001) has called “Western offshoots”—the United States, Canada, Australia,
and New Zealand—were able to acquire the prerequisites, thanks to mass immigration.
Supported by sizable capital flows from Europe, these economies would eventually become part
of the industrial “core.”
The impact of colonization on other parts of the world was quite different. When Europeans
encountered inhospitable conditions that precluded their settlement in large numbers or began to
exploit natural resources that required armies of manual workers, they set up institutions that
were quite different from those in the Western offshoots. These purely “extractive” institutions
were designed to deliver raw materials to the core as cheaply as possible. They entailed vast
inequalities in wealth and power, with a narrow elite—typically white and European—ruling
over a vast number of natives or slaves. Colonies built on the extractive model did little to
protect general property rights, support market development, or stimulate other kinds of
economic activity. The plantation-based economies of the Caribbean and the mineral economies
of Africa were typical examples. Studies by economists and economic historians have
established that this early experience with institutional development—or lack thereof—produced
a debilitating effect on economies in Africa and Latin America that is still felt today (Engerman
and Sokoloff 1997; Acemoglu, Johnson, and Robinson 2001).
Once the lines were clearly drawn between industrializing and commodity-producing countries,
strong economic dynamics reinforced the demarcation. Commodity-based economies faced little
incentive or opportunity to diversify. As transport costs fell during the 19th century and growth
in the industrial core fed demand, these economies experienced commodity booms. These booms
were very good for the small number of people who reaped the windfall from the mines and
plantations that produced these commodities; they were not very good for manufacturing
17
industries, which were squeezed as a result. International trade worked just as in textbook
models: profits rose in economic activities in which countries had comparative advantage and
fell elsewhere.
International trade induced industrial countries to keep investing in skills, technology, and other
drivers of economic growth. It also encouraged families to have fewer children and to educate
them more, in light of the high returns to skills that modern manufacturing industries brought.
These effects were reversed in the developing countries of the periphery. Specialization in
primary commodities did not encourage skill accumulation, and it delayed the reduction in
fertility and population growth: birth rates remained high in the developing world well into the
20th century, unlike in the industrialized countries, which experienced sharp declines in fertility
toward the end of the 19th century. In the words of economists Oded Galor and Andrew
Mountford (2008), commodity-exporting countries gave up productivity in exchange for
population. Developing countries are still trying to break free of the long-term consequences of
this division of labor. That escape is possible was shown by the experience of the first non-
Western country to industrialize before 1914: Japan.
In the middle of the 19th century, Japan looked no different from other economies of the
periphery. It exported primarily raw materials—raw silk, yarn, tea, fish—in exchange for
manufactures. This commerce boomed in the aftermath of the opening to free trade imposed by
Commodore Perry in 1854; left to its own devices, the economy would likely have followed the
same path as so many others in the periphery. But Japan had an indigenous group of well-
educated and patriotic businessmen and merchants, and even more important, a government,
following the Meiji Restoration of 1868, that was single-mindedly focused on economic (and
political) modernization. The government was little moved by the laissez-faire ideas prevailing
among Western policy elites at the time. Japanese officials made clear that the state had a
significant role to play in developing the economy.
The reforms introduced by the Meiji bureaucrats were aimed at creating the infrastructure of a
modern national economy: a unified currency, railroads, public education, banking and other
legislation. Considerable effort also went into what today would be called industrial policy—
state initiatives promoting new industries. The Japanese government built and ran state-owned
plants in a wide range of industries, including cotton textiles and shipbuilding. Even though

18
many of these enterprises failed, they produced important demonstration effects and trained
many skilled artisans and managers who subsequently plied their trade in private establishments.
State enterprises were eventually privatized, enabling the private sector to build on the
foundations established by the state. The government also paid to employ foreign technicians and
technology in manufacturing industries and financed training abroad for Japanese students. In
addition, as Japan regained tariff autonomy from international treaties, the government raised
tariffs on many industrial products to encourage domestic production. These efforts paid off most
in cotton textiles: by 1914, Japan had established a world-class industry that was able to displace
British exports not just from the Japanese markets but from neighboring Asian market as well.
Japan’s militarist and expansionist policies in the run-up to World War II tarred these
accomplishments, but its achievements on the economic front demonstrated that an alternative
path was available. It was possible to steer an economy away from its natural specialization in
raw materials. Economic growth was achievable, even if a country started at the wrong end of
the international division of labor, if it combined the efforts of a determined government with the
energies of a vibrant private sector.
The Japanese experience would become a model for other countries in East and Southeast Asia.
Although specific policies differed, these emulators relied on the same model of export-oriented
industrialization, achieved through a combination of private sector entrepreneurship and
government inducements and cajoling. (The sole exception was Hong Kong, where government
intervention in industry remained minimal.) I have more to say on these growth strategies below.
4. Six Stylized Facts about Economic Growth
The success of Japan and other Asian growth miracles has produced a seemingly unending
debate. Are these countries examples of successful state-directed industrialization, or are they
examples of what reliance on markets and globalization can produce? Framed this way, the
question generates more heat than light. What works in practice is a judicious combination of
markets and government encouragement, rather than a choice of one at the expense of the other.
But why is such a combination needed, what exactly does “judicious” mean, and how is the
notion operationalized? To answer these questions, it is helpful to start with some basic stylized
19
facts about economic growth. This section documents six stylized facts that are particularly
relevant to the policy context. The following section provides an interpretation that is informed
by these stylized facts and try to make sense of success and failure around the world against this
empirical background.
Stylized Fact 1: Growth Has Increased over Time
When the Industrial Revolution took hold of Britain and other early industrializers, the pickup in
the growth rate of economic activity and overall productivity was so gradual as to be virtually
imperceptible. To this day, it is not possible to establish the timing of the Industrial Revolution
or the onset of modern economic growth with any precision: a clear break in the time series
simply does not exist. Economic historians estimate that total factor productivity expanded at an
annual rate of 0.5 percent in the century after 1780. This increase is clearly better than the near-
zero rate of technological progress in earlier centuries, but it is a fraction of what industrial
economies experienced in the second half of the 20th century.
Figure 4.1 illustrates the increase in growth rates over time, for the world as a whole and for
countries that were exceptionally successful. For each period, it shows the average growth rate of
the world economy and the growth rate registered by that period’s growth champion—the
country or region that experienced the fastest growth. Before World War II, the most successful
period was 1870–1913, the Gold Standard period, during which the world economy expanded at
an annual average rate of more than 1 percent per capita. This rate is dwarfed by the post-1950
expansion, during which annual global per capita growth reached nearly 3 percent until the mid-
1970s. Although growth slowed somewhat after the oil shock of the 1970s, it was still far more
rapid than anything experienced before World War II.

20
Figure 4.1 Historical Economic Growth Rates, for the World as a Whole and for Exceptionally
Successful Countries
Source: Maddison 2010.
What stands out particularly sharply in figure 4.1 is the stupendous and historically
unprecedented growth rate experienced by the growth champions of the postwar period: Japan in
1950–73, the Republic of Korea in 1973–90, and China since 1990. These East Asian tigers,
along with a few of their neighbors, grew at 7–8 percent a year in per capita terms, experiencing
more rapid convergence with the living standards of the West than anything seen to date. These
growth miracles were based on rapid industrialization and exports of manufactures. Clearly, the
postwar global economy presented huge rewards to lagging countries that got their policies right.
Stylized Fact 2: Convergence Has Been the Exception Rather than the Rule
As both economic historians and contemporary growth theorists have argued, there are
advantages to economic backwardness. Technologies that advanced countries have already
21
developed can be imported and adapted; the wheel does not have to be reinvented. Global
markets allow small economies to specialize in what they are good at; they are a source of capital
goods and cheap intermediate inputs. Global financial markets can relax domestic saving
constraints and finance investments that would otherwise not take place.
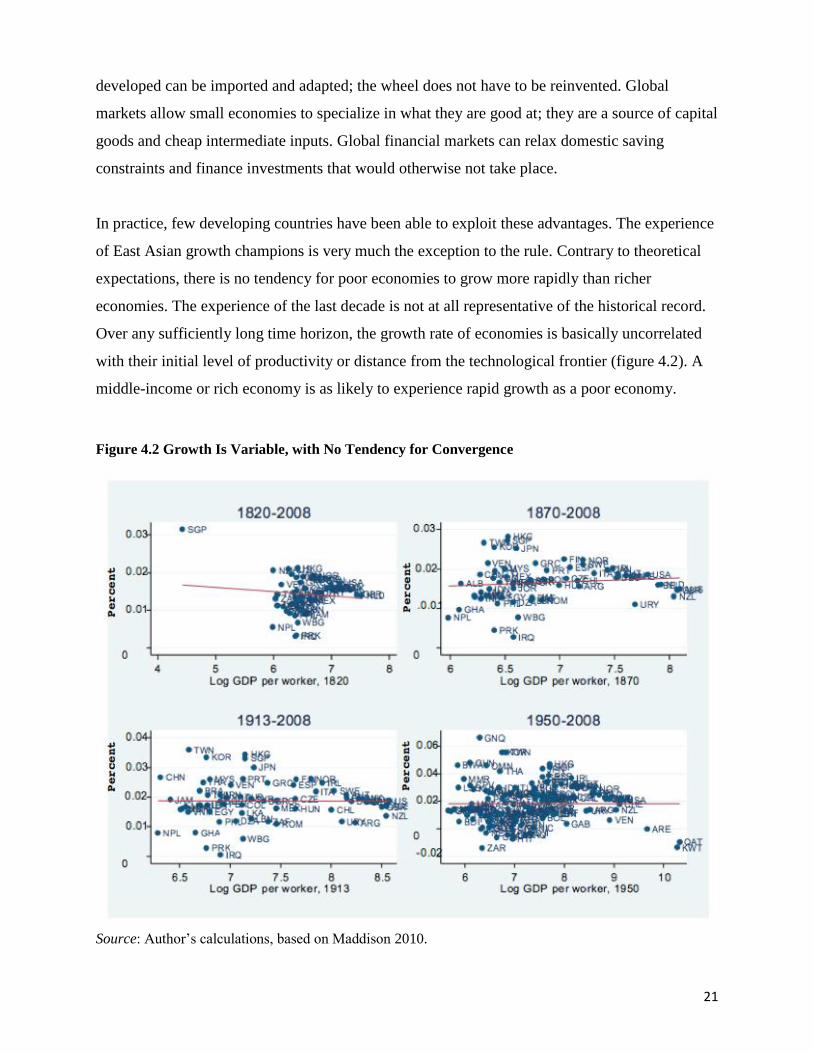
In practice, few developing countries have been able to exploit these advantages. The experience
of East Asian growth champions is very much the exception to the rule. Contrary to theoretical
expectations, there is no tendency for poor economies to grow more rapidly than richer
economies. The experience of the last decade is not at all representative of the historical record.
Over any sufficiently long time horizon, the growth rate of economies is basically uncorrelated
with their initial level of productivity or distance from the technological frontier (figure 4.2). A
middle-income or rich economy is as likely to experience rapid growth as a poor economy.
Figure 4.2 Growth Is Variable, with No Tendency for Convergence
Source: Author’s calculations, based on Maddison 2010.
22
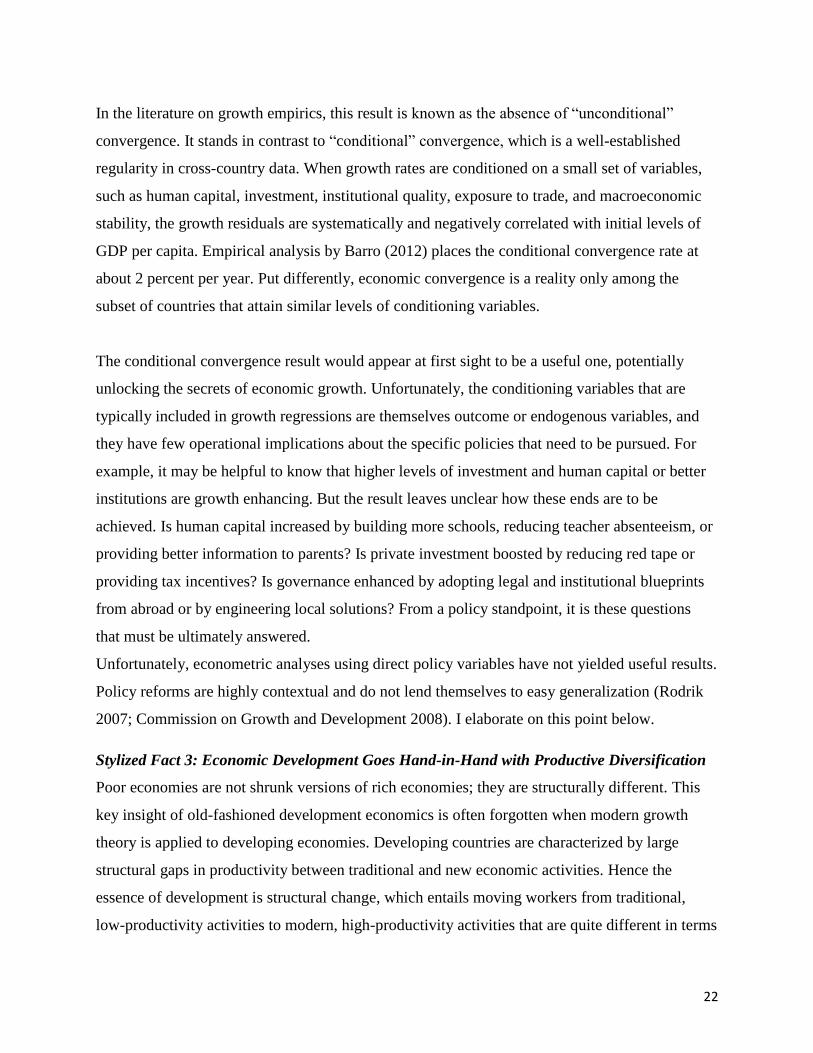
In the literature on growth empirics, this result is known as the absence of “unconditional”
convergence. It stands in contrast to “conditional” convergence, which is a well-established
regularity in cross-country data. When growth rates are conditioned on a small set of variables,
such as human capital, investment, institutional quality, exposure to trade, and macroeconomic
stability, the growth residuals are systematically and negatively correlated with initial levels of
GDP per capita. Empirical analysis by Barro (2012) places the conditional convergence rate at
about 2 percent per year. Put differently, economic convergence is a reality only among the
subset of countries that attain similar levels of conditioning variables.
The conditional convergence result would appear at first sight to be a useful one, potentially
unlocking the secrets of economic growth. Unfortunately, the conditioning variables that are
typically included in growth regressions are themselves outcome or endogenous variables, and
they have few operational implications about the specific policies that need to be pursued. For
example, it may be helpful to know that higher levels of investment and human capital or better
institutions are growth enhancing. But the result leaves unclear how these ends are to be
achieved. Is human capital increased by building more schools, reducing teacher absenteeism, or
providing better information to parents? Is private investment boosted by reducing red tape or
providing tax incentives? Is governance enhanced by adopting legal and institutional blueprints
from abroad or by engineering local solutions? From a policy standpoint, it is these questions
that must be ultimately answered.
Unfortunately, econometric analyses using direct policy variables have not yielded useful results.
Policy reforms are highly contextual and do not lend themselves to easy generalization (Rodrik
2007; Commission on Growth and Development 2008). I elaborate on this point below.
Stylized Fact 3: Economic Development Goes Hand-in-Hand with Productive Diversification
Poor economies are not shrunk versions of rich economies; they are structurally different. This
key insight of old-fashioned development economics is often forgotten when modern growth
theory is applied to developing economies. Developing countries are characterized by large
structural gaps in productivity between traditional and new economic activities. Hence the
essence of development is structural change, which entails moving workers from traditional,
low-productivity activities to modern, high-productivity activities that are quite different in terms

23
of location, organization, and technological characteristics. Rapidly growing countries are better
at removing the bottlenecks that impede this transformation.
One can document this structural transformation in a number of different ways. A particularly
important result was established by Imbs and Wacziarg (2003), who show that economies
progressively become less specialized and more diversified as they get richer. Poor economies
produce a relatively narrow range of commodities and services; as they grow, the range of
economic activities expands. Past a certain point, diversification ceases, and there are hints of
greater specialization at high levels of income. But the turning point comes quite late in the
development process, roughly at the income level of a country such as Ireland.
From the standpoint of structuralist development thinking, the Imbs- Wacziarg result is not
surprising. However, it does stand in some tension with approaches that emphasize the role of
trade and comparative advantage in spurring economic development. After all, the central insight
of classical trade theory is that countries gain from trade by specializing in product lines they are
comparatively good at. Comparative advantage–based specialization may therefore seem to be a
potent avenue for growth—and is often presented as such in policy discussions that emphasize
the benefits of globalization. Whatever the benefits of trade, specialization is not the route to
riches; quite to the contrary.
Stylized Fact 4: Historically, Industrialization and Manufactured Exports Have Been the Most
Reliable Levers for Rapid and Sustained Growth
The growth miracles of Japan, Korea, and China were all based on rapid industrialization. The
point generalizes to other cases of catch-up as well. With the exception of a few small countries
that benefited from natural resource windfalls (and managed not to squander them), virtually all
countries that have sustained high growth rates for decades did so on the back of manufacturing.
Industrialization is how Britain and other early emulators entered modern economic growth. It is
also what has enabled successful latecomers to catch up.
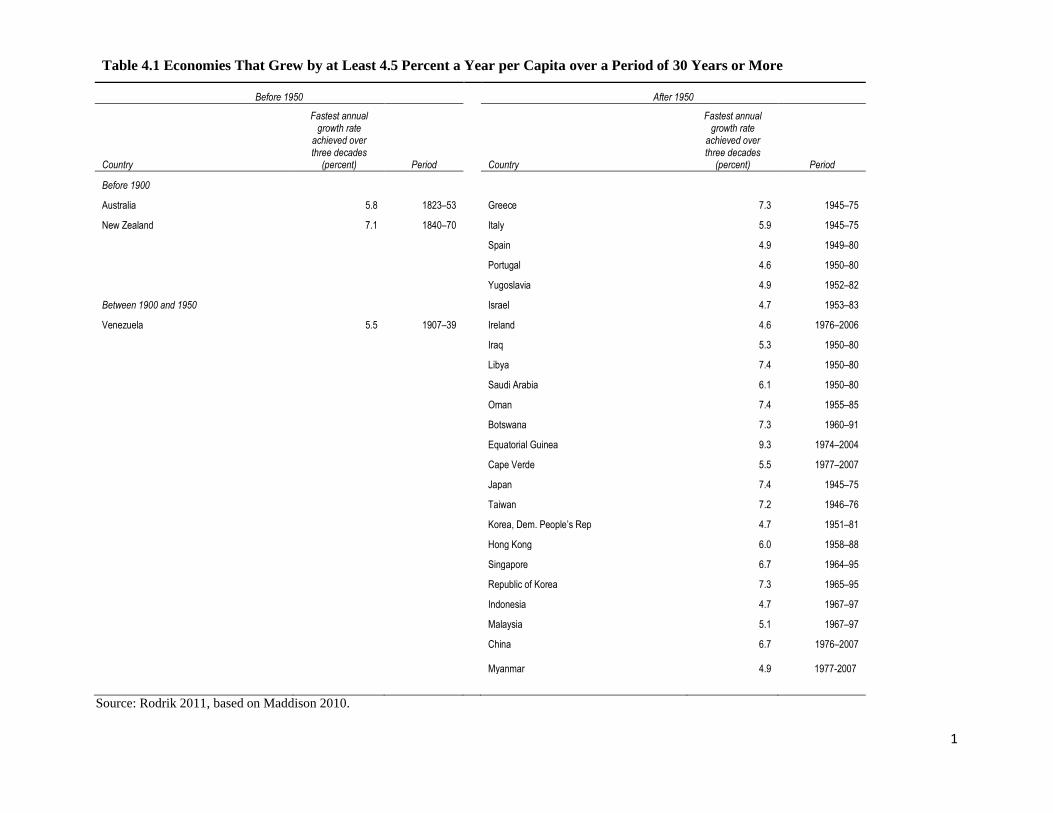
Table 4.1 lists all cases of sustained, very high growth in history. I define “very high growth” as
annual per capita growth of at least 4.5 percent. I define growth as “sustained” if it is maintained
for at least three decades. There are not many such instances—fewer than 30, in fact. But the
composition of such “growth miracles” is telling.
1
Table 4.1 Economies That Grew by at Least 4.5 Percent a Year per Capita over a Period of 30 Years or More
Before 1950
After 1950
Country
Fastest annual growth rate
achieved over three decades
(percent) Period
Country
Fastest annual growth rate
achieved over three decades
(percent) Period
Before 1900
Australia 5.8 1823–53
Greece 7.3 1945–75
New Zealand 7.1 1840–70 Italy 5.9 1945–75
Spain 4.9 1949–80
Portugal 4.6 1950–80
Yugoslavia 4.9 1952–82
Between 1900 and 1950
Israel 4.7 1953–83
Venezuela 5.5 1907–39
Ireland 4.6 1976–2006
Iraq 5.3 1950–80
Libya 7.4 1950–80
Saudi Arabia 6.1 1950–80
Oman 7.4 1955–85
Botswana 7.3 1960–91
Equatorial Guinea 9.3 1974–2004
Cape Verde 5.5 1977–2007
Japan 7.4 1945–75
Taiwan 7.2 1946–76
Korea, Dem. People’s Rep 4.7 1951–81
Hong Kong 6.0 1958–88
Singapore 6.7 1964–95
Republic of Korea 7.3 1965–95
Indonesia 4.7 1967–97
Malaysia 5.1 1967–97
China 6.7 1976–2007
Myanmar 4.9
1977-2007
Source: Rodrik 2011, based on Maddison 2010.

25
Two important trends are evident from table 4.1. First, virtually all growth miracles took place since
1950. There were only three instances before 1950: Australia and New Zealand (two Western offshoots
that benefited from extensive resource boom–led immigration waves during the 19th century) and
Venezuela (which experienced an oil boom in the first half of the 20th century). Since 1950, by contrast,
there have been 24 distinct instances of growth miracles. This pattern is consistent with the increase in
growth rates over time noted in stylized fact #1.
Second, most of the post-1950 growth miracles were rapid industrializers. As table 4.1 indicates,
they came in two clusters. The first cluster includes countries like Italy, Spain, Portugal, and
Greece, countries on the periphery of Western Europe that benefited first from European
reconstruction in the immediate aftermath of World War II and subsequently from the European
integration process. For the most part, these growth episodes ran their course by the late 1970s.
The only exception is Ireland, which was a late bloomer and experienced its boom after the
1970s.
The second cluster comprises the well-known East and Southeast Asian tigers, economies such
as Japan, Korea, Taiwan, Singapore, Hong Kong, Malaysia, and China. Unlike the first cluster,
these countries did not share (at least initially) a geographic advantage. But the example of
prewar Japanese industrialization, as well as its resumption during the 1950s, provided an
important demonstration effect in the region. Korea’s strategy was directly influenced by
Japan’s, and China’s was influenced by the precedents of Hong Kong and Taiwan. Southeast
Asian countries such as Malaysia and Indonesia explicitly targeted industrialization after
observing the successes of the so-called Gang of Four (Korea, Taiwan, Hong Kong, and
Singapore). Almost all of these economies built highly competitive manufacturing industries and
experienced very rapid penetration of export markets in manufactures.
The third set of post-1950 growth miracles in table 4.1 are countries such as Saudi Arabia, Iraq,
and Botswana, which benefited from sustained booms in natural resources (oil and diamonds).
These cases are reminiscent of the few pre-1950 cases. I discuss these successful instances of
resource booms later in the paper.
26
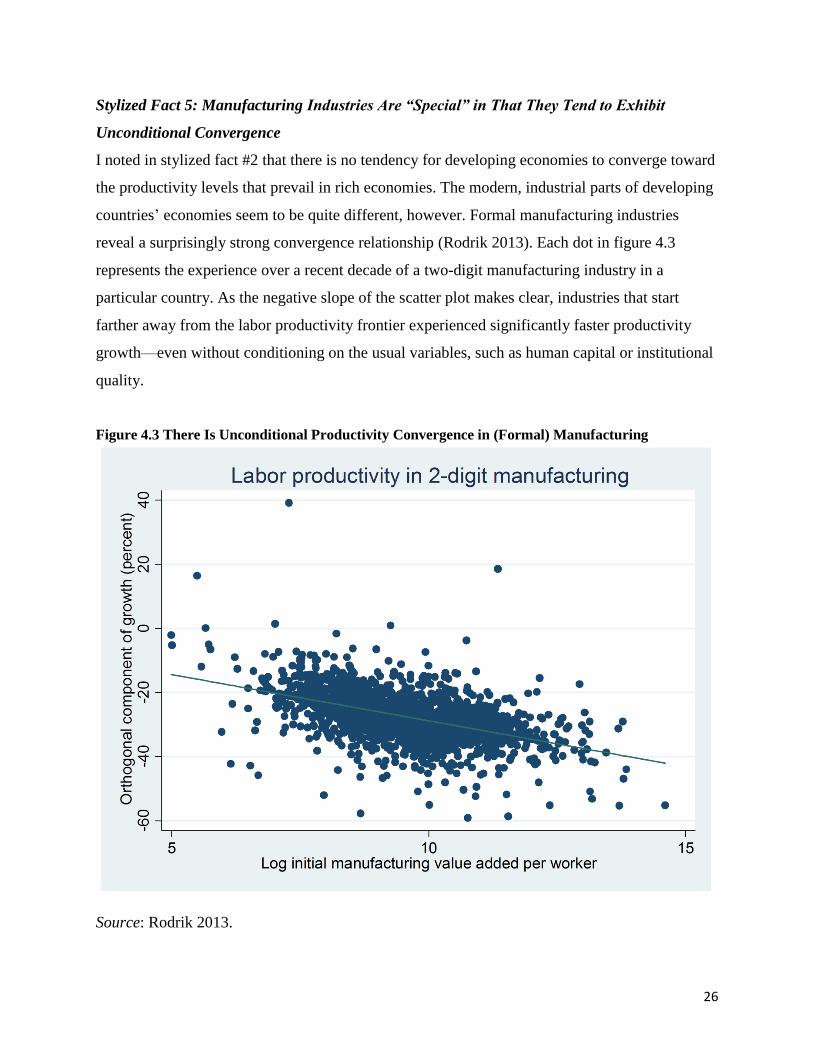
Stylized Fact 5: Manufacturing Industries Are “Special” in That They Tend to Exhibit
Unconditional Convergence
I noted in stylized fact #2 that there is no tendency for developing economies to converge toward
the productivity levels that prevail in rich economies. The modern, industrial parts of developing
countries’ economies seem to be quite different, however. Formal manufacturing industries
reveal a surprisingly strong convergence relationship (Rodrik 2013). Each dot in figure 4.3
represents the experience over a recent decade of a two-digit manufacturing industry in a
particular country. As the negative slope of the scatter plot makes clear, industries that start
farther away from the labor productivity frontier experienced significantly faster productivity
growth—even without conditioning on the usual variables, such as human capital or institutional
quality.
Figure 4.3 There Is Unconditional Productivity Convergence in (Formal) Manufacturing
Source: Rodrik 2013.
27
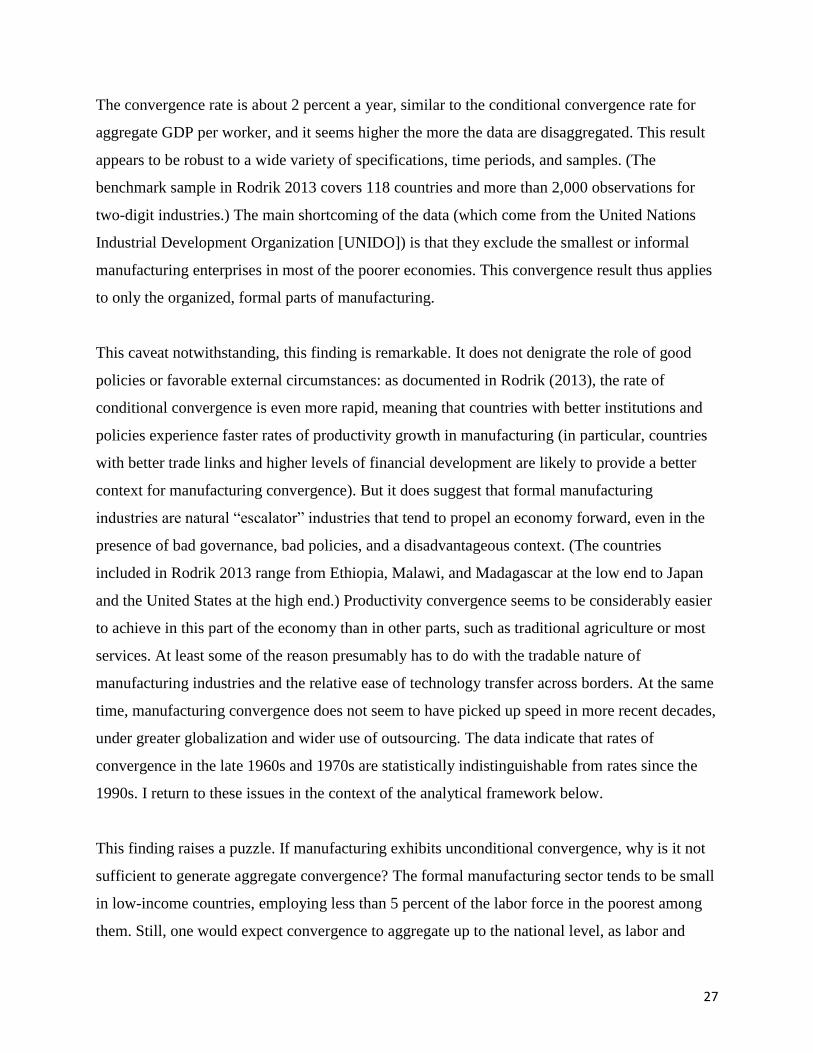
The convergence rate is about 2 percent a year, similar to the conditional convergence rate for
aggregate GDP per worker, and it seems higher the more the data are disaggregated. This result
appears to be robust to a wide variety of specifications, time periods, and samples. (The
benchmark sample in Rodrik 2013 covers 118 countries and more than 2,000 observations for
two-digit industries.) The main shortcoming of the data (which come from the United Nations
Industrial Development Organization [UNIDO]) is that they exclude the smallest or informal
manufacturing enterprises in most of the poorer economies. This convergence result thus applies
to only the organized, formal parts of manufacturing.
This caveat notwithstanding, this finding is remarkable. It does not denigrate the role of good
policies or favorable external circumstances: as documented in Rodrik (2013), the rate of
conditional convergence is even more rapid, meaning that countries with better institutions and
policies experience faster rates of productivity growth in manufacturing (in particular, countries
with better trade links and higher levels of financial development are likely to provide a better
context for manufacturing convergence). But it does suggest that formal manufacturing
industries are natural “escalator” industries that tend to propel an economy forward, even in the
presence of bad governance, bad policies, and a disadvantageous context. (The countries
included in Rodrik 2013 range from Ethiopia, Malawi, and Madagascar at the low end to Japan
and the United States at the high end.) Productivity convergence seems to be considerably easier
to achieve in this part of the economy than in other parts, such as traditional agriculture or most
services. At least some of the reason presumably has to do with the tradable nature of
manufacturing industries and the relative ease of technology transfer across borders. At the same
time, manufacturing convergence does not seem to have picked up speed in more recent decades,
under greater globalization and wider use of outsourcing. The data indicate that rates of
convergence in the late 1960s and 1970s are statistically indistinguishable from rates since the
1990s. I return to these issues in the context of the analytical framework below.
This finding raises a puzzle. If manufacturing exhibits unconditional convergence, why is it not
sufficient to generate aggregate convergence? The formal manufacturing sector tends to be small
in low-income countries, employing less than 5 percent of the labor force in the poorest among
them. Still, one would expect convergence to aggregate up to the national level, as labor and
28
other resources move from technologically stagnant parts of the economy to the escalator
industries.
The difficulty is that the requisite structural transformation is not automatic. Such transformation
is a process that is fraught with both government and market failures (Rodrik 2008b). In practice,
the expansion of formal manufacturing is blocked both by government policies (such as entry
barriers and high taxes on formal enterprises) and by market imperfections (such as coordination
problems and learning externalities), both of which push the return to investment in modern
industries below the social return. The relative weights of these factors depend on the country
and the context.
Manufacturing productivity thus tends to converge almost everywhere. What distinguishes
successful countries from others is their ability to expand manufacturing employment and output
rapidly. Successful developing economies undergo both manufacturing convergence and rapid
industrialization. Underperforming economies make do with manufacturing convergence alone.
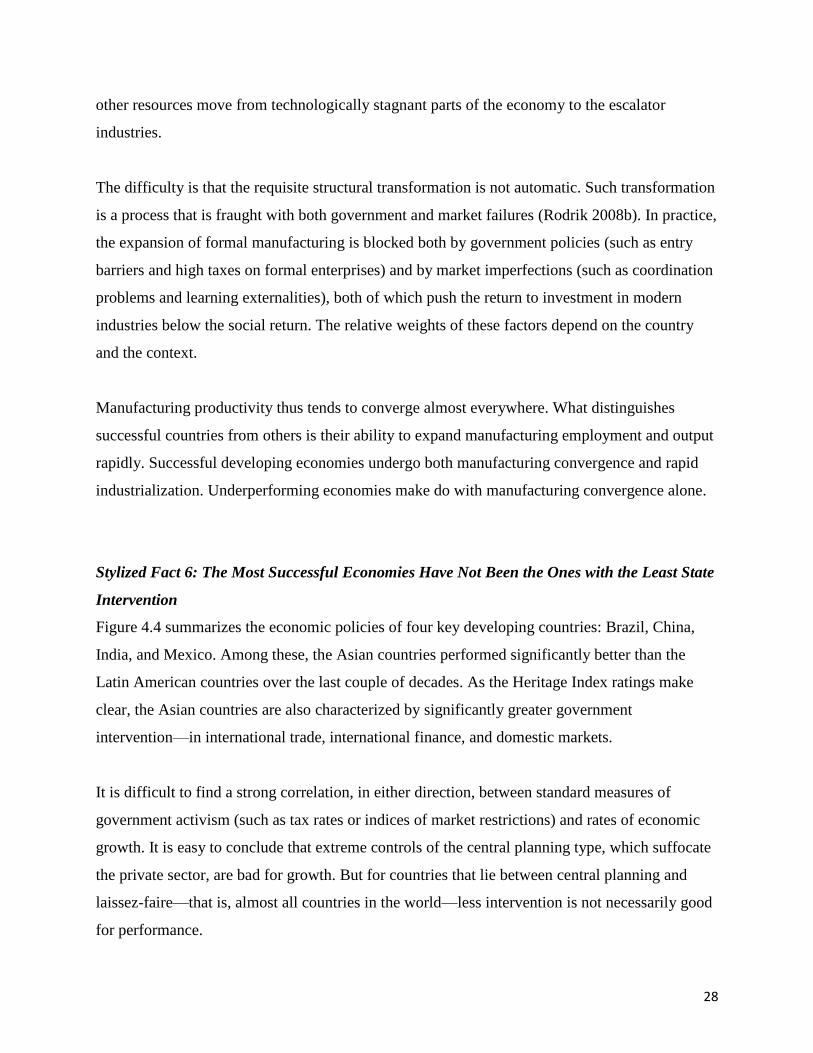
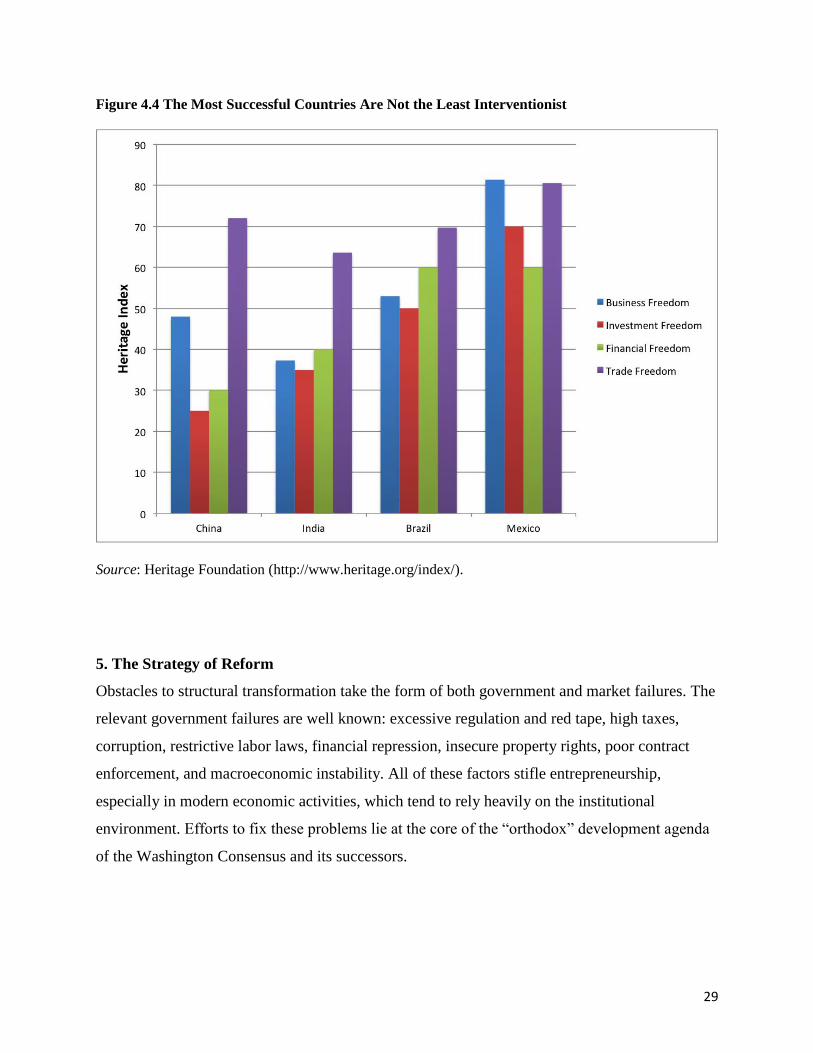
Stylized Fact 6: The Most Successful Economies Have Not Been the Ones with the Least State
Intervention
Figure 4.4 summarizes the economic policies of four key developing countries: Brazil, China,
India, and Mexico. Among these, the Asian countries performed significantly better than the
Latin American countries over the last couple of decades. As the Heritage Index ratings make
clear, the Asian countries are also characterized by significantly greater government
intervention—in international trade, international finance, and domestic markets.
It is difficult to find a strong correlation, in either direction, between standard measures of
government activism (such as tax rates or indices of market restrictions) and rates of economic
growth. It is easy to conclude that extreme controls of the central planning type, which suffocate
the private sector, are bad for growth. But for countries that lie between central planning and
laissez-faire—that is, almost all countries in the world—less intervention is not necessarily good
for performance.
29
Figure 4.4 The Most Successful Countries Are Not the Least Interventionist
Source: Heritage Foundation (http://www.heritage.org/index/).
5. The Strategy of Reform
Obstacles to structural transformation take the form of both government and market failures. The
relevant government failures are well known: excessive regulation and red tape, high taxes,
corruption, restrictive labor laws, financial repression, insecure property rights, poor contract
enforcement, and macroeconomic instability. All of these factors stifle entrepreneurship,
especially in modern economic activities, which tend to rely heavily on the institutional
environment. Efforts to fix these problems lie at the core of the “orthodox” development agenda
of the Washington Consensus and its successors.

30
A reform agenda that focuses on eliminating these government failures would seem to be the
most obvious and direct way of unleashing desirable structural change. In practice, however, it
suffers from three problems.
First, it contains a blind spot with respect to market failures. New industries can fail to get off the
ground not just because they face high taxes or excessive red tape but also because markets in
low-income environments do not work well enough to reward entrepreneurs with the full social
value of their investments. The two most important constraints are typically coordination failures
and demonstration effects (Rodrik 2008a). Coordination failures occur when scale economies
preclude complementary investments that would otherwise be profitable. Building, say, a
successful processed food business requires significant investments both upstream (to ensure a
steady, high-quality supply of raw materials that satisfy health and sanitary standards) and
downstream (to ensure an efficient, timely transport and logistics network that links the operation
to foreign markets). For a firm to generate profits, all parts of the chain need to be present and
work well.
Demonstration effects refer to unremunerated learning spillovers. Any potential investor in an
entirely new line of economic activity has to consider the risks of failure. If he goes bankrupt, he
bears the full cost. But if he succeeds, he sets a model for other entrepreneurs to follow. In other
words, much of the gains from new industries are socialized, whereas the losses remain private.
This phenomenon acts just like a tax on new industries. Standard welfare economics justifies the
use of subsidies and other government interventions in such instances.
Second, the standard approach presumes too much from reformist governments. As Washington
Consensus enthusiasts discovered following the disappointing results in Latin America in the
1990s, the list of government failures that need to be fixed is neither short nor well defined. It
turned out not to be enough to reduce subsidies, formal trade barriers, and state ownership. Many
economists and policy makers rationalized the failures by calling for a second and eventually
third generation of reforms in institutions—everything from more “flexible” labor markets to less
corruption, from better courts to better governance. Apparently, standard policy reforms did not

31
produce lasting effects if the background institutional conditions were poor. Sound policies
needed to be embedded in solid institutions.
So the orthodox reform agenda became increasingly open-ended. At times it seemed as if the to-
do list was designed to ensure that policy advisors would never be proved wrong: if performance
lagged despite extensive reforms, the government could always be faulted for having fallen short
and not having undertaken even more reforms. Paradigmatic of this approach is Anne Krueger’s
aptly titled 2004 speech “Meant Well, Tried Little, Failed Much.” Taken to its logical
conclusion, this formulation of the reform agenda was utterly unhelpful. Essentially it said “if
you want to become rich, you need to look like rich countries.”
Many analysts were led down this path because of the inherently complementary nature of most
of the orthodox reforms. In order to succeed in one reform, countries need to undertake many
others at the same time. For example, trade liberalization will not work if fiscal institutions are
not in place to make up for lost trade revenue, capital markets do not allocate finance to
expanding sectors, customs officials are not competent and honest enough, labor market
institutions do not work properly to reduce transitional unemployment, and so on.
To see this problem in its starkest form, consider what a conventional reform agenda would have
looked like in China in 1978—an economy that was highly distorted as a result of central
planning. An analyst would have recognized that the right place to start reform was in the
countryside, where the vast majority of the population lived. If thoughtful enough, the analyst
would also have realized that applied in the conventional form, each reform would require the
support others to become effective. Low agricultural productivity would require price reform,
which in turn would require property reform to become effective. Price reform in agriculture
would necessitate tax reform, as controlled prices were an important source of government
revenue. It would also require higher wages in urban areas, as food prices rose. State enterprises
would have to be allowed some autonomy to respond to price and wage changes. But because
state enterprises were monopolies, any price autonomy would have to be matched by
competition-enhancing policies, such as trade liberalization. A rise in imports, in turn, would

32
force enterprise restructuring, necessitating better finance and social safety nets for displaced
workers. The causal chain of these interlinked reforms is illustrated in figure 5.1.
Third, the standard approach overlooks the contribution of unorthodox shortcuts. Few if any
countries have grown rapidly because of across-the-board institutional reforms of the type just
discussed: successful economic transitions are marked by the sequential relaxation of one
binding constraint after another, using policy tools that are tailored to local circumstances
(Rodrik 2007). Rapid growth is thus feasible in institutional environments that look quite
distorted, and policy remedies can look quite unorthodox by the standards of the conventional
rulebook. China provides the most telling illustration of both of these principles, but all East
Asian economies have followed similar approaches.5
5 Two-track reform, the household responsibility system, and township and village enterprises were some
of the innovations that the Chinese used to short-circuit institutional complementarities (Rodrik 2007).

33
Figure 5.1 A Chinese Counterfactual: What Orthodox Reform Requires
Problem
Solution
Low agricultural productivity Price liberalization
Production incentives Land privatization
Loss of fiscal revenues Tax reform
Urban wages Corporatization
Monopoly Trade liberalization
Enterprise restructuring Financial sector reform
Unemployment Social safety nets
… and so on
The list of obstacles to stimulating new industries is likely to be long, running the gamut of
government and market failures. The advantage of operating significantly below potential,
however, is that a country does not need to get everything right in order to have a big impact. A
remedy that targets a binding constraint tightly enough can produce a large investment response.
A scatter-shot approach that tries to fix as many problems as possible may not be effective if it
ends up missing the real targets. If the high cost of credit is the greatest obstacle to investment,
for example, reducing the regulatory burden in product markets is unlikely to help much.

34
Conversely, if investment is held back mainly by poor contract enforcement, reducing the cost of
credit will be like pushing on a string.
Next consider how a particular constraint should be relaxed. Suppose entrepreneurship is
hampered by low private returns, which may be the result of a high-risk or poor institutional
environment. The most direct remedy would be to target the relevant distortions and remove
them at source. But doing so may be impractical, for both economic and political reasons.
Economically, it may not be possible to pinpoint the relevant distortions. Politically, policy
makers may not want to step on powerful toes. An alternative strategy that is often more feasible
is to raise entrepreneurs’ profits in other ways—through subsidies or other instruments—in order
to compensate them for the costs they incur as a result of irremovable distortions.
Most successful outward-oriented industrialization efforts have been the product of such second-
best strategies. Korea and Taiwan directly subsidized exports. Singapore subsidized foreign
investors. China created special economic zones and subsidized its exporters both directly and
indirectly through an undervalued exchange rate. Mauritius created an export processing zone. In
none of these cases did import liberalization or across-the-board institutional reform play a
significant causal role in setting off the transition to high growth.
When successful, such heterodox second-best strategies can cut a path through important
economic or political-economy obstacles (Rodrik 2008c). For example, China’s special
economic zones created new enterprises and export opportunities at the margin, without pulling
the rug out from under the highly protected and less efficient state enterprises. The conventional
remedy of across-the-board import liberalization would have exposed these enterprises to a
severe shock, resulting in employment losses and social and political problems in urban areas.
Similarly, by providing price incentives at the margin, two-track price reform in agriculture
insulated government revenues from the adverse effects of incentive reform.
The bottom line is that successful growth-promoting reforms are pragmatic and opportunistic.
Industrialization in particular is often stimulated by unconventional policies that compensate
entrepreneurs and investors for the high taxes imposed on them by the poor market and
35
institutional environment. In these second-best environments, more intervention can sometimes
be better than less. The most effective way to counter market or government failures can be to
compensate for such failures indirectly, rather than attempt to eliminate them.
6. An Analytical Framework
I now sketch an analytical framework that captures the salient elements of the empirical
background discussed above. The framework focuses on structural differences across economic
activities as a key characteristic of developing societies and structural change as the key dynamic
that drives growth. My objectives are threefold: to be explicit about the set of assumptions that
lie behind the “growth model” I have in mind, to provide a consistency check for these ideas, and
to provide a framework within which the future growth agenda can be discussed.
I divide the economy into three sectors, according to their dynamic characteristics. The first is a
traditional sector (mainly subsistence agriculture and informal economic activities), which
employs the bulk of the workforce during the early part of the development process and in which
labor productivity is stagnant. For convenience, I fix labor productivity in the traditional sector at
unity along with the economy’s fixed labor supply: .
The other two sectors are modern sectors, one associated with “manufactures” and the other with
“services.” (This distinction does justice neither to the variety of activities under these headings
nor to the overlap between them in terms of the characteristics highlighted below. I use it for
now to establish some ideas.) Labor productivity in services depends on the economy’s broad
capabilities, denoted by . Specifically, determines the economy’s potential (or steady-state)
labor productivity , to which labor productivity in services, , converges at the rate :
, (1)
where is the economy’s aggregate labor productivity and a “^” over a variable denotes
proportional changes ( ). As expressed, productivity in services exhibits conditional
convergence, with each economy’s long-run level of productivity fixed by its capabilities.
I use the term capabilities to denote both human capital and institutional quality. Models of
endogenous growth and financial development partially endogenize such capabilities, although

36
policy choices ultimately remain a key determinant even in such models. I treat fundamental
capabilities as one of the exogenous drivers of development. I posit that the relationship between
and takes the logistics form depicted in figure 6.1. Potential output initially increases
slowly, as skills and institutional capabilities are accumulated, picking up speed only after
reaches sufficiently high levels. What I have in mind here is the multidimensional nature of the
capabilities captured by and the complementarity among many of those dimensions. As
discussed in the previous section, effective reform in one area of the economy often requires
complementary action in others. For example, a well-functioning health system relies on
appropriate incentives, effective delivery mechanisms, and an adequate supply of medical
professionals. (See Behrman and Kohler 2013 on the complex web of interactions involved in
enhancing human capital.) Building an effective regulatory regime requires not just higher levels
of human capital but also more accountable political systems and a meritocratic bureaucratic
culture. An industrial supply chain requires a substantial network of input suppliers and a wide
array of specialized skills. The specific capabilities needed to increase potential output in each of
these domains are difficult to develop independently and incrementally.6 In particular, because
services are nontraded and rely on domestic demand, their scale of operation is inherently
dependent on productivity enhancements in the rest of the economy (unlike manufactures).
Successful reform in one service sector requires successful reform in others.
This kind of context produces poverty traps and coordination failures that prevent modern
activities from taking off; it requires a “big push” to escape (Murphy, Shleifer, and Vishny 1989;
Rodrik 1996; Sachs and others 2004). The “big push” is often motivated by returns to scale in
economic activities, but the same idea applies equally well to circumstances in which
institutional arrangements in different areas are complementary and require set-up costs.
Unfortunately, “big bang” institutional reform is typically infeasible. It has been accomplished in
rare cases following wars (as in Japan) or through significant surrender of sovereignty (as in
6 My use of the term capabilities is similar to, and inspired in part by, Hidalgo and Hausmann (2009), but
I apply it not just to tradable products but also to nontraded complex services. Sutton’s interesting work
on “competing in capabilities” is another important reference, although Sutton has in mind mainly the
capacity of individual firms and not economies as a whole (Sutton 2012). The capabilities I have in mind
are largely social, rather than private, and can be thought of as public inputs from which all firms benefit
(as in Ricardo Hausmann’s work).

37
former socialist countries that joined the European Union). In other cases, institutional
capabilities can be acquired only incrementally.
Figure 6.1 Relationship between Capabilities and Potential Output
Manufactures differ from modern services in that productivity also benefits from an
unconditional component. The empirical justification for this assumption is provided by the
results in Rodrik (2013), which document the presence of unconditional convergence in
organized manufacturing industries at a rate of about 2 percent per year. Labor productivity
growth in manufacturing can thus be written as the sum of both a conditional and an
unconditional term:
, (2)
where denotes the global productivity frontier in manufacturing. Equation (2) implies that
low-productivity countries can experience substantial growth in manufacturing productivity even
if they have low —that is, even if they suffer from low skills, bad policies, weak institutions,
and unfavorable geography. Increases in can boost growth even farther. This specification is in

38
line with Rodrik (2013), where the conditional convergence rate is estimated at roughly twice the
unconditional rate.
As manufacturing approaches the technological frontier, the automatic convergence effect fades
out. Additional increases in productivity become dependent on the presence of a complex set of
capabilities, just as with modern service industries.
Let the employment shares of the three sectors be , , and ). The economy’s
aggregate real GDP per worker is a weighted average of sectoral labor productivities:
). (3)
(With no loss of generality, I fix base-period relative prices at unity.) I use to denote the
relative productivity of each sector, such that . Totally differentiating equation (3) and
dividing through by yields the following expression for growth in GDP per worker:
(4)
Equation (4) provides an organizing framework for the discussion below. It identifies four
distinct channels for growth. The first is a process of convergence that accompanies the
accumulation of fundamental capabilities such as skills and improved governance (A). It can be
called the “fundamentals” channel, as it depends on broad-based investments in human capital
and institutional arrangements. The second channel is the forces of unconditional convergence
operating within manufactures (B). These two dynamic effects are potentially augmented by two
effects of reallocating labor from traditional activities to higher-productivity manufacturing (C)
and modern services (D).
The power of these channels in driving economic growth varies at different stages of
development. Consider a poor economy at the very early stages of development. Such an
economy faces many obstacles. Not only is low, increases in produce only small returns in

39
light of the logistic relationship between and potential output. The growth that can be
generated through channel A is therefore modest at best.
Within manufacturing, strong convergence forces are at play in light of the large difference
between and . But because very little of the labor force poor countries works in
organized manufacturing (that is, ), even very rapid manufacturing growth will
generate only paltry GDP growth in the aggregate.
Consider, for example, a country in the bottom decile of the intercountry distribution of
manufacturing labor productivity, such that (= ln(10)). Suppose = 5
percent, = 3 percent, and = 400 percent—numbers that are plausible for such a country.
Annual growth through channel B will amount to a mere 1.4 percent (= 0.05 x 4 x 0.03 x 2.30),
even though manufacturing grows at a rate of at least 6.9 percent. The impact of manufacturing
convergence is blunted by its tiny share in the economy.
Of the remaining two terms, the one relating to reallocation to manufacturing (C) is potentially
by far the more important. Sticking with the parameters used above, is about 3 (as
and the traditional sector employs the bulk of the workforce at very low levels of
development). Therefore, if 1 percent of the labor force could be moved to manufacturing per
year—the kind of structural transformation East Asian countries have managed—growth would
increase by 3 percentage points. This is twice the bang achieved from the pure manufacturing
convergence term (B).
By contrast, reallocation to services (channel D) produces little growth benefits at low levels of
income, because and are, by definition, low in poor economies, and is therefore
not much higher than . Indeed, service activities are likely to be dominated by petty services
and informal activities. Growth does not get much of a boost when peasants migrate to urban
areas only to end up in informal, low-productivity activities.
In sum, the best hope for rapid growth in a low-income setting rests on reallocation of labor to
organized manufacturing (C) and, secondarily, convergence within manufacturing (B). These

40
two channels together can generate increases in GDP per worker of 4–5 percent a year. The rest
of the economy cannot contribute much, because the accumulation of the requisite capabilities is
a cumulative process and takes time. Put differently, an economy with low skills and weak
governance can still manage to compete with Sweden in many manufactures, but it would
probably take more than a century for it to bring its institutions up to par with those of Sweden.
For this reason, rapid industrialization has been the common element of all growth miracles.
However, industrialization has its limits, because manufacturing productivity growth slows as
the distance from the technological frontier diminishes (per equation 2) and, more
fundamentally, because in practice there is an upward limit to . Historically, has rarely
exceeded about 30 percent. I consider later the determinants of this ceiling, which are related to
demand, technology, and trade patterns. For now, note that the limit on implies that there is
only so much manufacturing can do as a locomotive for the entire economy. As the industrial
share of employment reaches its limits, economy-wide growth slows unless other channels take
over.
In principle, fundamental capabilities, , can act as the new engine of growth. If the country in
question has been investing adequately in skills and institutions, bringing the economy near the
inflection point in figure 6.1, this is exactly what will happen. New forces of convergence will be
activated, identified by channels A and D in equation (4). The economy will now experience the
“conditional” component of productivity growth in services and manufactures (channel A), and
any shift of labor toward services, even if it comes at the expense of deindustrialization, will be
potentially growth increasing (channel B). In this more mature phase of growth, economic
performance will increasingly rely on broad-based capabilities rather than on pushing workers
into manufacturing.
Deindustrialization therefore poses little threat in economies that have built up adequate human
capital and institutions. In such economies, the labor that is displaced can be absorbed into high-
productivity services, at little cost to economic growth or equity.
41
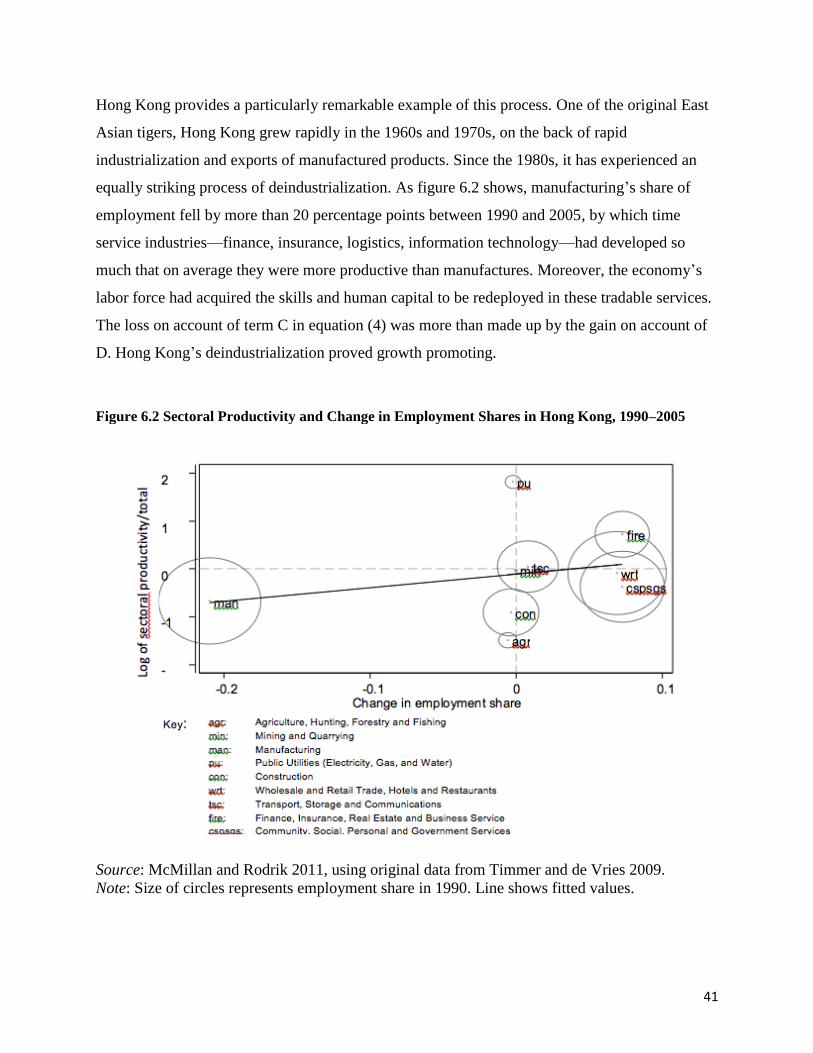
Hong Kong provides a particularly remarkable example of this process. One of the original East
Asian tigers, Hong Kong grew rapidly in the 1960s and 1970s, on the back of rapid
industrialization and exports of manufactured products. Since the 1980s, it has experienced an
equally striking process of deindustrialization. As figure 6.2 shows, manufacturing’s share of
employment fell by more than 20 percentage points between 1990 and 2005, by which time
service industries—finance, insurance, logistics, information technology—had developed so
much that on average they were more productive than manufactures. Moreover, the economy’s
labor force had acquired the skills and human capital to be redeployed in these tradable services.
The loss on account of term C in equation (4) was more than made up by the gain on account of
D. Hong Kong’s deindustrialization proved growth promoting.
Figure 6.2 Sectoral Productivity and Change in Employment Shares in Hong Kong, 1990–2005
Source: McMillan and Rodrik 2011, using original data from Timmer and de Vries 2009.
Note: Size of circles represents employment share in 1990. Line shows fitted values.

42
This win-win scenario often does not play out, even in more advanced economies, where
capabilities have been built up but are ill distributed. In both Britain and the United States, for
example, advanced service sectors—finance, business services, information technology—have
not generated enough employment to make up for the shrinkage of industrial jobs. Lower-
productivity service industries have expanded alongside advanced ones, creating a bifurcated
wage structure and producing growth-reducing structural change. The situation is worse in
middle-income countries, such as Argentina, Brazil, or Turkey, where much of the labor force
remains excluded from the advanced sectors and has little other option than being absorbed into
informality as manufacturing jobs become scarcer (McMillan and Rodrik 2011).
7. A Typology of Growth Outcomes
The analytical framework presented above has two key “forcing variables”: the rate of
industrialization ( ) and the level of capabilities ( The results can be summarized using the
2 x 2 matrix shown in table 7.1, which illustrates four types of growth outcomes, depending on
the evolution of these variables.
Table 7.1 Possible Growth Outcomes Give Rate of Industrialization and Level of Capabilities
)
Slow Rapid
Level of
capabilities
( )
Low (1)
No or very little growth
(2)
Episodic growth
High (3)
Slow growth
(4)
Rapid, sustained growth
Cell 1 represents economies that fail to stimulate industrial employment or accumulate
significant human capital and institutional capabilities. These economies register no or very little
growth. This is the situation in which most of the low-income countries in Sub-Saharan have
traditionally found themselves. They occasionally experience some growth on the basis of
industrialization spurts (as in the 1960s and early 1970s) or commodity booms (during the
2000s), and many of them have enhanced their “fundamentals” through improved governance

43
since the 1990s. But industrialization has largely petered out, and improvement in their
capabilities has remained limited.
Economies in cell 2 experience significant industrialization and hence rapid growth for a while,
but they eventually run out of steam—once industrialization reaches its limits—because
remains low. This scenario is one version of the “middle-income trap.” Many countries that
experienced rapid growth on the back of import-substituting industrialization eventually found
themselves in this situation. Brazil and Mexico are good examples. Their growth now relies
disproportionately on “fundamentals” and hence remains significantly below the rates registered
during the phase of rapid industrialization (1950–80). China may eventually find itself in this
situation as well, as its institutional development, particularly with regard to political institutions,
lags its industrial development considerably.
Economies in cell 3 follow the conventional growth recipe: they place considerable emphasis on
accumulating human capital and improving institutions. But in the absence of complementary
policies that specifically promote industrialization, growth is paltry, especially at low levels of
income, for the reasons discussed above. This scenario is the typical fate of countries that adhere
strictly to the Washington Consensus and its descendants. El Salvador, for example, undertook
extensive institutional and political reforms following its civil war of the 1980s. It adopted a new
constitution, strengthened the independence of the judiciary, consolidated its fiscal position,
modernized its tax system, liberalized trade and banking, improved the regulation and
supervision of its financial system, privatized most state productive assets, reformed its social
security system, and expanded and granted local autonomy to the educational system. Yet after
an initial period of recovery that lasted until 1997, incomes stagnated and GDP per capita
relative to the United States remained just over half the level achieved in the late 1970s
(Hausmann and Rodrik 2005).
Cell 4 in table 7.1 represents the long-term successes, based on an industrialization drive
accompanied by the steady accumulation of human capital and institutional capabilities to sustain
services-driven growth once industrialization reaches its limits. Today’s advanced industrial
countries are in this category, although they too are feeling the strains of deindustrialization as
44
mentioned previously. Among East Asian economies, a few—including Korea, Hong Kong, and
Taiwan—can be said to have joined them.
In addition to providing a useful typology, table 7.1 helps us understand one of the more
puzzling features of the cross-country data. Both institutional quality and human capital levels
are highly correlated with levels of income, but improvements in institutions and human capital
are not a reliable predictor of economic growth. The framework suggests that this observation is
not a contradiction. Only countries that steadily enhance their fundamental
capabilities ventually become rich.7 But investments in are not the easiest way of growing
rich, at least during the early stages of development. Early on, it is rapid industrialization that
fuels growth. Achieving it requires policies that may differ considerably from conventional
fundamentals. Countries that rely exclusively on building up broad-based capabilities are
rewarded with modest growth, which may easily divert them from those policies as a result.
Table 7.1 also clarifies why it is important to distinguish between “fundamentals” and
“structural-transformation channels” to account for existing patterns of growth. Countries that
experience rapid spurts of growth over a period of a decade or two often—indeed, typically— do
so without the benefit of significant advantages in human capital or institutions. There are
shortcuts that can compensate for the absence of fundamentals. A fundamentals-focused
perspective would have an easier time accounting for stagnation than for the spectacular take-
offs in Korea in the 1960s or China in the late 1970s. At the same time, without long-term
investment in fundamentals, rapid growth is unlikely to be sustained.
8. What Sets the Limits to Industrialization?
The peak level of industrialization, , plays an important role in the analysis, as it determines
the mileage that industrialization delivers. The higher becomes, the longer an economy can
sustain rapid growth without having to rely on adequate levels of or, alternatively, the longer it
7 There is a vigorous debate as to whether it is primarily the quality of institutions or the level of human
capital that drives long-run levels of income (see Acemoglu, Robinson, and Johnson 2001 versus Glaeser
and others 2004). I take no position on this debate here, lumping both under the rubric of “capabilities.”

45
can afford to wait for to reach the required levels without experiencing adverse effects on
growth. So a key question is what determines the ceiling on .
Let the GDP deflator be the numeraire, (< 1) the share of manufactures in domestic
expenditures, and the trade surplus in manufactures (as a share of GDP). Earlier, base-period
relative prices were fixed at 1. Because demand patterns depend on movements in relative prices,
let stand for the (relative) price of manufacturing. The market-clearing equation for
manufactures can then be written as
. (5)
Note that is the aggregate quantity of manufactures produced domestically. So the left-
hand side of the equation (5) is the value of production, and the right-hand side is the value of
total demand for domestic manufactures. As , equation (5) can also be expressed as
[ ], (6)
where is the relative productivity of manufacturing in value terms.
To provide some insight on this expression, I first consider a long-run equilibrium in which the
trade surplus is zero ( = 0) and relative productivities across sectors have been equalized in
value terms ( . In this equilibrium, equation (6) simplifies to . Therefore, the
ceiling on the employment share of manufactures is given by the share of manufactures in total
domestic expenditures. This share is in all likelihood declining, as demand patterns tend to
switch toward health, entertainment, and a variety of professional services as incomes rise.
In developing countries, productivity in manufacturing is typically higher than the rest of the
economy (in value terms), pushing farther down. Data from UNIDO in Rodrik (2013)
suggest that lies between 2 and 3 for a country in the middle deciles of the intercountry
income distribution. If = 2.5, can rise to only 40 percent of .
Note also that is directly related to the skill- and capital-intensity of manufacturing activities.
If global trends in technology increase skill and capital requirements in manufacturing, will
rise, further lowering the ceiling on . To be sure, developing countries will generally rely on

46
more labor-intensive techniques, in view of the lower cost of labor. But the extent of factor
substitutability may be limited in practice.
The final determinant in equation (6) is the trade surplus in manufactures, . As
, the size of the manufacturing sector can be increased at any level of income
by reducing the deficit or increasing the surplus in manufactures trade. The role played by the
trade balance is an important policy consideration. It makes mercantilist policies such as
undervalued currencies an attractive option in low-income countries that stand to gain the most
from industrialization (Rodrik 2008b).
9. Global Supply Chains and Changes in Manufacturing
One of the significant changes in the global economy in recent years is what Richard Baldwin
(2011) calls the “second unbundling”—the development of supply chains that facilitate the
distribution of production around the globe. Under the traditional model of industrialization, such
as that followed by Korea in the 1960s and 1970s, countries had to build entire industries, from
the input stage to the finished product. With declining costs of transportation and
communication, countries can now make room for themselves along global supply chains even if
they do not have a large industrial base or big domestic markets. China is often presented as the
epitome of this approach, even though, of course, it has both advantages. Koopman, Wang, and
Wei (2008) estimate that foreign inputs account for half of China’s export value, a much larger
share than in other countries, and that this ratio rises to about 80 percent for technologically
sophisticated electronics products. China, where the iPhone 3G was assembled, contributed only
$6.50 of the total manufacturing cost of $179 for the final product (Rassweiler 2009, cited in
Xing and Detert 2010).
Baldwin (2011) argues that global production chains facilitate industrialization by reducing entry
costs. Developing countries need only contribute low-cost labor; all the technologically
demanding, capital-intensive inputs can be produced elsewhere. But by the same token,
industrialization becomes less of a driver for the aggregate economy. Technology adoption and
spillovers remain under the control of the foreign multinationals that govern the supply chains.

47
The employment absorption of local industries remains limited to the slices of outsourced
production that managers of the global supply chain allocate to specific countries.
In such a context, the type of policies countries must follow to maximize the opportunities from
industrialization do not look all that dissimilar from strategies that worked in the past. The crux
of the matter remains the need to encourage investments in modern industries—or slices
thereof—that the private sector would not undertake under prevailing circumstances. The focus
these days may need to be more on segments of industries than on entire industries, and more on
foreign investors than locals. But ultimately the principles of cooperative industrial policy based
on public-private partnerships discussed in Rodrik (2007, 2008a) still apply.
Indeed, it is impossible to account for China’s success in taking advantage of global supply
chains without understanding the myriad state policies Chinese policy makers used to crowd in
investments that would not otherwise have been made. These policies include direct subsidies,
local content requirements, and an undervalued exchange rate. When Apple looked for a plant
that could quickly gear up to cut a new type of glass prototype for its iPhone screens, it found a
Chinese supplier that had built a new wing with help from government subsidies and could offer
financial terms and labor flexibility few others could. “The entire supply chain is in China now,”
an Apple executive was quoted as saying. “You need a thousand rubber gaskets? That’s the
factory next door. You need a million screws? That factory is a block away. You need that screw
made a little bit different? It will take three hours” (Duhigg and Bradsher 2012).
As this quotation suggests, global supply chains have not done away with the economies of
agglomeration. Countries such as China that have built a large domestic manufacturing base,
through a combination of low labor costs, flexible labor market practices, and government
supports, find themselves much better positioned to attract new investments.
10. How Do Natural Resource Exporters Fit In?
The natural resource sector can be thought of as a special kind of manufacturing: a sector that
converges very rapidly to the global frontier as it utilizes off-the-shelf, imported technology but
has very little ability to absorb labor because it is highly capital and skill intensive. Furthermore,

48
its upstream and downstream linkages are typically exceptionally weak and thus produce few
spillovers to the rest of the economy. The income the sector generates comes in the form of rents
and accrues to the state, a small group of (often foreign) investors, and a few privileged workers.
Mining and other natural resource activities can produce very rapid growth in the boom stage,
but at the cost of a highly skewed distribution of income. When the resource boom ends—
because of resource depletion or a downturn in the terms of trade—there is often a collapse in
economic activity. This collapse is typically magnified by macroeconomic distortions and
distributional conflicts that are associated with resource booms (Rodrik 1999). The economic
history of Sub-Saharan Africa and Latin America is replete with such boom-and-bust episodes.
In principle, it is possible to manage natural resource wealth to sustain continued investments in
human capital and institutions and build up broad-based capabilities. Doing so would allow the
transformation of resource booms into long-term economic success. This path is often blocked
by unfavorable economic and political dynamics associated with natural resource–driven booms,
however. Resource rents feed a small group of political elites, whose power depends on the
stifling of political competition and who therefore have little interest in either broadening
political participation or educating the masses (Sokoloff and Engerman 2000). A comparative
advantage based on natural resources reduces returns to human capital and delays its
accumulation (Galor, Moav, and Vollrath 2008). The rise in the real value of the domestic
currency that accompanies the boom discourages investments in manufacturing or other
nontraditional tradable activities (Rajan and Subramanian 2011). These problems are all well-
known syndromes of the “natural resource curse.” Their collective effect is to impede the
accumulation of capabilities needed to ensure sustained growth once the initial impact of the
resource boom wears off.
A few countries have managed to put their resource wealth to good long-term use. Some have
benefited from special initial conditions. Australia and New Zealand are lands of recent
settlement that, following the Acemoglu, Johnson, and Robinson (2001) logic, developed
reasonably good public institutions early on. Norway and the Netherlands reaped windfall gains
(from oil and natural gas, respectively) after they had already become rich, developed solid
institutions, and accumulated high levels of human capital. Natural resource booms are less

49
likely to turn into a curse when they happen in countries that have good institutions and high
levels of human capital to begin with or are already at a relatively advanced stage of
development.
The experience of Botswana is telling in this context. This landlocked southern African country
grew exceptionally rapidly from the early 1960s to the second half of the 1990s, on the back of a
diamond boom. Yet it started out with very little human capital and none of the institutions
associated with modern, well-governed democracies. Acemoglu, Johnson, and Robinson (2003)
trace the roots of Botswana’s success to tribal practices that “encouraged broad-based
participation”; the continued political power of rural, cattle-based interests, which reduced the
urban bias typical of African polities; and the “farsighted” decision making of postindependence
political leaders. They argue that these features led to appropriate policies that maintained
macroeconomic stability, kept corruption and rent-seeking in check, and fostered bureaucratic
efficiency. Although public policy was not successful in all areas (Botswana was ravaged by the
AIDS pandemic, for example), Acemoglu, Johnson, and Robinson’s (2003) account suggests that
“leadership,” in combination with historical, deeper-seated circumstances, can make a difference.
Leadership also makes a difference in managing the diversification of the economy. Weaning
natural resource–rich economies from their dependence requires especially proactive policies to
stimulate modern industries and counter the Dutch disease. Once again, Asia has shown the way
here. None of the East and Southeast Asian economies started off with a comparative advantage
in manufacturing industries. Some, like Malaysia and Thailand, were particularly well endowed
with natural resources and would have remained resource-based economies had their
governments not emphasized industrialization. Thanks to their industrial policies—especially
managed currencies, which prevented overvaluation—these economies industrialized to a much
greater extent than Latin American countries did, even though they started out with similar
specialization patterns.
The experience of many Latin American countries with the commodities boom of the last decade
also leaves room for hope. Policy makers in Chile, Colombia, Peru, Mexico, and Brazil have
tried to avoid the mistakes of the past and prevent unsustainable consumption and borrowing

50
binges in response to resource windfalls. Some of these countries have passed laws that require
the temporary component of export receipts to be saved. Significant investments have been made
in education, health, and poverty reduction. There are encouraging indicators that such
improvements in fundamentals are helping reduce the inequality and macroeconomic instability
that have been the bane of Latin American countries since the 19th century.
Similarly, thanks in no small part to high commodity prices, Africa has experienced an economic
renaissance of sorts during the last two decades, raising hopes that the continent may finally be
on course for sustained development. Growth rates have been high, human and social indicators
have improved, and democratic governance is becoming the norm rather than the exception.
There are also some encouraging signs of positive structural change, although most of the gains
are taking place in urban services rather than manufacturing (Martinez and Mlachila 2013;
McMillan 2013).
What remains unclear is the extent to which these countries can continue to experience rapid
growth in the absence of high commodity prices. Improvements in human capital and
institutional quality promise less volatile and more sustainable growth. But manufacturing
sectors have typically been battered by appreciating currencies and import competition from
China. It is too early to be sanguine that modern service industries will replace commodity
exports as the growth engine in either Latin America or Sub-Saharan Africa.
11. Prognosis
The framework outlined above shows how fundamental improvements in capabilities (defined as
both skills and institutional development) and narrower policies targeted at rapid structural
change (industrialization in particular) interact to produce sustainable, longer-term growth. In the
long run, convergence with wealthy economies requires the accumulation of human capital and
the acquisition of high-quality institutions. But the quickest way to become rich is to deploy
policies that help build modern industries that employ an increasing share of the economy’s labor
resources. Policies of this type overlap with policies needed to build up fundamental capabilities,
but they are not one and the same, and they often diverge significantly. An excessive focus on
“fundamentals” may slow growth if it distracts policy makers from resorting to the (often
51
unconventional) policies of structural transformation required to get modern industries off the
ground. Similarly, excessive focus on industrialization may set the economy up for an eventual
downfall if the requisite skills and institutions are not built up over time.
In principle, this broad recipe can continue to serve developing countries well in the future. In
particular, it can allow the world’s poorest countries in Africa to embark on Asian-style
structural transformation and rapid growth. But a number of considerations suggest that
developing countries will face stronger headwinds in the decades ahead.
The Global Context
The global economy is likely to be significantly less buoyant than it was in recent decades. The
world’s richest economies are hobbled by high levels of public debt, which typically results in
low growth and defensive economic policies. The euro area is facing an existential crisis. Even if
Europe manages to stay together, its problems will continue to rein in the region’s animal spirits.
Policy makers in these rich countries will remain preoccupied with domestic challenges,
preventing them from exhibiting much global leadership.
The rules of the game for developing countries have already become stricter. The World Trade
Organization (WTO) prohibits a range of industrial policies (subsidies, local content
requirements, copying of patented products) that Asian countries deployed to good effect in
decades past to foster structural transformation.8 Luckily, these restrictions do not apply to the
poorest developing countries.
Additional pressures can be expected to narrow policy space in developing countries as trade
becomes more politicized in the advanced countries as a result of their economic difficulties.
Subsidy schemes that have so far operated under the radar screen are more likely to be litigated
in the WTO and retaliated against. With or without the acquiescence of the WTO, Europe and
the United States will exhibit greater willingness to shield their industries from import surges.
Developing countries that undervalue their currencies through intervention in foreign currency
8 Both China and India used local content requirements to force foreign investors to develop efficient
domestic first-tier suppliers (Sutton 2004)—a strategy that would be illegal today.
52
markets or controls on capital inflows are likely to be branded “currency manipulators.”
Strategies aimed at maintaining competitive currencies—another East Asian hallmark—have so
far evaded global discipline. But for some years there have been efforts to render International
Monetary Fund oversight over currency values more effective, and there is growing discussion
about treating currency undervaluation as an export subsidy in the WTO sense. Even if these
multilateral efforts do not bear fruit, domestic politics will push the U.S. government toward
unilateral action against countries (such as China) that are perceived to be taking unfair
advantage of global trade.
Smaller developing countries are likely to enjoy significantly greater policy space than larger
ones: it is hard to imagine policy makers in Washington, DC, or Brussels getting worked up over
the industrial policies of Ethiopia or El Salvador. This means that the vast majority of the
world’s developing countries—almost all of them in Sub-Saharan Africa—will remain relatively
free of external encumbrances that restrict the scope of structural transformation policies. That is
the good news. The bad news is that large and systemically important economies such as India
and China continue to house a substantial portion of the world’s poor. In 2008, the latest year for
which estimates are available, 62 percent of the world’s people living on less than $2 a day lived
in China and South Asia; only 23 percent lived in Sub-Saharan Africa (Chen and Ravallion
2012). The continued growth of these populous countries remains crucially important to global
poverty reduction.
Changes within Manufacturing
A second important source of headwinds relates to changes that are happening within
manufacturing industries. Technological changes are rendering manufacturing more capital and
skill intensive, reducing the employment-elasticity of industrialization and the capacity of
manufacturing to absorb large volumes of unskilled labor from the countryside and from the
informal sector. Global supply chains may facilitate entry into manufacturing for low-cost
countries that are able to attract foreign investment, but they also reduce linkages with the rest of
the economy and the potential for the development of local upstream suppliers. The ease with
which global companies sitting at the apex of the production chains can switch suppliers gives
these industries a fleeting character.

53
In all these ways, many manufacturing industries are in effect becoming more like natural
resource enclaves: skill and capital intensive, disengaged from the domestic economy, and
transitory. A potentially compensating trend is that some service industries may be acquiring
manufacturing-like properties.9 Certain service sectors, such as food and clothing retail services,
are becoming adept at absorbing technologies from abroad, employing relatively unskilled
workers, and establishing significant linkages with the domestic economy (hypermarkets are one
example). If such service activities are also subject to absolute productivity convergence, as
seems plausible, they could act as the escalator industries of the future.
Increased Global Competition
Other factors will disfavor manufacturing industries. New entrants into standardized
manufacturing activities face much greater global competition today than companies in Korea or
Taiwan faced in the 1960s and 1970s or China faced in the 1990s. Even though its production
costs have been rising, China itself poses a formidable competitive challenge to any producer
attempting to make inroads on global markets. Almost all Asian manufacturing superstars started
with protected home markets, which gave them a home base on which to build experience and
ensured domestic profits to subsidize forays into world markets. Most African manufacturers
today face an onslaught of cheap imports from China and other Asian exporters, which make it
difficult for them to survive on their home turf, let alone cross-subsidize their international
activities. The burdens placed on government policy to incubate and develop domestic
manufacturing firms are correspondingly heavier.
Environmental Concerns
Environmental concerns will play a much larger role than they did in the past, making it more
costly to develop traditional “dirty industries,” such as steel, paper, and chemicals. Comparative
advantage and economic logic dictate that such industries migrate to poorer countries. But
producers everywhere will be under pressure to use technologies that generate less pollution and
greenhouse gas emissions (Steer 2013). To the extent that environmental concerns raise the
technological requirements of running these industries, they will diminish the comparative
advantage of developing countries. The capital and skill requirements of green technologies are
9 I am grateful to Kemal Derviş for this suggestion.

54
also higher. There will be the usual exhortations to the effect that these new technologies be
subsidized and made available to poor countries. Whether this will happen is an open question.
12. Policy Implications
These considerations suggest that a phase of the world economy is beginning in which East
Asian style growth rates will be difficult to sustain for the East Asian countries themselves and
hard to attain for the next generation of emulators. The future of growth is unlikely to look like
its recent past. It may well be that the six decades after the end of World War II will prove to
have been a very special period, an experience not replicated before or after. The rate of
convergence between poor and rich countries is likely to fall considerably from the levels seen
during the last two decades. Developing countries will probably still grow faster than advanced
economies, but they will do so in large part because of the slowdown in growth in the advanced
economies.
Ultimately, growth depends primarily on what happens at home. Even if the world economy
provides more headwinds than tailwinds, desirable policies will continue to share features that
have served successful countries well in the past. These features include a stable macroeconomic
framework; incentives for economic restructuring and diversification (both market led and
government provided); social policies to address inequality and exclusion; continued investments
in human capital and skills; and a strengthening of regulatory, legal, and political institutions
over time. Countries that do their homework along these dimensions will do better than those
that do not.
Beyond these generalities, however, the main policy implication is that future growth strategies
will need to differ from the strategies of the past in their emphasis, if not their main outlines. In
particular, reliance on domestic (or in certain cases regional) markets and resources will need to
substitute at the margin for reliance on foreign markets, foreign finance, and foreign investment.
The upgrading of the home market will in turn necessitate greater emphasis on income
distribution and the health of the middle class as part and parcel of a growth strategy. In other
words, social policy and growth strategy will become complements to a much greater extent.
55
Globally, it will not make sense to pursue the extensive harmonization and coordination of
policies in finance and trade that are ultimately neither sustainable nor, in view of the
heterogeneity of needs and preferences around the world, desirable. International institutions will
do better to accommodate the inevitable reduction of the pace of globalization (or, perhaps, some
deglobalization) than to shoehorn countries into ill-fitting rules. Industrial countries will need to
carve out some policy space to rework their social bargains, just as developing countries need
policy space to restructure their economies (Subramanian and Kessler 2013). A new settlement
will need to be forged between advanced countries and large emerging markets in which the
latter no longer see themselves as free-riders on the policies of the former.
As Birdsall underscores in her paper on this website, the global economy suffers from a shortfall
between the demand and supply of adequate global governance (see also Rodrik 2011b). It is
possible that some of this shortfall can be addressed by reforms and new forms of
representations: by individual citizens and countries acting in ways that are more conscious of
the global consequences of their decisions, by activists and regulators expanding their
transnational networks, and by multilateral economic institutions improving their own
governance. At best, however, these changes will take place in an environment with strong
centrifugal forces, characterized by a growing number of actors and greater diversity of interests.
If these forces are managed well, they need not endanger economic globalization per se. But if
policy makers fail to take them into account, they are more likely to undermine support for an
open global economy than to strengthen it.
Ultimately, a healthy world economy needs to rest on healthy national economies and societies.
Global rules that restrict domestic policy space too much are counterproductive insofar as they
narrow the scope for growth- and equity-producing policies. They thus undermine the support for
and legitimacy of an open global economy. The challenge is to design an architecture that
respects the domestic priorities of individual countries while ensuring that major cross-border
spillovers and global public goods are addressed.
References
Acemoglu, Daron, and James Robinson. 2012. Why Nations Fail: The Origins of Power, Prosperity, and
Poverty. New York: Crown.
56
Acemoglu, Daron, Simon Johnson, and James Robinson. 2001. “The Colonial Origins of Comparative
Development: An Empirical Investigation” American Economic Review 91(5): 1369–401.
———. 2003. “An African Success: Botswana.” In In Search of Prosperity: Analytical Narratives on
Economic Growth, ed. Dani Rodrik. Princeton, NJ: Princeton University Press.
Allen, Franklin, Elena Carletti, Jun Qian, and Patricio Valenzuela. 2013. “Growth, Finance, and Crises.”
Paper prepared for the Global Citizen Foundation project on “Towards a Better Global Economy.”
Bairoch, Paul. 1982. “International Industrialization Levels from 1750 to 1980.”Journal of European
Economic History 11(Fall): 269–310.
Baldwin, Richard. 2011. “Trade and Industrialization after Globalization’s 2nd Unbundling: How
Building and Joining a Supply Chain are Different and Why It Matters.” NBER Working Paper
17716, National Bureau of Economic Research, Cambridge, MA.
Barro, Robert J. 2012 “Convergence and Modernization Revisited.” NBER Working Paper No. 18295,
National Bureau of Economic Research, Cambridge, MA.
Behrman, Jere R., and Hans-Peter Kohler. 2013. “Quantity, Quality, and Mobility of Population.” paper
prepared for the Global Citizen Foundation project on “Towards a Better Global Economy.”
Bourguignon, François, and Christian Morrisson. 2002. “Inequality among World Citizens: 1820–1992.”
American Economic Review 92(4): 727–44.
Chen, Shaohua, and Martin Ravallion. 2012. “An Update to the World Bank’s Estimates of Consumption
Poverty in the Developing World.” World Bank, Washington, DC.
http://siteresources.worldbank.org/INTPOVCALNET/Resources/Global_Poverty_Update_2012_02-
29-12.pdf.
Commission on Growth and Development. 2007. The Growth Report: Strategies for Sustained Growth
and Inclusive Development. Washington, DC.
Duhigg, Charles, and Keith Bradsher, 2012. “How the U.S. Lost Out on iPhone Work.” New York Times,
January 21. http://www.nytimes.com/2012/01/22/business/apple-america-and-a-squeezed-middle-
class.html?pagewanted=all.
Engerman, Stanley L., and Kenneth L. Sokoloff. 1997 “Factor Endowments, Institutions and Differential
paths of Growth among New World Economies: A View from Economic Historians of the United
States.” In How Latin America Fell Behind, ed. Stephen Huber. Stanford: Stanford University Press.
Galor, Oded, Omer Moav and Dietrich Vollrath. 2008. “Inequality in Land Ownership, the Emergence of
Human Capital Promoting Institutions, and the Great Divergence.” Review of Economic Studies
76(1): 143–79.
Galor, Oded, and Andrew Mountford. 2008. “Trading Population for Productivity: Theory and Evidence.”
Review of Economic Studies 75(4): 1143–79.
Glaeser, Edward L., Rafael La Porta, Florencio Lopez-de-Silanes, and Andrei Shleifer. 2004. “Do
Institutions Cause Growth?” Journal of Economic Growth 9(3): 271–303.
Hausmann, Ricardo, and Dani Rodrik. 2005. “Self-Discovery in a Development Strategy for El
Salvador.” Economia: Journal of the Latin American and Caribbean Economic Association, 6(1): 43–
102.
Hidalgo, Cesar A., and Ricardo Hausmann. 2009. “The Building Blocks of Economic Complexity.” CID
Working Paper 186, Center for International Development, Harvard University, Cambridge, MA.
Imbs, Jean, and Romain Wacziarg. 2003. “Stages of Diversification.” American Economic Review 93(1):
63–86.
57
Koopman, Robert, Zhi Wang, and Shang-Jin Wei. 2008. “How Much of Chinese Exports Is Really Made
In China? Assessing Domestic Value-Added When Processing Trade Is Pervasive.” NBER Working
Paper 14109, National Bureau of Economic Research, Cambridge, MA.
Krueger, Anne O. 2004. “Meant Well, Tried Little, Failed Much: Policy Reforms in Emerging Market
Economies.” Roundtable Lecture, Economic Honors Society, New York University, New York,
March 23. http://www.imf.org/external/np/speeches/2004/032304a.htm.
Maddison, Angus. 2001. The World Economy: A Millennial Perspective. OECD Development Centre,
Organisation for Economic Co-operation and Development, Paris.
———. 2010. “Historical Statistics of the World Economy: 1–2008 AD.”
http://www.ggdc.net/maddison/Historical_Statistics/horizontal-file_02-2010.xls.
Martinez, Marcelo, and Montfort Mlachila, 2013. “The Quality of the Recent High-Growth Episode in
Sub-Saharan Africa.” IMF Working Paper 13/53, February 26, International Monetary Fund,
Washington, DC.
McMillan, Margaret S. 2013. “The Changing Structure of Africa’s Economies.” Background paper for
The African Economic Outlook 2013, African Development Bank.
McMillan, Margaret S., and Dani Rodrik. 2011. “Globalization, Structural Change, and Economic
Growth.” In Making Globalization Socially Sustainable, ed. M. Bachetta and M. Jansen. Geneva:
International Labor Organization and World Trade Organization.
Milanovic, Branko. 2011. “Global Inequality: From Class to Location, from Proleterians to Migrants.”
World Bank Policy Research Working Paper 5820, Washington, DC.
Murphy, Kevin M., Andrei Shleifer, and Robert W. Vishny. 1989. “Industrialization and the Big Push.”
Journal of Political Economy 97(5): 1003–26.
Pamuk, Şevket, and Jeffrey G. Williamson. 2009. “Ottoman De-Industrialization 1800–1913: Assessing
the Shock, its Impact, and the Response.” National Bureau of Economic Research, Working Paper
14763, National Bureau of Economic Research, Cambridge, MA.
Pritchett, Lant. 1997. “Divergence, Big Time.” Journal of Economic Perspectives 11(3): 3–17.
Rassweiler, A. 2009. “iPhone 3G S Carries $178.96 BOM and Manufacturing Cost, iSuppli Teardown
Reveals.” iSuppli, June 24. http://www.isuppli.com/Teardowns-Manufacturing-and-
Pricing/News/Pages/iPhone-3G-S-Carries-178-96-BOM-and-Manufacturing-Cost-iSuppli-Teardown-
Reveals.aspx.
Rajan, Raghuram, and Arvind Subramanian. 2011. “Aid, Dutch Disease, and Manufacturing Growth.”
Journal of Development Economics 94(1): 106–18.
Rodrik, Dani. 1996. “Coordination Failures and Government Policy: A Model with Applications to East
Asia and Eastern Europe.” Journal of International Economics 40(1–2): 1–22.
———. 1999. “Where Did All the Growth Go? External Shocks, Social Conflict and Growth Collapses.”
Journal of Economic Growth 4(4): 385-412.
———. 2007. One Economics, Many Recipes: Globalization, Institutions and Economic Growth,
Princeton, NJ: Princeton University Press.
———. 2008a. “Normalizing Industrial Policy.” Commission on Growth and Development Working
Paper No. 3, Washington, Washington, DC.
———. 2008b. “The Real Exchange Rate and Economic Growth.” Brookings Papers on Economic
Activity 2008:2.
———. 2008c. “Second-Best Institutions.” American Economic Review, Papers and Proceedings, May.
———. 2011a. “The Future of Economic Convergence.” September, Harvard University, Cambridge,
MA.

58
———. 2011b. The Globalization Paradox: Democracy and the Future of the World Economy. New
York: Norton.
———. 2013. “Unconditional Convergence in Manufacturing.” Quarterly Journal of Economics 128(1):
165–204.
Sachs, Jeffrey, John W. McArthur, Guido Schmidt-Traub, Margaret Kruk, Chandrika Bahadur, Michael
Faye, and Gordon McCord. 2004. “Ending Africa’s Poverty Trap.” Brookings Papers on Economic
Activity 1: 117–216.
Sokoloff, Kenneth L., and Stanley L. Engerman. 2000. “Institutions, Factor Endowments, and Paths of
Development in the New World.” Journal of Economic Perspectives 14(3): 217–32.
Steer, Andrew. 2013. “Resource Depletion, Climate Change and Economic Growth.” Paper prepared for
the Global Citizen Foundation project “Towards a Better Global Economy.”
Subramanian, Arvind, and Martin Kessler. 2013. “Trade Integration and Its Future.” Paper prepared for
the Global Citizen Foundation project “Towards a Better Global Economy.”
Sutton, John. 2004. The Auto Component Supply Chain in China and India: A Benchmark Study. World
Bank, Washington, DC.
———. 2012. Competing in Capabilities: The Globalization Process. Clarendon Lectures in Economics.
Oxford: Oxford University Press.
———. n.d. “The Globalization Process: Auto-Component Supply Chains in China and India.” London
School of Economics.
Timmer, Marcel P., and Gaaitzen J. de Vries. 2009. “Structural Change and Growth Accelerations in Asia
and Latin America: A New Sectoral Data Set.” Cliometrica 3(2): 165–90.
Xing, Y., and N. Detert. 2010. “How the iPhone Widens the United States Trade Deficit with the People’s
Republic of China.” ADBI Working Paper 257, Asian Development Bank Institute, Tokyo.
http://www.adbi.org/working-paper/2010/12/14/4236.iphone.widens.us.trade.deficit.prc/.