the pacific pumas an emerging model for emerging markets
TRANSCRIPT

The Pacific PumasAn Emerging Model for Emerging Marketsby Samuel George


Introduction
As the global economy sails against stiff headwinds, it is easier to highlight what countries are doing wrong, not what they are doing
right. Focusing on sluggish growth or dwindling reserves may yield a compelling indictment of the global economic system, but it offers
little guidance for improvement.
We understand that there are problems. It is time we focused on the solutions.
Following the financial crisis of 2008, emerging markets seemed capable of reinvigorating global growth. More recently, developing
countries have faced trying macroeconomic conditions as the United States tightens monetary policy.
But the all-too easy grouping “emerging markets” by no means constitutes a cohesive bloc. Countries across the globe may experience
turbulence, but some have taken steps that will help them weather the storm, and to subsequently emerge as responsible, contributing
members of the world economy.
Herein lies the importance of the Pacific Pumas. We believe Mexico, Colombia, Peru and Chile are forging a path for Western Hemisphere
emerging markets that are committed to sound macroeconomic policy, global integration and stronger democratic institutions.
Their work may be incomplete, but success breeds influence, and their model has proven attractive for a number of other countries in
the region.
For over 30 years, the Bertelsmann Foundation and the Bertelsmann Stiftung have developed an expertise in European and trans-
Atlantic issues. In the 21st century, Latin America could play a pivotal role in expanded trans-Atlantic relations, unifying developed
and developing economies. We began our coverage of Latin America by looking to the past with the 2013 study Surviving a Debt Crisis:
Five Lessons for Europe from Latin America. Now we turn to the region’s future with the Pacific Pumas—the budding stars of Latin America.
Bertelsmann Stiftung founder Reinhard Mohn once wrote that the foundation’s projects “could examine ways that would make democracy
more efficient and capitalism more human”. We believe this is exactly the trend we are discovering in Mexico, Colombia, Peru and Chile.
To highlight these positives instead of belaboring the pitfalls, we present the The Pacific Pumas: An Emerging Model for Emerging Markets.
Annette Heuser Andreas EscheExecutive Director Director
Bertelsmann Foundation Bertelsmann Stiftung
Introduction
11

The Puma: A powerful, fast, agile, lean and stealthy animal.
Efficient and resourceful, this New World cat can thrive
in mountainous highlands and humid rainforests.
It is a fitting mascot for the emergence
of Mexico, Colombia, Peru and Chile.
2

The Puma: A powerful, fast, agile, lean and stealthy animal. Efficient and resourceful, this New World cat can thrive in mountainous
highlands and humid rainforests.
It is a fitting mascot for the emergence of Mexico, Colombia, Peru and Chile.
These four countries along Latin America’s west coast have taken great strides in recent years, and they are poised to emerge as regional
leaders. Like the animal, these Pacific Pumas are comfortable operating quietly, away from the spotlight. But their positive momentum
is difficult to ignore.
United in the Pacific Alliance, the Pumas represent more than 200 million people with a US$2.22 trillion GDP; their combined global
trade accounts for half of the Latin American total, while the depth and breadth of their free-trade agreements have positioned them to
increase commerce with Europe, the US and Asia.
This is the story of the advancement of Mexico, Colombia, Peru and Chile—the Pacific Pumas—and of the opportunities they have
moving forward.
The text is divided into two sections:
• The first section considers the emergence of the Pumas individually. It begins with an overview of the four large Latin American
countries that have matured economically and politically precisely as their region, the Pacific, has become a cauldron of global
growth. The second chapter highlights the macroeconomic stability of the four, while the third considers their democratic
maturation. The section concludes with a chapter on the Pumas’ embrace of globalization, suggesting their preparedness for
a 21st century economy.
• The second section analyzes the Pumas’ global opportunities. Through the Pacific Alliance, Mexico, Colombia, Peru and
Chile can leverage their individual success through a pact large enough to attract international attention. Chapter 5 debates
the importance of the Alliance, while Chapter 6 considers its ramifications throughout Latin America. Chapter 7 examines
the importance of the Pumas in greater trans-Atlantic relations, and Chapter 8 reviews the opportunities and challenges the
Pumas face in dealing with China.
Together, the two sections outline a golden opportunity for the Pacific Pumas to achieve internal prosperity and stability, while emerging
as regional leaders and strategic partners of the US, Europe, and East Asia.
Significant challenges remain: Violence, corruption and inequality still plague parts of these countries, while the four countries’
macroeconomic foundations will be tested in the coming years. Yet the text is optimistic, arguing that hard work and propitious timing
have put the Pumas in a position to finally achieve their potential.
The Pacific Pumas have much ground to gain, but if they can continue along their current path, they may well be forging an emerging
model for emerging markets.
Executive Summary
Executive Summary
33

4

Table of Contents
Table of Contents
I. The Pacific Pumas ....................................................... 6
1. The Pacific Pumas .................................................. 7
2. Pumanomics .......................................................... 10
3. Improved Governance ............................................ 14
4. Puma Integration .................................................. 20
II. Global Opportunities ................................................. 26
5. The Pacific Alliance ............................................... 27
6. Latin America Divided? ......................................... 31
7. A Trans-Atlantic Triangle ....................................... 34
8. Harnessing the Dragon .......................................... 40
III. Prepared to Pounce? ................................................ 44
55

I. The Pacific Pumas1. The Pacific Pumas2. Pumanomics3. Improved Governance4. Puma Integration
6

The Pacific Pumas1As the world grapples to stimulate
employment, development and
innovation, a new club of countries has
emerged as an engine of regional growth.
Through sound macroeconomics,
improved governance, and increased
global integration, Mexico, Colombia,
Peru and Chile have rallied in recent
years. Rather than following the lead
of their increasingly protectionist and
interventionist neighbors, these Pacific
economies have taken their cues from
the Asian Tigers of the 1980s.1
While global attention has been trained
on Brazil, the “Pacific Pumas” on
Latin America’s figurative and literal
periphery have quietly become economic
overachievers. This anonymity will be
short lived. The four countries have
already spearheaded a regional free
trade and cooperation pact, the Pacific
Alliance, which has captured global
attention. Given the rise of China and
the US pivot to the East, the Pumas are
poised to play a significant role in an
emerging Pacific century.
Puma economic growth has been strong
and consistent, averaging 4.69 percent
annual growth since 2005.2 Setting
aside 2009, a year of global economic
tailspin for which Latin America bore
little responsibility, average annual
Puma growth nudges above 5.5 percent.
These figures compare favorably to
the Association of Southeast Asian
Nations (ASEAN) over the same span
(4.42 percent growth, or 4.80 percent
excluding 2009).3
This economic performance has
coincided with rising incomes. The
Colombian, Chilean and Peruvian middle
classes each expanded by more than 10
percent between 2000 and 2010, while
some estimate that the Mexican middle
class already accounts for more than half
the population.4
Inflation, a scourge of Latin American
development, has been held in check
across the Puma economies. Strong
foreign reserves have allowed members to
assume countercyclical macroeconomic
positions—a rarity in Latin America.
Puma sovereigns are investment grade,
and their issuances are hot. In January
2013, Mexico issued US$1.5 billion in
bonds at a yield of 4.2 percent, 110
basis points higher than comparable US
Treasuries. Later in the month, Colombia
issued US$1 billion in bonds at only
88 basis points above US notes. Both
issuances were oversubscribed.5
On paper, the Pumas roar. But what
is driving these figures, and are
they sustainable?
THE ANATOMY OF A PUMAThe Puma’s success stems from political
and macroeconomic stability, an embrace
of global integration and expanding
private consumption.
• Improved GovernanceLatin America is notorious for weak
democratic institutions, short time
horizons and malleable “rules of the
game”. Yet, in recent years, the Pumas
have generally adhered to established
democratic systems with reasonably
legitimate elections. The “rules of
the game” have been observed by
major political parties, and (Mexico’s
Andrés Manuel López Obrador aside)
transitions from right-leaning to left-
leaning executives, and vice versa, have
been smooth.6
Not only have Puma countries executed
transitions admirably, but their new
leaders have accepted existing economic
and political structures. Countries that
have bent to the left have done so without
adopting the statist model popularized
by Venezuela’s former president Hugo
Chávez and his Alianza Bolivariana para los
Pueblos de Nuestra América (ALBA) coalition.
Countries that have tacked to the right
have done so without eliminating social
programs or leaning on the barracks.
Crucially, Puma central banks have
maintained the independence required
to pursue macroeconomic stability.
• Global IntegrationMexico, Colombia, Peru and Chile
have aggressively pursued liberalized
trade, adopting a strategy that proved
successful in East Asia in order to more
fully integrate with East Asia. Taking a
page from ASEAN’s playbook, the Pumas
have spearheaded more deep-seated
regional integration. The Pacific Alliance
has already removed duties on 92 percent
of inter-Puma trade—a figure scheduled
to increase to 100 percent within 15 years.
This is an impressive accomplishment
for a region where integration has long
been elusive.
While the US has concluded free
trade agreements (FTAs) with Mexico
(1994), Chile (2004), Peru (2009) and
Colombia (2012), the Pumas have
expanded well beyond the Western
Hemisphere, participating in numerous
inter-continental trade pacts. Mexico,
Peru and Chile are members of the
Asia-Pacific Economic Cooperation and
are active negotiators in Trans Pacific
Partnership (TPP) dialogues. All four
Pumas have successfully negotiated FTAs
with the European Union. The Mercado
Común del Sur (MERCOSUR), an economic
bloc of mostly Atlantic South American
countries,7 has not.
The Pacific Pumas 77

The strategy has paid off. Resource-rich
Peru and Chile have tapped into East
Asian growth, providing the raw materials
that help build that region’s megacities.
Mexico and Colombia have exploited
closer commercial ties to the US. All told,
Puma exports increased by an annual
average of 4.66 percent (unweighted)
since 2000 and are forecast to grow six
percent annually through 2017.8
• Private Consumption and Investment
Funneling raw materials to global
superpowers is old hat for the Pacific
Pumas. However, increases in private
consumption hint that their recent
success is rooted in more than simply
capitalizing on strong commodity prices.
As poverty decreases and the middle
class broadens, Puma countries are
forecast to see private consumption
expand at an average annual rate of five
percent over the next six years.9
Mexico, a country of roughly 120 million
people, has ten cities with more than one
million inhabitants, and 18 with more
than 700,000. Colombia (population 46
million) has four, and nearly five, cities
with more than one million inhabitants.10
Multiple, large urban centers portend
expanded consumption that will be
buttressed by gross fixed investment,
forecast to average 8.39 percent annual
growth across the Puma economies over
the next six years.11 The emergence of true
middle classes in these four countries
will help them expand their economies
beyond digging things out of the earth
and shipping them overseas.
THE PUMAS IN A GLOBALIZED WORLDPuma momentum is real, and the
timing could not be more propitious.
In the near term, emerging markets
may face trying macroeconomic
conditions, but the Pumas’ relative
fiscal and monetary balance have them
positioned to withstand the turbulence.
In the medium and long term, as the
US and Europe pivot to the east, and as
emerging Asia shifts up the development
tables, the Pacific Pumas occupy prime
real estate in a reconfigured global
economic ecosystem.
If Latin America’s west coast was a
global backyard during the American
century, it could well be center stage in a
Pacific century.
The Pumas are already making economic
and geopolitical waves. United in the
Pacific Alliance pact, the Pumas together
are more populous than Brazil. They
account for roughly 37 percent of Latin
American GDP and 50 percent of the
region’s trade. The Mercado Integrado
Latinoamericano (MILA), the Pumas’
shared stock exchange, will be the
largest in Latin America should Mexico
join, as expected, in 2014. Smaller Latin
American countries have taken note.
Costa Rica has already joined the Pacific
Alliance, and Guatemala, Panama and
Uruguay are keen to follow, suggesting
that the Pumas could emerge as leaders
in Latin America.
But the Pumas’ strategic influence
extends beyond the region. For the United
States, the Pacific Alliance represents
a key ally in an effort to influence 21st
century trade. For Europe, where growth
remains anemic, the Pacific Pumas offer
Chile Colombia Mexico Peru-6
14
12
10
8
6
4
2
0
-2
-4
2001 2002 2003 2004 2005 2006 2007 2008 2009 2010 2011 2012 2013 2014
Puma Growth in the 21st Century (Percent Change)
Source: International Monetary Fund Data (Forecasts after 2013)
88

economic opportunities. For Asia, the
Pumas offer resource security and access
to market expansion.
THE OPPORTUNITY OF A CENTURYThe Pumas are far from perfect. From
the urban shanties looming over Ciudad
Juarez to isolated rural communities
along the Strait of Magellan, bare feet
and callused hands do not always square
with the strong growth figures. The
optimism in Mexico City is not always
felt in Chiapas.
The notion that Mexico is emerging
from its drug war would be news to
citizens of Guerrero, where the murder
rate rivals that of Cote d’Ivoire.12 Chaos
in neighboring Venezuela fuels the
perception of a safer Colombia, but
viewed independently, it can still be a
dangerous place.13 Peruvian growth is
in part predicated on fickle commodity
prices, and its democracy upon a fickle
electorate. Chile remains saddled with a
flawed constitution, one of many legacies
of a painful military dictatorship.
Significant challenges remain, to be sure.
But the Pacific Pumas have a golden
opportunity, forged by hard work and
good timing. Neighboring countries have
demonstrated that economic bonanzas
can be easily squandered on subsidized
gasoline and metro passes. Are the Pacific
Pumas prepared to run with the Tigers of
the East? Or will they be ensnared in the
traps of the past?
The Pumas: Getting to Know You
Country IndicatorsForecasts
2013- 2018Rankings
Population2014
(Millions)
Population Aged 0-14 (Percent)
Average GDP
Growth 2004 - 2013 (Removing
2009)
Average Annual Export Growth
2004 - 2013
2013 Inflation (Percent)
Private Consumption
Average Annual Growth
(Percent)
Gross Fixed Investment
Average Annual Growth
(Percent)
Ease of Doing
Business Rank (Latin
America)
Competitiveness Rank
(Latin America)
Macroeconomic Environment
Rank (Latin America)
Chile 17.40 21 5.42 3.61 1.73 5.00 6.88 1 1 1
Colombia 46.05 28 5.05 6.59 2.22 4.47 6.43 3 6 4
Mexico 119.41 29 3.39 5.72 3.60 3.58 6.75 4 3 6
Peru 31.42 29 7.28 4.83 2.81 5.43 7.38 2 5 2
Chart Sources: Indicators - IMF Data, World Bank Development Indicators; Forecasts - Economist Intelligence Unit Reports, January 2014. Ease of Doing Business Rank – The World Bank; Latin American Competitiveness Rank and Macroeconomic Environment Rank from
Global Economic Forum’s 2013 - 2014 Global Competitiveness Report.
The Pacific Pumas 99

The argument in favor of Puma economies
is about more than growth statistics: Latin
America has grown before. But previous
economic expansion has often been built
upon shaky fundamentals, with those
in privileged positions accumulating
as much wealth as possible before the
entire system collapsed.
Cycles of Latin American booms and
busts1 entrenched long-standing and
flagrant inequality while governments’
short time horizons undermined any
coherent development strategy. In the
last half century, millions of indigent
campesinos streamed into Latin American
cities whose formal job market could
not adequately absorb them. They made
their livings in makeshift economies just
as they made their homes in makeshift
favelas that tumble down hillsides in
cities such as Bogotá, Caracas, or
Rio de Janeiro.
GDP growth alone cannot fix this. Latin
America must match expansion with
long-term macroeconomic stability
to make that growth inclusive and
consistent over the long term.
Mexico, Colombia, Peru and Chile have
not accomplished this yet. But recent
trends suggest that they are on their way
to doing so. The Pacific Puma economies
have demonstrated consistency, stability
and resilience despite persistent global
economic turbulence. Uniquely for the
region, the Pumas have paired consistent
growth with low inflation and fiscal
prudence. They have stoked investment
and private consumption while also
making inroads against poverty.
These developments have rested
upon three pillars of macroeconomic
stability: 1) central bank maturity,
2) floating exchange rates, and
3) fiscal responsibility. Each is
considered individually.
THREE PILLARS OF MACROECONOMIC STABILITY• Central Bank MaturityImproved central bank performance
and independence has solidified Puma
macroeconomic stability. Gone are the
days of switching on the printing press
to cover fiscal deficits. Inflation has
been held within central bank bands
across the Puma economies.2 Not since
Mexico in 2009 has annual inflation in
a Puma country topped five percent,
and the Andean Pumas have averaged
2.62 percent since 2010 (besting a
global average of well over three percent
through that span).3
Low inflation combined with burgeoning
reserves (on average, Mexican,
Colombian, Peruvian and Chilean reserve
20050
2
4
6
8
10
12
14
2006 2007 2008 2009 2010 2011 2012 2013 2014
Mercosur Pumas Advanced Economies
Inflation (Annual Percentage)
Source: IMF Data, Inflation, Average Consumer Prices (Unweighted)Note: Argentine inflation–and thus Mercosor inflation–is likely higher than reported.
Pumanomics2
1 01 0
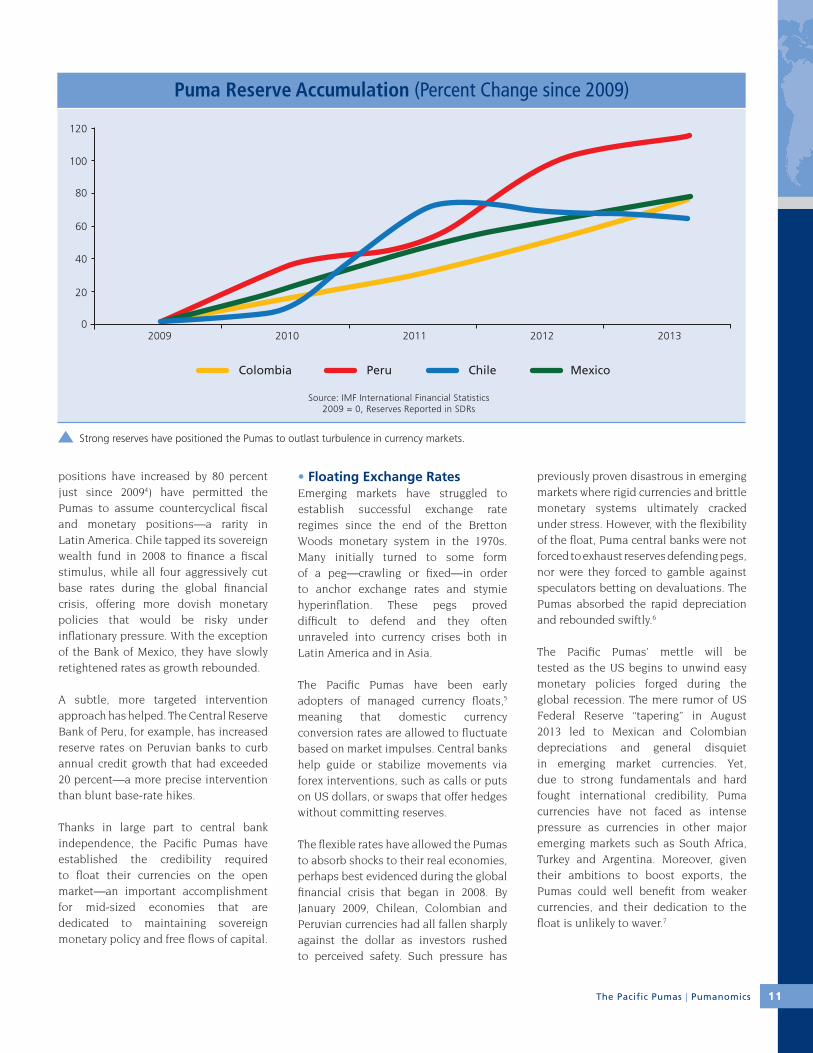
positions have increased by 80 percent
just since 20094) have permitted the
Pumas to assume countercyclical fiscal
and monetary positions—a rarity in
Latin America. Chile tapped its sovereign
wealth fund in 2008 to finance a fiscal
stimulus, while all four aggressively cut
base rates during the global financial
crisis, offering more dovish monetary
policies that would be risky under
inflationary pressure. With the exception
of the Bank of Mexico, they have slowly
retightened rates as growth rebounded.
A subtle, more targeted intervention
approach has helped. The Central Reserve
Bank of Peru, for example, has increased
reserve rates on Peruvian banks to curb
annual credit growth that had exceeded
20 percent—a more precise intervention
than blunt base-rate hikes.
Thanks in large part to central bank
independence, the Pacific Pumas have
established the credibility required
to float their currencies on the open
market—an important accomplishment
for mid-sized economies that are
dedicated to maintaining sovereign
monetary policy and free flows of capital.
• Floating Exchange RatesEmerging markets have struggled to
establish successful exchange rate
regimes since the end of the Bretton
Woods monetary system in the 1970s.
Many initially turned to some form
of a peg—crawling or fixed—in order
to anchor exchange rates and stymie
hyperinflation. These pegs proved
difficult to defend and they often
unraveled into currency crises both in
Latin America and in Asia.
The Pacific Pumas have been early
adopters of managed currency floats,5
meaning that domestic currency
conversion rates are allowed to fluctuate
based on market impulses. Central banks
help guide or stabilize movements via
forex interventions, such as calls or puts
on US dollars, or swaps that offer hedges
without committing reserves.
The flexible rates have allowed the Pumas
to absorb shocks to their real economies,
perhaps best evidenced during the global
financial crisis that began in 2008. By
January 2009, Chilean, Colombian and
Peruvian currencies had all fallen sharply
against the dollar as investors rushed
to perceived safety. Such pressure has
previously proven disastrous in emerging
markets where rigid currencies and brittle
monetary systems ultimately cracked
under stress. However, with the flexibility
of the float, Puma central banks were not
forced to exhaust reserves defending pegs,
nor were they forced to gamble against
speculators betting on devaluations. The
Pumas absorbed the rapid depreciation
and rebounded swiftly.6
The Pacific Pumas’ mettle will be
tested as the US begins to unwind easy
monetary policies forged during the
global recession. The mere rumor of US
Federal Reserve “tapering” in August
2013 led to Mexican and Colombian
depreciations and general disquiet
in emerging market currencies. Yet,
due to strong fundamentals and hard
fought international credibility, Puma
currencies have not faced as intense
pressure as currencies in other major
emerging markets such as South Africa,
Turkey and Argentina. Moreover, given
their ambitions to boost exports, the
Pumas could well benefit from weaker
currencies, and their dedication to the
float is unlikely to waver.7
ChileColombia MexicoPeru
2009 2010 2011 2012 20130
20
40
60
80
100
120
Puma Reserve Accumulation (Percent Change since 2009)
Source: IMF International Financial Statistics2009 = 0, Reserves Reported in SDRs
Strong reserves have positioned the Pumas to outlast turbulence in currency markets.
The Pacific Pumas | Pumanomics 1 11 1

• Fiscal ResponsibilityFiscal responsibility is a tall order for
growing emerging-market countries.
Hugo Chávez’s final reelection push
in Venezuela in 2012 highlighted the
electoral bounty to be reaped from a
well-timed stimulus.8 Meanwhile, as
Chilean President Michelle Bachelet
found in the years that she nurtured
Chile’s sovereign wealth fund (2006 –
2008), fiscal discipline during a boom
can cause discontent, even within one’s
own constituency.9
However, the Pacific Pumas have
demonstrated fiscal restraint through
their years of growth. Chile has knocked
public debt below 10 percent of GDP
and its structural deficit to roughly one
percent. Meanwhile, it has replenished
its sovereign wealth funds: Now endowed
with over US$15 billion,10 the funds
are more valuable than prior to the
2008-09 stimulus.
Peru has flipped a structural deficit into
a surplus, which it has maintained for
all but two years since 2006. Colombian
external debt has dropped from 40
percent of GDP in 2003 to 22 percent
today with hard currency reserves nearly
double their 2009 value.11 Bogotá has
even codified fiscal discipline with
legislation that requires a deficit below
one percent of GDP by 2020, even while
transfers to conflict victims and at-risk
groups are expected to increase.12
Mexico remains the fiscal wild card. The
country’s Finance Ministry reports tax
intake worth only 9.8 percent of GDP
in 2012, far less than the Organization
for Economic Co-operation and
Development (OECD) average of 33
percent.13 Mexico has leaned on the
coffers of the state-owned oil company
Petróleos Mexicanos (PEMEX) to bridge the
funding gap, but this revenue strategy,
near-sighted to begin with, may become
more implausible following the country’s
energy reforms.
The Pacto por México, a reform coalition
spearheaded by President Enrique Peña
Nieto, did pass a fiscal reform in October
of 2013 that should increase tax intake,
but conservatives believe that the reform
extends the depth of duties paid by the
existing tax base without increasing the
breadth of the base—a nettlesome issue
in a country where many jobs remain off
the books. The reform also raises taxes
on Mexico’s manufacturing maquiladora
sector—a move competitiveness
specialists question given its sluggish
growth in 2013.14
All four Pumas will face fiscal tests in
coming years as citizens’ expectations of
services to be provided by the state grow.
Puma governments must find ways to
improve tax efficiency without negatively
affecting growth momentum.
Germany
PeruColombia
Chile
Mexico
Australia
Brazil
Canada
Italy
Japan
Greece
PortugalIreland
United States
UnitedKingdom
Spain
Maastricht Debt Criterion(≤60% of GDP)
Deficit (Percent of GDP)
Go
vern
men
t D
ebt
(Per
cen
t o
f G
DP)
Maastricht Deficit Criterion (≤3% of GDP)
260
220
180
140
100
60
0-5 -3 -1 1 3 5 7 9 11
240
200
160
120
80
40
20
Debt and Fiscal Deficit in 2012
In an era of debt and stimulus programs, the Pumas have demonstrated impressive fiscal restraint.
Source: IMF Data, Pedro Aspe
1 21 2

THE (LATIN) AMERICAN DREAM: PUMA EMPLOYMENT, CONSUMPTION, AND INVESTMENTWith this improved macroeconomic
foundation, the Pacific Pumas have
fostered a positive environment for
consumption, investment and business.
Poverty remains a fact of life for millions
of citizens in these four countries, as
it is for billions of people in emerging
markets around the world. Yet the Pumas
have made rapid progress in this regard
as well. The Colombian poverty rate has
dipped from 45 percent in 2005 to 34.1
percent in 2011.15 Peruvian poverty fell
17 percent between 2006 and 2010,16 and
Chilean poverty has been cut in half since
the 1980s.
Poverty is down throughout the Americas,
including in the more statist countries of
the ALBA alliance, such as Venezuela,
Ecuador and Bolivia. But the Pumas have
matched ALBA improvements without
the economic distortions.
As the middle class expands, the Economist
Intelligence Unit forecasts that the Pumas
will enjoy five percent annual private
consumption expansion over the next six
years, representing a newfound domestic
growth motor encompassing 214 million
people.17 Gross fixed investment,
forecasted to grow 8.39 percent
annually across the Puma economies
over the next six years, will buttress
consumption increases.18 An Alliance-
wide commitment to infrastructure
could pave the way for foreign direct
investment, which has steadily increased
for the Pumas.19
Businesses and investors are taking
notice: The World Bank’s Doing Business
report ranked Chile, Peru, Colombia
and Mexico (in that order), as the
most business-friendly countries in
Latin America.20
While much work remains,21 Puma
economies are humming, poised to
capitalize on opportunities presented by
an emerging Pacific Asia while creating a
roadmap for the rest of Latin America.
The Pacific Pumas | Pumanomics
Chile2000
Chile2011
Peru2001
Peru2012
Colombia2002
Colombia2012
Mexico2002
Mexico2012
LatinAmerica
1999
LatinAmerica
2012
60
50
40
30
20
10
0
Poverty Extreme Poverty
Perc
ent
of
Pop
ula
tio
nPoverty Reduction in Latin America
Source: CEPAL
The Pacific Pumas have made inroads against poverty while maintaining a business friendly environment.
1 31 3

The Pacific Pumas is the story of
macroeconomic maturation: an emerging
region’s model for integrating into a
globalized world. Of crucial importance to
the narrative, however, are the improved
democratic governance and institutions
of Mexico, Colombia, Peru and Chile.
A country’s governance and economic
health are mutually dependent, and
institutional distortions, just like
economic distortions, can ultimately
cause a financial system to collapse.1
Puma democracies are imperfect, but
improved stability, moderation, and a
commitment to reform differentiates
them not only from other growing Latin
American countries, but from many
emerging markets around the globe
as well.
Mexico’s 20th-century bureaucratic
authoritarian government had little time
for the niceties of democracy, but it was
not particularly ideological. The PRI may
be responsible for perpetuating Mexico’s
deeply ingrained culture of corruption,
but it is not guilty of polarizing
the electorate.
In Colombia, “full electoral competition
has been unbroken since 1974.”2
Perhaps owing to the threat of left-wing
violence, or perhaps as a remnant of
the 1957 Frente Nacional power-sharing
agreement, Colombian governance has
not suffered the ideological vicissitudes
of its neighbors. Chile, for its part, has
a long history of compromise-oriented
democracy dating back to the 19th
century (with the glaring exception of the
military dictatorship of 1973 – 1990).
Peru, with a history of populism, military
interventions and wild-card presidents,3
has the most tenuous claim to
pragmatism of the four. Many feared that
the ascension of supposedly left-leaning
President Ollanta Humala in 2011 would
put Peru on a populist course: The
Peruvian stock market sank 12.5 percent
following the election.4 By the end of
2012, however, the markets had recovered
and Humala polled favorably among 75
percent of Peru’s major business leaders,
even while his national approval rating
fell below 50 percent.5
The Pumas’ moderation not only
fosters democracies strong enough
to withstand populist impulses, but
it enables the private sector to expect
that the rules of the game will remain
relatively consistent.
Individually, Mexico, Colombia, Peru
and Chile all face different governance
challenges. A closer look at each case
highlights both the progress made and
Political Overview
Current Executive (*end of current term) Previous Executive
3+ Democratic Elections Since
2000Key Issues in 2014
ChileMichelle BacheletNueva Mayoría (Center Left)2014-2018*
Sebastián PiñeraCoalición (Center Right)2010-2014
3
• Potential constitutional reforms• Resolving student protests• Will Bachelet be dedicated to the
Pacific Alliance?
ColombiaJuan Manuel SantosPartido de la U (Centrist)2010-2014*
Álvaro UribePrimero Colombia (Center Right)2002-2010
3• Legislative elections (March)• Presidential elections (May)• Ongoing peace negotiations
MexicoEnrique Peña NietoPRI (Centrist)2012-2018*
Felipe CalderónPAN (Center Right)2006-2012
3
• Implementation of Energy Reform• Can Pacto por Mexico succeed
without PRD?• Can the Mexican left find its voice?
PeruOllanta HumalaGana Perú (Center Left)2011-2016*
Alan GarcíaAPRA (Center / Center Left)2006-2011
3
• Will Humala lose the left?• Protests of FDI in Mining Sector• Sustaining growth despite
weakening terms of trade
Democratic Maturation3
1 41 4

remaining tests that must still be met in
order to unlock the growth potential of
the Pacific Pumas.
THE MEXICAN REFORMS: A CRITICAL STEP FORWARD Mexico cannot unleash its true economic
potential until the country addresses the
bottlenecks that protect vested interests
but preclude market sophistication.
Trade policy reforms in the early 1990s6
positioned Mexico to become a global
manufacturing hub, but they proved
incomplete. In particular, sections of
the service sector—largely unaffected
by opened borders—survived the
reforms with inefficiencies intact. With
an underperforming energy sector,
inefficient taxation and stifling private-
sector monopolies, Mexico needs a
reform package with punch.
In his first year at the helm, President
Enrique Peña Nieto of the centrist PRI
party has attempted to make up for
decades of action deferred. His current
push for reform is an intensely political
process, with the future of the Mexican
economy hanging in the balance. The
process has been turbulent, but it
appears to be yielding results.
Through his Pacto por México agreement
of December 2012, President Peña
Nieto brought the country’s three major
political parties, PRI, PAN and PRD,7 to
outline a broad and ambitious agenda
for fiscal, banking, education, telecom
and political reforms. While these are
all important, it is energy reform that
could prove the crucial springboard for
Mexican growth.
Between offshore oil and shale gas,
Mexico has the resources for an energy
revolution, but PEMEX, the state-owned
energy giant, lacks the capacity to fully
exploit either. Despite massive shale
gas reserves (the world’s sixth largest,
according to Duncan Wood of the Wilson
Center8), PEMEX has been unable to
meet spiking domestic gas demand.
With pipelines from the US operating
at capacity, Mexican gas prices have
increased just as those across the border
have dropped precipitously.
For industry, Mexican oil-based electricity
runs at roughly twice the price of US gas-
based electricity. Bloated energy costs
eat away at the price advantages Mexico
hopes will entice US firms to relocate
south, threatening Mexico’s hard-fought
foothold in global manufacturing. A
successful energy reform9 could attract
the investment needed to unleash
the energy revolution in the country’s
industrial sector.
On December 12, 2013, the Mexican
Congress approved an energy bill that will
open the country’s oil and gas sector to
international investors. The legislation,
which proved more investor-friendly than
initially expected, represented a major
breakthrough in President Peña Nieto’s
quest for reform.
The process has not always been
smooth. Conservative PAN factions and
business leaders remain bitter about
fiscal reform, spearheaded by the leftist
PRD. Meanwhile, the PRD withdrew
from the Pacto por México in November
2013, objecting to PAN leadership of
energy reform.
The Pacto’s initiatives are, therefore, no
faits accomplis. They are multi-step legal
and political processes that could be
ambushed by protests that bring Mexico
City to a grinding halt or vested interests
willing to fight tooth and nail to protect
privileged positions.
Nevertheless, the process underscores
impressive political sophistication.
President Peña Nieto may be the reform
movement’s figurehead, but the policy
proposals are not populist in nature.
Rather, they are a concerted effort to
create the institutional foundation
required to support the weighty potential
of the Mexican economy. The press might
refer to the lengthy dialogues between
parties as “horse trading”, but for
Mexico—a one-horse country for much
of the last century—it is evidence of a
burgeoning democracy.
THE COLOMBIAN PEACE PROCESS: FARC, FISH HEADS AND TOADS Colombia’s emergence has not been
hindered by unsophisticated or
spendthrift economic management,10 but
rather by the persistent social instability
that has plagued the country for
decades and that has displaced roughly
ten percent of the population.11 From
guerrillas to paramilitaries to drug cartels
(and the interconnections between the
three) the problem has always been the
violence and the deterring effect this has
had on private investment, especially
on long-term infrastructure projects.
This same violence has also prevented
Colombia from becoming a truly
inclusive democracy.12
A lasting peace that extends beyond
major metropolitan areas is fundamental
to unlocking Colombia’s growth
potential. The last two Colombian
presidents have expended significant
political capital addressing the lingering
conflict, though they have chosen sharply
divergent tactics. President Álvaro Uribe
(2002 – 2010) confronted the guerrilla
head-on. His violent military offensive
punished the largest rebel force, Fuerzas
Armadas Revolucionarias de Colombia (FARC),
halving the faction’s troops and killing a
number of its influential leaders.
President Juan Manuel Santos, who took
office in 2010, seeks to capitalize on the
rebel’s reduced capacity and influence
by negotiating a definitive peace accord.
At first glance, the talks between the
Colombian government and FARC
leaders (which have occurred in Havana
since November 2012) would seem
unlikely to yield lasting results. After
all, the FARC’s ideological leaders are
not believed to have significant control
over a disjointed guerrilla movement
that may be more interested in drug
profits than in the movement’s original
Marxist principles.
However, the Havana dialogues are not
meant to end the violence, at least not
immediately. Rather, they are geared
towards establishing peace with the
The Pacific Pumas | Democratic Maturation 1 51 5
political wing of FARC, thus isolating
the faction of of the movement that is
fighting for illicit gains. As of now, the
two factions are co-dependent. The
political FARC provides ideological
legitimacy,13 while the operational FARC
offers financing, be it through drugs,
kidnapping or other destructive activity.
In the 1990s, the Colombian military
(and paramilitary) attempted to battle
the FARC by quitando el agua del pez—
draining the water from the fish. In
practice, this meant locating the guerillas
and “removing” anything (or anyone) that
might hide or protect them. This led to
a spiraling tit-for-tat between different
armed forces, ultimately rendering
Colombia one of the most dangerous
countries on the planet in the 1990s.
The current peace process represents
a different strategy. Instead of draining
the water from the fish, the government
hopes to remove the fish’s head. If the
government can make peace with FARC’s
political wing (its “brain”), this would
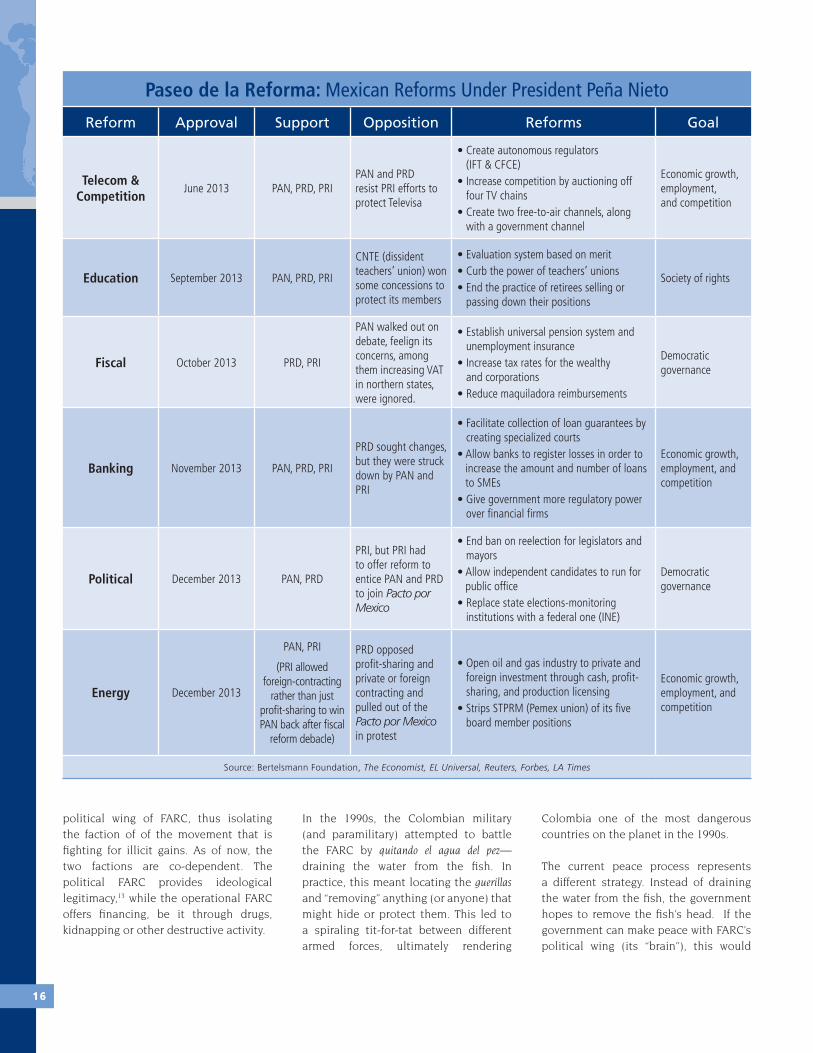
Paseo de la Reforma: Mexican Reforms Under President Peña Nieto
Reform Approval Support Opposition Reforms Goal
Telecom & Competition
June 2013 PAN, PRD, PRIPAN and PRD resist PRI efforts to protect Televisa
• Create autonomous regulators (IFT & CFCE)
• Increase competition by auctioning off four TV chains
• Create two free-to-air channels, along with a government channel
Economic growth, employment, and competition
Education September 2013 PAN, PRD, PRI
CNTE (dissident teachers’ union) won some concessions to protect its members
• Evaluation system based on merit• Curb the power of teachers’ unions• End the practice of retirees selling or
passing down their positions
Society of rights
Fiscal October 2013 PRD, PRI
PAN walked out on debate, feelign its concerns, among them increasing VAT in northern states, were ignored.
• Establish universal pension system and unemployment insurance
• Increase tax rates for the wealthy and corporations
• Reduce maquiladora reimbursements
Democratic governance
Banking November 2013 PAN, PRD, PRI
PRD sought changes, but they were struck down by PAN and PRI
• Facilitate collection of loan guarantees by creating specialized courts
• Allow banks to register losses in order to increase the amount and number of loans to SMEs
• Give government more regulatory power over financial firms
Economic growth, employment, and competition
Political December 2013 PAN, PRD
PRI, but PRI had to offer reform to entice PAN and PRD to join Pacto por Mexico
• End ban on reelection for legislators and mayors
• Allow independent candidates to run for public office
• Replace state elections-monitoring institutions with a federal one (INE)
Democratic governance
Energy December 2013
PAN, PRI
(PRI allowed foreign-contracting
rather than just profit-sharing to win PAN back after fiscal
reform debacle)
PRD opposed profit-sharing and private or foreign contracting and pulled out of the Pacto por Mexico in protest
• Open oil and gas industry to private and foreign investment through cash, profit-sharing, and production licensing
• Strips STPRM (Pemex union) of its five board member positions
Economic growth, employment, and competition
Source: Bertelsmann Foundation, The Economist, EL Universal, Reuters, Forbes, LA Times
1 61 6

undermine the group’s justification
for continued conflict. The remaining
“gangster” element of FARC, now lacking
ideological support, would be isolated,
exposed, and doggedly pursued.
An eventual peace deal might well
guarantee political participation for the
former rebel combatants based on a quota
system (the country already reserves two
senate seats for representatives from
the country’s indigenous communities,
and two lower house seats for
Afro-Colombians).
The plan is contingent upon the
Colombian right accepting the left into
the democratic sphere, by no means
a given. In February 2014, Semana, a
Colombian weekly, offered evidence that
the Colombian military—independent
of the government—was spying on
the peace talks.14 That same month
two prominent left-leaning politicians
received death threats from shadowy
paramilitary organizations.15
The Colombian phrase tragar un zapo
(swallow a toad) might translate into
English as “a tough pill to swallow”. By
offering institutional legitimacy and
political inclusion to FARC leaders
in Havana, Colombian officials are
swallowing toads by the handful. But
once Colombia can achieve what has
been an elusive peace, it can then begin
to flex its economic muscles.
CHILEAN DEMOCRACY: UNFINISHED BUSINESSOn March 11, 2014, Michelle Bachelet
donned Chile’s presidential sash for a
second time after having handily won a
December 15 run-off election (Bachelet
previously served as president from 2006
– 2010). According to her 2013 electoral
platform, she will focus on education,
tax reform and adjustments to—if not
an outright overhaul of—the Chilean
constitution. The three objectives are
intertwined, and they reflect Chile’s
25-year effort to responsibly reform a
severely flawed document.
Forged under General Augusto Pinochet’s
military dictatorship (1973–1990), Chile’s
1980 constitution carved out a series of
authoritarian enclaves, designed to allow
General Pinochet to cloak his heavy-
handed rule in the guise of democracy.16
With an influential, unchecked
military presence, weak legislature,
concentrated presidential powers,
and a binomial electoral system that
ensured disproportionate conservative
representation, Pinochet’s constitution
hardly provided a bedrock for Latin
America’s most advanced democracy.
Much to Chile’s credit, however,
subsequent governments did not
attempt to delegitimize this constitution
The Pacific Pumas | Democratic Maturation
Timeline – The Colombian Peace Process1948 - 57 1960s - 1990s 1998 2000 2001 2002
• 250,000-300,000 killed in “La Violencia”, a 10-year civil war between conservatives and liberals. In 1958, both sides agree to form the National Front and ban all other parties.
• Many of Colombia’s left- and right-wing extremist groups form. Political violence and assassinations are prevalent. Efforts to integrate FARC into politics are ineffective.
• Conservative President Andres Pastrana Arango grants FARC a safe haven the size of Switzerland in the south-east as part of peace talks. The zone is off-limits to the army.
• Pastrana’s “Plan Colombia” wins bilions in mainly military aid from the US to fight drug-trafficking and rebels who profit and protect the trade. Peace talks deteriorate.
• Government, FARC sign San Francisco agreement, committing both to negotiate ceasefire.
• Indpendent Alvaro Uribe assumes presidency, promising to crack down on rebel groups. As Uribe is sworn in, explosions rock Bogota.
Uribe’s first term: 2002 - 2006 Uribe’s second term: 2006 - 2010 Santos’ first term: 2010 - present• Uribe carries out aggressive military campaign
against FARC, pushing guerrillas out of towns and back into rural areas.
• New law offers reduced punishment for paramilitaries who turn in their arms. Rights groups say the legislation is too lenient.
• Uribistas win overwhelming electoral victories.• Uribe continues heavy-handed campaign,
including a cross-border strike in Ecuador that sparks diplomatic crises with Ecuador and Venezuela.
• Colombia extradites 14 paramilitary warlords to the United States.
• Juan Manuel Santos, Uribe’s former Defense Minister, elected president.
• FARC unlitaterally releases several hostages.• Santos opens exploratory talks with FARC
guerrillas.• Uribe accuses Santos of “giving impunity to
terrorists”.
November 2012 - May 2013 May 2013 - November 2013 November 28 - Present
• Havana discussions begin.• Early topics include land access, rural
development, infrastructure, poverty reduction, and agrarian stimulus.
• Agreement on these topics reached in May 2013.
• Parties open discussions on political participation.• Topics include improved access to media, regional
“Councils for Reconciliation and Coexistence”, changes to ease the formation of political parties.
• Parties reach agreements on these topics in November 2013.
• Seventeenth round begins. Both parties agree to postpone the contentious topics (ending the conflict/demobilization and transnational justice) and move to addressing international drugs.
Source: BBC America, ColombiaPeace.org
1 71 7

outright—an approach that would
have likely interrupted the country’s
steady economic growth. Rather,
iterations of the center-left Concertación
government (1990–2010) methodically
reformed the document, often in close
consultation with the private sector and
the political opposition. All told, the
original constitution has undergone
131 amendments, affecting 79 of its
120 articles.17
The current Bachelet government
appears poised to address the remaining
deficiencies instilled by the Pinochet
government as well as the growing
pains of a country transitioning to
the developed world while still facing
persistent inequality. If these changes
can promote upward mobility and a more
inclusive democracy, they will bolster the
country’s economic rise.
But Chile must come to terms with
student protesters, whose strikes have
intermittently shut down schools and
immobilized streets since 2006. The
students balk at Pinochet-era education
laws that favor affluent pupils18 and
university fees that reach US$1000
monthly. Bachelet’s platform proposes
full subsidization of public universities
within six years (though this would not
address the flawed high school model).
She would pay for this by increasing
corporate tax rates from 20 to 25 percent,
still far below the weighted OECD average
of just roughly 35 percent.19
Bachelet’s efforts to improve democratic
inclusiveness are equally important.
Following the Pinochet years, Chile’s
vulnerable and nascent democracy took
a cautious, centrist approach. Twenty-
five years later, this method threatens to
ossify the political process. The country’s
curious binomial election system
stipulates that each congressional
district must split its two seats between
the first and second-place parties, unless
one of the two can garner two-thirds of
the vote—a relative rarity.
This system disincentivizes participation
because split districts are the most likely
outcome—one reason more and more
Chileans are not bothering to go to the
polls. If it’s a foregone conclusion that
one liberal and one conservative will
win, why vote? In fact, only 50 percent of
eligible Chileans voted in last November’s
general election.20 Bachelet will seek
to reform the binomial system, though
this will require politicking because her
coalition lacks the congressional 3/5
quorum required to change it.21
Finally, Bachelet’s incorporation of
former student leaders and more
leftist factions into her Nueva Mayoría
coalition is an important step forward
for Chile. While some22 view this as a
concerning leftward veer, it is far better
to incorporate these elements into the
formal political dialogue than to exclude
them from it. A century of repression has
not eliminated the Chilean left. Far better
to have leftists participate in Chile’s
democracia de los acuerdos (democracy based
on agreement), rather than to have them
battling against it.
PERU: THE MATURATION OF A PUMA CUBPeru earns its stripes based on economic
performance and an openness to trade
that has positioned it to capitalize
on Asia’s rise. In terms of democracy,
however, this Pacific Puma still has some
growing up to do.23
The country has taken important
strides. Peru has held three successful
presidential elections since the ousting
of the semi-authoritarian Alberto
Fujimori (1990 - 2000), and the winners of
those elections have generally followed
the rules of the game. Peru has executed
party transitions: Three different political
coalitions have led 21st century Peru.
The Road to Redemption: Chilean Constitutional Reforms Since 1989
Year Reformer (Party) Reforms
1989 Military government & Concertación de Partidos por la Democracia
• Limited penalization of groups previously viewed as subversive• Increased number of elected senators and added civilian member to
National Security Council• Modified constitutional amendment mechanism• Removed president’s ability to dissolve lower house
2005President Ricardo Lagos
(Concertación); Supported by Conservative Senators
• Cut presidential term from six years to four years• Eliminated ten unelected senate seats reserved for military-
affiliated personnel• Eliminated several prerogatives of the armed forces and police chief• Increased power of congress
2014(potential)
President Michelle Bachelet (Nueva Mayoría)
• Revise binomial electoral system• Address high-majority requirement for educational reforms• Inclusion of rights for women and indigenous groups• Extend presidential term limit from four years or allow consecutive terms
1 81 8

The first two presidents respected
a constitutional ban on immediate
reelection, and current President
Ollanta Humala, who took office in 2011,
has promised to do the same.24 Two
successive presidents have run on left-
leaning platforms without subsequently
dismantling Peru’s free-market economy,
suggesting an important modicum of
stability in Lima.
Nevertheless, the country’s political
system remains rudimentary. In contrast
to Mexico, Colombia and Chile, political
volatility has been a norm in Peru. The
country suffered eight coups in the 20th
century, while presidents averaged less
than three and a half years in office.
A more recent consequence of this
instability has been the diminished
importance of political parties. Beginning
with Fujimori’s “anti-political” campaign
in 1990, Peruvian presidents have built
political parties as short-term vehicles
they could ride to power.25 These rickety
coalitions that lack philosophical
underpinnings are subsequently held
together by the meting out of sinecures
and favors.
Operating without a strong party
foundation, Peruvian presidents have
struggled to pursue a coherent direction.
For example, President Humala governs
to the right of how he campaigned.
Business may breathe a sigh of relief,
but voters who backed the president
based on his left-leaning platform feel
duped.26 Without any defined governing
philosophy, Peruvian presidents’
personal exploits (and foibles) attract
more attention than reform packages.
These factors have inhibited the
country’s ability to fully translate growth
into tangible improvements—one reason
why the approval ratings of the last four
presidents have deteriorated through the
course of their presidencies.
Peru’s economy has benefited from
buoyant Asian commodity demand. To
manage this windfall—and, ultimately, to
manage after the windfall—the country’s
democracy must improve. Successful
elections and transitions represent an
important step forward. But until there
is more institutional stability, Peruvian
politics remain something of a crapshoot,
threatening to turn the current economic
winning streak into a bust.
MOVING FORWARDPuma democratic gains are not
irreversible. The December 9, 2013 sacking
of Bogota’s left-leaning Mayor Gustavo
Petro by a right-leaning inspector general
on rather flimsy grounds underscores
the tenuousness of Puma institutional
stability. We have yet to see if an elected,
left-leaning Colombian or Mexican
executive would adhere to existing
frameworks. But all democratic systems
in the world suffer from significant
flaws. Deficiencies notwithstanding,
the democratic conditions in Mexico,
Colombia, Peru and Chile have become
increasingly stable, and the rules of the
game increasingly clear and reliable.
These improvements have helped
position the Pumas to become regional
leaders. Most of Latin America may
be growing, but it is the Pumas, along
with Pumitas such as Uruguay and Costa
Rica, that are simultaneously maturing
politically. Mexico may have similar 2013
growth figures to those of Venezuela, but
if the Mexican reforms are successful,
it will be well positioned for consistent
future growth, while Venezuela will be
but one day closer to its reckoning.
Brazil’s market size swamps that of
Colombia or Peru, but investors may tire
of the Custo Brasil, the implicit operational
cost of trying to do business in that
country, and they will be enticed by the
Pumas’ business-friendly governance.
Argentina maintains its perennial growth
potential, but unpredictable rules of the
game hinder firms’ and families’ ability to
plan for the future—something that can
be done with relative confidence across
the Andes in Chile.
Puma democratic maturity can compare
favorably to governance in emerging
Asian countries as well, where the heavy
hand of the state in countries such as
China or Vietnam could face increased
social backlash in coming years.
Improved Puma governance may not
appear in any given year’s growth charts,
but over time it will create conditions
that could allow strong performance to
be sustained in the future.
The Pacific Pumas | Democratic Maturation 1 91 9

If geography is destiny, Pacific Latin
America is not a bad place to be in the
early 21st century. East Asia has emerged
as a cauldron of global growth and
trade, while the US and Canada remain
economic powerhouses and hubs of
innovation. Colombia, Peru, Chile and
Mexico have the good fortune of both
having direct access to the Pacific’s
intricate web of supply chains and of
possessing the raw inputs—the copper,
iron ore, and hydrocarbons—that are so
valuable to emerging East Asia.
Much of Latin America has benefited
from strong commodity prices over the
last ten years. What differentiates the
Pumas is their effort to create deeper
linkages, with both traditional trans-
Atlantic partners and emerging Asian
partners. The statistics suggest the effort
has been successful: The Pumas have
averaged 4.7 percent annual growth in
exports since 2001, and the IMF forecasts
Puma exports to grow six percent
annually through 2017.1
But trade liberalization, itself, is no
panacea, and export-led growth raises a
host of challenges. The Andean Pumas,
with resource-heavy export portfolios,
must avoid the looming pitfalls of
commodity reliance. Mexico, on the
other hand, must encourage the rise of its
manufacturing sector while addressing
the gap between winners and losers
of trade.
This chapter begins with an overview
of Puma integration, featuring Mexican
and Chilean case studies. The chapter
concludes by considering the challenges
the Pumas face in their pursuit
of integration.
PUMA TRADE IN A GLOBALIZED WORLD The Pumas’ embrace of trade began
mostly in the 1980s and 1990s, when
many Latin American countries lifted
tariff and regulatory barriers that had
been designed to protect domestic
industries.2 Unilateral reforms eventually
led to a “surge” in trade, especially with
non-traditional partners in East Asia.3
More recently, the Pumas have been
active participants in bilateral and
multilateral free trade agreements. They
have aligned with those countries seeking
to accomplish bilaterally and regionally
Puma Integration:Running with the Tigers
4
Puma Free Trade Agreements with Major EconomiesChile Colombia Mexico Peru
Australia FTA (2009) FTA (proposed)FTA (under negotiation
through TPP)FTA (under negotiation
through TPP)
Canada FTA (1997) FTA (2011) FTA (1994 - NAFTA) FTA (2009)
China FTA (2006) FTA (2010)
EU FTA (2003) FTA (2013) FTA (2000) FTA (2013)
India PTA (2007) PTA (proposed)
Japan EPA (2007) FTA (proposed) EPA (2005) FTA (2012)
South Korea FTA (2004)FTA (signed in 2013, not
in force)SECA (under negotiation) FTA (2011)
Thailand FTA (signed in 2013, but not in force)
FTA (2011)
US FTA (2004) FTA (2012) FTA (1994 - NAFTA) FTA (2009)
Vietnam FTA (signed 2011, but not in force)
FTA (under negotiation through TPP)
FTA (under negotiation through TPP
Assisting Sources: Inter-American Development Bank, Barbara Kotschwar
2 02 0

what the World Trade Organization has
been unable to accomplish globally:
free trade.
Some fear that these types of agreements
could lead to trade regionalism, but the
Pumas have used them to forge linkages
all over the world. All four have signed
FTAs with the US, Canada, and the EU,
while simultaneously integrating into
East Asia’s “noodle bowl” of pacts. China,
Japan, South Korea, Singapore and India
have all concluded agreements with at
least two of the Pumas.
Many of the deals go well beyond simply
liberalizing trade in goods. They also
include “comprehensive provisions on
services…intellectual property rights…
investment, government procurement,
trade facilitation and competition”.4
The Korea-Peru and Australia-Chile
agreements are considered “the gold
standard of FTAs”.5
Efforts to integrate into global trade have
paid off. Spurred by strong copper prices,
Chilean trade with China increased from
US$1.34 billion in 2000 to US$17.94
billion in 2012 (the two signed a free trade
agreement in 2006).6 Peruvian exports
to China increased 42 percent between
2010 and 2012, due at least in part to the
Peru-China Free Trade Agreement that
came into effect in 2010.7 Mexican trade
with the US increased more than 500
percent in the first 20 years of NAFTA,8
while Colombian exports are up nearly
50 percent just since 2010.9
This integration, in both the Atlantic
and Pacific, has primed the Pumas for
the world’s future trade ecosystem.
With the WTO’s Doha Round stalled,
the globe’s foremost trade initiatives
are the Trans-Pacific Partnership (TPP),
which focuses mostly on reducing tariffs
and harmonizing regulations in Pacific
Rim countries, and the Trans-Atlantic
Trade and Investment Pact (TTIP), which
intends to harmonize EU-US trade
regulations. These deals represent 38
and 40 percent, respectively, of global
GDP, and they could well set the standard
for 21st century trade.
Mexico, Peru and Chile are already
participants in TPP dialogues. Colombia,
withheld from TPP on a technicality,10 can
ensure that its voice is heard, and that its
regulatory and tariff standards are up to
snuff, through Pacific Alliance dialogues.
The Pumas, and Mexico in particular, are
concerned that they cannot participate in
TTIP dialogues, which have been limited
to US and EU participants (see Chapter
Japan South Korea Other
China EU US
Argentina Brazil Other
US China EU
Mexico Brazil Other
US China EU
Japan South Korea Other
US China EU
Brazil Ecuador Other
US China EU
Panama Venezula Other
US EU China
China Colombia Other
US EU Canada
Switzerland Canada Other
EU China US
Colombia
Colombia
Mexico
Mexico
Peru
Peru
Chile
Chile
17%
17%
14%11%8%
33%
78%
11%
6%
3%1%
1%
33%
32%23%
18%7%
7% 13%
31%24%
17%
13%11%
5%
23%
15%
12%11%6%
33%37%
15%4% 5%6%
15%
40%
19%
19%50%
15% 12%6%5%
11%
5%
4%
The Pacific Pumas | Puma Integration
Puma Exports by Destination, 2012 (Percent of Total Value)
Japan South Korea Other
China EU US
Argentina Brazil Other
US China EU
Mexico Brazil Other
US China EU
Japan South Korea Other
US China EU
Brazil Ecuador Other
US China EU
Panama Venezula Other
US EU China
China Colombia Other
US EU Canada
Switzerland Canada Other
EU China US
Colombia
Colombia
Mexico
Mexico
Peru
Peru
Chile
Chile
17%
17%
14%11%8%
33%
78%
11%
6%
3%1%
1%
33%
32%23%
18%7%
7% 13%
31%24%
17%
13%11%
5%
23%
15%
12%11%6%
33%37%
15%4% 5%6%
15%
40%
19%
19%50%
15% 12%6%5%
11%
5%
4%
Puma Imports by Origin, 2012 (Percent of Total Value)
Source: World Trade Organization
2 12 1

7). Nevertheless, the Pumas’ pre-existing
pacts and ongoing discussions with the
EU and the US can help ensure that their
regulations match those enumerated in
any future TTIP deal.
Alternatively, countries not party to
either pact (the four BRICs—Brazil,
China, India, and Russia—stand out in
this regard) could find themselves either
isolated or pressured to subsequently
join a pact they did not help design.
PUMA TRAPS: BEATING RESOURCE RELIANCEPuma trade may be rapidly increasing,
but the infamous commodity trap looms.
The Pumas—Chile, Peru and Colombia in
particular—have greatly benefited from
the highest crude oil and metal prices
observed since World War II.17 There
is no shortage of pundits arguing that
their recent growth is predicated solely
on strong commodity prices. Should
these falter, the argument continues,
so too would Puma progress. Even if
prices remain strong, overreliance on
commodity exports threatens to prevent
the linkages the Pumas need to expand
beyond resource reliance.
Basic theory of supply and demand
suggests that commodity prices may
soon come back down to earth. On the
one hand, demand may be in decline.
As Chinese growth tapers, and as OECD
demand for Chinese goods remains
sluggish, the country no longer stockpiles
copper and ore reserves, instead pursuing
a “hand-to-mouth” buying pattern.18 On
the other hand, commodity supply has
increased. New investments inspired by
boom-era prices are only now coming
online, portending expanded supply.
Credit Suisse forecasts that global copper
production will increase four percent
annually between 2012 and 2015, leading
the investment bank to conclude that
“copper scarcity is a thing of the past”.19
The writing is already on the wall.
Between 2011 and mid-2013, global
copper prices fell 35 percent, iron ore
40 percent, and gold 36 percent. Mineral
shipments leaving Peru’s Callao port
CASE STUDY AThe Mexican Model: Becoming a hub
Notwithstanding Chile’s rash brush with neoliberalism in the 1970s, Latin
America’s true shift from protectionism began in 1985 with Mexico’s ascension
to the General Agreement on Tariffs and Trade (GATT). It continued in 1994 with
the North American Free Trade Association (NAFTA). Today Mexico has free trade
agreements with 44 countries; that is more than twice as many as China and four
times more than Brazil.11
These agreements coincided with sharp increases in Mexican trade: In 1985, the
volume of Mexican exports totaled just 27.6 percent of its 1995 value. By 2000,
Mexico exported double the 1995 volume.12 Mexico subsequently doubled the
value of its exports again between 2000 and 2010. Along the way, the country
established itself as Latin America’s manufacturing capital, exporting more of such
goods than the rest of the region combined13—a point of interest to other Pumas
hoping to expand in this sector.
Mexico’s embrace of free trade helped fuel the sector’s emergence for two reasons:
First, it precipitated swift increases in foreign direct investment. Attracted by
newfound ease in moving products across the border into the US, international
firms outsourced tasks along the value chain to Mexico before importing finished
(or nearly finished) products north. From 1980 through the advent of NAFTA on
January 1, 1994, Mexico averaged just US$2.6 billion in net FDI inflows. From 1994
through 2012, that average jumped to nearly US$19 billion.14
This investment has radically influenced Mexico’s export portfolio. In the 1980s,
hydrocarbons accounted for 61 percent of Mexican exports. By 2012, manufactured
goods represented a full 81 percent of Mexican exports.15 The FDI has also induced
knowledge spillover, and Mexico has advanced in high-tech goods: It is the world’s
preeminent exporter of flat-screen TVs, and a major producer of domestic and
medical appliances.
Secondly, liberalized trade forced efficiency improvements. International
competition pushed previously coddled producers towards reforms that would
otherwise be difficult and time consuming to legislate. Forced to compete with
China, domestic firms had to sink or swim as China cut into Mexico’s manufacturing
exports to the US after joining the WTO in 2001. Twelve years later, Mexico has
taken significant strides towards closing the productivity gap with the Asian giant
(an effort assisted by increased Chinese wages and trans-Pacific transportation
costs), and has nearly recovered its share of manufacturing exports.
While Peru and Colombia may look to the Mexican blueprint to establish their own
industrial sectors, the Mexican model has also encountered some of the pitfalls
of global integration, particularly an emerging gap between winners and losers of
trade. Within firms, wages remain stubbornly low—a boon for owners of capital,
but a burden for labor. Between firms, larger multinationals have been able to
capitalize on FTAs and foreign investment; smaller (often informal) firms have not.
Nationally, Mexico’s manufacturing sector is concentrated in the north, a region
whose growth has far outpaced the more rural south.16
Moving forward, Mexico must ensure that more firms are exposed to the benefits of
liberalized trade. If it does not, and if existing inequality persists, there will almost
certainly be a backlash to Mexico’s model for integration.
2 22 2

were down 12 percent through the first
six months of 2013.20
Yet the unwinding of the boom need not
be cataclysmic. For one thing, commodity
exports will not disappear overnight.
Chinese growth may decline, but seven
percent annual growth over the next
five years (as forecast by the IMF) is not
exactly a depression. Moreover, demand
from other resource-starved Asian
countries will likely increase. Between
2000 and 2010, mineral imports to India,
Indonesia, Malaysia and Thailand all
averaged more than 20 percent annual
growth.21 Even the bearish forecasts have
copper prices above the average price
between 2003 and 2008, which were years
of strong growth for Chile and Peru.22
In terms of linkages, conventional wisdom
holds that commodity exports generate
few forward and backward employment
opportunities. Where raw resources
are simply withdrawn from the earth
and shipped abroad, few “downstream”
jobs are created, little technology is
needed and a country does not cultivate
spillover knowledge.23
CASE STUDY BThe Chilean Model: Export Diversification
Chile is another Latin American veteran of liberalized trade, having experimented
with reduced tariffs since 1974. In the early 1970s, Chile remained fortified behind
import substitution industrialization (ISI) policies. Luxury goods faced tariffs as
high as 750 percent and all imports required administrative approval.26 The country
rapidly embraced global markets following the 1973 coup d’état, but the rigid
neoliberalism implemented by the military junta led to falling real wages, soaring
unemployment and a soft underbelly of corporate debt—vulnerabilities exposed
in 1982 when 800 firms filed for bankruptcy and GDP contracted by 14 percent.27
Beginning in the mid-1980s, however, Santiago adopted a more measured tack
towards real integration. Marked by a steady decrease in tariffs (from 15 percent
in 1988 to near 3 percent in 2010),28 a propensity for bilateral trade agreements,
and a concerted effort to develop non-traditional exports, these policies led to two
decades of sustained growth, including during the years that predated the booming
commodity prices of the 2000s.
Crucially, Chile’s opening led to a blossoming of non-traditional exports. At
the farm level, Chileans have long held comparative advantages in production.
However, not until the country pursued more liberal trade did producers of wine,
fruit and fish have access to external markets and equipment inputs, as well as the
competitive exchange rate needed to trade internationally.29
The emergence of Chilean wine is a testament to the model’s success. Wine, which
began the 1990s accounting for roughly one percent of Chile’s non-copper exports,
finished the decade at nearly six percent. Presently, Chile is the world’s seventh
largest wine producer, after nearly doubling exports in 2012.
As Chilean viticulture improved, foreign capital poured into the sector. Simply
between 1995 and 2000, wine-related FDI equaled 14 times the 1990-1994 value. In
some cases, European firms opened joint ventures with Chilean producers—one
reason that the award-winning Concha y Toro’s wine is now sold in at least 135
countries.30
The Pacific Pumas | Puma Integration
Refined copper and copper alloys, unwrought
Copper ores and concentrates
Unrefined copper, copper anodes for electrolytic refining
Other
47%
28%
21%
4%
Petroleum oils, crude
Coal / Coal Products
Petroleum oils, other than crude
Gold
Other
30%
44%
12%8%
6%
Gold (including gold plated with platinum)
Copper ores and concentrates
Refined copper and copper alloys, unwrought
Petroleum oils, other than crude
Flours, meals and pellets, of meat or meat offal
Lead ores and concentrates
Other
22%
17%
6%6%4%4%
41%
Source: United Nations Data
Chile Exports by Value, 2012
Colombia Exports by Value, 2012
Peru Exports by Value, 2012
Commodities still represent a major component of the Andean Pumas’ exports 2 32 3

But perhaps this is an over-
simplification.24 As with industrial goods,
commodities pass through a series of
production phases as they are refined, for
example, from iron ore to steel or from
oil to gasoline. This process requires
advanced technology. The problem is
that the technology has historically been
housed elsewhere. For example, Chile,
the world’s largest producer of copper,
builds only one percent of the world’s
fabricated copper products.25 Mexico
exports crude oil to the US and imports
refined fuel.
As the Pumas develop internal investment
muscle, and as they continue to earn
the faith of international developers,
more downstream linkages could occur
domestically. Chile has already set the
stage, moving from an imitator to an
innovator in exporting wood pulp and
wine (as opposed to logs and grapes). If
the other Pumas can follow suit, perhaps
natural resources can be a foundation
for an expanding economic ecosystem,
as opposed to the first and last words in
Latin American development.
PREPARING POST-BOOM ECONOMIESThe Pumas understand that booming
commodity prices may not last forever,
and even if they did, simple raw resource
exports are unlikely to generate holistic
development. Thus, Mexico, Colombia,
Peru and Chile are attempting to achieve
deep integration both regionally and with
the global economic hubs in the Atlantic
and Pacific with the goal of establishing
niches in trade networks and supply
chains beyond commodities.
Executing the strategy, however, requires
far more than signing as many free trade
deals as possible. The Pumas must
make sure that the benefits of export-led
growth are more evenly spread. Improved
infrastructure is a good place to start.
All four countries face unforgiving
topography, and as a result, in-country
transportation from remote regions
to exit points implies great expense.
Colombia, for example, does not have
the domestic transport system required
to conduct major trade with East Asia: It
is three times more expensive to ship a
container from Bogotá to the Caribbean
port of Barranquilla than it is to ship
the same container from Barranquilla to
Hong Kong.31
An Inter-American Development
Bank study32 coordinated by Mauricio
Mesquita Moreira estimates notable
export increases for all four countries
with even just a one percent decrease
in in-country transportation costs. The
study forecasts 7.8 percent expansion
of manufacturing exports in Colombia.
In Mexico, the study found that the one
percent reduction in transportation costs
in the south could lead to a five percent
increase in total exports. In Peru and
Chile, where pockets of the population
in remote areas struggle to integrate
into trade networks, the study found that
agricultural, mining and manufacturing
exports would all expand roughly four
percent with a one percent decrease in
internal transportation costs.
The region’s flawed efforts to liberalize
in the 1990s remain a bitter memory.
“Washington Consensus” is a pejorative
term for many in Latin America. But
globalization will not disappear, and the
Pacific Pumas are preparing to capitalize
from it. For the model to take hold, all four
Pumas must focus not only on enlarging
the proverbial pie, but also ensuring that
more people get forks as well.
If Mexico, Colombia, Peru and Chile
can do this, their macroeconomic
and political stability will be
matched by consistent growth in the
forseeable future.
Mexico Colombia Peru Chile
Share of totalexports %
Share of totalexports %
Share of totalexports %
>11
8
<3
>15
7
<3
>15
6
<2
Share of totalexports %
15
6
<3
Distribution of Exports: Mexico, Colombia, Peru, and Chile
Source: Mauricio Mesquita Moreira. Too far to export: Domestic Transportation Costs and Regional Export Disparities in Latin America and the Caribbean. (Inter-American Development Bank, 2013), Pg. 9-10.
Currently, Puma export production is concentrated regionally. The Pumas must work to ensure that the entire country can benefit from an export-oriented trade strategy
2 42 4

The Pacific Pumas | Puma Integration 2 52 5
II. Global Opportunities5. The Pacific Alliance6. Latin America Divided?7. A trans-Atlantic Triangle8. Harnessing the Dragon
2 6

To this point, this paper has focused on
the advancements of Mexico, Colombia,
Peru and Chile individually. However,
these countries’ shared democratic
improvements, macroeconomic stability
and openness to trade make them natural
partners, thus leveraging their power in a
globalized world. Via the Pacific Alliance,
the Pumas have added gravitas to their
individual momentum and established
their model as an attractive approach
for many smaller and mid-sized Latin
American countries.
Much like their European relatives, Latin
American leaders have a sweet tooth
for the summit, the annual meeting
and the commission. Lofty goals and
promises of solidarity are sealed with
vigorous handshakes, bear hugs and
kisses on the cheek. But beyond the
ubiquitous photos of smiling presidents,
few concrete achievements emerge from
these gatherings.
In theory, inchoate integration projects
abound, from the regional MERCOSUR
to the continental Union of South
American Nations (UNASUR). In fact, the
dream of a more unified Latin America
has progressed little since Simon Bolívar
crisscrossed the Andes in the early
19th century.
This could be changing.
The Pacific Alliance, a trade and
integration bloc conceived in April 2011
and launched in June 2012, originally
consisted of the four Pacific Pumas.
The Alliance is a natural collaboration
between like-minded countries that have
independently developed similar reforms
and strategies, with an eye towards the
East as both a trading partner and a
model for development.
Through the Alliance, the Pacific Pumas
do not seek reform. Rather, they hope to
amplify existing reform and to synergize
integration efforts in both the regional
and global economy. For those in the
Western Hemisphere (north and south)
anxious to establish an alternative to the
Atlantic-Latin American development
model, the Pacific Alliance is the most
exciting thing happening in the region.1
THE PACIFIC ALLIANCEViewed as a unit, the Pacific Alliance
converts a series of small to mid-sized
economies into a global force. With 221
million people (counting Costa Rica),2
The Pacific Alliance: A Gathering of the Pumas
5
Global Opportunities | The Pacific Alliance
Member States Observer States
The Pacific Alliance
2 7
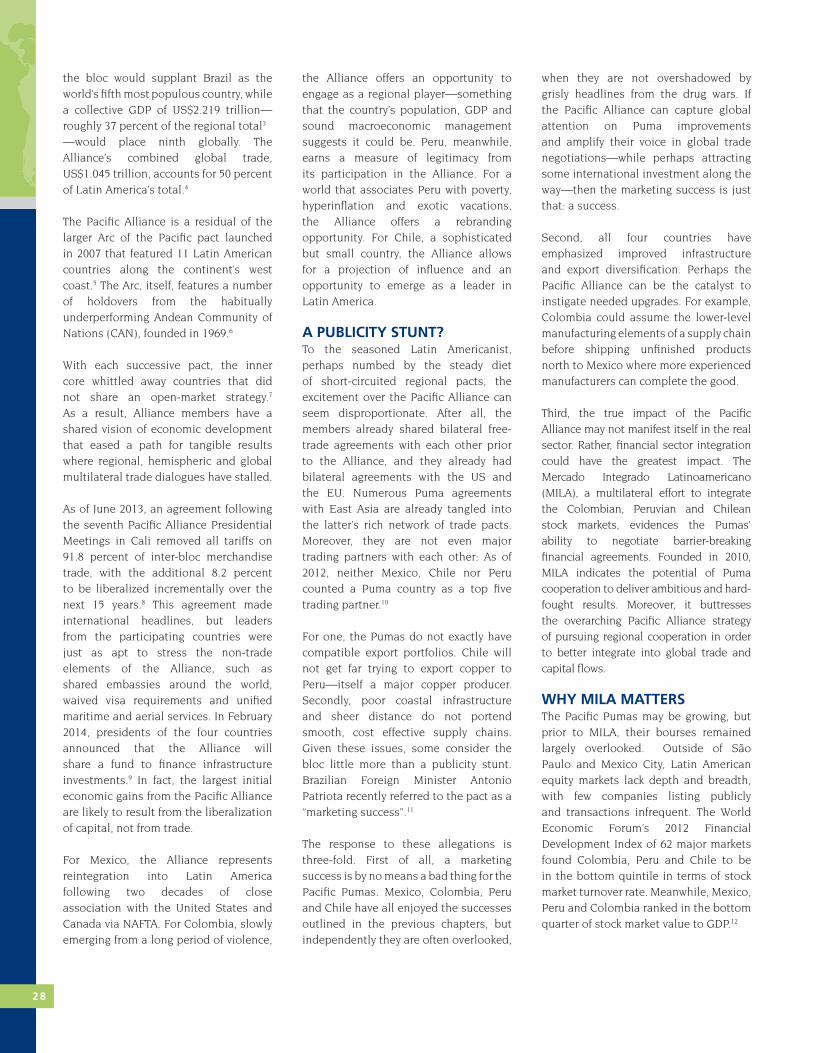
the bloc would supplant Brazil as the
world’s fifth most populous country, while
a collective GDP of US$2.219 trillion—
roughly 37 percent of the regional total3
—would place ninth globally. The
Alliance’s combined global trade,
US$1.045 trillion, accounts for 50 percent
of Latin America’s total.4
The Pacific Alliance is a residual of the
larger Arc of the Pacific pact launched
in 2007 that featured 11 Latin American
countries along the continent’s west
coast.5 The Arc, itself, features a number
of holdovers from the habitually
underperforming Andean Community of
Nations (CAN), founded in 1969.6
With each successive pact, the inner
core whittled away countries that did
not share an open-market strategy.7
As a result, Alliance members have a
shared vision of economic development
that eased a path for tangible results
where regional, hemispheric and global
multilateral trade dialogues have stalled.
As of June 2013, an agreement following
the seventh Pacific Alliance Presidential
Meetings in Cali removed all tariffs on
91.8 percent of inter-bloc merchandise
trade, with the additional 8.2 percent
to be liberalized incrementally over the
next 15 years.8 This agreement made
international headlines, but leaders
from the participating countries were
just as apt to stress the non-trade
elements of the Alliance, such as
shared embassies around the world,
waived visa requirements and unified
maritime and aerial services. In February
2014, presidents of the four countries
announced that the Alliance will
share a fund to finance infrastructure
investments.9 In fact, the largest initial
economic gains from the Pacific Alliance
are likely to result from the liberalization
of capital, not from trade.
For Mexico, the Alliance represents
reintegration into Latin America
following two decades of close
association with the United States and
Canada via NAFTA. For Colombia, slowly
emerging from a long period of violence,
the Alliance offers an opportunity to
engage as a regional player—something
that the country’s population, GDP and
sound macroeconomic management
suggests it could be. Peru, meanwhile,
earns a measure of legitimacy from
its participation in the Alliance. For a
world that associates Peru with poverty,
hyperinflation and exotic vacations,
the Alliance offers a rebranding
opportunity. For Chile, a sophisticated
but small country, the Alliance allows
for a projection of influence and an
opportunity to emerge as a leader in
Latin America.
A PUBLICITY STUNT? To the seasoned Latin Americanist,
perhaps numbed by the steady diet
of short-circuited regional pacts, the
excitement over the Pacific Alliance can
seem disproportionate. After all, the
members already shared bilateral free-
trade agreements with each other prior
to the Alliance, and they already had
bilateral agreements with the US and
the EU. Numerous Puma agreements
with East Asia are already tangled into
the latter’s rich network of trade pacts.
Moreover, they are not even major
trading partners with each other: As of
2012, neither Mexico, Chile nor Peru
counted a Puma country as a top five
trading partner.10
For one, the Pumas do not exactly have
compatible export portfolios. Chile will
not get far trying to export copper to
Peru—itself a major copper producer.
Secondly, poor coastal infrastructure
and sheer distance do not portend
smooth, cost effective supply chains.
Given these issues, some consider the
bloc little more than a publicity stunt.
Brazilian Foreign Minister Antonio
Patriota recently referred to the pact as a
“marketing success”.11
The response to these allegations is
three-fold. First of all, a marketing
success is by no means a bad thing for the
Pacific Pumas. Mexico, Colombia, Peru
and Chile have all enjoyed the successes
outlined in the previous chapters, but
independently they are often overlooked,
when they are not overshadowed by
grisly headlines from the drug wars. If
the Pacific Alliance can capture global
attention on Puma improvements
and amplify their voice in global trade
negotiations—while perhaps attracting
some international investment along the
way—then the marketing success is just
that: a success.
Second, all four countries have
emphasized improved infrastructure
and export diversification. Perhaps the
Pacific Alliance can be the catalyst to
instigate needed upgrades. For example,
Colombia could assume the lower-level
manufacturing elements of a supply chain
before shipping unfinished products
north to Mexico where more experienced
manufacturers can complete the good.
Third, the true impact of the Pacific
Alliance may not manifest itself in the real
sector. Rather, financial sector integration
could have the greatest impact. The
Mercado Integrado Latinoamericano
(MILA), a multilateral effort to integrate
the Colombian, Peruvian and Chilean
stock markets, evidences the Pumas’
ability to negotiate barrier-breaking
financial agreements. Founded in 2010,
MILA indicates the potential of Puma
cooperation to deliver ambitious and hard-
fought results. Moreover, it buttresses
the overarching Pacific Alliance strategy
of pursuing regional cooperation in order
to better integrate into global trade and
capital flows.
WHY MILA MATTERSThe Pacific Pumas may be growing, but
prior to MILA, their bourses remained
largely overlooked. Outside of São
Paulo and Mexico City, Latin American
equity markets lack depth and breadth,
with few companies listing publicly
and transactions infrequent. The World
Economic Forum’s 2012 Financial
Development Index of 62 major markets
found Colombia, Peru and Chile to be
in the bottom quintile in terms of stock
market turnover rate. Meanwhile, Mexico,
Peru and Colombia ranked in the bottom
quarter of stock market value to GDP.12
2 8
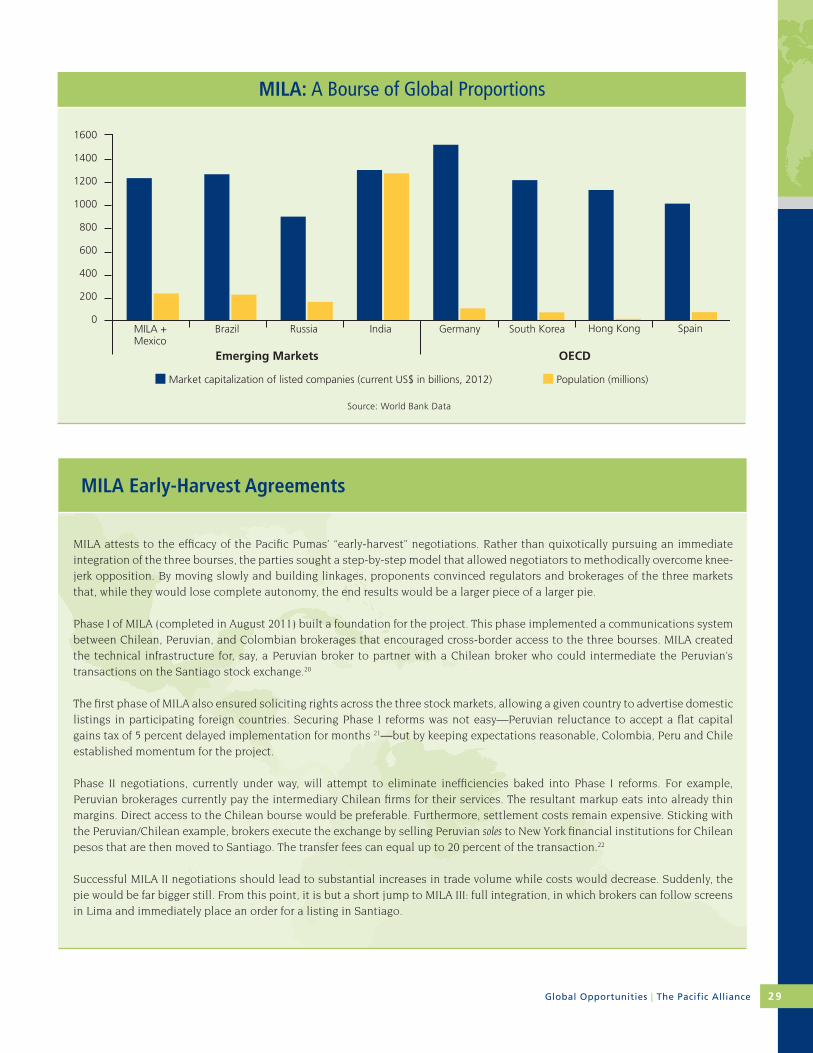
Global Opportunities | The Pacific Alliance
MILA +Mexico
Brazil Russia India Germany South Korea Hong Kong Spain
1600
1400
1200
1000
800
600
400
200
0
Market capitalization of listed companies (current US$ in billions, 2012) Population (millions)
Emerging Markets OECD
Source: World Bank Data
MILA: A Bourse of Global Proportions
MILA Early-Harvest Agreements
MILA attests to the efficacy of the Pacific Pumas’ “early-harvest” negotiations. Rather than quixotically pursuing an immediate
integration of the three bourses, the parties sought a step-by-step model that allowed negotiators to methodically overcome knee-
jerk opposition. By moving slowly and building linkages, proponents convinced regulators and brokerages of the three markets
that, while they would lose complete autonomy, the end results would be a larger piece of a larger pie.
Phase I of MILA (completed in August 2011) built a foundation for the project. This phase implemented a communications system
between Chilean, Peruvian, and Colombian brokerages that encouraged cross-border access to the three bourses. MILA created
the technical infrastructure for, say, a Peruvian broker to partner with a Chilean broker who could intermediate the Peruvian’s
transactions on the Santiago stock exchange.20
The first phase of MILA also ensured soliciting rights across the three stock markets, allowing a given country to advertise domestic
listings in participating foreign countries. Securing Phase I reforms was not easy—Peruvian reluctance to accept a flat capital
gains tax of 5 percent delayed implementation for months 21—but by keeping expectations reasonable, Colombia, Peru and Chile
established momentum for the project.
Phase II negotiations, currently under way, will attempt to eliminate inefficiencies baked into Phase I reforms. For example,
Peruvian brokerages currently pay the intermediary Chilean firms for their services. The resultant markup eats into already thin
margins. Direct access to the Chilean bourse would be preferable. Furthermore, settlement costs remain expensive. Sticking with
the Peruvian/Chilean example, brokers execute the exchange by selling Peruvian soles to New York financial institutions for Chilean
pesos that are then moved to Santiago. The transfer fees can equal up to 20 percent of the transaction.22
Successful MILA II negotiations should lead to substantial increases in trade volume while costs would decrease. Suddenly, the
pie would be far bigger still. From this point, it is but a short jump to MILA III: full integration, in which brokers can follow screens
in Lima and immediately place an order for a listing in Santiago.
2 9
Not only small and illiquid, these
markets can appear one-dimensional:
Chile in retail and services (32 percent of
capitalization),13 Colombia in financials
and energy (78 percent of capitalization)14
and Peru in mining (53 percent of
capitalization15).16 Such specialization
may attract boutique investment, but it
flies under the radar of the global herd
seeking the “next Brazil”.
MILA could change this. Even without
Mexico, MILA’s US$700 billion
capitalization places the bourse second
only to Brazil in terms of market size in
South America. With 544 firms, MILA
offers the largest portfolio in Latin
America.17 The potential integration of
the Mexican bourse in 2014 would render
a market of global relevance.
The Mexican Stock Exchange (Bolsa
Mexicana de Valores or BMV) has openly
revealed its desire to join MILA, signing
a letter of intent to join only months after
MILA’s introduction in 2011. For Mexican
brokers, MILA would provide preferential
access to the Andean listings, even if
the BMV already has the liquidity and
size the other Pumas lack. In September
of 2012, BMV concluded a technical
feasibility study, and proposed an entry
date of mid-2014. If the BMV does join,
a Pacific Puma bourse would rival the
size of Brazil’s major stock exchange,
BOVESPA, with the key caveat that, while
Brazil appears increasingly inclined
towards protectionism, the Pumas have
expressed a commitment to deconstruct
barriers to capital flows.
With this scale come cheaper
transactions, as well as diversified risk—
two factors that encourage an active
market. Increased access should improve
resource allocation, hopefully funneling
investment to worthy firms. Moreover,
whereas Puma markets may have been
individually one-dimensional, combined,
they offer a complementary mix.18 Finally,
MILA’s backers hope international
investors will be tantalized by this new,
large bourse which will stand out in a
way that, say, Lima’s bourse, alone, could
not.19
PUMA CUBS: PART OF A GROWING FAMILYThe Pacific Pumas and the Pacific
Alliance are different entities, as the
positive momentum and opportunity
enjoyed by Mexico, Colombia, Peru and
Chile extends beyond the potential of
the inchoate bloc. Moreover, the Pacific
Alliance has expanded beyond the
original Pumas. Costa Rica is completing
the procedural steps required to join as a
member; Guatemala and Panama could
be next. Twenty-nine other countries,
from China to the US, from Uruguay to
France, have signed on as observers.
The expanding success of the Pacific
Alliance indicates the regional power
accrued by the four Pumas. The bloc
appears to be a magnet for Latin
American countries looking for an
alternative to the Brazilian or ALBA
development models; nine have joined
as members or observers.
Of course, Alliance expansion raises
a host of concerns. Initial success can
largely be ascribed to the small number
of like-minded participants. Fault lines
could emerge if and when other countries
join the fray. Can the Pumas safely
integrate with Panama—a haven for tax
evasion? Can Guatemala and Honduras,
embattled in the war on drugs, agree
to waive visa requirements with Mexico
and Colombia? One fears that expansion
could lead to the stagnation that seems
to have doomed the WTO’s Doha Round.
But one thing is clear: The Pacific
Alliance has established the Pumas as
an important regional voice. The Alliance
has reintroduced Mexico into the mix
of Latin America’s large leaders. It
provides brawn to Chilean brains, and it
consolidates the voices of Colombia and
Peru, even as these countries continue
to consolidate internally. Marketing
success? To a degree. Silly name? To be
sure. But the Pacific Alliance has the
potential to push Latin America towards
Asian Tiger-styled economies, and Asian
Tiger growth.
3 0

The Pacific Pumas are emerging as
leaders and trend setters in Latin
America. United through the Pacific
Alliance, they are large enough, and
have enough gravitational pull, to
attract smaller regional countries into
the fold. Mexico, Colombia, Peru and
Chile have established their model as an
alternative to the more statist ALBA bloc
or the more protectionist MERCOSUR
economic pact.
The Pumas have stressed that their
effort is meant to facilitate regional
integration—not to reinforce continental
divisions. But an emerging consensus
holds that the Pacific Alliance is a
conscious effort to escape from beneath
the looming shadow of Brazil, to promote
regional integration that is more trade
friendly than MERCOSUR, and to counter
any residual ALBA influence.
The Economist has heralded a “continental
divide”, writing, “The region is falling
behind two alternative blocs: the market-
led Pacific Alliance and the more statist
MERCOSUR.”1 The venerable Latin
Americanist Andres Oppenheimer
similarly concluded that “the economic
divide between Latin America’s Pacific
and Atlantic blocs [has become]
increasingly visible.”2 Grumblings from
the 2013 MERCOSUR Social Summit in
Montevideo suggested that elements
of the Atlantic bloc themselves had
succumbed to this interpretation.
To an extent, they are accurate. Puma
policymakers believe that Brazil’s large
population offers an internal growth
motor that is underdeveloped in Mexico
and Colombia, and difficult to fathom
in Peru or Chile.3 Thus, Brazil can
afford (or at least believes it can afford)
protectionist trade policy. Given Brazil’s
weighty influence in MERCOSUR, not
to mention the influence of Argentina
and Venezuela, the Pumas do not
wish to align with an increasingly
defensive bloc.4
But here is the catch: The Pacific Pumas
would greatly benefit from a unified
Latin America, and in many cases,
basic economic theory suggests they
would be perfect partners. In fact, the
Pacific Pumas have tried to deepen
trade relations between the two “sides”.
However, they have directly experienced
the unexpected and often unnecessary
shocks associated with conducting
business with Latin American countries
that do not share their free market, low
tariff, non-interventionist strategy. The
following three examples demonstrate
these risks.
• Chilean Energy InsecurityChile, a net importer of coal, oil and gas
has long faced energy insecurity. In the
US, a negative energy shock may lead to
higher prices at the pump. But in Chile,
when Argentine gas supplies dried up in
September 2011, more than 50 percent
of the nation experienced power outages
that “paralyzed the country’s copper
mines and brought Santiago grinding to
a halt”.5
Chile cannot satisfy spiking natural gas
demand with domestic supply.6 At best,
Magallanes, a gas producing region
in Chile’s deep south, can support 40
percent of Chile’s demand for liquid
petroleum gas, mostly limited to the
south of the country. Former President
Sebastián Piñera’s support for building
five hydroelectric plants in pristine
Patagonia generated more hot air
than gas: Public backlash held Piñera’s
approval rating in the 30s and the project
itself is now four years behind schedule.
Thus when a natural gas bonanza
unfolded in neighboring Bolivia and
Argentina,7 Chile appeared perfectly
positioned to benefit: Bolivia could
supply Chile’s copper-mining north,
while Argentine pipelines would feed the
populous Chilean heartland.
Unfortunately, it never worked out that
way. Santiago has been dogged by the
vicissitudes of Argentine energy policy,
where populism has meant whimsical
rules of the game, meddlesome
macroeconomic policies and disputed
contracts.8 These issues have undermined
Chilean trust in the availability of its
neighbor’s gas exports.9
Meanwhile Chile has been unable to
reach a gas export deal with Bolivia,
where resource protectionism and
hostility towards Santiago have
defined President Evo Morales’ rise,
and he has proven reluctant to tinker
with this strategy.10 Morales has
stubbornly demanded coastal territory
in exchange for a pipeline to Chile,
and La Paz has exhausted diplomatic
capital petitioning territorial redress in
international courts.11
Unable to rely on its neighbors, Chile
has been forced to find expensive,
intercontinental sources of energy.
Santiago invested in expensive liquefied
natural gas infrastructure and it imports
supercooled gas from Trinidad and
Tobago and Equatorial Guinea—a
strategy expected to expand during a
second Bachelet presidency.12
• Colombia & Venezuela: The Politics of Trade
For Colombia, anxious to enlarge a
manufacturing export portfolio, proximity
to Venezuela offers opportunity.
With Venezuelan production geared
Global Opportunities | Latin America Divided?
Latin America Divided?6
3 1

overwhelmingly towards oil, the country
must import just about everything
else. Moreover, certain Colombian and
Venezuelan comparative advantages
appear complementary, a fact not lost on
a Colombia that seeks deeper integration
into regional supply chains. Hydrocarbon
derivatives readily abundant in Venezuela
such as polyethylene and ethylene, can
be converted into plastic goods such as
polystyrenes, tubes, hoses and resins
in Colombia.13
Between 2000 and 2008, Colombian
exports to Venezuela nearly quadrupled
in terms of value. The bulk of these
exports were of manufactured goods:
In both 2007 and 2008, eight of the top
ten Colombian exports to Venezuela
were non-commodities, such as vehicles
and vehicle parts, textiles and clothing
accessories, plastics, machinery and
electrical equipment.14 For the optimist,
this relationship offered proof of
Colombia’s potential beyond commodity
exports, and Bogotá hoped to use it as
a foundation to hone manufacturing
efficiencies for global markets.15
Unfortunately, the inherent risk in
partnering with a boisterously populist
neighbor proved far greater than
the sheer economics would suggest.
Colombian-Venezuelan ties began to
strain in the mid-2000s when Bogotá’s
trade negotiations with the US
precipitated Venezuela’s exit from the
Andean Community of Nations (CAN).
The diplomatic relationship rapidly
deteriorated, lost amid macho posturing
between Colombian President Álvaro
Uribe and Venezuelan President Hugo
Chávez, and it was severed in July of 2009
when the extent of US military presence
in Colombia became public. On a whim,
Chávez moved to replace Colombian
trade with imports from Argentina
and Brazil.
For a man oft-criticized for an inability
to match rhetoric with results, Chávez
made good on this threat. Between
2008 and 2010, bilateral trade fell from
US$7.29 billion to US$1.68 billion,16
and Colombian exports to Venezuela
plummeted from 18 percent to 3.6
percent of total exports.17 The losses hurt
precisely the sectors Colombia hoped
would thrive: Manufacturing exports
tumbled, and Colombia’s total exports
of textiles dropped by more than half.
According to one statistical analysis, the
trade breakdown cost Colombia a full
percent of real GDP growth in 2009.18
The clear message for Colombian
technocrats and businessmen was that,
when doing business with Atlantic-Latin
America, all the work required to put an
economy on a successful track can be
derailed when a stubborn paisa bumps
into a bombastic llanero. Colombia
would be happy to rekindle trade with
Venezuela, and by some accounts,
their commerce has rebounded in the
Santos – Maduro era.19 Nevertheless,
Bogotá views the relationship with less
enthusiasm, and the experience has
influenced Colombia’s desire to pursue
intercontinental ties.20
• Mexican Car Exports and MERCOSUR
Even Mexico, which in 2011 sent more
than 83 percent of its exports north to
the US and Canada,21 has been unable
to avoid the pitfalls of South American
protectionism. The Complementación
Económica No. 55 (ACE No. 55), signed
between Mexico and MERCOSUR in
2002, supposedly ensured free trade in
automobiles among the participants. For
Mexico, the deal offered an opportunity
to leverage existing economies of scale:
Since the advent of NAFTA in 1994, Mexico
had attracted international automobile
Mexico: 4 (53)
Nicaragua: 8 (124)
Colombia: 3 (43)
Ecuador: 10 (135)
Peru: 2 (42)
Bolivia: 11 (162)
Chile: 1 (34)
Argentina: 9 (126)
Uruguay: 5 (88)
Paraguay: 6 (109)
Venezula: 12 (181)
Cuba: n/a
Brazil: 7 (116)
Pacific Pumas
Mercosur
ALBA
World Bank’s 2014 Ease of Doing Business Rankings: Latin America (World)
Pacific Latin America has emerged as more business friendly
Source: World Bank
3 2

firms,22 lured by an opportunity to export
cheaply north across the Rio Grande.
ACE No. 55 opened South American
markets to Mexican exports just as Brazil’s
expanding middle class portended a
boom in automobile demand. Mexico
initially specialized in exporting larger
vehicles to Brazil, while Brazil exported
smaller ones to Mexico.23 However, as
footloose capital and strong commodity
prices led to appreciation of the Brazilian
real, Mexican exporters established the
upper hand: Their cars sold for a fraction
of the price of similar, or in some cases,
the same, models made in Brazil.24 Just
between 2009 and 2011, Mexican unit
exports to Brazil increased by 152 percent,
generating US$2.1 billion revenue and a
US$696 million bilateral trade surplus.25
For Mexico, these auto exports
represented reintegration into South
American trade. Mexico’s bleak
experience in 2008 and 2009, sucked into
the Great Recession by the United States,
laid bare the vulnerability of relying too
heavily on one major trade partner.26
Success with Brazil affirmed beliefs that
Mexico could be a hub for manufactured
goods sold south, just as it is a hub for
goods exported north. For Mexico, the
relationship represented the future the
Pumas are building towards.
Until it didn’t. In September 2011,
Brazil responded to its increasingly
uncompetitive auto industry by slapping
a 30 percent import charge on motor
vehicles and parts. ACE No. 55 should
have protected Mexican vehicles
from facing this tariff, but by February
2012, President Dilma Rousseff’s
administration moved to “restructure”
the trade agreement. In order to save any
semblance of the deal, Mexico accepted
a quota system that would limit auto
exports to Brazil to US$1.45 billion in the
first year, and US$1.56 and US$1.64 billion
in the next two years. Furthermore, rules
of regional content were slated to jump
from 30 to 40 percent within five years.27
Both measures stung. The quota resulted
in a 26 percent revenue reduction, and
Mexican light vehicle exports to Brazil
dropped 72 percent in February 2013.
With Argentina imposing comparable
restrictions, Mexican auto exports to
Latin America declined 50 percent in
early 2013.28 The domestic content
rule challenged what Mexico viewed
as seamless integration into the
international automobile parts supply
chain—precisely the style of integration
the Pumas have actively sought.
A PUMA MUST ROAMThe insinuation that Pacific and Atlantic
Latin America have split into two hostile
camps is not exactly accurate. Rather, the
Pacific Pumas have directly experienced
the unexpected and often unnecessary
shocks associated with conducting
business with Latin American countries
that do not share their free market
strategy. They have apparently learned
their lesson, and they will avoid lurking
puma traps.
It is much less painful to hang out with
the Asian Tigers.
Global Opportunities | Latin America Divided?
Mexico Colombia Peru Chile Venezuela Argentina Brazil Puma ALBA MERCOSUR
AveragesMajor LATAM Economies
16
14
12
10
8
6
4
2
0
Perc
ent
Average Applied Tariffs in 2012
Source: Inter-American Development Bank, German Institute of Global and Area Studies (Unweighted Averages)
3 3

The United States and Europe have forged
a remarkably successful alliance over the
last seventy years. The trans-Atlantic
partners have helped power global
growth and innovation while developing
increasingly inclusive democracies.
Together, the US and EU still account
for over 48 percent of global GDP. They
continue to buttress the international
system, acting as major funders and
stakeholders of the United Nations,
the World Bank and the International
Monetary Fund.1
Alone, however, the US and EU will
struggle to match the success of the last
seven decades in the next seven decades.
Following the Great Recession of 2008
and the Euro crisis of 2010, trans-Atlantic
growth has sputtered, and emerging
markets have assumed an increasingly
important role in keeping the global
economy afloat. A US and EU economic
rebound is perhaps contingent upon
linking into emerging-market growth.
Thankfully, between the trans-Atlantic’s
advanced technology and sophisticated
service sectors, they have the comparative
advantages to do so.
Yet if global economic balances are
shifting, the identity of new players
remains unclear. The BRICs, for example,
offer four distinct development paths,
none of which are particularly conducive
to trans-Atlantic political and economic
preferences. In this light, Mexico,
Colombia, Peru and Chile are valuable
strategic partners.
The Pacific Pumas represent an emerging-
market bloc committed to economic and
democratic policies in-line with those of
the US and the EU. If the Pacific Alliance
can continue to expand in Latin America,
then much of the Western Hemisphere
will be aligned with the trans-Atlantic
model. For the US, the Pumas represent
a potential partner in the Americas: the
five countries account for more than half
of the hemisphere’s population, and
upwards of 75 percent of its GDP.2 For the
EU, the Pumas represent access to high
growth, investor-friendly (and Europe-
friendly) markets, with a window to East
Asia to boot.
Together, the US, EU and Pacific Pumas
can set the foundation for an enlarged
trans-Atlantic bloc prepared to negotiate
the opportunities and challenges of a
Pacific century.
THE FUTURE OF AMERICAN LEADERSHIPOn November 19, 2013, US Secretary
of State John Kerry addressed a private
audience at the Organization of American
States’ Hall of Flags and Heroes, where
he underscored the end of the Monroe
Doctrine and a future of Pan-American
collaboration as equals. Though his
words were warmly received, Secretary
Kerry did not specify just who he expected
to emerge as the US’s key partner in
the region.
The US has vacillated between cautious
optimism, ambivalence and weariness
regarding the rise of Brazil.3 Other
large Latin American countries such as
Venezuela or Argentina seem unlikely
to actively cooperate with the US in the
near term. Puma cubs such as Uruguay
or Costa Rica are simply too small to act
as equal partners with the US, fraternal
rhetoric notwithstanding.
It is the Pacific Pumas, both independently
and collectively as the Pacific Alliance,
that stand to develop as the US’s strategic
partners in the region. Whether by design
or happenstance, the Pumas are pursuing
precisely the open market, private sector-
led, democratically governed development
model Washington is anxious to entrench
as the global standard. That the Pumas are
adopting this model without heavy-handed
prodding from the US is all the better, at
least from Washington’s perspective.
For US policymakers, the question
becomes how to facilitate this
momentum without poisoning the well.
Former Brazilian President Lula da Silva
has already criticized the Pacific Alliance
as a rehashing of the Washington
Consensus—still a politically toxic term
in the region.4 If ALBA or MERCOSUR
countries—not to mention opposition
figures within the Pumas—can paint
the Alliance’s free-trade, pro-business
policies as lackeyed deference to the US,
any momentum could be derailed.
Cognizant of this, Washington has sought
to subtly support the Pumas while
maintaining a light footprint. In July 2013,
the US joined the Pacific Alliance as an
observer. Though the US may eventually
become a member, for now the Obama
Administration appears content with
letting the Alliance mature under its own
auspices. Outside of the spotlight, the
US has assisted Puma integration, with
the Treasury Department chipping in
technical support on the combined stock
market of MILA.
The US remains a fundamentally
important trade partner for the Pumas.
Since 2002 Mexico has sent an annual
average of 82 percent of its exports to
the US, while more than 50 percent of
Mexican imports routinely arrive from
its northern neighbor. Colombia shipped
an annual average of 38.56 percent of
its exports to the US between 2010 and
2012; no other country has received an
average of more than five percent of
Colombian exports.5 China surpassed the
A Trans-Atlantic Triangle: The US, Europe and the Pacific Pumas
7
3 4

US to become Chile’s top trading partner
in 2008, and Peru’s top trading partner in
2011, but the US remains a close second
for both countries.
Generally speaking, the US exports
machinery, fuel, vehicles and agricultural
goods in exchange for Puma commodities,
both agricultural and mineral. Mexico
stands as a key exception to this trend:
Four of its five largest export categories
to the US in 2012 were manufactured
goods (electrical machinery, vehicles,
machinery, and optic and medical
instruments).6 This US demand is a major
reason manufactured goods accounted
for more than 70 percent of Mexican
exports in 2012.
The Pacific Pumas and the US have used
bilateral and multilateral agreements
to facilitate their trade, a process that
began with NAFTA in 1994 (discussed in
Chapter 4 of this report). Eric Farnsworth,
Vice-President of the Council of the
Americas, argues that by linking these
preexisting agreements with the Pacific
Alliance agreements, the participants can
reinvigorate the stalled Free Trade Area
of the Americas,7 only this time limiting
participation to what Peterson Institute
economist Barbara Kotschwar calls “the
coalition of the willing”.8
Washington has also invited Puma
representatives to help set standards
for the future rounds of global trade
dialogues. Three of the Pumas are
active participants in the US-led TPP
negotiations. Washington may maintain
a low-profile in the Pacific Alliance—for
example the US did not send a delegation
to the group’s 7th Summit in February of
2014—but this should not be interpreted
as disinterest. The US is encouraged
by the Alliance’s progress, and does
not want to emerge as a distraction.
Rather, as a friendly bloc in the Western
Hemisphere, the United States hopes to
feature the Pacific Alliance as part of its
vaunted pivot to the Pacific.
EUROPE AND THE PUMAS: OLD FRIENDS WITH NEW BENEFITSThe Pacific Pumas have also captured
Europe’s attention: Deutsche Bank
described the four countries as “Latin
America’s new stars”,9 while European
Council President Herman van Rompuy
referred to the Pacific Alliance as “a very
promising initiative…that will allow us
to team up at the multilateral level to
promote our common vision on trade and
economic cooperation”.10 The German
Business Association of Latin America
dedicated its entire Latin America Day
conference to the Alliance in 2013.
France, Germany, Italy, Portugal, Spain,
Switzerland and the United Kingdom
have all joined the Pacific Alliance as
observers, and the Pumas already have
bilateral FTAs with the EU (all while
an EU-MERCOSUR trade agreement
appears increasingly unlikely).
The allure of the Pumas is clear: For
the eurozone to overcome its malaise,
it must exploit the existing economic
infrastructure connecting the old world to
emerging markets. The EU is particularly
suited to link into Latin American
growth. Despite a turbulent history, the
longstanding ties and cultural similarities
between the two are currently assets to
the relationship. European foreign direct
investment, for example, can appear
less jarring than Chinese or even US
direct investment.
A closer look at trade and investment
patterns reveals that new opportunities
are on the horizon for Puma –
EU relations.
• EU-Puma Trade:While EU bilateral trade with Mexico,
Colombia, Peru and Chile may be
underwhelming, together, the Pumas are
the EU’s eighth largest trading partner.
EU - Puma commerce outpaces trade
between the EU and Brazil, as well as
the EU and India.11 Meanwhile, the EU is
the Pumas’ third largest trading partner
(behind only the US and China), the
second largest importer of Puma goods,
and the third largest exporter to the four
Latin American countries.12
Puma trade with the EU typically
follows a pattern of commodities-for-
manufactured goods. In 2012, over three
quarters of EU exports to the Pumas were
of manufactured goods and machinery,
while over three quarters of Peruvian and
Colombian exports to the EU consisted of
crude materials, minerals and animals.13
Chile and Mexico have had more success
exporting manufactured goods to Europe,
though copper typically accounts for 55
percent of Chilean exports to the region.14
Much like Puma trade with East Asia,
the relationship with the EU is both
advantageous, because the two regions
have generally compatible spheres of
comparative advantage, and threatening,
as it further entrenches the Pumas in
commodity production. Unlike with East
Asia, however, European manufacturing
exports tend to be higher-end, and
thus often do not directly compete with
Puma products.
• EU- Puma InvestmentThe European Union is already the
largest foreign direct investor in Latin
America. While the bulk of this financing
flows to the mining and hydrocarbon
sectors, EU firms account for a large
share of regional manufacturing and
development investing as well.
Between German electronics, French
chemicals, Spanish finance and
Italian telecommunications, EU firms
pursue a varied portfolio of ventures
in Latin America that fit Pumas’ goals
of diversification.15
EU firms have also demonstrated a
willingness to invest in “greenfield”
manufacturing projects, as opposed to
simply purchasing existing operations.
Between 2003 and 2007, roughly 45
percent of new manufacturing FDI in
Latin America came from the EU, up
from 34 percent between 2003 through
2006. By comparison, Asia’s share held at
roughly 20 percent from 2003 to 2011.16
Global Opportunities | A Trans-Atlantic Triangle 3 5

Moving forward, the Pacific Pumas
will become increasingly attractive
investment destinations for European
firms. Mexico, Colombia, Peru and
Chile can generate a rate of return
difficult to realize in Europe, and they
offer protection of investment not
easily attained in many other emerging
markets: EU members have already been
stung by populist appropriations in non-
Puma Latin America, most recently in
Argentina and Bolivia.17
Finally, EU investors have demonstrated
a clear preference for integrated Latin
American countries (MERCOSUR and
NAFTA countries received about 90
percent of regional EU FDI between
2006 and 201018), as foreign firms seek
to establish export-efficient bases
within the region. The Lateinamerika
Verein, a network of German businesses
active in Latin America, has already
observed increased German appetite
for investment in Puma countries given
the subsequent ease of exporting within
the Alliance.19
A TRANS-ATLANTIC TRIANGLEAn enlarged trans-Atlantic relationship
should benefit all sides. For the US, the
Pumas could become reliable allies in
hemispheric leadership. For the EU,
the Pumas represent an economically
growing, politically stable region with
close ties to Europe. For the Pumas, ties
to the EU and US offer access to influence
and capital.
The EU and US can indicate their interest
in incorporating the Pacific Pumas by
addressing Puma apprehension over
TTIP. The Pumas are not privy to TTIP
negotiations, but the pact could affect
the four Latin American countries,
especially Mexico.
A Bertelsmann Stiftung and IFO Institute
study forecasts that a comprehensive
TTIP agreement could result in a decline
of Latin American exports to both trans-
Atlantic partners. Mexico, a country
which relies on trade with the US,
could see their exports to the US shrink
by 16.04 percent. All told, the study
concludes that TTIP could cost Mexico,
Colombia, Peru and Chile 7.2, 2.6, 2.2 and
5.6 percent of per capita gross national
income respectively.20
The EU and US are reluctant to expand
TTIP negotiations. Closing an FTA
between 29 different counties is already
rather complicated, and any expansion
in the Western Hemisphere could imply
expansion on the European side. Turkey,
for example, shares Mexico’s concern
over not being at the table.
Nevertheless, the traditional trans-
Atlantic partners can take steps to avoid
alienating the Pacific Pumas. Given that
tariffs are already low between the EU
and US, the importance of TTIP lies in
harmonizing regulations. The EU and US
can seek bilateral modifications in their
pacts with Mexico, Colombia, Peru and
Chile to ensure that their agreements
are up to date and in-line with TTIP
standards. Meanwhile, if the Pumas can
successfully align the standards of the
Pacific Alliance with TTIP, this could help
prepare Mexico, Colombia, Peru and
Chile to act as partners and participants
in 21st century trans-Atlantic leadership.
Chile Colombia Mexico Peru
US$
(B
illio
ns)
, Cu
rren
t Pr
ices
2005 2007 2009 20112003 2006 2008 2010 201220040
5
10
15
20
25
30
35
Foreign Direct Investment, Net Inflow
Source: World Bank Data
The Pumas have become increasingly attractive recipients of Foreign Direct Investment. European investors may join this trend.
3 6

Global Opportunities | A Trans-Atlantic Triangle 3 7

-5.6
-3.8
-1.3-0.2
-2.2
-5.9 0.7-0.4
-0.4-0.6
-0.3-0.8
-0.8
-0.5-2.0
-1.2
-3.2
-4.1-0.6
-4.0
-1.5
-2.2
-1.5
-2.6
-2.6-2.6-2.6
-2.8
-3.0
-4.0
-3.5
-2.7-2.8
-3.9
-3.9 6.2
6.65.0
2.6
4.7 3.75.1
5.1-2.9
-3.5-2.7
4.84.6
4.9
4.4
5.45.7
6.9
9.7
7.3
-2.8
-3.3
-2.5
-1.1
-2.2-0.7-1.3
-3.1-7.4
-1.8
-1.6
-1.7
-2.1-2.2
-2.6
-2.7-3.2
-4.7-3.4
-4.2
-4.4
-7.2
-9.5
13.4
-1.7
-1.6
-0.5
-2.1
Long-term Forecast Change in Real Income per Capita Under Deep-Seated TTIP Agreement (Percent)
Source: Ifo Institute, Bertelsmann Siftung3 8

-5.6
-3.8
-1.3-0.2
-2.2
-5.9 0.7-0.4
-0.4-0.6
-0.3-0.8
-0.8
-0.5-2.0
-1.2
-3.2
-4.1-0.6
-4.0
-1.5
-2.2
-1.5
-2.6
-2.6-2.6-2.6
-2.8
-3.0
-4.0
-3.5
-2.7-2.8
-3.9
-3.9 6.2
6.65.0
2.6
4.7 3.75.1
5.1-2.9
-3.5-2.7
4.84.6
4.9
4.4
5.45.7
6.9
9.7
7.3
-2.8
-3.3
-2.5
-1.1
-2.2-0.7-1.3
-3.1-7.4
-1.8
-1.6
-1.7
-2.1-2.2
-2.6
-2.7-3.2
-4.7-3.4
-4.2
-4.4
-7.2
-9.5
13.4
-1.7
-1.6
-0.5
-2.1
Europe and the US must be careful to not alienate regional trade partners, such as the Pumas,
who are not privy to TTIP negotiations.
Global Opportunities | A Trans-Atlantic Triangle 3 9

For the Pacific Pumas, China represents
both an opportunity and a threat.
Chinese commodity demand sparks
growth and fills central bank coffers in
South America, but it also threatens
to stymie export diversification.
Any Chinese slowdown could burst
commodity prices, thus exposing a Puma
vulnerability. Investment from the East
offers opportunity at a time when OECD
capital can seem scarce. But what strings
come attached with Chinese FDI, and
which sectors will be favored?
Meanwhile, Chinese manufactured
goods offer consumption opportunities
for the Pumas’ newfound middle classes,
but local producers may struggle to
compete on their own home turf. That
said, if the Pumas could leverage their
own manufacturing, China represents a
massive market embedded in the Pacific’s
intertwined trade routes. In short, the
Pumas’ ability to take advantage of their
current opportunity may hinge upon
their success in harnessing the power of
the Dragon.
CHINA IN LATIN AMERICAChina has two prominent goals in Latin
America: resource security and market
expansion. The Pacific Pumas pique
China’s interest on both accounts. From
oil to zinc to copper, the Pumas are richly
endowed in the commodities China
needs to build 21st century super-cities.
This Chinese demand has bid up the
price of commodities that pushed Puma
growth, birthing a new middle class
which could, in turn, afford to purchase
manufactured goods from China.
Since the turn of the century, the
relationship has unfolded in two major
phases. The first, from 2000 to 2007,
featured explosive trade growth. The
second phase, beginning roughly in 2007,
centers on increased Chinese foreign
direct investment (FDI) throughout the
region. The dynamics of each phase are
considered in turn:
• TradeChina’s ascension to the WTO in 2001
sparked a trade renaissance. While
much of the world feared an onslaught
of cheap manufactured goods, for South
America the emergence of the Dragon
has had spectacular short-term benefits.
China faces a resource dearth: outside of
people and coal, it must import nearly all
its resource inputs, inputs that exist in
abundance in Latin America. Overall, in
the first decade of 2000s, trade between
the People’s Republic of China and Latin
America ballooned from US$10 billion to
US$180.2 billion.1 Chinese GDP growth
averaged 11.42 percent from 2005 to
2009, and during those years, Chinese
imports from Latin America increased by
an annual average of 22.8 percent.2
This trade is at once both balanced and
skewed. In South America, Chinese
imports have closely tracked exports,
with years of meager South American
surpluses following a few years of minor
Chinese surpluses (Mexico and Central
America, on the other hand, trade at a
notable deficit with China). Nevertheless,
the trade portfolios are profoundly
lopsided. In 2009, manufactured goods
accounted for 99.2 percent of Latin
American imports from China.3 That
same year, agricultural and mining goods
comprised 83 percent of Latin American
exports to China.4
• Foreign Direct InvestmentForeign Direct Investment represents
a second thrust of Chinese economic
activity in Latin America. Chinese FDI
has moved from around 2.3 percent of
GDP in 2000 to around 5.5 percent of
GDP today—representing tens of billions
of dollars in increases.5 Between 2000
and 2011, China directed just over 11
percent of these funds towards Latin
America, making the region the second
largest recipient of Chinese FDI behind
Hong Kong.6
As with trade, Chinese FDI represents
both an opportunity and a challenge for
the Pacific Pumas. All four Pumas suffer
an infrastructure deficit—Colombia and
Peru acutely so. China has demonstrated
a willingness to invest in infrastructure
upgrades. However, 90 percent of Chinese
FDI in Latin America is geared towards
exploiting and exporting raw materials,7
threatening to further plant the Pumas
in the resource-reliance rut that they are
fighting their way out of.
THE PUMA AND THE DRAGONWhile the Pacific Alliance bloc may help
the Pumas interface with the East, the
opportunities and challenges are distinct
for Mexico, Colombia, Peru and Chile. As
a result, each Puma’s relationship with
China is best reviewed individually.
CHILE AND CHINA: A MODEL FOR THE PUMAS? Chile is the world’s largest producer
of copper. China is the world’s leading
copper importer and consumer. It stands
to reason that sparks would fly between
them.
In 2001, the year China joined the WTO,
Chilean exports to the Dragon stood
at US$1.30 billion; a mere 32 percent
of Chilean exports to the US. By 2006,
Chilean exports to China had more than
quadrupled. Five years later, in 2011,
China had emerged as Chile’s number
one trading partner, importing US$20.58
billion worth of goods—more than 16
times the 2001 figure.
Harnessing the Dragon8
4 0

Commodities compose the bulk of these
exports: In 2010, 67 percent of Chilean
exports to China were of copper related
materials alone. Chile’s dual challenges
in terms of harnessing the Dragon are,
on the one hand, diversifying its export
portfolio while, on the other, ensuring
against the price vulnerability inherent
in having one major consumer for one
particular product.
Chile, the most developed Puma,
appears to command a high level of
respect from China. For example, in
February 2013, the state-controlled China
Minmetals Corporation acquiesced to
Chilean requests to restructure a 15-
year copper deal.8 That contract, based
on 2006 copper spot prices of US$1.50
a pound, clearly favored China as then-
current prices hovered between US$3
and US$4 per pound. In contrast to the
hard line Chinese firms have at times
taken elsewhere, Minmetals agreed to
restructure the contract to bring it closer
in line with market values.9
Meanwhile, Chile has used trade
negotiations with China to attract
attention beyond traditional exports.
The 2005 FTA dialogues highlighted non-
trade issues, such as labor cooperation,
security and environmental standards.
A subsequent 2008 service-sector
supplement to the FTA represented
the first of its kind between China and
Latin America, with Chilean engineers,
architects and lawyers participating in
drafting the pact.10
Both in terms of commodity deals and
portfolio expansion, China appears
willing to work with Chile as a partner.
In this sense, the relationship can be a
model for the other Pumas.
PERU AND CHINA:HARNESSING FOREIGN DIRECT INVESTMENT Peru, Latin America’s leading producer of
gold, lead, silver tellurium, tin, and zinc,11
has emerged as a prominent destination
for Chinese mining FDI, receiving US$5
billion in investments between 2003 and
2011. The Andean country is now the
second biggest Latin American recipient
of Chinese mining FDI, and the fourth
biggest globally.12
The relationship has been tumultuous,
marked by high profit margins and
production as well as frequent labor
stoppages and allegations of safety and
environmental negligence. It is also
expected to expand. Peruvian Finance
Minister Miguel Castilla forecasts
that Chinese investment could grow
exponentially in the next few years,
hitting upwards of US$20 billion
by 2018.13
Lima can neither afford to discourage
this investment nor to let Chinese
mining firms run roughshod over
domestic regulations. Harnessing
Chinese investment will thus be crucial
to Peruvian emergence.
The Hierro Peru iron mine, purchased
by the state-owned Shougang Group
in 1992, stands as China’s seminal
investment in the country.14 Having now
celebrated its 21st anniversary, Shougang
Hierro Peru has proven both profitable
and controversial. Ranked the No. 1
business in Latin America in 2010 by
the Latin Business Chronicle, the iron ore
giant grew 123.9 percent in 2010, while
Global Opportunities | Harnessing the Dragon
2000 2001 2002 2003 2004 2005 2006 2007 2008 2009 2010 2011
35
30
25
20
15
10
5
0
70
60
50
40
30
20
10
0
Exports Imports GDP
Ch
ilean
-Ch
ines
e Tr
ade,
Bill
ion
s U
S$
Ch
ilean
GD
P Pe
rcen
t G
row
th In
dex
, 20
00 =
0 (
Co
nst
ant
Pric
es)
Increased Chilean Trade with China, Increased Chilean Growth
Source: International Monetary Fund, Bertelsmann Stiftung
4 1

profits reached US$700 million—a 456.1
percent increase over the 2009 value.15
However, the firm has been plagued by
labor disputes and accusations of abuse
related to pay and health conditions.16
Labor strikes occurred intermittently
in the early 2000s, and annually
since 2008, with clashes occasionally
turning violent.17
So what is Peru to do? It must consolidate,
clarify and strengthen its regulatory
approach with Chinese state-owned
enterprises. Lima can and must assume a
more assertive role in negotiating terms
and expectations with Chinese investors.
Shougang’s environmental violations
may have as much to do with lax oversight
as with Chinese malfeasance, and the
company’s use of lightly regulated, low-
wage subcontractors to skirt minimum
wage regulations reflects loopholes in
Peruvian law as much as anything else.18
As Peru matures, the nature of Chinese
investment may be improving. In 2008,
Chinalco, the state-owned aluminum
corporation of China, purchased the
Peruvian Toromocho mine for US$2.2
billion. Rather than importing Chinese
labor, Chinalco has hired locally. It has
also implemented community outreach
programs, and worked with third-party
advisors to establish an environmental
management system. The Toromocho
mine is subject to revised environmental
standards, and Chinalco is investing
upwards of US$5 billion in project
infrastructure up front.19
Nevertheless, controversy remains
likely as Chinalco must “relocate” 5,000
people living on the site of the mine. This
delicate process has already engendered
blowback. How this relocation is handled
may well indicate Peru’s progress in
harnessing Chinese investment.
MEXICO AND CHINA: A HEALTHY COMPETITION Mexico’s relationship with China is
uniquely competitive among the Pumas.
Since the creation of the maquiladora
sector south of the Rio Grande in the
1960s, Mexico has geared its economy
towards cheap, manufactured goods,
exported predominantly to the United
States. Therefore Mexico viewed China’s
2001 ascension to the WTO with alarm.
The Chinese threat was twofold: On the
one hand cheap Chinese manufactured
goods could siphon US market share
away from the maquiladoras. On the other
hand, Chinese manufactures could
swamp the Mexican domestic market.
Statistics corroborated Mexico’s
concerns. China, which competes directly
with Mexico on twelve of the latter’s 20
main export-sectors to the US, surpassed
Mexico in 2003 to become the number
two exporter to the US behind Canada.20
By 2007, Chinese exports to the US
surpassed Mexico’s by almost 60 percent.
In terms of competition for the Mexican
market, what was a US$2.39 billion
Mexican trade deficit to China in 2000
ballooned to US$38.72 billion deficit
by 2010.21
However, in a comeback that highlights
the potential of the Pumas, Mexico has
rapidly regained its competitiveness,
especially in terms of exports to the US.
In 2005, Mexican manufacturing exports
had dipped to 11 percent of US imports.
By 2012 that number had increased to
14.4 percent, surpassing previous highs.22
Increased efficiency, a web of trade
agreements and the elimination of many
non-tariff trade barriers have factored
in this reemergence. Increased Chinese
wages, compared with generally stagnant
Mexican wages, have also played a role.23
While a maquiladora worker in Juarez may
balk at the notion that her country is
more competitive because her wage has
flatlined, demographics suggest that
Mexican labor will remain abundant
and cheap, at least through the next
two decades.
Having successfully fended off (or at
least survived) competition at the nadir
of Chinese wages, Mexico may now
view China as an opportunity for market
Export Import
US$ (Current Prices)
$ 158.21 bn
$ 142.91 bn
$ 274.13 bn
$ 165.27 bn
$ 137.45 bnexported from Mexico
to United States
$ 2.88 bnexported from China
to Mexico
$ 0.49 bnexported from Mexico
to China
$ 107.61 bnexported from China
to United States
$ 67
0.56
bn
$ 99
2.49
bn
China
Mexico
2000
United States
$ 205.63 bn
$ 381.86 bn
$ 729.97 bn
$ 201.32 bn
$ 172.48 bnexported from Mexico
to United States
$ 17.70 bnexported from China
to Mexico
$ 2.23 bnexported from Mexico
to China
$ 259.83 bnexported from China
to United States
$ 74
3.00
bn
China
Mexico
2005
United States
$ 13
66 b
n
$ 340.01 bn $ 320.20 bn
$ 259.71 bnexported from Mexico
to United States
$ 52.25 bnexported from China
to Mexico
$ 9.38 bnexported from Mexico
to China
$ 417.30 bnexported from China
to United States
China
Mexico2011
United States
$ 1021 bn
$ 1497 bn
$ 10
98 b
n
$ 17
62 b
n
13.8%
86.9%
1.7%
39.3%
1.0%0.3%
10.8%
0.3%
12.6%
83.9%
8.8%
35.6%
2.4%0.6%
19.0%
1.1%
14.7%
76.4%
16.3%
27.9%
3.5%0.9%
23.7%
2.8%
Trade Flows: Mexico, China and the US
Trade flows from 2000, 2005 and 2011 demonstrate that China has both captured an increasing percentage of the US market, while also opening a sizeable trade surplus with Mexico.
Source: Bertelsmann Stiftung Global Economic Dynamics Visualizer, UN Comtrade
4 2
expansion, and not just as a threat.
Whether Mexican automobiles can
penetrate the Chinese market remains
to be seen, but some firms are willing to
pay to find out. Fiat is already shipping
Mexican Fiat 500s to China, and Audi is
considering a similar strategy.24
Moreover, as Chinese consumption
expands, demand increases for luxury
goods—especially those perceived
as popular in the West. For Mexico,
exports that fit this bill include high-
end tequila, mescal, pork and even
wine. These operations are generally
small to mid-sized enterprises owned
by Mexicans, as opposed to the
multinational manufacturers. With time
and experience, Mexican exporters may
begin to penetrate China, thus opening
a new avenue for growth and diversifying
away from the US.
COLOMBIA AND CHINA: WHAT MIGHT BEColombia is an Andean outlier with
regards to China. With commodities
making up more than 60 percent of the
country’s global exports, Colombia would
seem destined to link into the same
Chinese-Latin American trade flows that
have sparked continental growth.
Yet it has not. Colombia remains far more
tethered to the US than to China. As of
2011, roughly 40 percent of Colombian
exports went to the US, while only three
percent shipped west to China.25 In terms
of commodities, the numbers are even
more skewed. In 2010 the US received
47.2 percent of Colombian commodities,
while China imported 5.2 percent, only
slightly more than what Colombia sent
to Switzerland.
At the moment, Colombia does not
have the infrastructure required to
compete with its commodity-producing
neighbors in order to export to China.
Buenaventura, Colombia’s largest Pacific
Port, lacks the capacity to process heavy
trade. Its draft is not deep enough for
large vessels, the town itself is too small,
and the linkages to Cali (the nearest big
city) are underdeveloped. It is actually
more cost-efficient to take the longer
Caribbean route and pay passage through
the Panama Canal.
Chinese investment in Colombia has
also run comparatively low: Of the US$15
billion that China invested in Latin
America in 2010, only US$6.2 million
landed in Colombia.26 China plays an
emerging role in Colombia’s extractive
industries, notably in hydrocarbons,
but ambitious infrastructure projects,
announced to great fanfare, have
amounted to little. Chinese investors
have been unable to build the 120
kilometer road connecting Buenaventura
to Bugo, let alone the vaunted “land
canal” that would cut through Colombia.
Nevertheless, Colombia’s underwhelming
economic ties with China may actually be
a reason for optimism. Puma skeptics are
quick to posit that 21st century growth
stems from Chinese demand, and thus,
is vulnerable to a Chinese slowdown.
Colombia has increased exports and
growth without Chinese demand. The
country has averaged 4.67 percent growth
over the last decade—one wonders
what that figure might have been had it
enjoyed deeper trade ties with China.27
If anything, Colombia’s march towards
internal peace will allow for infrastructure
upgrades that, in turn, will allow for
increased trade with China, thus building
on already strong growth figures.
AN OCEAN OF OPPORTUNITY While each Puma faces different
challenges regarding China, each has
developed knowledge and experience
useful to the others. Chile has quietly
engaged China almost as a partner—a
rarity for an emerging market. Mexico
has proven that the Pumas can compete
with the Dragon. Peru has forged a path
towards both encouraging and regulating
Chinese investment. Colombia, which
hopes to increase trade with and
investment from China, can learn
much from the Chilean, Mexican and
Peruvian experiences.
The Pumas should not discourage or
fear China, and the Pacific Alliance’s
overtures to Asia suggest that they have
no intention of doing either. Rather, by
harnessing the Dragon and leveraging
China’s need for resources, expect the
Pumas to channel the relationship
towards the opportunities, and away
from the threats.
Global Opportunities | Harnessing the Dragon 4 3

III. Prepared to Pounce?
4 4
Mexico, Colombia, Peru and Chile have made noteworthy macroeconomic and democratic advancements in the 21st century. They
have created a solid foundation for development precisely as the greater Pacific stands to emerge as a focal point of global growth.
That the four countries have shared this “awakening” gives them the opportunity to join forces, exponentially increasing the group’s
global impact and potential.
Yet persistent shortcomings could still derail this progress. Systemic corruption, violence, commodity reliance, and inequality are
not exactly new phenomena for the four countries. Will the Pacific Pumas finally be able to exorcise these demons? Or are the trends
outlined in this document simply symptomatic of a boom period, anticipating an eventual bust—a cycle so familiar in Latin America?
The answer remains to be seen, but one thing is clear: The Pacific Pumas have an opportunity.
They have an opportunity to entrench stable macroeconomic systems; to pursue levelheaded democratic governance; to eradicate
extreme poverty; the opportunity to link into international trade networks and to prove that globalization can be a tool to address
inequality.
United in the Pacific Alliance, the Pumas have the opportunity to emerge as regional leaders and flag bearers for Latin American
integration; they have the opportunity to join a 21st century trans-Atlantic community that combines the experience and know-how
of the US and EU with the growth potential of emerging markets. In a world that could see increased regionalism, the Pumas have the
opportunity to be strategic partners to the United States, Europe and East Asia.
How the Pumas capitalize on this opportunity cannot necessarily be measured by any given year’s growth statistics. Similarly, protests
in Chile, setbacks in the Colombian peace process, drug violence in Mexico or falling copper prices in Peru do not necessarily portend
a dream deferred. In many cases, these are natural tensions inherent to maturing emerging markets.
Ultimately, the Pumas’ success should be measured in terms of creating and maintaining institutions worthy of the developed world
while sustaining the growth potential and dynamism of emerging markets. Puma governments must tackle difficult reforms, even at
the cost of some short-term growth, in order to remove long-term bottlenecks on their economies. In terms of regional leadership,
the Pumas’ success should not be based on how many countries join the Pacific Alliance, but rather the depth and breadth of Alliance
integration. In terms of global linkages, the Pumas must demonstrate an ability to turn free trade agreements on paper into more
and better jobs in practice.
Mexico, Colombia, Peru and Chile do not need to be perfect, nor will they be. But if they can continue their positive momentum, they
will blaze a trail for the Pumas of Latin America to run with the Tigers of the East.
Prepared to Pounce?
Prepared to Pounce?
4 5

Chapter 11 Hong Kong SAR, South Korea, Singapore and Taiwan.2 International Monetary Fund Data, simple, unweighted averages.3 International Monetary Fund Data, 2009-2012.4 Michael Shifter and Cameron Combs. “Shifting Fortunes: Brazil and Mexico in a Transformed Region.” Current History, February 2013, 52. Available online at http://www.thedialogue.org/PublicationFiles/CurrentHistory-ShiftingFortunes-Feb.pdf.
5 Robert Wood (ed.). “Country Report: Chile, February 2013.” Economist Intelligence Unit, February 2013. 6 After 20 years of the center-left Concertación presidency, Chileans elected a right leaning government in 2010. After twelve years of the center-right PAN presidency, Mexico returned the centrist PRI to power in 2012. Colombia has moved from the more hardline presidency of Álvero Uribe to the more pragmatic Juan Manual Santos, while Peru has shifted from a technocratic executive to a (supposedly) populist president.
7 MERCOSUR includes Argentina, Brazil, Paraguay (currently suspended), Uruguay and Venezuela. 8 While this figure may pale in comparison to 1980’s East Asian NIC annual export volume growth (12.29 percent), the Puma figures were observed during a global economic downturn in trade, and they compare reasonably with ASEAN – 5 average export volume growth (4.89 percent) over the same span. (Source: IMF Data).
9 Source: Economist Intelligence Unit.10 Cartagena has a population of 900,00011 Source: Economist Intelligence Unit. 12 “Murderous Matches.” The Economist, November 22, 2012. Available online at http://www.economist.com/blogs/graphicdetail/2012/11/comparing-mexican-states-equivalent-countries.
13 Business Insider reports Colombia’s 2011 homicide rate as 16th highest in the world, between Congo and Lesotho. (See: http://www.businessinsider.com/1homicidal-countries-2011-11?op=1).
Chapter 21 Through booms and busts of gold, silver, copper, tin, coffee, rubber, guano, iron, soy and an assortment of hydrocarbons, the region has a long track record of violent swings in production. Latin America’s macroeconomic caprices have not spared the Pacific Pumas. Since 1950, Mexico has plowed through an economic miracle, a debt crisis, a peso crisis, and a recovery before slamming into the Global Recession of 2008. In the 1980s, Chile had years of 10.6 percent growth and 13.5 percent contraction; Peruvian annual inflation hit 2,775 percent in 1989, and 7,649 percent in 1990 (Source: International Monetary Fund Data).
2 The Pumas have experienced macroeconomic unraveling in recent memory, and they appear to have learned their lesson. Mexican devaluations in the 1980s sparked the Latin American debt crisis. Chilean inflation averaged 23.76 percent between 1980 and 1985, while Peru battled through the decade (literally and physically) before inflation spiraled out of control in 1989 (See Francisco Gonzalez. Creative Destruction? Economic Crises and Democracy in Latin America (Baltimore: The Johns Hopkins University Press, 2012).
3 If anything, floating exchange regimes threatened to overly strengthen domestic currencies as investment poured in, thus undermining export competitiveness. This is particularly true in Colombia where the peso has rallied for much for the 21st century, dipping from just under 3,000 to the dollar in 2003 to around 1,800 to the dollar in 2013, despite a brief crisis-era slump. (Currency values according to XR Currency Charts available at www.xe.com). This pressure should ease as the US Federal Reserve tightens monetary policy.
4 Source: IMF International Financial Statistics5 Roberto Frenkel and Martín Rapetti name Chile and Colombia as “pioneers” in implementing a managed float based on inflation targeting, having adopted this method in 1990 and 1991 respectively. Peru adopted such a float in 1994, and Mexico in 1999. (See Roberto Frenkel and Martín Rapetti. “A Concise History of Exchange Rate Regimes in Latin America.” Center for Economic and Policy Research, April 2010, 23.
6 Liliana Rojas-Suarez. “The International Financial Crisis: Eight Lessons for and from Latin America.” Center for Global Development Working Paper No. 202, January 2010. Available online at http://papers.ssrn.com/sol3/papers.cfm?abstract_id=1543451.
7 “Alliance of the Pacific calls for gradual withdrawal of stimulus,” FOREX News, August 24, 2013. Available online at http://convertocurrency.com/news/alliance-of-the-pacific-calls-us-gradual-withdrawal-of-stimulus.
8 Erich Arispe and Bill Warlick. “Venezuelan Policy Continuity Likely After Chavez Victory.” Fitch Ratings, October 8, 2012. Available online at http://www.fitchratings.com/web/en/dynamic/articles/Venezuelan-Policy-Continuity-Likely-After-Chavez-Victory.jsp.
9 Kirsten Sehenbruch. “The Bachelet Bounce.” Berkeley Review of Latin American Studies, Fall 2009 – Winter 2010. Available online at http://ias7.berkeley.edu/Publications/Review/Fall2009/pdf/BRLASFall2009-SehnbruchBachelet.pdf and Larry Rohter. “Chile Copper Windfall Forces Hard Choices on Spending.” The New York Times, January 7, 2007. Available online at http://www.nytimes.com/2007/01/07/world/americas/07chile.html.
10 James McKeigue. “A Lucrative Latin American Alliance.” Money Week, August 23, 2012. Available online at http://www.moneyweek.com/investment-advice/share-tips/a-lucrative-latin-american-alliance-60320.
11 Source: IMF International Financial Statistics.12 Federico Barriga, ed. “Country Report: Colombia, April 2013.” Economist Intelligence Unit, Economist Intelligence Unit Limited, 2013.13 Alejandro Schtulmann and Sergio Broholm. “Mexico’s Tax Reform in the Works: Preview and Initial Considerations.” EconoMonitor, February 18, 2013. Available online at
http://www.economonitor.com/blog/2013/02/mexicos-tax-reform-in-the-works-preview-and-initial-considerations/.14 Based on discussions with Instituto Mexicano para la Competitividad A.C. (IMCO) Director General Juan Pardinas and former General Director Roberto Newell. IMCO is a Mexican think tank that specializes
in issues of competitiveness. 15 World Bank Database. Available online at http://data.worldbank.org/country/colombia16 “Poverty Rate in Peru Falls 17% from 2006-2010.” People’s Daily Online, May 20, 2011. Available online at http://english.people.com.cn/90001/90777/90852/7386733.html.17 Averages unweighted. Source: Economist Intelligence Unit. 18 Source: Economist Intelligence Unit. 19 Mexican foreign direct investment (FDI) has fluctuated, but it remains the top destination of the four. Source: World Development Indicators, World Bank Data.20 Source: The World Bank & International Finance Corporation. “Doing Business: Economy Rankings.” Available online at http://www.doingbusiness.org/rankings.21 The Pacific Pumas’ Gini Coefficient (a common measurement of economic inequality), remains high, as it does throughout Latin America. Moving forward, the Pumas’ ability to develop an internal
consumptive motor hinges upon an ability to increase the buying power of the less well healed (and of the barefoot).
Chapter 31 The relationship between institutional and economic failure is argued effectively and at length in Daron Acemoglu and James Robinson. Why Nations Fail. New York: Crown Business, 2012. It should be
noted that these authors maintain a more pessimistic stance on Colombia’s institutional development. 2 John Peeler. Building Democracy in Latin America, Third Edition. (Boulder: Lynne Rienner, Inc., 2009), 148.3 For a concise summary of APRA, Peru’s populist movement, see Michael L. Conniff, ed. Populism in Latin America. (Tuscaloosa: University of Alabama Press, 2012). Military coups occurred intermittently
between 1930-1979. 4 Teresa Cespedes and Caroline Stauffer. “Left-winger Humala wins Peru election, markets dive.” Reuters, June 6, 2011. Available online at
http://www.reuters.com/article/2011/06/06/us-peru-election-idUSTRE75432720110606.5 Nick Rosen. “Poll: Peru’s business leaders support Humala.” Peru This Week, December 3, 2012. Available online at
http://www.peruthisweek.com/news-poll-perus-business-leaders-support-humala-13227.6 Reduced tariffs, deregulation and pursuit of a North American Free Trade Agreement (NAFTA)7 Partido Revolucionario Institucional (PRI), Partido Acción Nacional (PAN), Partido Revolucionario Democrático (PRD)8 According to a Bloomberg View Op-Ed, “The U.S. Energy Information Administration estimates that Mexico has the world’s sixth-largest shale-gas reserves, with 555 trillion cubic feet of recoverable
reserves (plus a further 13 billion barrels of recoverable shale-oil reserves).” See Duncan Wood. “Turn Up the Gas on Mexico’s Energy Revolution.” Bloomberg View, August 14, 2013. Available online at http://www.bloomberg.com/news/2013-08-14/turn-up-the-gas-on-mexico-s-energy-revolution.html.
9 The energy reform is not a done deal. The constitutional adjustments require ratification from at least 17 of Mexico’s 31 state legislatures, though most analysts expect little obstruction from a sufficient number of PRI-friendly states. The legal implications may be more nettlesome. Advocates for more liberal reforms celebrate the bill’s licenses, which function similarly to investor-desired concessions. Yet these concessions remain expressly prohibited, creating a gray area that could well end up in court.
Endnotes
4 64 6

10 Colombia has not suffered the severe macro fluctuations and economic collapses endemic to Latin America and much of the developing world in recent decades. It was the only major Latin American country not forced to restructure international obligations during the 1980s debt crisis that racked the region. Colombia emerged unscathed by the tequila crisis of the mid-90s and bounced back quickly from a one-year downturn during the East Asian crisis of the late-1990s. It has grown right through the great global recession. See: See Jennifer Holmes, Sheila Amin Gutiérrez de Piñeres and Kevin Curtin. Guns, Drugs & Development in Colombia (Texas: University of Texas Press, 2009); and James Robinson. “A Normal Latin American Country? A Perspective on Colombian Development.” November 21, 2005. Available online at http://scholar.harvard.edu/files/jrobinson/files/jr_normalcountry.pdf.
11 “The Humanitarian Crisis in Colombia Caused by the Armed Conflict.” International Organizations Position Paper: Colombia, 2011. Available online at http://www.internal-displacement.org/8025708F004CE90B/(httpDocuments)/7C6B5E44F9918459C125797600398E72/$file/colombia-humanitarian-crisis-17nov2011-eng.pdf.
12 Acemoglu and Robinson, 277 – 283. 13 Inequality remains high in Colombia, and even people who have suffered directly from FARC violence can be sympathetic to the original ideology. 14 ¿Alguien espió a los negociadores de La Habana? Semana, Februrary 3 2014. Available online at http://www.semana.com/nacion/articulo/alguien-espio-los-negociadores-de-la-habana/376076-315 Petro y Cepeda son amenazados por las Águilas Negras. Semana, February 4, 2014. Available online at
http://www.semana.com/nacion/articulo/cepeda-petro-son-amenazados-por-aguilas-negras/376125-3.16 Peter Siavelis. “Chile: The End of the Unfinished Transition.” In Jorge Domínguez and Michael Shifter (eds.)Constructing Democratic Governance in Latin America, 3rd Edition (Baltimore: The Johns Hopkins
University Press, 2008), 191 – 196.17 Reforms in 1989 chipped away at unelected influences over Chilean democracy. More far-reaching reforms in 2005 reigned in executive powers while simultaneously restoring civilian oversight of the
military. Source: Claudia Heiss. “Bachelet Appoints Group to Study New Constitution for Chile.” Int’l J. Const. L. Blog, May 1, 2013. Available online at http://www.iconnectblog.com/2013/05/bachelet-appoints-group-to-study-new-constitution-for-chile.
18 According to Siavelis, the education law “transferred the authority for public education from the central government to the municipalities, creating huge gaps between rich and poor areas (Siavelis, 202).”
19 For OECD corporate tax income averages, see “OECD Corporate Income Tax Rates, 1981-2012.” Tax Foundation, June 29, 2012. Available online at http://taxfoundation.org/article/oecd-corporate-income-tax-rates-1981-2012.
20 Francisco Peregil. “Michelle Bachelet, presidenta electa de Chile tras una amplia victoria.” El Pais, December 16, 2013. Available online at http://internacional.elpais.com/internacional/2013/12/15/actualidad/1387145955_299083.html.
21 Kristen Sehnbruch and Peter Siavelis. “Why Victory for Bachelet in Chile is undeniable but bittersweet.” The Washington Post (November 25, 2013). Available online at http://www.washingtonpost.com/blogs/monkey-cage/wp/2013/11/25/why-victory-for-bachelet-in-chile-is-undeniable-but-bittersweet/.
22 Alex Kaiser. “Is This the End of the Chilean Economic Miracle?” Forbes, October 28, 2013. Available online at http://www.forbes.com/sites/realspin/2013/10/28/is-this-the-end-of-the-chilean-economic-miracle/.
23 See Cornelius Fleischhaker, “Peru: The Growing Pains of a Puma Cub,” No Se Mancha, September 29, 2013. Available online at http://semancha.com/2013/09/29/peru-puma-cub/.24 “President Humala: Peru’s foreign policy based on dignity and honor.” Andina, September 24, 2011. Available online at
http://www.andina.com.pe/Ingles/noticia-president-humala-perus-foreign-policy-based-on-dignity-and-honor-379191.aspx.25 In terms of Peruvian parties, Alberto Fujimori’s 1990 Cambio 90, Alejandro Toledo’s 2001 Peru Posible and Ollanta Humala’s 2011 Gana Peru parties were all built by the presidential candidates
themselves. Alan Garcia ran on the populist APRA ticket in 2006. 26 See “Humala Humbled: A lonelier president faces protests.” The Economist, August 3, 2013. Available online at
http://www.economist.com/news/americas/21582580-lonelier-president-faces-protests-humala-humbled?zid=309&ah=80dcf288b8561b012f603b9fd9577f0e.
Chapter 41 Unweighted averages. Source: International Monetary Fund Data2 Trade is a sensitive subject in Latin America where exposure to global tailwinds has led to periods of dizzying booms and busts. Many 19th century patriots were inspired to take up arms against colonial Spanish rule to liberate the new world from restrictive trade policies. A subsequent era of trade climaxed between 1870 and 1914 when European demand for Latin American raw materials coincided with a boom in emerging market investment: During this period, Latin America outgrew the US in both GDP and per-capita GDP. See Francisco Gonzalez, Creative Destruction: Economic Crisis and Democracy in Latin America (Baltimore: The Johns Hopkins University Press, 2012), 47. This golden age of free trade dissolved during World War I. International dynamics would only worsen with the onset of the Great Depression. Caught in macroeconomic tides beyond its control, Latin American economists questioned the efficacy of export-led growth. These sentiments culminated in one of the region’s notable contributions to economic philosophy, dependency theory, which held that free trade pigeonholed Latin America into exporting raw materials in exchange for ever-more expensive manufactured goods. The region transitioned to an inward-looking development model, raising prohibitive tariffs against imports while nurturing domestic manufacturers. This import-substitution industrialization (ISI) of the 1950, ‘60s and ‘70s distorted currencies, overvaluing exports and undervaluing imports; two factors that helped trigger the sovereign debt crises of the 1980s. Latin America underwent shotgun liberalization in the 1980s and 1990s under the guidance of the World Bank, the International Monetary Fund, and the US Treasury. Reformers often lacked a mandate: The governments that lowered trade barriers in Mexico, Peru and Chile had dubious democratic credentials, at best. Subsequent neoliberal politicians struggled at the ballot box in the 2000s, and many larger Latin American countries (but not the Pumas) began to unwind neoliberal reforms as part of the region’s so-called “pink tide.”
3 Shaping the Future of Asia and the Pacific Latin-America and the Caribbean Relationship. (Washington: Inter-American Development Bank, 2012).4 Inter-American Development Bank (2012), 50.5 Ibid. 6 Bertelsmann Foundation, Global Economic Dynamics Visualizer, 2013. 7 “China becomes Peru’s main trade partner and a leading investor.” MercoPress, September 23, 2011. Available online at http://en.mercopress.com/2011/11/30/china-becomes-peru-s-main-trade-partner-and-a-leading-investor.
8 “NAFTA at 20: Deeper, Better, NAFTA.” The Economist, January 4, 2014. Available online at http://www.economist.com/news/leaders/21592612-north-americas-trade-deal-has-delivered-real-benefits-job-not-done-deeper-better.
9 Source: IQOM Commercial Intelligence Data10 An unwritten rule limits TPP participants to members of the Asia-Pacific Economic Cooperation (APEC), of which Colombia is not a member. A moratorium on APEC membership has prevented any
new members from joining since 1998. (See: Barbara Kotschwar. “The Pacific Alliance, the TPP, and the RCEP: What does it all mean?” The Peterson Institute, 2013.) Analysts interpret the moratorium as a method to prevent India from joining.
11 Adam Thomson. “Mexico: China’s Unlikely Challenger.” Financial Times, September 19, 2012. Available online at http://www.ft.com/intl/cms/s/0/9f789abe-023a-11e2-b41f-00144feabdc0.html#axzz2dBFicBNF.
12 Statistical Yearbook for Latin America and the Caribbean, 2000. (Santiago: United Nations Economic Commission for Latin America and the Caribbean, 2001), 504-505. 13 Thomson, 2012. 14 Source: World Bank Human Development Index15 Claudia Avila Connelly. “Why ‘Made in Mexico’ Means Quality and Competitiveness.” Site Selection, January 2012. Available online at http://www.siteselection.com/issues/2013/jan/mexico.cfm.16 Theodore Kahn. “NAFTA at 20: A Good Deal for Mexico?” No Se Mancha, January 3, 2014. Available online at http://semancha.com/2014/01/03/nafta-at-20-a-good-deal-for-mexico/.17 Emily Sinnot, John Nash and Augusto de la Torre. Natural Resources in Latin America and the Caribbean: Beyond Booms and Busts? (Washington: The World Bank, 2010), 33.18 Christian Berthelsen. “Investors, Analysts See End of Commodity Supercycle.” The Wall Street Journal, July 22, 2013. Available online at
http://online.wsj.com/article/SB10001424127887324144304578619672666497416.html.19 Ric Deverell. “Commodities’ Forecast Update: the Return of Fundamentals.” Credit Suisse Securities Research & Analytics, June 25, 2013. Available online at https://doc.research-and-analytics.csfb.com/
docView?language=ENG&format=PDF&document_id=805424220&sourceid=emcmt&serialid=e0u%2foelAy4ymkowCA%2fezsnQ5YqJ42utsd%2bWhhhYkcgc%3d.20 Jack Farchy and Javier Blas. “Commodity traders call end of supercycle.” Financial Times, June 26, 2013. Available online at
http://www.ft.com/intl/cms/s/0/d76d040a-de76-11e2-b990-00144feab7de.html#axzz2q27TmuQ8.21 Mauricio Mesquita Moreira and Danielken Molina. “Asia and the Pacific-LAC Trade: What Does the Future Hold?” In Shaping the Future of Asian and the Pacific—Latin American and the Caribbean Relationship.
(Washington: Inter-American Development Bank & Asian Development Bank, 2012),14. 22 Deverell, 2013.23 Mike Morris, Raphael Kaplinsky and David Kaplan. “One Thing Leads to Another – Commodities, Linkages and Industrial Development: A Conceptual Overview.” Making the Most of Commodities
Programme Discussion Paper No. 12, October 2011. Available online at http://commodities.open.ac.uk/8025750500453F86/(httpAssets)/22498EAB8FBC93DE80257929002F2FA1/$file/MMCP%20Paper%2012%20(revised).pdf.
24 According to a World Bank background research paper, Latin American metals, for example, are differentiated enough “to create a high degree of intra-industry trade, implying the exchange of distinct varieties…[creating] the potential for specialization in, and upgrading to higher quality, higher values within product categories.” (See: Sinnot, et al, 18.) Meanwhile, the Banco Central de Reserva del Perú argues that Peru has been effective in generating commercial linkages with local mines, citing the Yanacocha gold mine’s spillover affects stemming from demand for local inputs. See: Fernando Aragón and Juan Pablo Rud. “The Blessing of Natural Resources: Evidence from a Peruvian Gold Mine.” Banco Central de Reserva Del Perú Working Paper, December 2009. Available online at http://www.bcrp.gob.pe/docs/Publicaciones/Documentos-de-Trabajo/2009/Working-Paper-15-2009.pdf.
25 Esteban Pérez Caldentey. “Income Convergence, Capability Divergence and the Middle Income Trap: An Analysis of the Case of Chile.” Studies in Comparative International Development, June 2012, Volume 47, Issue 2, 185-207.
26 Raphael Bergoeing, Alejandro Micco and Andrea Repetto. “Dissecting the Chilean Export Boom.” Cepal Review, December 2011. Available online at http://www.eclac.org/cgi-bin/getProd.asp?xml=/revista/noticias/articuloCEPAL/8/46378/P46378.xml&xsl=/revista/tpl-i/p39f.xsl&base=/revista/tpl-i/top-bottom.xsl.
Endnotes 4 74 7

27 Simon Collier and William Sater. A History of Chile, 1808-2002 (Cambridge: Cambridge University Press, 2004), 370.28 Bergoeing, et al., 5.29 Manuel Agosin and Claudio Bravo-Ortega. “The Emergence of New Successful Export Activities in Latin America: The Case of Chile.” Documentos de Trabajo del Departamento de Economía de La Universidad de
Chile, April 2007 (Santiago: Universidad de Chile). Available online at http://www.econ.uchile.cl/uploads/publicacion/f5ba4950-b592-4285-8c58-decd6ea07234.pdf. 30 In May 2012 Drinks International found Concha Y Toro to be the world’s most admired wine brand, “Once again, Concha y Toro tops the Most Admired poll, a year on from its $238mn purchase of
Fetzer—a deal which had the potential to change the way in which the company was perceived on the international stage.” See “The World’s Most Admired Wine Brands.” Drinks International, May 2012. Available online at http://www.drinksint.com/files/Supplements/2012/Drinks-International-Most-Admired-Wines-2012.pdf).
31 Mauricio Reina and Sandra Oviedo. “Colombia y Asia: Tratando de Recuperar el Tiempo Perdido.” FEDESARROLLO, June 20, 2013. See also: Kahn (2013). 32 Mauricio Mesquita Moreira. “Too far to export: Domestic Transportation Costs and Regional Export Disparities in Latin America and the Caribbean.” Inter-American Development Bank, 2013.
Available online at http://idbdocs.iadb.org/wsdocs/getdocument.aspx?docnum=38195718.
Chapter 51 The Economist attributes this quote to Felipe Larraín, Chilean Minister of Finance under President Sebastián Piñera (see http://www.economist.com/news/americas/21578056-region-falling-behind-two-alternative-blocks-market-led-pacific-alliance-and), but subjects referencing the Pacific Alliance as “the exciting thing happening in Latin America” has been common in interviews I have conducted with Mexican, Colombia, Peruvian, Chilean and US policymakers both in Washington and Latin America.
2 Source: International Monetary Fund Data Base3 Source: International Monetary Fund Data Base, Gross Domestic Product, Current Prices, US Dollars. 4 Soccorro Ramírez. “Regionalism: The Pacific Alliance.” Americas Quarterly, 2013. Available online at http://www.americasquarterly.org/content/regionalism-pacific-alliance. 5 Mexico, Guatemala, El Salvador, Honduras, Nicaragua, Costa Rica, Panana, Colombia, Ecuador, Perú and Chile. 6 Carlo Dade and Carl Meacham. “The Pacific Alliance: An Example of Lessons Learned.” Center for Strategic & International Studies, July 11, 2013. Available online at http://www.iadb.org/intal/intalcdi/PE/2013/12506.pdf. It should be noted that Dade and Meacham place the Alliance’s combined GDP at “just under US$3 trillion,” a higher figure than used in this study.
7 Venezuelan President Hugo Chávez removed his country from CAN in 2006. Bolivia, a founding member of CAN but more recently a stalwart of the more statist ALBA coalition, did not join the Arc of the Pacific. In the more recent transition from the Arc of the Pacific (which has been inactive since 2010), the Pumas have consolidated their ranks: Ecuador and Nicaragua, for example, have neither joined nor observed the Pacific Alliance. See: Simone Baribeau. “Chávez: Venezuela to withdraw from Andean Community of Nations.” Venezuelan Analysis, April 20, 2006. Available online at http://venezuelanalysis.com/news/1706.
8 Barbara Kotschwar. “The Pacific Alliance, the TPP, and the RCEP: what does it all mean.” The Peterson Institute, October 2013. 9 “South America’s Pacific Alliance Signs Deal to Scrap Tariffs.” Voice of America, February 11 2014. Available online at http://www.voanews.com/content/reu-south-america-pacific-alliance-deal-scrap-tarrifs/1848724.html.
10 Source: European Union statistics. Mexico is Colombia’s fourth biggest trading partner.11 “Pacific Alliance is a “marketing success” and no concern for Mercosur, says Brazil,” MercoPress (June 22, 2013). Available online at
http://en.mercopress.com/2013/06/22/pacific-alliance-in-a-marketing-success-and-no-concern-for-mercosur-says-brazil.12 World Economic Forum. The Financial Development Report 2012. Available online at http://latamalternatives.com/Files/MEDIA_PRESS_1.pdf.
http://www3.weforum.org/docs WEF_FinancialDevelopmentReport_2012.pdf.13 Firms such as Falabella and Cencosud (See: Diego Agudelo, Santiago Barraza, Maria Isabel Castro and Samuel Mongrut, Liquidez en Los Mercador Accionarios Latinoamericanos: Estimando El Efecto del Mercado
Integrado Latinamericano (MILA). (Centro de Investigaciones Económicas y Financieras, Universidad EAFIT, No. 12-21, 2012). Available online at http://repository.eafit.edu.co/handle/10784/657#.Ue_nxY21H5E
14 Peruvian mining firms include Buenaventura, Hosch Shcil, Volcán, and Milpo. (See: Agudelo, et al.)15 Colombian energy firms include Ecopetrol, Pacific Rubiales, ISA, and Colinversiones. (See: Agudelo, et al.)16 Ndya Gómez Ramirez. El MILA y Su Impacto en el Sector Financiero. (Nueva Granada: Univsidad Militar 2013), 28. Available online at http://repository.unimilitar.edu.co/bitstream/10654/9966/1/
GomezRamirezNidyaMercedes2013.pdf . Also see: Andres Schipani. “Bourses: Uniting to build critical mass.” Financial Times, November 21, 2012. Available online at http://www.ft.com/intl/cms/s/0/10e97554-2808-11e2-afd2-00144feabdc0.html#axzz2ZnZJEIGZ.
17 “MILA: Strengthening Financial Integration.” Inter-American Development Bank. Available online at http://www.iadb.org/en/topics/trade/MILA-strengthening-financial-integration,6839.html.18 Ramirez, 20. For a graph see http://us.spindices.com/indices/equity/sp-MILA-40-index.19 In its insipient phase, and still without Mexico, MILA has captured the attention of international investors. “The Andean Region: Catching Up Fast” blared a headline from Advanced Trading in
September 2012. “MILA Holding the Best Cards in a Long Game,” read another from Latin American Investor. See Alice Botis. “The Andean Region: Catching Up Fast.” Advanced Trading, September 27, 2012. Available online at http://www.advancedtrading.com/exchanges/the-andean-region-catching-up-fast/240008007; and “MILA Holding the Best Cards in a Long Game.” Latin American Investor, July 4, 2013. Available online at http://latinamericaninvestor.com/?p=123. Meanwhile, a study conducted by the Centro de Investigaciones Económicas y Financieras (CIEF) in Colombia concluded that “the potential savings in transactions costs associated with a modest increase of 10 percent in trading activity ranges between 10 and 36 million dollars for the three countries.” (See Agudelo, et al.).
20 This international partnering could have been done prior to and independent of MILA. However, experts such as the Inter-American Development Bank’s Juan Antonio Ketterer believe that MILA encourages this process. 21 “MILA: A New Phase of Integration in Latin America.” Latin American Initiatives, January, 2011. Available online at http://latamalternatives.com/Files/MEDIA_PRESS_1.pdf.22 Juan Antonio Ketterer. Interview by author. Washington, May 17, 2013.
Chapter 61 “Latin American Geoeconomics: A Continental Divide.” The Economist, May 18, 2013. Available online at http://www.economist.com/news/americas/21578056-region-falling-behind-two-alternative-blocks-market-led-pacific-alliance-and.
2 Andres Oppenheimer. “While Pacific Alliance thrives, MERCOSUR withers.” Miami Herald, May 25, 2013. Available online at http://www.miamiherald.com/2013/05/25/3415192/andres-oppenheimer-while-pacific.html.
3 This paper argues the Pumas’ potential internal growth motor as an asset. But this motor is not enough to power development alone. 4 Andrés Malamud. “Overlapping Regionalism, No Integration: Conceptual Issues and the Latin American Experiences” EUI Working Papers, RSCAS 2013/20, March 2013. Available online at http://repositorio.ul.pt/bitstream/10451/8216/1/ICS_AMalamud_Overlapping_WORI.pdf. Edmar Luis Fagundes de Almeida and Nicholas Trebat. “The Argentine-Bolivia-Chile Crisis.” In Paulina Beato and Juna Benavides (eds.) Gas Market Integration in the Southern Cone (Washington DC: Inter-American Development Bank, 2004), 250.
5 Gas consumption in the industry and mining sector jumped from 13 million cubic meters in 1996 to 310 million cubic meters. Recent estimates expect Chile to increase annual gas-fired electricity by 26 percent between 2011 and 2015. See Felipe Balmaceda and Pablo Serra. “Chile: Energy Dependence.” In Paulina Beato and Juan BenAvides (eds.), Gas Market Integration in the Southern Cone (Washington, DC: Inter-American Development Bank, 2004), 122. Also see Robin Yapp. “Chile’s Uncertain Renewable Energy Future.” Renewable Energy World, April 9, 2012. Available online at http://www.renewableenergyworld.com/rea/news/article/2012/04/chile-looks-to-renewables-as-its-grid-falters.
6 In Bolivia gas finds accelerated in the 2000s, with proven and probable reserves increasing over 500 percent from 8.6 TFC in 1999 to 52.4 in 2004 representing the largest reserves in South America after Venezuela. See Vicent Fretes-Cibils, Marcelo Giugale and Connie Luff. Bolivia: Public Policy Options for the Well Being of All. (Washington: The World Bank, 2006), For its part, Argentina appears on the verge of a shale gas revolution. According to the U.S. Energy Information Administration, Argentina has 774 trillion cubic feet of technically recoverable shale gas reserves, placing it third globally behind China and the US (see Ogib Research Team. “Argentina on the Verge of Shale Gas Boom.” Oil and Gas Investments Bulletin, December 14, 2011.)
7 In January of 2002, the Argentine Congress passed economic emergency laws that pegged end-user charges for electricity at one peso to one dollar, while freezing rates that transmission and distribution companies could charge. This emergency measure settled into a norm, and became a massive subsidy for Argentine gas consumption—the type of distortion which Puma economies have eschewed. Facing pricing ceilings, Argentine gas firms had little incentive to sell domestically. Attracted by higher spot values across the Andeas, they preferred to serve the Chilean market. This momentarily fit Chile’s needs, but the rules would soon change again. See Thomas Andrew O’Keefe. “Argentina.” In Sidney Weintraub, ed. Energy Cooperation in the Western Hemisphere: Benefits and Impediments (Washington: Center For Strategic International Studies, 2007), 212.
8 In 2004, La Casa Rosada sought to limit gas exports to Chile in response to a domestic shortage in Argentina. Supply restrictions held exports to Chile below 66 percent of the normal amount, jeopardizing daily Chilean operations. At some future point, Buenos Aires will likely roll back domestic gas subsidies, thus obviating suppliers’ desires to export abroad (see O’Keefe, 223).
9 Evo Morales rose to power spearheading a rejection of plans to build a private pipeline that would move Bolivian gas to Chilean ports where it would be condensed and shipped to North America. In an astute reading of public temperament, Morales and his Movimiento al Socialismo (MAS) unleashed a string of protests and blockades in 2003 that paralyzed parts of Bolivia. The notion that neoliberals sought to “sell Bolivian gas to Chile,” broadened into the No al Gas movement: a rejection of neoliberal policies that would see two presidents chased from power and a third, Evo Morales, renationalize the hydrocarbon industry.
10 Charlotte Karrlsson-Willis. “Bolivia to finally bring Chilean dispute to Hague this Wednesday.” The Santiago Times, April 22, 2013. Available online at http://santiagotimes.cl/bolivia-to-finally-bring-chilean-dispute-to-hague-this-wednesday/.
11 Alexandra Ulmer and Fabian Cambero. “Bachelet, ahead in Chile polls, eyes LNG to keep lights on.” Reuters, October 1, 2013. Available online at http://www.reuters.com/article/2013/10/01/us-chile-election-energy-analysis-idUSBRE9900ZE20131001.
12 Suelen Emilia Castiblanco Moreno. “El Paradigma de Internacionalización en las Relaciones Comerciales Colombo – Venezolanas, Una Mirada desde las Cadenas Productivas.” Suma de Negocios, Vol. 2 N. 1, June 2011, 79-92.
13 “Dinamica Comercio Exterior: Colombia- Venezuela, 2004 – 2008.” National Bureau of Statistics of Colombia (DANE) (April 2008). Available online at http://www.dane.gov.co/daneweb_V09/files/investigaciones/boletines/exportaciones/bolesp_exp_04_08.pdf.
4 84 8

14 María del Pilar Esguerra Umana, Enrique Montes Uribe, Aarón Garavito Acosta and Carolina Pulido González. “El comercio colombo-venezolano: características y evolucón reciente,” Apuntes del CENES, Vol. XXIX, No. 69, 123-162, June 2010.
15 Ewan Robertson. “Trade Between Venezuela and Colombia Back on Track.” Venezuela Analysis, February 11, 2013. Available online at http://venezuelanalysis.com/news/7727.16 Mark Weisbrot and Jake Johnston. “The Gains from Trade: South American Economic Integration and the Resolution of Conflict.” Center for Economic and Policy Research, November 2010. Available
online at http://www.cepr.net/documents/publications/gains-from-trade-2010-11.pdf.17 Umana, et al. 18 “La lejanía entre Colombia y Venezuela.” Semana, July 27, 2013. Available online at http://www.semana.com/nacion/articulo/la-lejania-entre-colombia-venezuela/352263-3. 19 Luisa Gómez Rodríguez (Editor, Portafolio). Interview with author. Bogotá, July 15, 2013.20 Source: UN Comtrade, OECD/European Commission. See http://stage.stocks-flows.de/edit/180?lang=en.
Audi, Acura, Volkswagen, Nissan and BMW are five of many automobile companies that produce in Mexico.21 “Two ways to make a car.” The Economist, May 10, 2012. Available online at http://www.economist.com/node/21549950.22 The Wall Street Journal report that a Mexican-made. Volkswagen Jetta sold for US$19,342, while the same car in Brazil sold for US$28,072. See Laurence Iliff and Gerald Jeffris. “Mexico and Brazil Fix
Trade Spat on Cars.” The Wall Street Journal, March 15, 2012. Available online at http://online.wsj.com/article/SB10001424052702303863404577284060757942448.html.23 Ibid.24 From 2007 to 2011, 78.78 percent of Mexico’s average annual exports were destined for the United States (2007-81.2 percent; 2008-78.9 percent; 2009- 79.5 percent; 2010-78.3 percent 2011-76 percent).
Source: UN Comtrade, OECD/European Commission.25 Hermino Blanco Mendoz, Jaime Zabludovsky Kuper, Adalberto García Rocha and Sergio Gómez Lorz. “Brazil’s Dutch Disease and the Auto Trade War with Mexico: Stylized Facts.” Center for Economic
Policy Research, June 14, 2012. Available online at http://www.globaltradealert.org/gta-analysis/brazil%E2%80%99s-dutch-disease-and-auto-trade-war-mexico-stylised-facts.26 Buoyant exports to Canada and the US over the same time span suggest a correlation between the restrictions and the decline. See Brandon Case. “Mexico Car Exports Drop 11% as Brazil, Argentina
Limit Shipments.” Bloomberg, March 6, 2013. Available online at http://www.bloomberg.com/news/2013-03-06/mexico-car-exports-drop-11-as-brazil-argentina-limit-shipments.html27 “Two ways to make a car.” The Economist, May 10, 2012. Available online at http://www.economist.com/node/21549950.28 The Wall Street Journal report that a Mexican-made. Volkswagen Jetta sold for US$19,342, while the same car in Brazil sold for US$28,072. See Laurence Iliff and Gerald Jeffris. “Mexico and Brazil Fix
Trade Spat on Cars.” The Wall Street Journal, March 15, 2012. Available online at http://online.wsj.com/article/SB10001424052702303863404577284060757942448.html.29 Ibid.30 From 2007 to 2011, 78.78 percent of Mexico’s average annual exports were destined for the United States (2007-81.2 percent; 2008-78.9 percent; 2009- 79.5 percent; 2010-78.3 percent 2011-76 percent).
Source: UN Comtrade, OECD/European Commission.31 Hermino Blanco Mendoz, Jaime Zabludovsky Kuper, Adalberto García Rocha and Sergio Gómez Lorz. “Brazil’s Dutch Disease and the Auto Trade War with Mexico: Stylized Facts.” Center for Economic
Policy Research, June 14, 2012. Available online at http://www.globaltradealert.org/gta-analysis/brazil%E2%80%99s-dutch-disease-and-auto-trade-war-mexico-stylised-facts.32 Buoyant exports to Canada and the US over the same time span suggest a correlation between the restrictions and the decline. See Brandon Case. “Mexico Car Exports Drop 11% as Brazil, Argentina
Limit Shipments.” Bloomberg, March 6, 2013. Available online at http://www.bloomberg.com/news/2013-03-06/mexico-car-exports-drop-11-as-brazil-argentina-limit-shipments.html.
Chapter 71 Source: Eurostat, Global Solutions2 Using figures from the IMF’s World Economic Outlook Databases3 See Samuel George. “Behind the Brazil-USA Beef.” No Se Mancha, September 23, 2013. Available online at http://semancha.com/2013/09/23/behind-the-brazil-usa-beef/4 “História provou que democracia é melhor fonte para esquerda chegar ao poder, diz Lula.” Opera Mundi, February 2, 2013. Available online at http://operamundi.uol.com.br/conteudo/noticias/30390/historia+provou+que+democracia+e+melhor+fonte+para+esquerda+chegar+ao+poder+diz+lula.shtml.
5 Source: IQOM statistics6 “Mexico.” Office of the Untied States Trade Represenative, 2014. Available online at http://www.ustr.gov/countries-regions/americas/mexico7 Eric Farnsworth. “NAFTA and the Pacific Alliance.” Council of the Americas, August 5, 2013. Available online at http://www.as-coa.org/articles/nafta-and-pacific-alliance.8 Barbara Kotschwar. “Will the Pacific Alliance Succeed in Latin America After Other Trade Pacts Have Failed?” Peterson Institute for International Economics, May 23 2013. Available online at http://blogs.piie.com/realtime/?p=3586.
9 Magdalena Forster. “Talking Point: The Pacific Alliance, Latin America’s new stars.” Deutsche Bank Research, August 27, 2013. Available online at http://www.dbresearch.com/servlet/reweb2.ReWEB?rwsite=DBR_INTERNET_EN-PROD&rwobj=ReDisplay.Start.class&document=PROD0000000000318945.
10 Detlef Nolte and Leslie Wehner. “The Pacific Alliance Casts Its Cloud over Latin America.” German Institute of Global and Area Studies, 2013. Available online at http://www.giga-hamburg.de/en/system/files/publications/gf_international_1308.pdf.
11 Source: Eurostat (Comtext, Statistical Regime 4).12 Ibid.13 Ibid.14 “Countries and Regions: Chile.” European Commission Trade. Available online at http://ec.europa.eu/trade/policy/countries-and-regions/countries/chile/.15 Álvero Calderón, Miguel Pérez and Sebastián Vergara. “Foreign Direct Investment in Latin America and the Caribbean.” ECLAC Briefing Paper, 2011. Available online at http://www.eclac.org/
publicaciones/xml/2/46572/2012-182-LIEI-WEB.pdf.16 “Foreign Direct Investment in Latin America and the Caribbean.” ECLAC, 2011. Available online at http://www.eclac.org/publicaciones/xml/2/46572/LIE2011-Chapter2.pdf.17 In April 2012, Argentine President Cristina Fernández de Krichner nationalized Yacimientos Petrolíferos Fiscales (YPF) shortly after Repsol, YPF’s Spanish owner, discovered massive oil and shale-
gas reserves. Spanish-owned power company Transportadora de Electricidad SA (TDE) met a similar fate in Bolivia when President Evo Morales nationalized it in May of 2012, before subsequently nationalizing Spanish firms running Bolivian airports in February of 2013. The Spanish Prime Minister called the YFP nationalization “completely unjustifiable”. The Vice President of Spain’s main business association called the power company’s nationalization “just not right,” and Spain’s foreign minister “deeply deplored” the subsequent airport appropriation. But beyond longshot petitions to international bodies, Spain could do little more than stomp its feet—a move typically reserved for Andaluz dancers. See Uki Goni. “The Oil War Between Spain and Argentina.” Time, April 18, 2012. Available online at http://www.time.com/time/world/article/0,8599,2112303,00.html; “Bolivia Nationalization of Power Grid Hits Spain at Low Point.” FoxNews Latino, May 2, 2012. Available online at http://latino.foxnews.com/latino/news/2012/05/02/bolivia-nationalizes-power-grid-spain-freaks-out/; Carlos Valdez. “Evo Morales, Bolivia President, Nationalizes Spanish-Owned Airport Company SABSA.” Huffington Post, February 18, 2013. Available online at http://www.huffingtonpost.com/2013/02/18/evo-morales-nationalizes-sabsa_n_2712127.html.
18 Source: ECLAC. “Foreign Direct Investment in Latin America and the Caribbean,” 63.19 “The Strategy of the Pacific Alliance.” German Foreign Policy, November 15, 2013. Available online at http://www.german-foreign-policy.com/en/fulltext/58697.20 Samuel George, Thiess Peterson and Ulrich Schoof. “The Effect of Transatlantic Free Trade on Latin America.” Global Economic Dynamic GED-Focus, 2013. Available online at http://www.ged-project.de/
fileadmin/uploads/documents/GED_Focus_LATAM_en.pdf.
Chapter 81 Evan Ellis. “The Expanding Chinese Footprints in Latin America: New Challenges for China and Dilemmas for the US.” Center for Asian Studies, February 2012. 2 Osvaldo Rosales. “The People’s Republic of China and Latin America and the Caribbean.” ECLAC, May 2010.3 Gastón Fornés and Alan Butt Philip. The China- Latin America Axis. (New York: Palgrave Macmillan, 2012), 30.4 Katherine Koleski. “Backgrounder: China in Latin America.” US–China Economic and Security Review Commission, May 27, 2011. Available online at http://origin.www.uscc.gov/sites/default/files/Research/Backgrounder_China_in_Latin_America.pdf.
5 Enrique Dussel Peters. “Chinese FDI in Latin America: Does Ownership Matter?” Global Development and Environment Institute at Tufts University, Discussion Paper Number 33, November 2012. Available online at http://ase.tufts.edu/gdae/Pubs/rp/DP33DusselNov12.pdf.
6 This figure does not include an estimated US$75 billion in Chinese loans to the region that often finance infrastructure projects. See: Kevin P. Gallagher, Amos Irwin and Katherine Koleski. “The New Banks in Town: Chinese Finance in Latin America.” Inter-American Dialogue, February 2012. Available online at http://ase.tufts.edu/gdae/Pubs/rp/GallagherChineseFinanceLatinAmerica.pdf.
7 Barbara Kotschwar, Theodore Moran and Julia Muir. “Chinese Investment in Latin American Resources: The Good, the Bad, and the Ugly.” Peterson Institute for International Economics, WP 12 -3, February 2012. Available online at http://www.piie.com/publications/wp/wp12-3.pdf.
8 See Alex Fernández Jilberto. “Neoliberalised South-South Relations: Free Trade Between Chile and China.” In Alex Fernández Jilberto and Barbara Hogenboom (eds.), Latin America Facing China (New York: Berghahn Books, 2010), 79.
9 “Codelco venderá a Minmetals 55.750 TM anuales de cobre a precios de mercado.” Minería Chilena, February 2, 2013. Available online at http://www.estrategia.cl/detalle_noticia.php?cod=73837. 10 Juan Carlos Gachúz. “Chile’s Economic and Political Relationship with China.” Journal of Current Chinese Affairs 41, 1, 2012. Available online at http://journals.sub.uni-hamburg.de/giga/jcca/article/
view/497.11 Kotschwar, et al. 12 Source: fDi Markets. See Barbara Kotschwar, et al.
Endnotes 4 94 9

13 “China Investment in Peru to Jump 10-Fold by 2018 Castilla Says.” Bloomberg News, July 11, 2013. Available online at http://www.businessweek.com/news/2012-07-11/china-investment-in-peru-to-jump-10-fold-by-2018-castilla-says.
14 In 1992, Shougang purchased the state owned mine at a cost of US$118 million. In addition, Shougang agreed to assume Hierro Peru’s debts (US$42 million), and to invest US$150 million into the mine’s creaking infrastructure (see Barbara Kotschwar,et al.). The initial purchase itself underscored China’s willingness to invest in geopolitical hotspots—a point of interest to present-day Colombia—as Hierro Peru was located in a region still plagued by insurgent violence in 1992.
15 Lisa Wing. “Latin America’s Best Companies.” Latin Trade, November 23, 2011. Available online at http://latintrade.com/2011/11/latin-america%E2%80%99s-best-companies.16 Resentment to the Shougang project began early when the firm opted out of the US$150 million infrastructure investment, preferring instead to pay a penalty between US$12 and US$14 million.
Worker unease stemmed from an initial 50 percent labor cut in the run up to privatization and intensified when Shougang attempted to import migrant laborers. See Amos Irwin and Kevin Gallagher. “Chinese Investment in Peru: A Comparative Analysis.” Tufts University Working Group on Development in the Americas, Discussion Paper Number 34, December 2012. Available online at http://ase.tufts.edu/gdae/Pubs/rp/DP34IrwinGallagherDec12.pdf.
17 In 2009 a 21-year-old construction worker was shot dead as protesters attempted to occupy Shougang land. The fact that the shooting did not lead to any criminal charges remains a sore point for the community and has lent credence to the notion that Shougang operates beyond the control of Peruvian law enforcement. See Simon Romero. “Tensions Over Chinese Mining Ventures in Peru.” New York Times, August 14, 2010. Available online at http://www.nytimes.com/2010/08/15/world/americas/15chinaperu.html?pagewanted=all)
18 Irwin and Gallagher, 14.19 For more information on this project, as well as sources for quoted figures, see Nathaniel Parish Flannery. “Are Chinese Companies in Latin America Paying Attention to Corporate Social
Responsibility?” Forbes, February 24, 2012. Available online at http://www.forbes.com/sites/nathanielparishflannery/2012/02/24/are-chinese-companies-in-latin-america-paying-attention-to-corporate-social-responsibility/; Ryan Dube. “Chinalco Approves $1.32 Billion Expansion of Peru Copper Project.” The Wall Street Journal, June 18, 2013. Available online at http://online.wsj.com/article/BT-CO-20130618-708521.html; and Kotschwar, et al.
20 Barbara Hogenboom. “Mexico vs. China: The Troublesome Politics of Competitiveness.” In Alex Fernández Jilberto and Barbara Hogenboom, ed. Latin America Facing China (New York: Berghahn Books, 2010), 59.
21 Source: Bertelsmann Stiftung Global Economic Dynamics Visualizer, OECD 22 Hernan Kamil and Jeremy Zook. “The Comeback.” International Monetary Fund Finance & Development, March 2013. Available online at
http://www.imf.org/external/pubs/ft/fandd/2013/03/pdf/kamil.pdf.23 Whereas Mexican average wages, adjusted for exchange rate and inflation, were six times those of China in 2003, that figure has been reduced to under one and a half (See Kamil and Zook).24 Adam Thomson. “Mexico: Chin’s Unlikely Challenger,” Financial Times, September 19, 2012. Available online at http://www.ft.com/intl/cms/s/0/9f789abe-023a-11e2-b41f-00144feabdc0.html. 25 Dan Molinski. “Colombia Advances Beijing Trade Pact.” The Wall Street Journal, June 15, 2011. Available online at http://online.wsj.com/article/SB10001424052702303848104576385912135492424.html. 26 Miguel Posada Betancourt. “Inward FDI in Colombia and its policy context, 2012.” (Vale Columbia Center on Sustainable International Investment, June 13, 2012. Available online at
http://www.vcc.columbia.edu/files/vale/documents/Colombia_IFDI_-_FINAL_-_13_June_2012.pdf. 27 Though Colombia has benefited from globally strong commodity prices bolstered by global Chinese demand.
5 05 0

Many people were very gracious with their time and insights during the course of this project. In particular the text benefited from the
support of Pedro Aspe, Felipe Buitrago, Hugo Cervantes, Michael Derham, Gabriel Duque, Cornelius Fleischhaker, Sergio Gomez Lora,
Luisa Gómez Rodríguez, Francisco González, Matthew Kaczmarek, Theodore Kahn, Juan Antonio Ketterer, Barbara Kotschwar, Leonardo
Martinez, Matthew McClymont, Luis Fernando Mejia Alzate, Daniel Millán, Roberto Newell, John Padilla, Lorena Palomo, Guadalupe
Paz, Candace Putter, Juan Mauricio Ramirez, John Paul Rathbone, Maxwell Robbins, Riordan Roett, Vanessa Rubio, Alejandro Vera,
and Edward Vogel.
The paper also benefited from the expertise (and patience) of the Bertelsmann Stiftung’s Global Economic Dynamics team led by Andreas
Esche along with Jan Arpe, Thiess Petersen, and Ulrich Schoof, and from the Bertelsmann Foundation’s Director of Communications,
Andrew Cohen. The project enjoyed additional support from the foundation’s Washington DC team including Annette Heuser, Tyson
Barker, Faith Gray, Anneliese Humpert, Alison Nordin, Joshua Stanton and Kara Sutton. Research Assistants Brian Wenzler and Monica
Wojcik provided rigorous analysis while saving the text from some monumental spelling blunders.
Samuel George3.11.2014
Acknowledgements
Acknowledgements 5 15 1

5 25 2

Graphic Design by BUSSEY CREATIVE

Bertelsmann Foundation1101 New York Avenue, NW, Suite 901 Washington, DC 20005USAmain phone +1.202.384.1980main fax +1.202.384.1984
www.bfna.org