the nimroc samples as reference materials for neutron activation analysis
TRANSCRIPT

Journal o f Radioanalytical Chemistry, Vol. 39 (1977) 323-334
Standard Materials
THE NIMROC SAMPLES AS REFERENCE MATERIALS FOR NEUTRON ACTIVATION ANALYSIS
C. S. ERASMUS, H. W. FESQ, E. J. D. KABLE, S. E. RASMUSSEN, J. P. F. SELLSCHOP
Activation Analysis Research Group, Nuclear Physics Research Unit, University o f the Witwatersrand,
1 Jan Smuts Avenue, Johannesburg, 2001 (South Africa)
(Received November 15, 1976)
The NIMROC reference materials NIM-D, NIM-G, NIM-L, NIM-N, NIM-P, and NIM-S and the precious metal ore PTO-1 have been analysed using thermal and epithermal methods of instrumental neutron activation. The abundances of 40 major, minor and trace elements are reported. The usefulness of the NIMROC reference materials is assessed in terms of the requirements of neutron activation techniques. Of the seven reference materials, NIM-L is the most useful geochemical material for activation analysis. It contains suitably high concentrations of most elements that can be determined, lnhomogeneity problems encountered in PTO-.1 for some elements give emphasis to the difficulty of selecting suitable geological material for ultra-trace elements where small quantities of sample are used.
Introduction
The National Institute for Metallurgy (NIM), South Africa, in collaboration with
the South African Bureau of Standards prepared six rock types, known as the
NIMROC samples, l with the intention of providing a comprehensive range of geo-
chemical reference materials. These samples were designated as follows: NIM-D (dun-
ite chrysotile), NIM-G (granite), NIM-L (lujavrite), NIM-N (norite), NIM-P (pyro-
xenite), and NIM-S (syenite).
Recently - due to the importance and high economic value of precious metals -
a composite sample of the Merensky Reef taken from five localities in the Bushveld
Igneous Complex (South Africa) was prepared by NIM. The main purpose o f this
sample, designated PTO-1, was to provide a reference material o f a precious-metal
ore that could serve to vindicate modifications to existing methods of analysis, to
assess new analytical techniques and to be used in the preparation of secondary
standards for the routine determinations of precious metals, particularly the platinum metals.
J. Radioanal. Chem. 39 (1977) 323 21"

C. S. ERASMUS et al.: THE NIMROC SAMPLES AS REFERENCE
A large number of analysts from several countries contributed to the analysis of these samples, and preferred values, averages, or magnitudes for the major, minor and trace element constituents have been published 2'3 and reported. 4'5
During the past decade neutron activation analysis has found extensive application to geochemical studies of lunar and terrestrial rocks and minerals. 6-1~ In geochemical
investigations it is often desirable to determine the concentrations of many elements.
The multi-element capability of instrumental neutron activation analysis is well suited
for this purpose. Usually up to thirty-five elements may be determined by the use of high-resolution gamma-spectrometry.
The geochemical reference material used should be similar in composition to that of the rock sample under investigation. This enables irradiation and gamma-spectro-
metry of the rock and reference samples to be performed under similar conditions.
This argument is related to the accuracy of the comparator method and has been discussed in more detail by KUNCIR et al.9 and RANDLE. 1~ It is generally con-
sidered that accurately and extensively analysed rocks and minerals best fulfil the requirements for multi-element reference materials.
The object of this contribution is to examine the suitability of these NIM refer- ence materials for instrumental neutron activation analysis.
Experimental Preparation o f samples
The samples supplied as fine powders were dried at 110 ~ for 12 hours prior to weighing aliquots of the samples into irradiation containers. For short irradiations,
100 to 500 mg of sample was loaded into high-purity polyethylene containers, while
for the longer irradiations (1 and 24 hours) quartz ampules were used.
Irradiations
All irradiations were carried out in t h e 2 0 MW Oak Ridge type research reactor
of the South African Atomic Energy Board. For the determination of short-lived iso-
topes samples were irradiated in the pneumatic facility which has a neutron flux of
3- 1013 n �9 cm -2 �9 sec -1 . Irradiations could be done for up to 30 minutes in this facility
with the use of polyethylene irradiation rabbits. For the determination of longer-lived
isotopes (half-lives > 2.5 hours~ see Table 1), the samples in quartz ampules were
sealed in aluminium cans and irradiated for one hour in the hydraulic facility at 9 �9 1013 n �9 cm-2. sec-l . For epithermal activation, the ampules were encapsulated in
cadmium cans of 1.5 mm wall thickness and irradiated in an epithermal flux of 1 �9 1012 n �9 cm -2 �9 sec -1 for 24 hours.
324 J. Radioanal. Chem. 39 (1977)
C. S. ERASMUS et al.: THE NIMROC SAMPLES AS REFERENCE
The advantages of using epithermal irradiation compared to ordinary thermal ac- tivation have been described by STEINNES ~3 and will not be discussed here. It may however be mentioned that the preferential enhancement in the sensitivity of certain elements (gold, uranium and many others), and the lower activity of epithermally ac- tivated samples are features which were exploited in this study.
bTux monitoring
Iron foils wrapped round each sample ampule were used to monitor the neutron flux received by the sample. ~ In this type of flux monitoring errors of approximately one per cent can be expected. In the analysis of the precious-metal sample PTO-1, its iron content was used as an internal standard for normalization purposes.
Gamma-spectrometry
The activated samples were counted on a 45 cm 3 Ge(Li) detector having a resolu-
tion of 2.5 keV for the 1332 keV peak of cobalt-60, and a relative efficiency of 10 per cent. The detector was coupled to a 4000 channel pulse-height analyser calibrated
at 1 keV per channel. Samples were counted at varying distances from the de- tector so as to maximise the count rate. The accumulated spectra were transferred to magnetic tape for subsequent analysis using a modified version of the HEVESY programme. 12 All spectral data were normalised to a counting distance of 10 cm for
comparative purposes.
Calibration standards
U.S.G.S. reference standards - approximately 150 mg of G-2 (granite), GSP-1 (granodiorite), BCR-1 (basalt) and DTS-1 (dunite), and mixed solutions of elements for which there are no mutual gamma-ray interferences, were accurately weighed in separate polyethylene containers and quartz ampules. The solutions were dried in a heated dessicator (40 ~ before sealing.
Peak identification and optimum decay periods
The radionuclides were identified by their characteristic half-lives and gamma energies. ~4 Spectra of the irradiated samples were collected at intervals from 1 minute to 1 hour after irradiation, using counting periods of 300 seconds to deter- mine the short-lived isotopes. The medium and long-lived isotopes were determined
using counting periods of 60 minutes at decay intervals ranging from 3 hours to 60 days. Decay curves of normalised peak areas were plotted for selected peaks and their
half-lives calculated. The errors derived from counting statistics for these selected
z Radioanal. Chem. 39 (1977) 325
C. S. ERASMUS et al.: THE NIMROC SAMPLES AS REFERENCE
I
TO e ~_ a)
105 ~ 76As 559 keY
0 /" 8 I0 Y Days
,o , I , t , I t I , I , I , l L l , I L l i { , I , I-- 1 2 3 Z, 5 6 ? 8 9 10 11 12 13
Days
10 5
10 4
10 3
i 10 6
10 2.
b) ~ 140La 3286keV
If-l ife 12.8 days
_16 ~ ~ '\\ \
0 20 1.0 60 ~ ~, L l J l ~ lOa,YSl L , l'\, } , l l l , l , l , ,....
4 8 12 16 20 24 28 32 36 40 44 48 Days
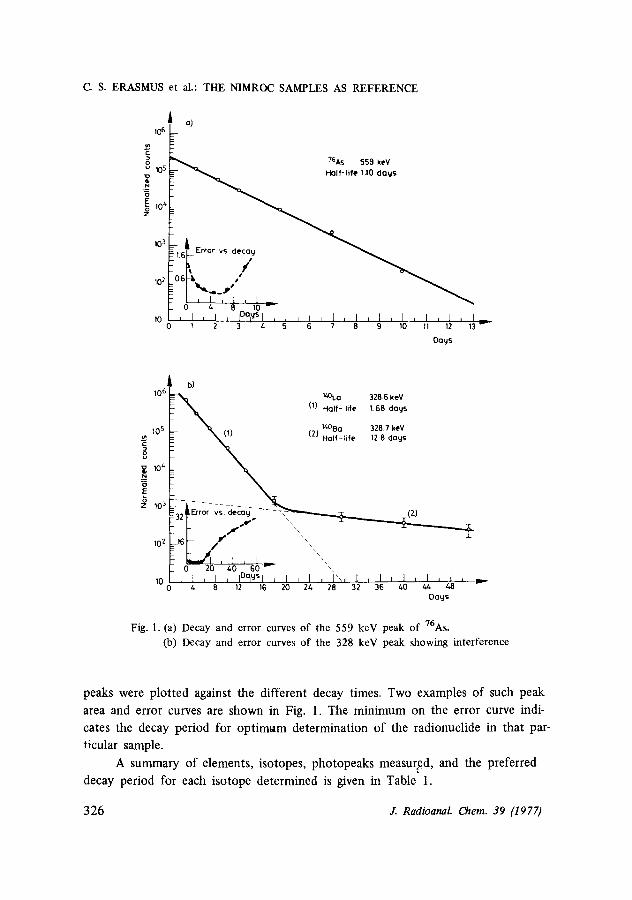
Fig. 1. (a) Decay and error curves of the 559 keV peak of 76As. Co) Decay and error curves of the 328 keV peak showing interference
peaks were plotted against the different decay times. Two examples of such peak
area and error curves are shown in Fig. 1. The minimum on the error curve indi-
cates the decay period for optimum determination of the radionuclide in that par- ticular sample.
A summary of elements, isotopes, photopeaks measured, and the preferred
decay period for each isotope determined is given in Table 1.
326 J. Radioanal. Chem. 39 (1977)

C. S. ERASMUS et al.: THE NIMROC SAMPLES AS REFERENCE
Table 1 Preferred irradiation and decay periods for the analysis of the NIMROC reference materials
Target element
Na
Mg
A1
C1
K
Ca
Sc
Cr
Ti
V
Mn
Fe
Co
Ni
Zn
Ga
As
Br
Rb
Sr
Zr
Sb
Cs
Ba
La
Ce
Nd
Sm
Eu
Product isotope
24Na
27Mg
28AI
Radionuclide half-life
Photopeak measured,
ET, keV
15.0 h
9.45 m
2.31 m
m
h
m
d
d
5.79 m
3.76 m
2.56 h
45.1 d
5.27 y
1368
1014
1779
3 8 0 37.3
42K 12.5
49Ca 8.8
46Sc 83.9
SICr 27.8
SlTi
s2 V
s6 Mn
SgFe
6OCo
1642,2167 10
1525 24
2062 20
889 1 or 24
320 1
320 20
1434 20
847,1811 24
1099,1292 1 or 24
1173,1333 1 or 24
Preferred irradiation
period
s s c o 71.3
6SZn 245.0
72Ga 14.1
76As 26.3
S2Br 35.9
S6Rb 18.7
2.84 h
65.0 d
60.9 d
2.07 y
11.3 d
40.3 h
32.5 d
11.1 d
47.1 h
12.2 y
810
1115
630
559,657
777
1077
24
24
24
1 or 24
24
1 or 24
s 7msr
9521-
124Sb
134Cs
t31Ba
t4OLa
141Ce
147Nd
S3Sm
S2Eu
389
724,757
1691
796
496
1595
145
531
103
1408
24
1 or 24
1 or 24
1 or 24
1 or 24
1 or 24
1 or 24
1 or 24
24
1
l h
20 s
20 s
m
h*
s
h*
h
s
s
h*
h*
h*
h*
h*
h*
h*
h*
h*
h*
h*
h*
h*
h*
h*
h*
h*
h*
h
Preferred decay time
4 d
1 - 2 m
1 - 2 m
l h
6 - 1 2 h
1 - 2 m
20 -40 d
20 -40 d
1 - 2 m
1 - 2 m
6 - 1 2 h
2 0 - 4 0 d
20 -40 d
20 -40 d
20 -40 d
6 - 1 2 h
4 d
4 d
20 -40 d
6 - 1 2 h
20 -40 d
20 -40 d
2 0 - 4 0 d
4 - 1 0 d
4 d
20 -40 d
20 d
6 - 1 2 h
2 0 - 4 0 d
Z Radioanal. Chem. 39 [1977) 327

C- S. ERASMUS et al.: THE NIMROC SAMPLES AS REFERENCE
Table 1 (cont.)
Target element
Tb
Dy
Yb
Lu
Hf
Ta
W
Ir
Au
Th
U
Product isotope
16OTb
16SDy
1 ~syb
* 77Lu
Radionuclide half-life
72.1 d
2.36 h
4.2 d
6.75 d
Photopeak measured,
E~, keV
879
95, 280
396
208
Preferred irradiation
period
1 or 24 h*
10m
I or 24 h*
l h
aSaHf 42.1
t82Ta 115.1
~8~W 1.0
192Ir 74.4
19aAR 2.7
233Pa 27.0
2agNp
d
d
d
d
d
2.35 d
482
1222
686
468
412
300,312
228,278
1 or
1 or
24 h*
24 h*
24 h*
24 h*
24 h*
24 h*
24 h*
Preferred decay time
20-40 d
l h
4 - 1 0 d
4 - 1 0 d
20-40 d
20-40 d
6 - 1 2 h
20-40 d
4 d
20-40 d
4 d
s = seconds, m : minutes, h = hours, d : days, y : years. *Indicates an hour thermal irradiation or a twenty-four hour irradiation in a cadmium con- tainer.
Interferences
Interferences on a photopeak are caused by the presence of other nuclides which
have similar gamma transitions. Instrumentally, these peaks cannot be completely
resolved from one another. This type of interference can be detected from a decay-
curve analysis if the half-lives of the interfering nuclides differ by a factor of two
or more. Once an interference has been identified a correction can be applied providing
the interfering isotope has another peak that can be accurately determined and the branching ratio between the two peaks is known.
The most serious interference of this kind found was that of the 142.5 keV peak of iron-59 on the 145.3 keV peak of cerium-141. A correction based on the ratio of the 142.5 to 1099 keV peak abundances of iron-59 was applied to all the results for cerium. Similarly, other minor interferences were observed and corrected
for.
Reac t ion in te r fe rences occur w h e n two or more react ions p roduce the same iso-
tope. For example in rocks o f low sod ium con t en t , the 24Mg(n, p)24Na reac t ion
o f t en causes a significant in te r fe rence (and apparen t sod ium c o n t e n t ) in the deter-
328 J. Radioanal. Chem. 39 (1977)

(2 S. ERASMUS et al.: THE NIMROC SAMPLES AS REFERENCE
mination of sodium, particularly when using epithermal activation. This is of par-
ticular relevance to NIM-D, NIM-P and PTO-1 and could be corrected for once the concentration of magnesium is known.
Fig. l(b) illustrates the interference by barium-140, which is a fission product of the uranium in the sample, on the determination of lanthanum-140. The ba- rium-140 decays to, and therefore contributes to the lanthanum-140. It was estab- lished that the 1596 keV peak of lanthanum-140 could be used to determine
lanthanum, because at decay periods of shorter than 8 days, an interference error of less than one per cent could be expected.
Results and discussion
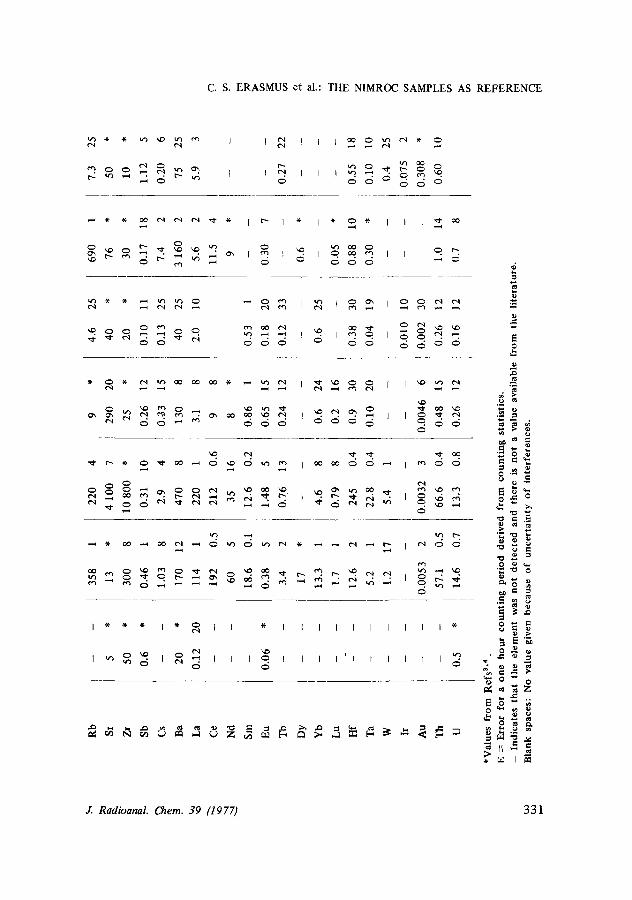
The abundances of 40 major, minor and trace elements in the NIMROC samples
and the precious-metal ore PTO-1, are reported in Table 2. Many of these elements have been determined previously and recommended values were published. 3 ,4 The
concentrations of 32 of the listed elements were determined in this study by ther- mal and epithermal methods of instrumental neutron activation. No values were
previously available for some of these elements notably arsenic, samarium and tungsten. Potassium, manganese, nickel, gallium, arsenic, strontium, samarium, tung- sten, gold and uranium were determined solely by epithermal neutron activation.
The dunite sample, NIM-D, has the lowest abundances or the fewest determin- able constituent elements among these reference samples. Together with NIM-D, the pyroxenite sample NIM-P, has a large abundance of chromium and reasonable levels of iron, cobalt and nickel. Although both samples may serve as useful stand- ards for high concentrations of cobalt, chromium and nickel they are rather unsuit-
able as multi-element standards. At the other extreme is the tujavrite sample NIM-L, which has high abundances
of aluminium, titanium, manganese, arsenic, zirconium, lanthanum, cerium, sama- rium, hafnium, tantalum, tungsten, thorium and uranium relative to the other refer-
ence samples, and therefore it would be useful for instrumental neutron activation
analysis. However, the high sodium content (6.16%) renders this sample unsuitable for the determination of short-lived isotopes, but a large number of elements with long-lived isotopes can be determined to within a few per cent error (see Table 2).
With the exception of zirconium, all the above elements are very sensitive to neu-
tron activation analysis. The granite sample, NIM-G, norite sample, NIM-N, and syenite sample, NIM-S,
have acceptable abundances of most elements determined. Rock materials in general have high aluminium contents which create problems with the neutron activation
analysis of short-lived isotopes (e.g. titanium, magnesium, calcium and vanadium).
J. Radioannl. Chem. 39 {1977] 329

C. S, ERASMUS et al.: THE NIMROC SAMPLES AS REFERENCE
O
z,
o r..)
,.~ o
~ m
2
~ ~ ~ .
~ t'N
�9 . 0 �9
O ~ ~ o ~ ~ d n d d d o d ~
-,x- ~ r * ~ '~- .x- ~ I r
g ~ : ~ ~ : ~ ~ ~ .
O ~ ~
g o
.It- ~ ~ * ~ ~ r
3 3 0 J. Radioanal. Chem. 39 (1977)
C. S. ERASMUS et al.: THE NIMROC SAMPLES AS REFERENCE
r * ~
C~
o oe ~
i I ~ " o 0
I I ~ r - -
~ ~ j ~D
" = _
�9 ~ ~
�9 = ' ~ o �9 . �9 ~ ' ~ _ :
tr~ b.~
I * * * l * ~ l l l * l l l l l l l I I *
o ~ o~
~ N Z
. ~ I
J. Radioanal. Chem. 39 (1977) 3 3 1
C. S. ERASMUS et al.: THE NIMROC SAMPLES AS REFERENCE
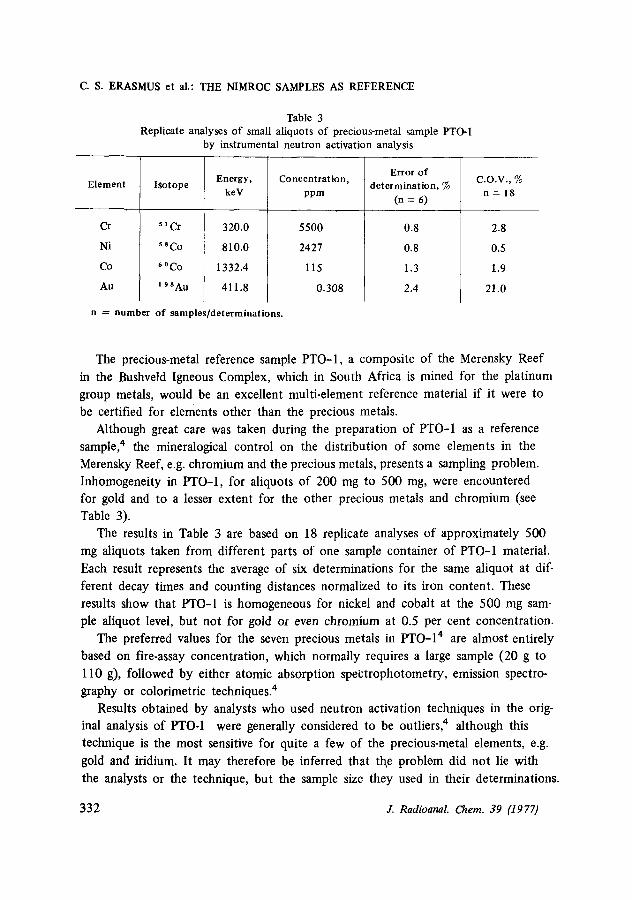
Table 3 Replicate analyses of small aliquots of precious-metal sample PTO-1
by instrumental neutron activation analysis
Element I~otope
Cr
Ni
Co
Au
n = number of sample.,
5~Cr
5 8Co
6OCo
198Au
Energy, keV
Concentration, ppm
320.0
810.0
1332.4
411.8
'determinations.
5500
2427
115
0.308
Error of determination, %
(n = 6)
0.8
0.8
1.3
2.4
c.o.v., % n = 1 8
2.8
0.5
1.9
21.0
The precious-metal reference sample PTO-1, a composite of the Merensky Reef
in the Bushveld Igneous Complex, which in South Africa is mined for the platinum
group metals, would be an excellent multi-element reference material if it were to
be certified for elements other than the precious metals. Although great care was taken during the preparation of PTO-1 as a reference
sample, 4 the mineralogical control on the distribution of some elements in the
Merensky Reef, e.g. chromium and the precious metals, presents a sampling problem. Inhomogeneity in PTO-1, for aliquots of 200 mg to 500 mg, were encountered for gold and to a lesser extent for the other precious metals and chromium (see
Table 3). The results in Table 3 are based on 18 replicate analyses of approximately 500
mg aliquots taken from different parts of one sample container of PTO-1 material.
Each result represents the average of six determinations for the same aliquot at dif-
ferent decay times and counting distances normalized to its iron content. These
results show that PTO-1 is homogeneous for nickel and cobalt at the 500 mg sam-
ple aliquot level, but not for gold or even chromium at 0.5 per cent concentration. The preferred values for the seven precious metals in PTO-14 are almost entirely
based on fire-assay concentration, which normally requires a large sample (20 g to
110 g), followed by either atomic absorption speetrophotometry, emission spectro- graphy or colorimetric techniques. 4
Results obtained by analysts who used neutron activation techniques in the orig- inal analysis of PTO-1 were generally considered to be outliers, 4 although this
technique is the most sensitive for quite a few of the precious-metal elements, e.g.
gold and iridium. It may therefore be inferred that tl~e problem did not lie with
the analysts or the technique, but the sample size they used in their determinations.
332 J. Radioanal. Chem. 39 (1977)

C. S. ERASMUS et aL: THE NIMROC SAMPLES AS REFERENCE
Conclusions
The NIMROC reference materials (NIM-D, NIM-G, NIM-L, NIM-N, NIM-P and NIM--8) and the precious-metal ore (F rO- l ) have been analysed using instrumental neutron activation methods. The abundances of 32 elements were determined in
this study. The analytical photopeaks used were carefully selected by inspection of their
decay curves, hence relatively few corrections for interference effects were neces-
sary. Interferences on the photopeaks used for the determination of chromium, cerium, samarium, ytterbium, lutetium and uranium were observed for certain sam-
pies and appropriate corrections applied.
It is deduced that the ultrabasic rocks NIM-D (dunite) and NIM-P (pyroxenite)
have a limited use as geochemical reference materials in applications of instrumen- tal neutron activation analysis. In contrast NIM-G (granite), NIM-N (norite), and
NIM-S (syenite) samples have acceptable abundances of most of the elements de- termined and are therefore relatively useful reference materials for instrumental neu-
tron activation analysis. NIM-L (lujavrite) is undoubtedly the most useful geochemical reference material
for activation analysis purposes of the NIMROC samples. It contains suitably high
concentrations of most elements that can be determined by this technique. One
disadvantage however, is its high sodium content, which causes some concern for the accurate determination of short and medium-lived isotopes.
The precious-metal reference sample PTO-1, could become an excellent multi- element standard for the analysis of basic rocks if its major, minor and trace ele-
ment composition were to be certified. Inhomogeneity problems were however en-
countered in PTO-1 for some elements determined in the small aliquots (of approx- imately 0.5 g) which are commonly used in instrumental neutron activation methods.
This casts some doubt on the suitability of PTO-1 as a precious-metal reference sample for use in techniques, such as neutron activation analysis, where only small
samples are required. It also outlines the difficulty of selecting geological material for the preparation of ultra-trace element standards for use in highly sensitive ana- lytical techniques.
References
1. B. G. RUSSEL, R. G. GOUDVIS, G. DOMEL, J. LEVIN, T. W. STEELE, Johannesburg, National Institute for Metallurgy, Report No. 1351, 1972.
2. J. TURKSTRA, H. J. SMIT, W. J. de WET, J. S. A. Chem. Inst., 24 (1971) 113. 3. F. J. FLANAGAN, Geochim. Cosmochim. Acta, 37 (1973) 1189. 4. T. W. STEELE, J. LEVIN, L COPELOWITZ, Johannesburg, National Institute for Metallurgy,
Report No. 1696, 1975.
J. Radioanal. Chem. 39 (1977} 333

C. S. ERASMUS et al.: THE NIMROC SAMPLES AS REFERENCE
5. B. T. EDDY, D. C. G. PEARTON, D. M. BIBBY, Johannesburg, National Institute for Metallurgy, Report No. 1762, 1975.
6. S. E. RASMUSSEN, H. W. FESQ, Johannesburg, National Institute for Metallurgy, Report No. 1563, 1973.
7. G. G. GOLES, M. OSAWA, K. RANDLE, R. L. BEYER, D. Y. JEROME, D. J. LINDSTROM, M. R. MARTIN, S. M. McKAY, T. L. STEINBORN, Science, 167 (1970) 497.
8. G. E. GORDON, K. RANDLE, G. G. GOLES, J. B. CORLISS, M. H. BEESON, S. S. OXLEY, Geochim. Cosmochim. Act, a, 32 (1968) 369.
9. J. KUNCIR, J. BENADA, Z. RANDA, M. VOBECKY, J. Radioanal. Chem., 5 (1970) 369. 10. K. RANDLE, Chemical Geology, 13 (1974) 237. 11. D. M. BIBBY, S. E. RASMUSSEN, Radiochem. Radioanal. Letters, 9 (1972) 1. 12. I-L P. YULE, U. S. NBS Spec. Publ. 312, 2 (1968) 115. 13. E. STEINNES, Activation Analysis in Geochemistry and Cosmochemistry, Norway, Univer-
sitetsforlaget, 1971, p. 113. 14. F. ADAMS, R. DAMS, Applied Gamma-Ray Spectrometry, Pergamon, 1970.
334 J. Radioanal. Chem. 39 (1977)