the new stylized facts about income and subjective well-beingftp.iza.org/dp7105.pdf · the new...
TRANSCRIPT
DI
SC
US
SI
ON
P
AP
ER
S
ER
IE
S
Forschungsinstitut zur Zukunft der ArbeitInstitute for the Study of Labor
The New Stylized Facts about Income andSubjective Well-Being
IZA DP No. 7105
December 2012
Daniel W. SacksBetsey StevensonJustin Wolfers

The New Stylized Facts about Income
and Subjective Well-Being
Daniel W. Sacks University of Pennsylvania
Betsey Stevenson
University of Michigan, CESifo and NBER
Justin Wolfers University of Michigan
Brookings, CEPR, CESifo, IZA and NBER
Discussion Paper No. 7105 December 2012
IZA
P.O. Box 7240 53072 Bonn
Germany
Phone: +49-228-3894-0 Fax: +49-228-3894-180
E-mail: [email protected]
Any opinions expressed here are those of the author(s) and not those of IZA. Research published in this series may include views on policy, but the institute itself takes no institutional policy positions. The IZA research network is committed to the IZA Guiding Principles of Research Integrity. The Institute for the Study of Labor (IZA) in Bonn is a local and virtual international research center and a place of communication between science, politics and business. IZA is an independent nonprofit organization supported by Deutsche Post Foundation. The center is associated with the University of Bonn and offers a stimulating research environment through its international network, workshops and conferences, data service, project support, research visits and doctoral program. IZA engages in (i) original and internationally competitive research in all fields of labor economics, (ii) development of policy concepts, and (iii) dissemination of research results and concepts to the interested public. IZA Discussion Papers often represent preliminary work and are circulated to encourage discussion. Citation of such a paper should account for its provisional character. A revised version may be available directly from the author.
IZA Discussion Paper No. 7105 December 2012
ABSTRACT
The New Stylized Facts about Income and Subjective Well-Being* In recent decades economists have turned their attention to data that asks people how happy or satisfied they are with their lives. Much of the early research concluded that the role of income in determining well-being was limited, and that only income relative to others was related to well-being. In this paper, we review the evidence to assess the importance of absolute and relative income in determining well-being. Our research suggests that absolute income plays a major role in determining well-being and that national comparisons offer little evidence to support theories of relative income. We find that well-being rises with income, whether we compare people in a single country and year, whether we look across countries, or whether we look at economic growth for a given country. Through these comparisons we show that richer people report higher well-being than poorer people; that people in richer countries, on average, experience greater well-being than people in poorer countries; and that economic growth and growth in well-being are clearly related. Moreover, the data show no evidence for a satiation point above which income and well-being are no longer related. JEL Classification: D6, I3, J1, O1 Keywords: subjective well-being, life satisfaction, quality of life, Easterlin Paradox,
adaptation, economic growth Corresponding author: Justin Wolfers University of Michigan Weill Hall 735 South State Street Ann Arbor, MI 48109-3091 USA E-mail: [email protected]
* This article was written for a forthcoming volume of Emotion, and seeks to explain to a broader audience the implications of our earlier research on this topic. The authors would like to thank Angus Deaton, Ed Diener, Danny Kahneman, Alan Krueger, Richard Layard and other colleagues for their input on this research program.
1
I. Introduction
How important are absolute and relative income in determining well-being? In a series of
papers, we have studied the relationship between subjective well-being and income, with an eye
towards answering this critical question. We have found that well-being rises with income,
whether we compare people in a single country and year, whether we look across countries, or
whether we look at economic growth for a given country. These results suggest that absolute
income plays a major role in determining well-being. And these data provide, at best, no
evidence that relative income matters much, although equally they cannot rule out that it matters
somewhat. We conclude that if there is a case to be made that relative income is an important
determinant of well-being, it is not to be found in national comparisons of subjective well-being.
Some may find this surprising. Since Easterlin (1974), researchers thought that cross-
country comparisons provided evidence in favor of the primacy of relative income as a
determinant of subjective well-being. In his seminal paper, Easterlin famously asked “Does
economic growth improve the human lot?” He answered: it does not. He began by showing that,
relative to poor people, rich people within a country report greater well-being, as measured by
self-reported happiness, life satisfaction, and related concepts. No-one disputes this observation.
Easterlin argued that comparing this finding to data on well-being and income across
countries can help us determine whether the strong relationship between well-being and income
within countries reflects the advantages conferred by absolute income or rather, one’s relative
position in society. In the absolute income interpretation, greater income is associated with
greater well-being because of the advantages of greater prosperity: higher consumption, more
choices, and fewer constraints for survival. An alternative story, though, is that having more
money than others within a country matters because we like having more money than other
people: we want to have bigger bank accounts, bigger houses, fancier cars than our peers. These
possibilities, of course, are not mutually inconsistent, and well-being may reflect each in some
proportion. But Easterlin pointed to national comparisons, and later time series evidence, to
argue that the relationship between income and well-being derives almost entirely from relative
income concerns.
2
His argument was straightforward. If only absolute income matters, then when everyone
gets richer, everyone’s well-being should rise. But if only relative income matters, then when
everyone gets richer, no one’s well-being should rise, since no one gets richer relative to the
average. This suggests a test: compare (1) the cross-person relationship between well-being and
income within a country to (2) the cross-country relationship or (3) the time series relationship
between growth in well-being and economic growth. If these relationships are about the same,
then it is absolute income that determines well-being. Alternatively, if cross-country and time
series comparisons reveal no correlation between well-being and income, then only relative
income matters. Between these opposing poles, the extent to which the cross-person relationship
is stronger than that revealed by cross-country and time series comparisons reveals the role
played relative income above and beyond that played by absolute income.
Thus, Easterlin (1974) looked at cross-country data, and found a statistically insignificant
relationship between Gross Domestic Product per capita (or GDP, a measure of average income)
and well-being. And looking at economic growth, he again found a statistically insignificant time
series relationship between income and well-being. (See also Easterlin 1995 and Easterlin et al.
2010). Easterlin concluded, therefore, that since across people in a given country, at a point in
time, income and well-being move together, while across countries, they are virtually
independent, only relative income matters.
This conclusion has important implications for policy and for science. If raising income
does not raise well-being, then policy should focus on goals other than economic growth. And
given the central role of relative income, researchers have spent a great deal of time and energy
understanding why relative concerns are so important.
But is Easterlin correct? The accumulation of data over recent decades shows that
Easterlin’s Paradox was based on empirical claims which are simply false. In fact rich countries
enjoy substantially higher subjective well-being than poor countries, and as countries get richer,
their citizens experience ever more well-being. What’s more, the quantitative relationship
between income and well-being is about the same, whether we look across people, across
countries, or at a single country as it grows richer. This fact turns Easterlin’s argument on its
head: if the difference in well-being between rich and poor countries is about the same as the
3
difference in well-being between rich and poor people, then it must be that absolute income is
the dominant factor determining well-being.
II. Cross-Country Comparisons
Our analysis starts with data from the Gallup World Poll, which contains the most wide-
ranging data on well-being available. Every year since 2005, Gallup has drawn representative
samples in nearly every country in the world, and has made extraordinary efforts to collect data
that is comparable across nations. The Gallup World Poll measures subjective well-being with
the question: “Please imagine a ladder with steps numbered from zero at the bottom to ten at the
top. Suppose we say that the top of the ladder represents the best possible life for you, and the
bottom of the ladder represents the worst possible life for you. On which step of the ladder would
you say you personally feel you stand at this time?”
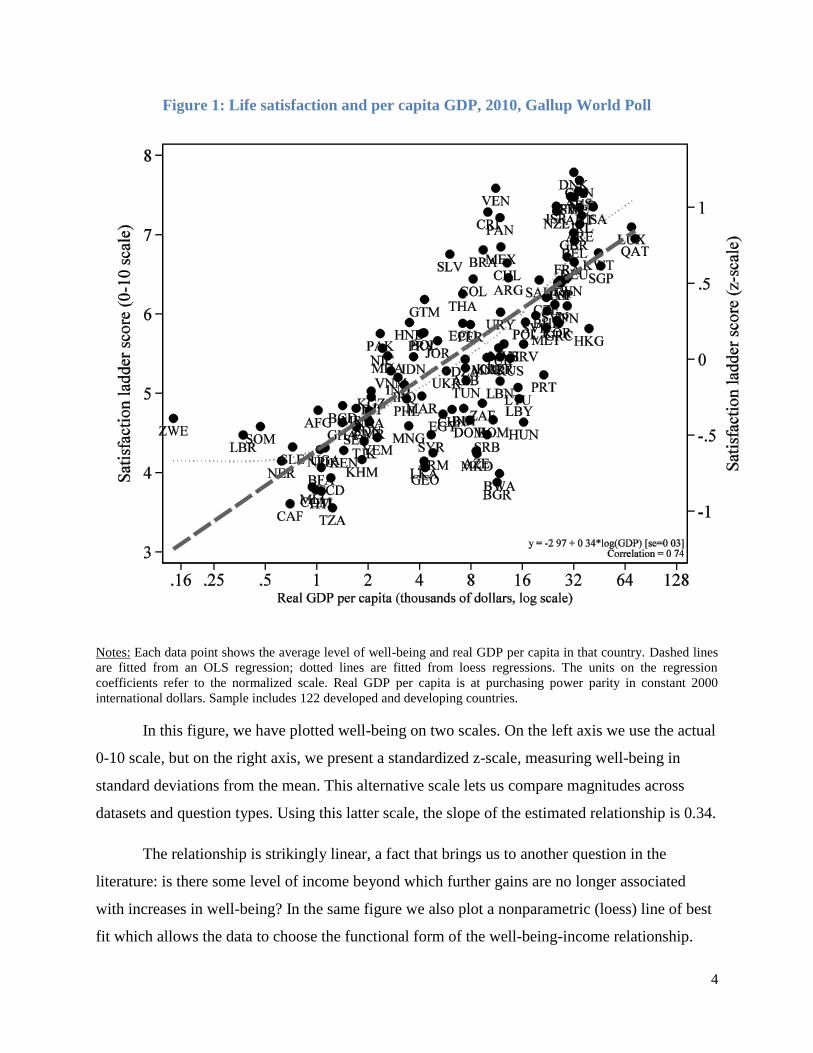
In Figure 1, we plot for all 122 countries sampled in 2010 their average ladder of life
score against a measure of average income—real GDP per capita measured at purchasing power
parity. We plot income on a logarithmic scale, which means that percentage movements in
average income roughly correspond to equal shifts along the horizontal axis. These rich data
reject a null hypothesis of no relationship between average well-being and average income. The
figure shows that citizens of rich countries have higher well-being on average than citizens of
poor countries. The correlation between average well-being and log GDP per capita in 2010 is
0.74; not only is there a clear connection between well-being and GDP, but GDP in fact explains
(in a statistical sense) more than half of the cross-national variation in well-being.
4
Figure 1: Life satisfaction and per capita GDP, 2010, Gallup World Poll
Notes: Each data point shows the average level of well-being and real GDP per capita in that country. Dashed lines
are fitted from an OLS regression; dotted lines are fitted from loess regressions. The units on the regression
coefficients refer to the normalized scale. Real GDP per capita is at purchasing power parity in constant 2000
international dollars. Sample includes 122 developed and developing countries.
In this figure, we have plotted well-being on two scales. On the left axis we use the actual
0-10 scale, but on the right axis, we present a standardized z-scale, measuring well-being in
standard deviations from the mean. This alternative scale lets us compare magnitudes across
datasets and question types. Using this latter scale, the slope of the estimated relationship is 0.34.
The relationship is strikingly linear, a fact that brings us to another question in the
literature: is there some level of income beyond which further gains are no longer associated
with increases in well-being? In the same figure we also plot a nonparametric (loess) line of best
fit which allows the data to choose the functional form of the well-being-income relationship.
5
The loess fit shows that the gradient, if anything, steepens as countries get richer. Well-being
rises with income at all levels of income; satiation does not occur in our data. But of course, the
logarithmic relationship implies that each percent increase in income raises measured well-being
by a similar amount, and hence each extra dollar raises well-being by less than the previous.
That is, going from $1000 to $2000 raises satisfaction by twice as much as going from $2000 to
$3000 and by the same amount as going from $10,000 to $20,000.
III. Within-Country Comparisons
The cross-country evidence is clear that average well-being and average GDP per capita
are tightly related, and that Easterlin’s earlier claim—that there is no correlation—is wrong. But
this does not, by itself, imply that absolute income is very important. If relative income concerns
are key, then comparisons of rich and poor people should yield even starker differences than
comparisons of rich and poor countries—at least if the relevant comparison groups are people
within the same country. That is, the magnitude of the well-being–income gradient seen in the
cross-section of countries should be shallower than that seen in a cross-section of people within a
country. Our research has therefore focused on estimating the magnitudes of the gradient of the
relationship between well-being and income measured within a country at a point in time,
between countries, or in the national time series and testing the hypothesis that there is no
statistically significant difference in these estimates.
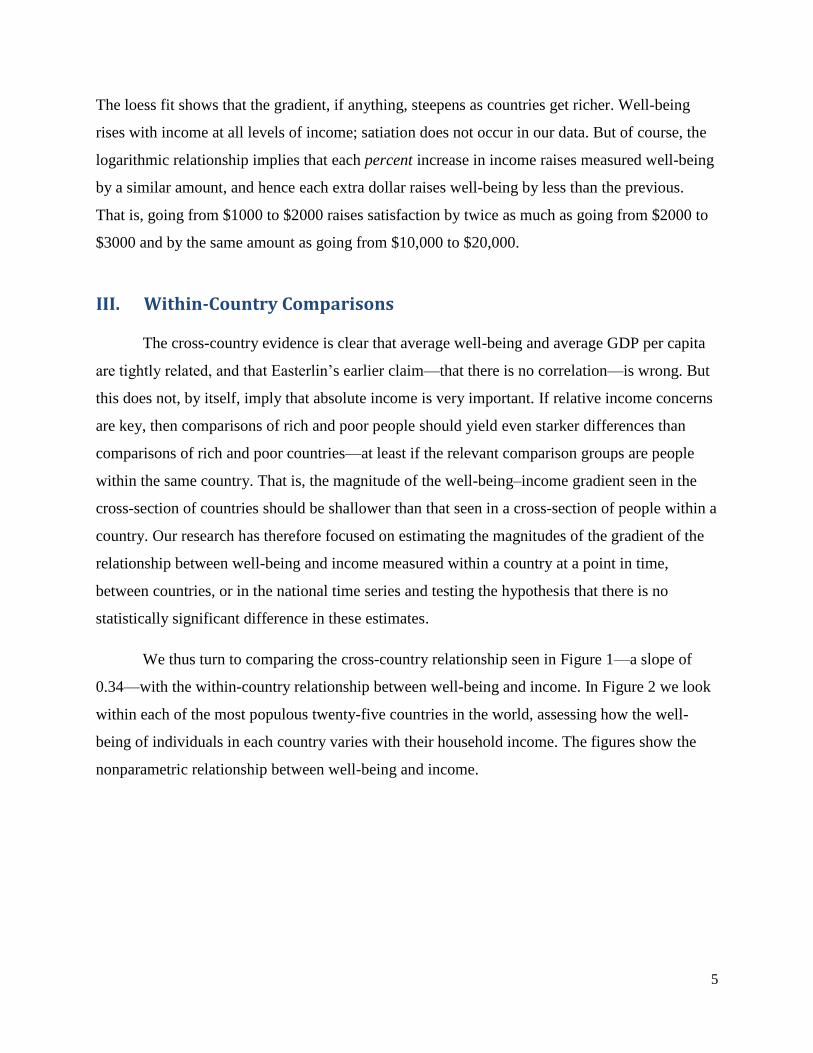
We thus turn to comparing the cross-country relationship seen in Figure 1—a slope of
0.34—with the within-country relationship between well-being and income. In Figure 2 we look
within each of the most populous twenty-five countries in the world, assessing how the well-
being of individuals in each country varies with their household income. The figures show the
nonparametric relationship between well-being and income.
6
Figure 2 Life satisfaction and income in 25 Countries, Gallup World Poll 2010
Notes: Respondents are shown a picture of a ladder with ten steps and asked, “Here is a ladder representing the
‘ladder of life.’ Let's suppose the top of the ladder represents the best possible life for you; and the bottom, the worst
possible life for you. On which step of the ladder do you feel you personally stand at the present time?” The line for
each country is a loess fit showing how individual satisfaction reports vary with household income within that
country. See Sacks, Stevenson and Wolfers (2013) for more details).
Three important facts emerge from Figure 2. First, the lines all slope upward: in each of
the twenty-five countries we see a strong relationship whereby richer people on average report
higher well-being. Second, the lines are roughly parallel. Although these countries represent
many different cultures and languages, the relationship between income and well-being is
quantitatively similar. Finally, there is no evidence of satiation. Just as we saw when making
cross-national comparison, the estimated relationship between well-being and income shows no
sign of flattening at higher levels of income.
7
In the microdata, a regression of (standardized) well-being on income reveals that each
doubling of income increases well-being by 0.34 standard deviations, identical to the cross-
country gradient; this is what we call the within-country well-being–income gradient. Other
surveys yield qualitatively similar conclusions, failing to reject that the cross-country and within
country gradients are the same, even if the estimate gradients aren’t precisely the same. This
pattern is at odds with Easterlin’s claim that the estimated relationship between well-being and
income within a country is steeper than that seen across countries.
Economists tend to argue that well-being varies with long-term income prospects, rather
than year-to-year income fluctuations. But getting a one-time bonus that increases your income
by 50 percent in one year only is very different from a permanent income raise of 50 percent. By
comparison, cross-country differences in GDP per capita are essentially permanent (see e.g.
Acemoglu, 2009, chapter 1). A better comparison might be to adjust the within-country cross-
person gradient to reflect the relationship between well-being and long-term income. Even after
making these adjustments, there’s no compelling case that the within country gradient is steeper
than the cross-country gradient (Stevenson and Wolfers, 2008).
To summarize so far: people in richer countries experience higher well-being than people
in poorer countries, and that difference is about the same in magnitude as the difference in well-
being between rich and poor people within a given country. This conclusion is borne out in our
earlier analysis of data from the World Values Survey, the Pew Global Attitudes Survey, the
International Social Survey Programme and other datasets. In short, cross-national comparisons
show no Easterlin Paradox. Indeed, our re-analysis of data from the 1970s and 1980s suggests
that they never did (Stevenson and Wolfers, 2008).
IV. Comparisons Through Time
The final step in addressing the question of whether economic growth improves the
human lot is to directly assess whether rising GDP per capita is associated with rising average
well-being. If your well-being depends on out-earning your neighbors, then broad-based
economic growth that enriches both you and your neighbors equally would not raise well-being.
By contrast, standard economics suggests that the rising productivity and hence rising absolute
incomes associated with economic growth increases well-being. (Another reason to examine
8
changes through time is if one were concerned that the strong cross-national relationship
between average well-being and average incomes seen in Figure 1 reflected institutional,
environmental, or cultural differences that are associated with both well-being and income.) Thus
our analysis of well-being through time directly addresses whether raising GDP might raise well-
being, and provides further evidence on the well-being-income relationship.
We begin by analyzing the path of well-being over time in Japan, the US, and Europe.
Japan is a useful example because its survey “Life in Nation” has measured some form of
life satisfaction every year since 1958, while its economy grew enormously—by a factor of
nearly 15 between 1958 and 1991. When Easterlin (1974, 1995) examined the data he concluded
that Japan hadn’t gotten any happier. However, while some form of a life satisfaction question
was asked every year, our earlier research showed, simply from translating the question and
response categories, that the questions and scaling of the responses are not directly comparable
in the way that Easterlin and other authors had assumed (indeed as Bob Frank does in this
volume).
In 1964, the top response category changed from “Although I am not innumerably
satisfied with my life, I am generally satisfied with life now” to “Completely satisfied.” The
percent of people selecting the top category fell from 18.3 percent to 4.4 percent with this
change. In 1970 the question itself changed; instead of asking “How do you feel about life at
home?” it asked “How do you feel about your life now?” Measured well-being again fell. When
a given question and set of responses are available for a consistent period, these Japanese data
reveal a clear increase in satisfaction over time, which is interrupted only by these changes in the
survey instrument. Taking simple accounting of these changes in the questionnaire shows clearly
that well-being increased with GDP in Japan (Stevenson and Wolfers, 2008).
European countries have been the focus of much analysis because of the availability of
data from the Eurobarometer survey, which has measured life satisfaction across the European
Union since 1973. Like the early cross-country studies, initial studies of changes in well-being
over time across Europe suffered from too little variation to draw conclusions in either direction.
Easterlin (1995), for instance, was unable to reject a hypothesis of no change in well-being over
time. However, the accumulation of additional years of data has shown that one can clearly
9
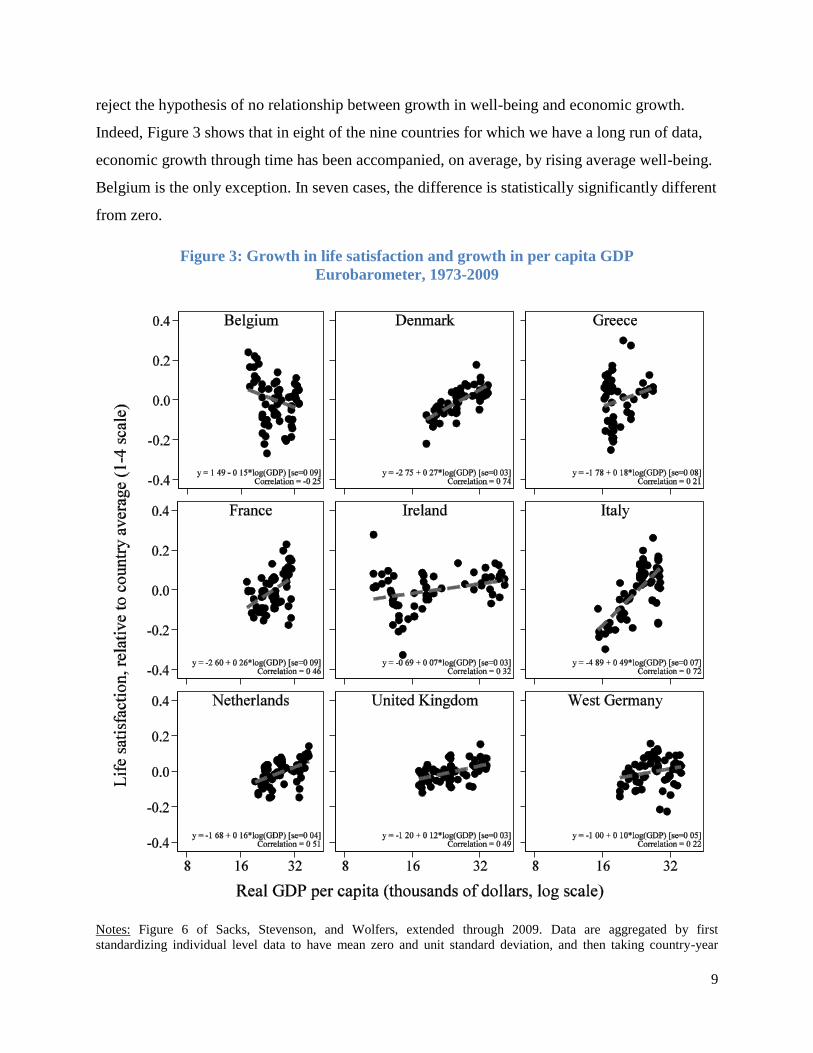
reject the hypothesis of no relationship between growth in well-being and economic growth.
Indeed, Figure 3 shows that in eight of the nine countries for which we have a long run of data,
economic growth through time has been accompanied, on average, by rising average well-being.
Belgium is the only exception. In seven cases, the difference is statistically significantly different
from zero.
Figure 3: Growth in life satisfaction and growth in per capita GDP
Eurobarometer, 1973-2009
Notes: Figure 6 of Sacks, Stevenson, and Wolfers, extended through 2009. Data are aggregated by first
standardizing individual level data to have mean zero and unit standard deviation, and then taking country-year
10
averages of the standardized values. Dashed lines are fitted from the reported OLS regression; Newey-West standard
errors (se) are reported, accounting for first-order autocorrelation. The life satisfaction question asks, “On the whole,
are you very satisfied, fairly satisfied, not very satisfied, or not at all satisfied with the life you lead?” GDP per
capita is at purchasing power parity in constant 2000 international dollars. See Sacks, Stevenson, and Wolfers
(2013) for more details.
The US, however, remains a paradoxical counter-example: GDP has approximately
doubled since 1972 and well-being, as measured by the General Social Survey, has decreased
slightly. There are a few things to note about the US. The first is simply that as with any
particular country there may be all sorts of social changes that are occurring that may either
generate rising or falling well-being. This is what makes it difficult to draw general conclusions
from the experience of just one country. The second is to highlight a particular social issue that
has occurred in the US: changing inequality. While the average income has increased by 0.8 log
points, the average of log income in the General Social Survey—which is what we would expect
to influence well-being—has increased by only 0.17. That is, perhaps the well-being of those
Americans in this survey has not grown much, because few survey respondents shared in the
fruits of rising GDP. In European countries, inequality has increased by half this amount, or less
(Krueger et al., 2009). When we look at the relationship between average annual well-being and
the average income of the survey respondents, we find that neither the Easterlin Paradox can be
rejected nor can a hypothesis that well-being rose with increases in income. We suggest that the
US is more of an interesting outlier than a key example.
These three case studies of Japan, Europe and the US do not lend themselves to definitive
findings. Thus, we turn to the broadest set of intertemporal comparisons available, in the World
Values Survey. As we have detailed elsewhere, in order to make valid comparisons, we focus
only on countries with nationally-representative samples. Each panel in Figure 4plots changes in
well-being and GDP per capita over different time periods. These are clearly noisy data. But they
are also suggestive of a positive relationship between economic growth and rising well-being.
The estimated slope varies across panels and is not always statistically significantly different
from zero. Equally, a precision-weighted average is 0.43, and in no case can we reject the
hypothesis that the coefficient equals the 0.34 slope seen earlier. That is, these time series
comparisons are consistent with our earlier cross-country and cross-sectional estimates.
11
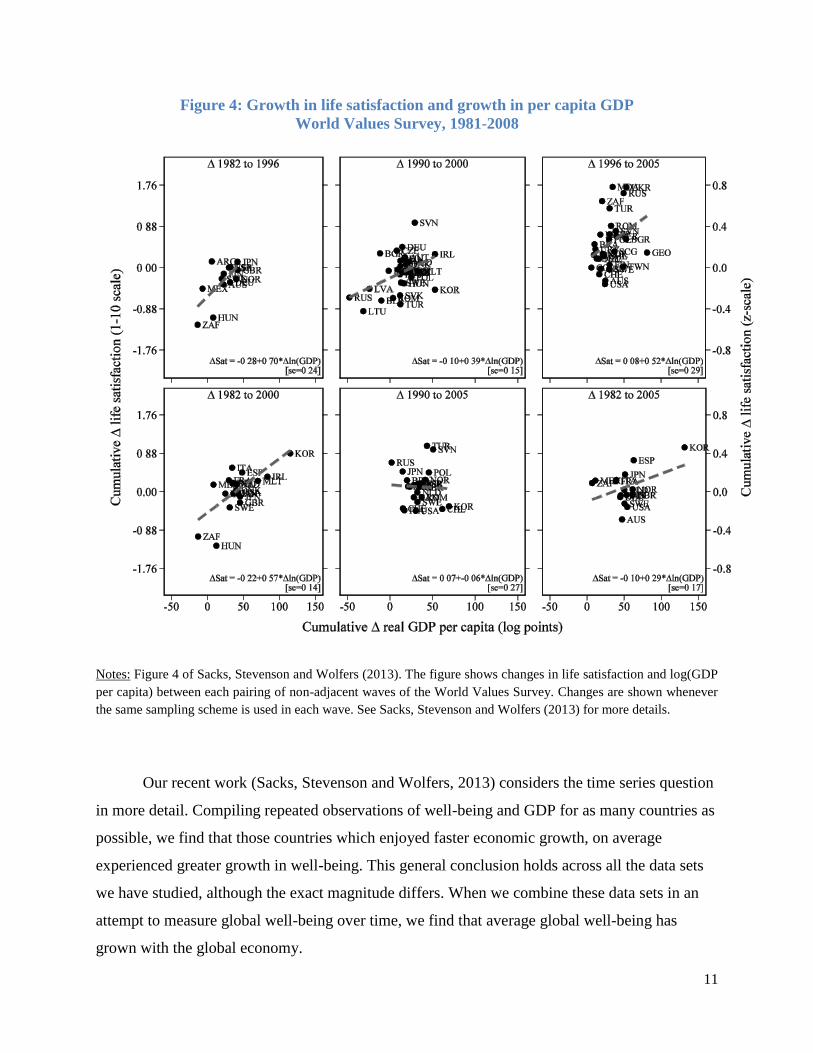
Figure 4: Growth in life satisfaction and growth in per capita GDP
World Values Survey, 1981-2008
Notes: Figure 4 of Sacks, Stevenson and Wolfers (2013). The figure shows changes in life satisfaction and log(GDP
per capita) between each pairing of non-adjacent waves of the World Values Survey. Changes are shown whenever
the same sampling scheme is used in each wave. See Sacks, Stevenson and Wolfers (2013) for more details.
Our recent work (Sacks, Stevenson and Wolfers, 2013) considers the time series question
in more detail. Compiling repeated observations of well-being and GDP for as many countries as
possible, we find that those countries which enjoyed faster economic growth, on average
experienced greater growth in well-being. This general conclusion holds across all the data sets
we have studied, although the exact magnitude differs. When we combine these data sets in an
attempt to measure global well-being over time, we find that average global well-being has
grown with the global economy.
12
V. Conclusions and Reconciliation with the Earlier Literature
Our research program has clarified the relationship between well-being and income, and
we conclude with five stylized facts. First, richer people report greater well-being than poorer
people. Second, richer countries have higher per capita well-being than poorer countries. Third,
economic growth over time is related to rising well-being. Fourth, there is no satiation point
beyond which the relationship between income and well-being diminishes. And fifth, the
magnitude of these relationships is approximately equal. Together, these facts suggest an
important role for absolute income, since the cross-person, cross-country, and time series
relationships are approximately equally strong. This fact by itself also suggests that relative
income is less important, although our results are not precise enough to rule out a meaningful
role for relative income in well-being.
Why do our results differ from Easterlin’s and the earlier literature? When scholars began
studying comparative well-being in the 1970s, data was only available for a handful of countries.
Consequently Easterlin (1974) failed to find a statistically significant relationship between well-
being and GDP—although in fact the estimated relationship was positive. This failure to obtain
statistically significant findings reflected the limited power of a test based on a small sample of
countries, rather than a finding of a precisely estimated nil relationship. Indeed, Easterlin’s
original data also fail to reject the null that the cross-country relationship equals the cross-person
relationship (Stevenson and Wolfers, 2008). In other words he could reject neither the presence
of the Easterlin Paradox nor the complete absence of any such paradox. There was simply too
little data to have the precision necessary to reach a conclusion in either direction. Over ensuing
decades new data has emerged and our research has used these newly available data to precisely
estimate the cross-country relationship between well-being and income. Time series comparisons
have remained the last and most challenging issue in the debate over well-being and income. As
with the cross-national comparisons in the 1970s the scarcity of consistent well-being data over
time has made it difficult for researchers to come to any firm conclusions. While many
researchers have failed to find evidence of average well-being rising with GDP, this largely
reflects insufficient statistical power to reject the null hypothesis that the effects are nil; this
same imprecision means that they also fail to reject the null hypothesis that the time series
13
relationship between well-being and income is of a similar magnitude as that seen in the cross-
country comparisons.
Our research takes advantage of the dozens of datasets covering thousands of country-
years and millions of people to overcome this difficulty. And, sensitive to the difference between
a precise zero and a large but statistically insignificant number, we focus on quantitative
comparisons, rather than statistical significance.
We have come to rather different conclusions than Frank (2012) who cites diverse
examples from biology, labor economics, and personal experience to conclude that “it is virtually
certain that relative income matters.” Frank’s argument, therefore, is that a host of considerations
lead him to believe that relative income matters at least a little. Notice, however, that systematic
analysis of well-being aggregates does not support such a claim, even if it also fails to reject it.
Perhaps more importantly: how much does relative income matter? Knowing the quantitative
importance of relative-vs-absolute income is central to answering Easterlin’s question “Does
economic growth improve the human lot?” No amount of anecdotes, or biological theories, can
answer this question. This is why we turn to the surveys of subjective well-being, which both
provide some direct evidence—GDP and well-being grow together—as well as some
quantitative results, which suggest a key role for absolute income.
References
VI. References
Acemoglu, Daron. 2009. Introduction to Modern Economic Growth. Princeton: Princeton
University Press.
Easterlin, R. A. 1974. “Does Economic Growth Improve the Human Lot? Some Empirical
Evidence,” In P. A. David and M. W. Reder (Eds.), Nations and Households in Economic
Growth: Essays in Honour of Moses Abramovitz (New Yok and London: Academic Press: 1974).
Easterlin, R. A. 1995. “Will Raising the Incomes of All Increase the Happiness of All.” Journal
of Economic Behavior and Organization, 27:1, 35-47.
Easterlin, R.A., L.A. McVey, M. Switek, O. Sawangfa, and J.S. Smith. 2010. “The happiness-
income paradox revisited.” PNAS, 107:52, 22463-22468.
Frank, Robert H. 2012. “The Easterlin Paradox Revisited.” Emotion, 12(6).
Krueger, D., F. Perri, L. Pistaferri and G. Violante. “Cross-sectional Facts for
Macroeconomists.” Review of Economic Dynamics, 13:1, 1-14.
Sacks, D.W.; B. Stevenson, and J. Wolfers. 2013. “Growth in Income and Subjective Well-Being
over Time.” mimeo, University of Michigan.
Stevenson, B. and J. Wolfers. 2008. “Economic Growth and Subjective Well-Being:
Reassessing the Easterlin Paradox.” Brookings Papers on Economic Activity 2008:1, 1-84.