the new drink pyramid - · pdf file• the new drink pyramid is a . combination! – it...
TRANSCRIPT

The NEW Drink Pyramid 2013 WV School-Community
Oral Health Conference © 2013
D.N. Stone, DMD [email protected]

The NEW Drink Pyramid
• Who? • What? • When? • Where? • Why? • How?

WHO?
Dr. Nikki Stone created the Drink Pyramid in 2000 after frustration with the oral health effects demonstrated in the caries rates of the children she served in her dental outreach program.

WHO? Dr. Laura Hancock first learned about the Drink Pyramid in 2009 when collaborating with Dr. Stone on outreach efforts by the University of Kentucky. The Drink Pyramid became an active tool for patient education. She became obsessed with seeing the good news of the Drink Pyramid reach more communities!

Spencer
Lincoln
Adair
Allen
Anderson
Ballard
Barren
Bath
Bell
Boone
Bourbon
Boyd
Boyle
Bracken
Breathitt
Breckinridge
Bullitt
Butler
Caldwell
Calloway
Campbell
Carlisle
Carroll
Carter
Casey
Christian
Clark
Clay
Clinton
Crittenden
Cumberland
Daviess
Edmonson
Elliott
Estill
Fayette
Fleming
Floyd
Franklin
Fulton
Gallatin
Garrard
Grant
Graves
Grayson
Green
Greenup
Hancock
Hardin
Harlan
Harrison
Hart
Henderson
Henry
Hickman
Hopkins
Jackson
Jefferson
Jessamine Johnson
Kenton
Knott
Knox
Larue
Laurel
Lawrence
Lee
Leslie Letcher
Lewis
Livingston
Logan
Lyon Mccracken
Mccreary
Mclean
Madison Magoffin
Marion
Marshall
Martin
Mason
Meade Menifee
Mercer
Metcalfe
Monroe
Montgomery
Morgan
Muhlenberg
Nelson
Nicholas
Ohio
Oldham
Owen
Owsley
Pendleton
Perry
Pike
Powell
Pulaski
Robertson
Rockcastle
Rowan
Russell
Scott
Shelby
Simpson
Taylor
Todd Trigg
Trimble
Union
Warren
Washington
Wayne
Webster
Whitley
Wolfe
Woodford
UK’s East and West Dental Outreach
Programs
Since 2009 Since 2006

East Data
• Program in operation since 2006. • Seven full years of data. • Untreated tooth decay rates much higher than
state survey & national norms. • Urgent dental needs much higher than state
survey. • Prevention and partnerships are helping to
bring both untreated tooth decay and urgent dental needs DOWN!

Baseline Data • 68% of elementary school children and 58% of Head Start children
had untreated tooth decay – Compared to a national rate of 26%
• 22% of elementary school children and 19% of Head Start children had urgent dental needs (pain, infection, rampant) – Compared to a state rate of 4%
• Healthy People 2010 (HP2010) goals for pre-school and elementary school aged children for untreated tooth decay were significantly lower than the baseline data indicated.


Perry Elementary Schools Untreated Tooth Decay Rates
0
10
20
30
40
50
60
70
80
Urgent Decay Early Decay Urgent Early
68%
22%
59% 56% 55%
Untreated tooth decay Rates in Perry children have decreased 13%!
Urgent dental needs in Perry children have decreased 8%!
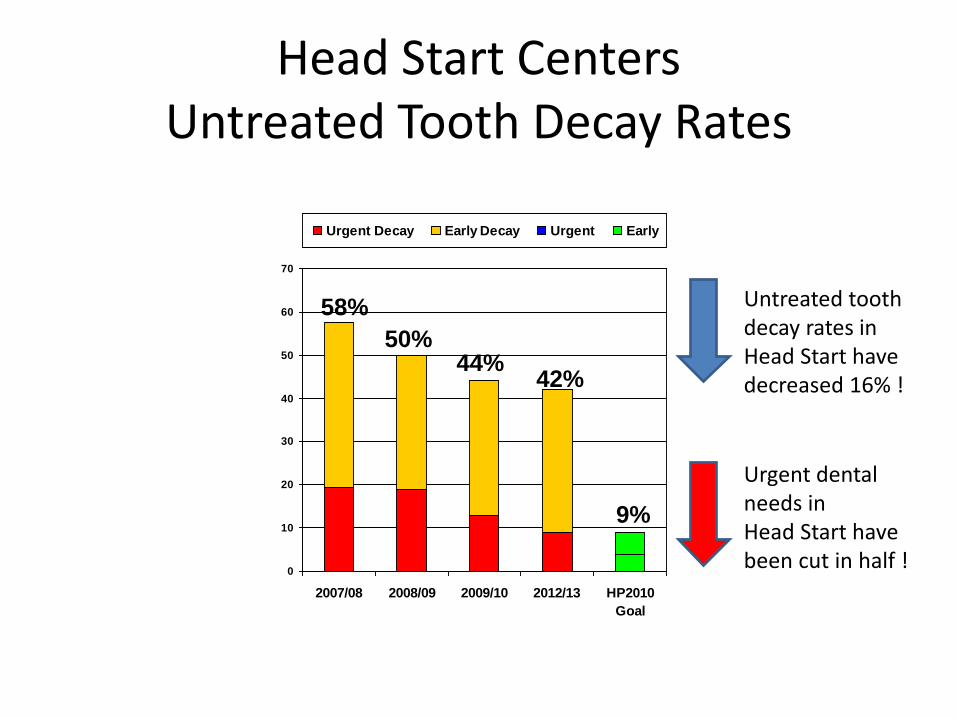
Head Start Centers Untreated Tooth Decay Rates
0
10
20
30
40
50
60
70
2007/08 2008/09 2009/10 2012/13 HP2010Goal
Urgent Decay Early Decay Urgent Early
9%
58% 50%
44% 42%
Untreated tooth decay rates in Head Start have decreased 16% !
Urgent dental needs in Head Start have been cut in half !

Untreated Tooth Decay Compared with National Data (NHANES)
010203040506070
White Black MexicanAmerican
WESTKENTUCKY
EASTKENTUCKY
AmericanIndian
HP2010 Goal
Pre-School (ages 2-5)
Second highest decay rates in the nation !

Now Laura is going to talk about
Family Behaviors The American Diet
Obesity Rates
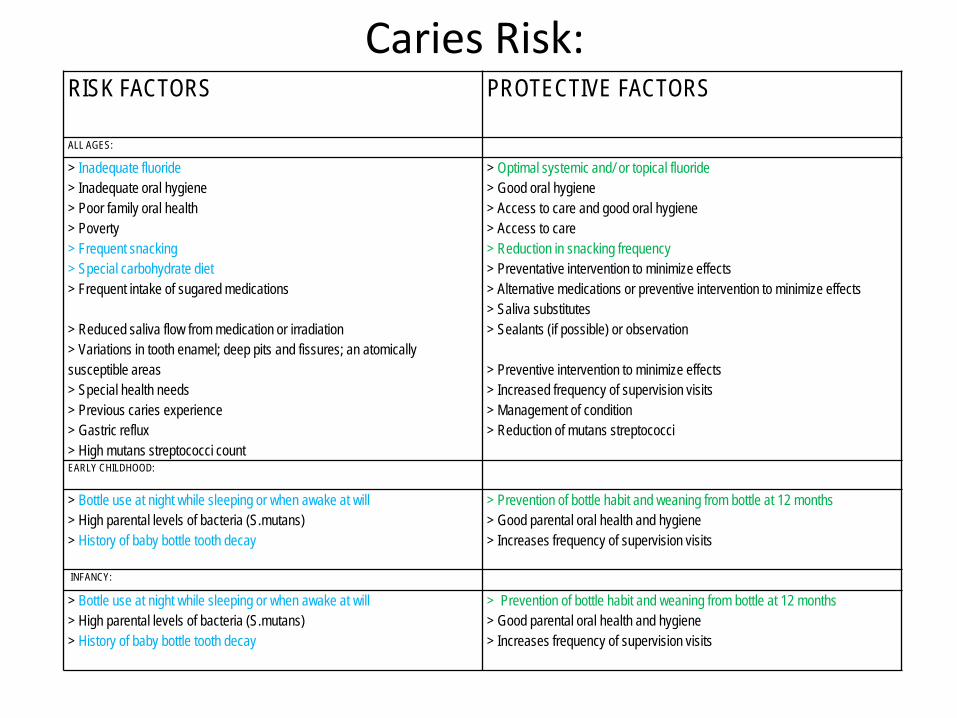
RISK FACTORS
PROTECTIVE FACTORS
ALL AGES:
> Inadequate fluoride > Inadequate oral hygiene > Poor family oral health > Poverty > Frequent snacking > Special carbohydrate diet > Frequent intake of sugared medications > Reduced saliva flow from medication or irradiation > Variations in tooth enamel; deep pits and fissures; an atomically susceptible areas > Special health needs > Previous caries experience > Gastric reflux > High mutans streptococci count
> Optimal systemic and/ or topical fluoride > Good oral hygiene > Access to care and good oral hygiene > Access to care > Reduction in snacking frequency > Preventative intervention to minimize effects > Alternative medications or preventive intervention to minimize effects > Saliva substitutes > Sealants (if possible) or observation > Preventive intervention to minimize effects > Increased frequency of supervision visits > Management of condition > Reduction of mutans streptococci
EARLY CHILDHOOD:
> Bottle use at night while sleeping or when awake at will > High parental levels of bacteria (S.mutans) > History of baby bottle tooth decay
> Prevention of bottle habit and weaning from bottle at 12 months > Good parental oral health and hygiene > Increases frequency of supervision visits
INFANCY:
> Bottle use at night while sleeping or when awake at will > High parental levels of bacteria (S.mutans) > History of baby bottle tooth decay
> Prevention of bottle habit and weaning from bottle at 12 months > Good parental oral health and hygiene > Increases frequency of supervision visits
Caries Risk:

From 12-24 months, the child assumes the eating habits of the family— The Feeding Infants and Toddlers Study J Amer Diet Assoc Jan 2004

www.kentuckyhealthfacts.org/data/topic/map.aspx?ind=47
County Prevelance of Overweight (% Adults)
Prevelance of Obesity (% Adults)
Leslie - EAST 75 37
Perry- EAST 73 38
Knott- EAST 72 36
Letcher- EAST 75 37
Hopkins - WEST 70 31
Where are those adults with a healthy weight?????

CDC 2007-2009 County Obesity Prevalence Among Low-Income Children Aged 2 to 4 Years

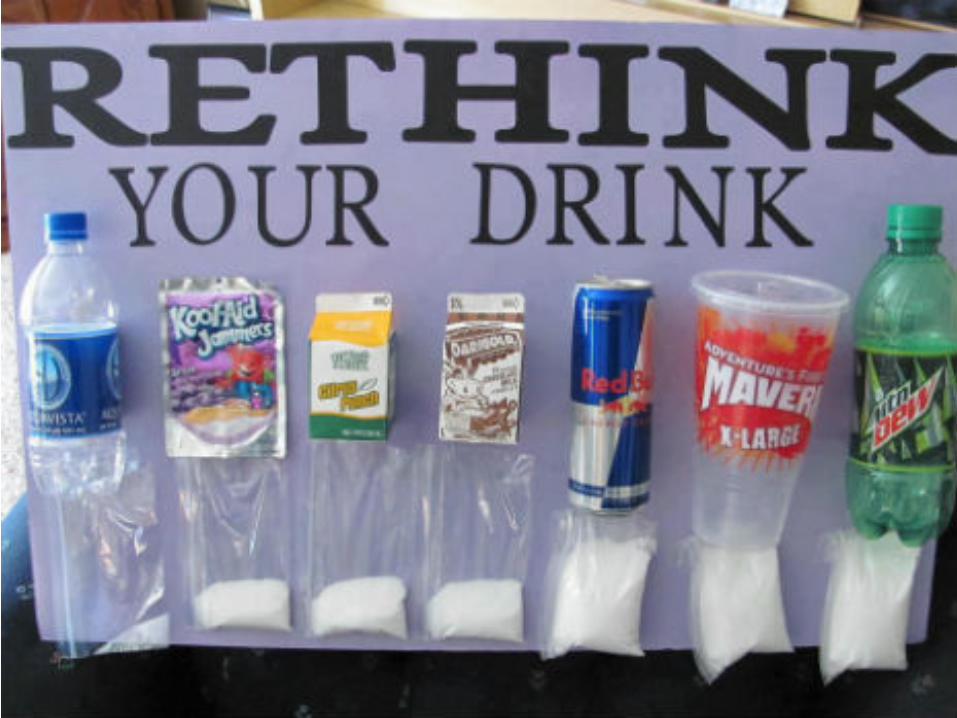
• Sugar-sweetened beverages (SSBs) are the LARGEST source of added sugar and calories in the US population, especially among youth.
• Rather than an occasional treat, SSBs have become an essential part of the US diet. – In 2009, the average American consumed
45 gallons of SSBs! • Even more for low-income Americans…

When Who SSBs as Daily Calories
1965 All Americans Only 2 %
2010
All Americans 11 %
Adolescents aged 12-19
13 %
Low-Income 16 %

• Health conditions associated with SSBs: – Obesity/Overweight – Diabetes – High Cholesterol – Heart Disease – Cancer – Liver Disease – Gout – Osteoporosis – Tooth Decay

• You consume a sugar-sweetened beverage.
• You have an insulin response! The “HIGH.”
• Then a rapid drop in blood sugar… The “LOW.”
• You feel hungry again!
• You INCREASE food consumption!
• Over time, you GAIN WEIGHT! (15lb./year/pop)
Doesn’t this sound like what happens to a DRUG addict ?? Maybe this is why the old folks called it DOPE !

• Americans are STARVING themselves to DEATH while getting BIGGER and BIGGER! – Drinking SSBs replaces (and therefore displaces)
healthy beverage options. • Milk consumption has declined.
– Liquid calories DO add extra calories BUT they DO NOT supply any extra nutrition.
• So, the body is “starving” for nutrients while it is “full” of calories.


Now Nikki is going to talk about
The development of the Drink Pyramid

The Pyramids & Plates
• 1916 – first USDA food guide published • 1974 – first food pyramid in Sweden • 1992 – first US Food Guide Pyramid • 2005 – revised version www.MyPyramid.gov • 2011 – revised to www.ChooseMyPlate.gov

The Pyramid
• The original US food pyramid was very effective. – In the 20 years since it’s introduction, America learned
and listened: • 7% decrease in saturated fat consumption • 21% decrease in cholesterol consumption • 4% lower blood cholesterol • Decrease in US death rates for heart disease
• The original pyramid shape proved itself to be the most effective tool for communicating the concepts of moderation and proportion.

The Plate
• The newer MyPyramid and MyPlate icons have not been thoroughly tested, but have been criticized for being accessible only to high-income households with internet access and computer skills. – The websites are complicated, confusing, and
cumbersome. – However, did you know that the PLATE icon is very
similar to the BOWL that 3,000 polled Americans chose over the pyramid before it was first released.

The Drink Pyramid
• The new Drink Pyramid is a combination! – It includes the plate/bowl concept preferred by
Americans in that it incorporates the visible cups filled with various drinks.
– And it also incorporates the simplicity and recognition of the pyramid design to promote the concept of proportion and moderation.

WHEN? • The Drink Pyramid
– was developed in 2000 – was revised first in 2009 – was revised again in 2010 – was copyrighted in its final version in 2013
• The Drink Pyramid has been piloted in several locations throughout Kentucky with remarkable success and has received national spotlight for its message!

2013 The Drink Pyramid is officially here!!!

The Drink Pyramid was developed by a dentist, and has obvious oral health benefits, but can
also be a useful tool in targeting obesity, diabetes, and general health behaviors.

The Drink Pyramid
• Simple. • Straightforward. • Easy for children and adults with low literacy
levels to understand. • Include both words and pictures to convey
messages. • Include mnemonic letter cues to help aid in
memorization.

The Drink Pyramid • W/W: Water Whenever
– 7 water glasses are pictured to represent the recommended “6-8 glasses per day.”
• M/M: Milk with Meals – 3 milk glasses are pictured to represent the typical three
meals per day in American diets. • J/J: Juice Just once a day
– Just 1 glass of juice is pictured to represent the AAP recommendation for only one serving of juice per day.
• P/P: Pop only at Parties – Only 1 glass of pop is pictured to emphasize the
importance of saving pop only for special occasions and not for daily consumption.
• Alternate wording for northeastern populations: Soda Sometimes.

Remember….
• Sugar-sweetened beverages (SSBs) are the LARGEST source of added sugar and calories in the US population, especially among youth.
• Rather than an occasional treat, SSBs have become an essential part of the US diet. – In 2009, the average American consumed
45 gallons of SSBs! • Even more for low-income Americans…

• HOW can this be possible? HOW can this be true? 45 gallons a year, seriously?!
• Are all these statistics true? Are low income kids really consuming enough SSBs to make up 16% of their diet? – There’s only one way to find out, ASK THE KIDS!

KENTUCKY KIDS
• We asked the kids in EAST KY: – What did you drink this MORNING
• before you came to school?
– What did you drink LAST NIGHT • when you got home from school?
• Then Laura asked the kids in WEST KY too…

But before we ask them, what answers are we looking for? What do the “experts” say they SHOULD be drinking? • American Academy of Pediatrics recommends:
– Ages 1-6 • Only 4-6 ounces a day of SSBs (this includes fruit juice!)
– That’s ½ CUP
– Ages 7-18 • Only 8-12 ounces a day of SSBs (this includes fruit
juice!) – That’s 1 CUP, NOT a super-size!
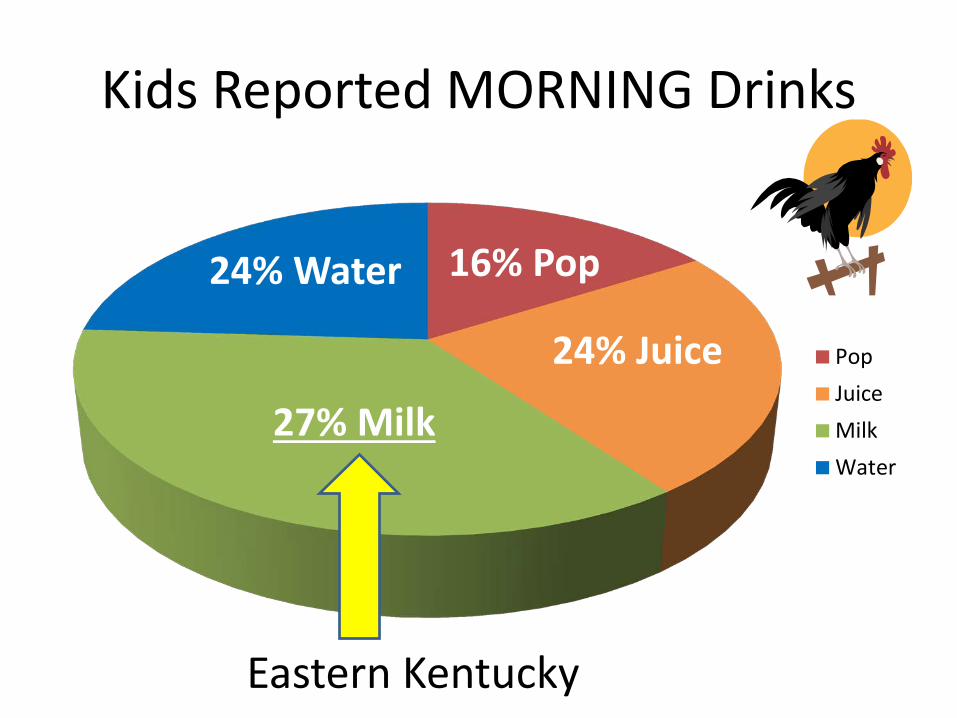
Kids Reported MORNING Drinks
PopJuiceMilkWater
27% Milk
24% Water 16% Pop
24% Juice
Eastern Kentucky

Kids Reported MORNING Drinks
[CATEGORY NAME]
[PERCENTAGE]
PopJuiceMilkWaterNothing
48% Milk
23% Water 5% Pop
16% Juice
Western Kentucky

Kids Are Drinking MILK with Breakfast
Breakfast Drinks
PopJuiceMilkWater
MOSTLY MILK

Kids Reported NIGHT Drinks
PopJuiceMilkWater
15% Milk
29% Water 40% Pop
16% Juice
Eastern Kentucky

Kids Reported NIGHT Drinks
PopJuiceMilkWater22% Milk
36% Water
19% Juice
20% Pop
Western Kentucky

Kids Are Drinking POP with Dinner
Dinner Drinks POP in East KY
WATER in West KY
PopJuiceMilkWater
EAST: POP
WEST: WATER

Untreated Tooth Decay Compared with National Data (NHANES)
010203040506070
White Black MexicanAmerican
WESTKENTUCKY
EASTKENTUCKY
AmericanIndian
HP2010 Goal
Pre-School (ages 2-5)
Drink Behaviors Do Matter!!!!!!

What Kind of Sugar Sweetened Beverages are Kids Drinking? (eastern Kentucky)
1. Gatorade !!! 2. Mountain Dew 3. Pepsi 4. Sprite 5. Tea 6. Kool Aid 7. Diet Mountain Dew 8. Nehi Peach 9. Orange Crush 10. Mondo 11. Fruit Punch 12. Hi-C 13. Tea 14. Lemonade

Where do kids get SSBs like POP?
• The MAJORITY of SSBs are consumed in the HOME! Parents are buying them in alarming quantities!
– Only 1-5% come from vending machines or school cafeterias.

SSBs Policy Questions????
– The US Supplemental Nutritional Assistance Program spends between $1.7-$4 billion each year on SSBs.
– So far, the USDA has rejected all waiver requests to prohibit the purchase of candy and soft drinks with SNAP benefits (Minnesota, New York, South Carolina, and 5 more states have tried and failed so far).
• “The USDA has said there are no clear standards in defining foods as healthy or unhealthy, and trying to restrict food purchases would be too expensive and difficult since many new products are introduced each year.”

Now Laura is going to talk about
Using the Drink Pyramid In West KY

Spencer
Lincoln
Adair
Allen
Anderson
Ballard
Barren
Bath
Bell
Boone
Bourbon
Boyd
Boyle
Bracken
Breathitt
Breckinridge
Bullitt
Butler
Caldwell
Calloway
Campbell
Carlisle
Carroll
Carter
Casey
Christian
Clark
Clay
Clinton
Crittenden
Cumberland
Daviess
Edmonson
Elliott
Estill
Fayette
Fleming
Floyd
Franklin
Fulton
Gallatin
Garrard
Grant
Graves
Grayson
Green
Greenup
Hancock
Hardin
Harlan
Harrison
Hart
Henderson
Henry
Hickman
Hopkins
Jackson
Jefferson
Jessamine Johnson
Kenton
Knott
Knox
Larue
Laurel
Lawrence
Lee
Leslie Letcher
Lewis
Livingston
Logan
Lyon Mccracken
Mccreary
Mclean
Madison Magoffin
Marion
Marshall
Martin
Mason
Meade Menifee
Mercer
Metcalfe
Monroe
Montgomery
Morgan
Muhlenberg
Nelson
Nicholas
Ohio
Oldham
Owen
Owsley
Pendleton
Perry
Pike
Powell
Pulaski
Robertson
Rockcastle
Rowan
Russell
Scott
Shelby
Simpson
Taylor
Todd Trigg
Trimble
Union
Warren
Washington
Wayne
Webster
Whitley
Wolfe
Woodford
Additional Testing of Drink Pyramid in
Western Kentucky

Western Kentucky Regional Dental Coalition
In 2009, The Kentucky Oral Health Program received two federal grants to create community coalitions aimed at improving dental health among children and adults throughout Kentucky. Grants were received to form the Western Kentucky Regional Dental Coalition through HRSA’s Targeted State MCH Oral Health Services Systems (THOHSS) Program. The Coalition Meets Quarterly and the main event to date has been the organization of the Oral Health Summit! Cal the official pyramid spokesperson

Western Kentucky Regional Dental Coalition
Following a training in Social Marketing in August 2010, the coalition decided to make an oral health impact by addressing….
Drink Behaviors!!!
Cal the official pyramid spokesperson

The Western Kentucky Dental Coalition began working on the new “New Drink Pyramid” in August 2011.


Drink More Tap Water!

1. Brush your teeth after breakfast and before you go to bed each day!
2. Use a soft tooth brush with a pea size amount of fluoride toothpaste.
3. Brush your teeth at least 2 minutes using a circular motion….Set a Timer!
4. Make sure you brush all sides of each tooth including the front, back, and top….Make each tooth feel special!
5. Don’t forget to brush your tongue! 6. Spit out….Don’t swallow extra toothpaste! 7. Ask a grown up to help you floss your teeth each day!

http://www.youtube.com/watch?v=R2jduTvKSZg&feature=youtu.be

• Improve oral health literacy/education
• Expand school-based oral health services including head start and child care settings
• Increase the number of dentists accepting Medicaid
Priorities
Vision Statement All people of Kentucky can enjoy optimal oral health for life
Kentucky Oral Health Coalition Active since 2012!

0 5 10 15 20 25 30 35 40
Pop
Juice
Milk
Water
Pop Juice Milk WaterBaseline 25 22 23 26After School 20 19 22 36
Drink Behavior Change 2012-13
Baseline After School

What About Retention?

Eastern KY Kids Remembered 7 Months after Learning About It
4 of 43 of 42 of 41 of 40 of 4
5%
80% of 3rd Grade Kids Remembered All 4 Parts of the Drink Pyramid
7 Months Later!
5%
10% 5% 5%
The Drink Pyramid was taught in October, and post-tested at the end of the school year in May. 62 students

Western KY Kids Remembered One Year after Learning About It
4%
Hopkins County
4 of 43 of 42 of 41 of 40 of 4
5%
90% of 2nd Grade Kids Remembered All 4 Parts of the Drink Pyramid
One Year Later!
The Drink Pyramid was taught in October, and post-tested the following October. 293 Students surveyed

What Design did Students Prefer?
31% 73%

It’s been a long time coming, but • The Drink Pyramid is NOW ready to share!
– Website: www.drinkpyramid.com – Contact: [email protected]

Now Nikki is going to talk about
Ways to use the Drink Pyramid Lunch & Learn Sneak Peek

Ways to Use the Drink Pyramid • Teachers can use the new CURRICULUM to teach kids
each part of the Drink Pyramid and why the amounts listed are recommended.
• Schools can put a POSTER of the Drink Pyramid in the school cafeteria and/or in each classroom as a reminder.
• Give each child a Drink Pyramid CUP as a visible and tangible reminder of exactly HOW MUCH a serving size is for his/her age.
• Give each parent a Drink Pyramid MAGNET to put on the refrigerator as a reminder about what to buy and serve at home.
• Community agencies can use the DISPLAY at health fairs and other events to raise awareness.

Drink Pyramid Supplies are READY!

Conference Special
• Family Pack – 2 small cups – 2 large cups – 1 magnet – 1 sticker
– $13 value for $10.00
– (only 15 Family Packs available, cash/check only)
The Drink Pyramid
• Contact: – [email protected] – www.drinkpyramid.com Please order your Drink Pyramid supplies from us whenever possible, to
help support a fund established to help pay for the cost of dental care for uninsured children in Dr. Stone’s hometown in eastern Kentucky.
Mountains of Smiles Foundation Remember that the Drink Pyramid is copyrighted, so please contact Dr.
Stone if you would like to use the campaign. The curriculum has printable copies that can be reproduced.

Lunch & Learn Curriculum Examples Classroom Use Ideas
Door Prize
Sample of Curriculum
Ages 1-6

MOST
• Foods you should east the MOST of were at the BOTTOM of the pyramid. – Bread – Cereal – Rice – Pasta
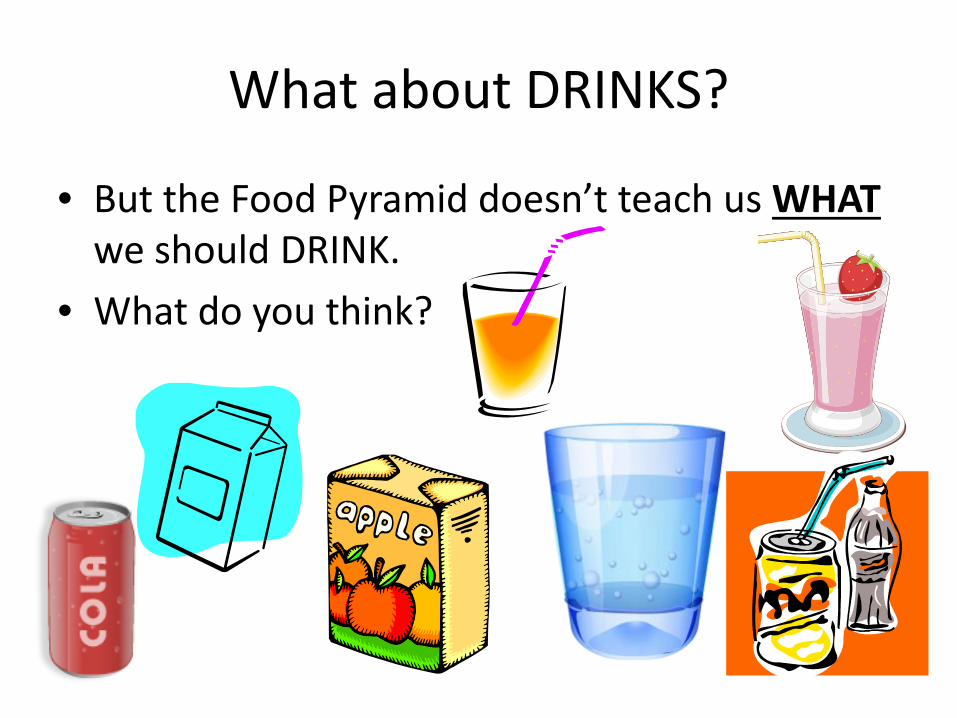
What about DRINKS?
• But the Food Pyramid doesn’t teach us WHAT we should DRINK.
• What do you think?

What about DRINKS?
• The Food Pyramid doesn’t teach us WHAT we should DRINK.
• AND it also doesn’t teach us HOW MUCH we should DRINK.
• What do you think?

• What sound does the letter “M” make?
• Can you think of a drink that starts with that sound?

How often should you drink MILK?
M…

MILK
• Get it? • MILK starts with “M” • MEALS starts with “M” • You can drink MILK… with MEALS! • Drink MILK anytime you are eating!
– Breakfast, lunch, and dinner!
• Since you are aged 1-6, you can drink ½ cup of milk 3 different times each day.

Sample of Curriculum
Ages 7-12

Older Curriculum has More Science
More Interaction More Discussion Time

The First U.S. FOOD PYRAMID
1992

Do you remember??
• On the FOOD PYRAMID you just looked at, do you remember?? – What foods should you eat the LEAST of?
• Fats, oils, sweets… – What foods should you eat the MOST of?
• Bread, cereal, rice, pasta…
• DID THE PICTURES HELP YOU REMEMBER?
Do you remember??
• On the FOOD PYRAMID you just looked at, do you remember?? – What foods should you eat the LEAST of?
• Hint: – They were on the top where the pyramid is SMALLEST.
– What foods should you eat the MOST of? • Hint:
– They were on the bottom where the pyramid is BIGGEST.

The Food Pyramid
• The original Food Pyramid really worked! • It helped Americans make better food choices.
– We ate less fats. – Our cholesterol went way down. – Less people died of heart disease.
– But… it wasn’t perfect, so the US Food & Drug
Administration tried to make it better…

The 2005 FOOD PYRAMID
• The food pyramid was changed in 2005 to remind people to EXERCISE, but it really confused people…
Looks like a big pile of food! ???!!??

The New MyPyramid.com
• The NEW Food Pyramid didn’t work. • Why?
– It was no longer simple. – You had to have a computer and enter lots of
information about yourself to use it. • Lots of people don’t have computers at home!
– People didn’t understand the big pile of food at the bottom, and it didn’t show how much they were supposed to be eating. (confused…)

2011 Choose My Plate
• So, they changed it to an easier-to-understand PLATE instead…

Compare
• It only came out 2 years ago, so we don’t know how well the PLATE is working, but so far, we are still not eating the right foods.
• And we sure aren’t DRINKING the right drinks.
versus

Food vs. Drinks
• So, Americans have been learning about what FOODS we should eat since 1992.
• But we didn’t talk about what to DRINK until the MyPlate came out in 2011. – But all it says on the cup is “Dairy.” – Do you know what that means?? – Does it tell you HOW MUCH“Dairy”
to drink?? – And why does it look like you’re
supposed to be drinking something colored BLUE??

Drinks
• We know that most Americans are NOT drinking what we’re supposed to…
• Americans are drinking “Sugary Drinks.”

More Vocabulary

Mnemonics
• What are MNEMONICS? – New vocabulary word! – A mnemonic is any learning technique that aids
information retention (REMEMBERING). – Mnemonic systems are special techniques or
strategies consciously used to improve MEMORY, it helps employ information already stored in long-term memory to make memorization an easier task.

Mnemonics
• Really, a mnemonic is just a way to help us REMEMBER something!
• Have you learned the planets in our solar system yet? Here’s an easy way to remember them in order: – My Very Easy Method: Just Set Up Nine Planets – (Mercury, Venus, Earth, Mars, Jupiter, Saturn,
Uranus, Neptune, Pluto)

Mnemonics
• Did you see how the first letter of each word in the mnemonic was the same as the first letter of each planet? – My…Mercury – Very…Venus – Easy…Earth – Etc.
– OK, let’s use mnemonics In our Drink Pyramid!

Older Curriculum has More Information

How often should you drink JUICE?
This one is a little harder… Most people think juice is healthy enough to drink all day long, but…


JUICE
• Get it? • JUICE starts with “J” • JUST starts with “J” • You can drink JUICE… but JUST once a day!
– Remember, juice is a sugary drink, even though it is a natural form of sugar!
• Drink JUICE JUST once each day, some people drink it at breakfast, but it’s even better at… – Snack time!
• You can drink 1 cup of juice each day.

JUICE • “Why can’t I drink a lot of
juice?” • “I thought juice was
healthy!” • Juice has a lot of sugar,
even if it is 100% juice. • You should get your
vitamins from WHOLE FRUIT, not juice. – That way, you get fiber too
and your body needs both!
4 teaspoons
SUGAR

We’re almost done building our DRINK PYRAMID!
What do you think goes at the top of the pyramid?

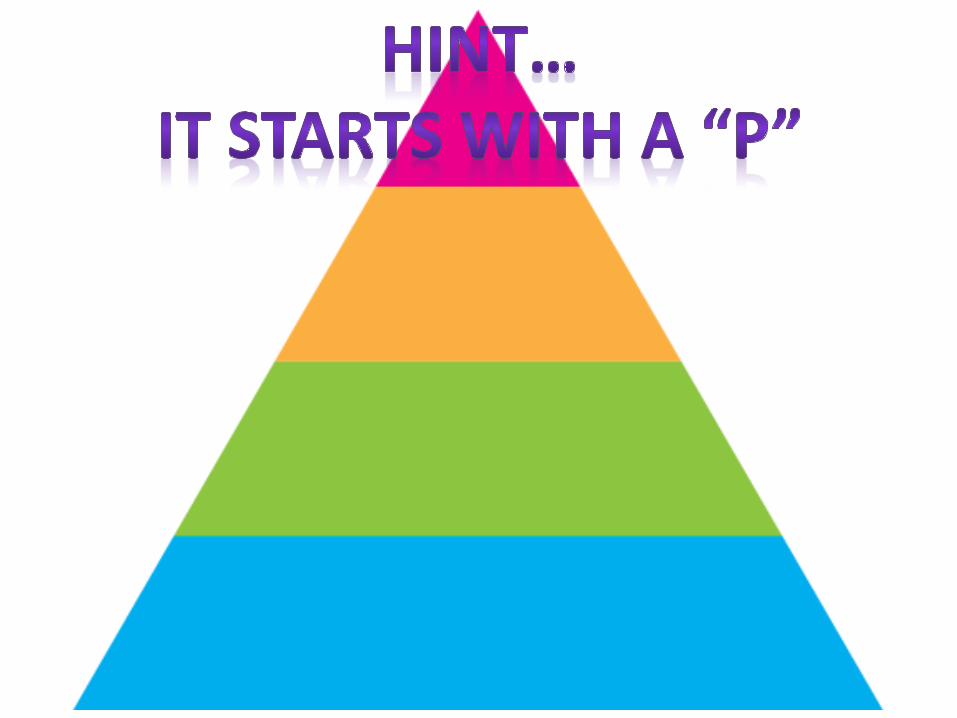


How often should you drink POP?


POP
• Get it? • POP starts with “P” • POP starts with “P” • You can drink POP… only at PARTIES! • Drink POP only if you are having a special
occasion such as… – A party!
• You can drink 1 cup of pop at a party.

POP
• “Why can’t I drink a lot of pop?”
• “Pop tastes so good and everyone drinks it!”
• Pop has a LOT of sugar, way more than our bodies are able to handle!
• Drinking pop leads to lots of health problems.
10 teaspoons
SUGAR

POP
• Pop is just one type of “sugary drink.” • Can you think of other sugary drinks that also
have too much sugar? • Just think of drinks like these as “pop” also:
– Gatorade – Kool-aid – Hi-C – Sunny D – ?? What are some others?
Older Curriculum has More Critical Thinking
Problem Solving

POP
• OK, so you’re at a party and you want to drink some pop…
• Do you remember HOW MUCH pop you should drink?
• Remember, it depends on your AGE: – Age 1-6, serving size is only ½ cup (4 ounces). – Age 7-12, serving size is only 1 cup (8 ounces). – Ages 12-adult, serving size is still 1 cup (8 ounces)!

POP
• As you can see, a regular can already has a lot of sugar, and the super-size has way more!
• Since you are probably aged 7-12, YOUR serving size is ONE CUP (8 ounces), but a regular can of pop is 12 ounces! – Do the math… have you learned fractions yet? – So if you’re at the party, what should you do??

POP/JUICE/MILK/WATER
• Remember, no matter what you are drinking, if you are aged 7-12, your serving size is always: – 1 cup (8 ounces)
–
• It is VERY hard to find drinking cups made in that size in America, so you need to know how much your serving size in any situation…

HOMEWORK
• HOMEWORK! Tonight, ask your family to help you find a measuring cup in your kitchen and practice pouring 1 cup of water into the different glasses in your house. – Then you’ll know what YOUR SERVING SIZE looks
like!

Conclusions
• Americans drink too many SSBs, especially kids, and most especially low-income kids who are already at higher risk for poor oral and general health.
• The original food pyramid was an effective tool for teaching food moderation and proportion, and resulted in better health for Americans.
• The new Drink Pyramid is simple, straightforward, easy to learn, easy to remember, and may be a useful tool for teaching kids and low-income adults about making healthy drink choices.
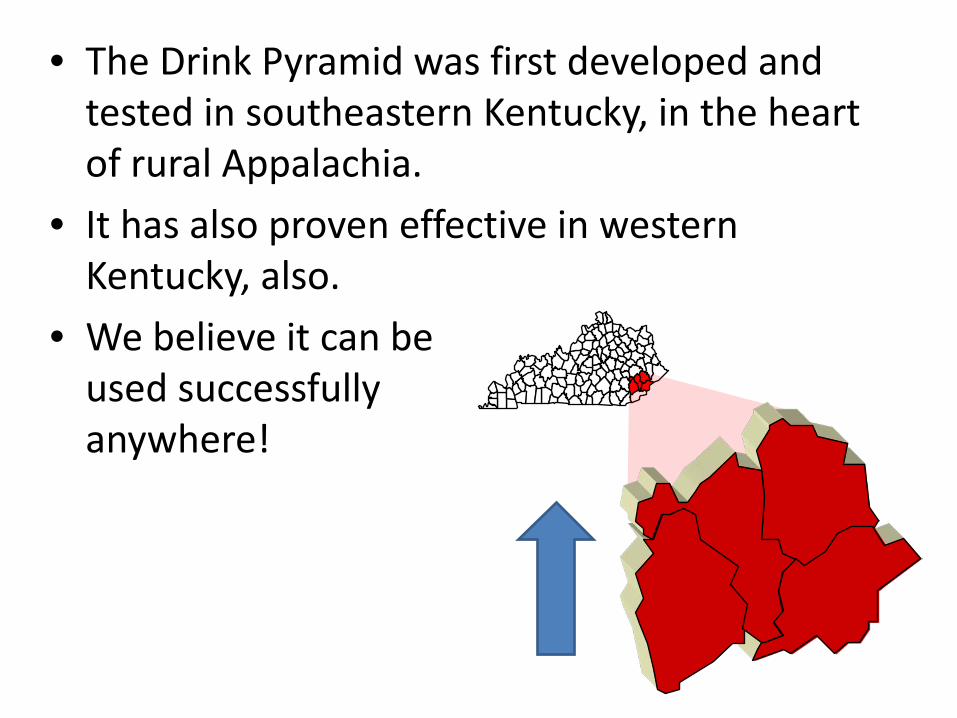
• The Drink Pyramid was first developed and tested in southeastern Kentucky, in the heart of rural Appalachia.
• It has also proven effective in western Kentucky, also.
• We believe it can be used successfully anywhere!

Drink Pyramid Supplies are READY!

The Drink Pyramid
• Contact: – [email protected] – www.drinkpyramid.com Please order your Drink Pyramid supplies from us whenever
possible, to help support a fund established to help pay for the cost of dental care for uninsured children in Dr. Stone’s hometown in eastern Kentucky.
Remember that the Drink Pyramid is copyrighted, so please contact Dr. Stone if you would like to use the campaign. The curriculum has printable copies that can be reproduced.

Questions/Comments
???