the neuropsychology of mathematics - pearson clinical...
TRANSCRIPT
4/7/2013
1
THE NEUROPSYCHOLOGY OF MATHEMATICS
Steven G. Feifer, D.Ed., NCSP, ABSNP [email protected]
2
Presentation Goals
(1) Discuss the international trends in math, and reasons why the United States lags behind many industrialized nations in math and science.
(2) Introduce a brain-based educational model of math by identifying three basic neural codes which format numbers in the brain.
(3) Explore the role of various cognitive constructs including working memory, visual-spatial functioning, and executive functioning, with respect to math problem solving ability.
(4) Introduce the 90 minute assessment model of mathematics and interventions.
3
Future Reading Materials
.
www.schoolneuropsychpress.com
or
@schoolneuropsychpress
.
4/7/2013
2
4
2011 TIMSS DATA http://nces.ed.gov/pubs2013/2013009_1.pdf
Trends in International Mathematics and Science Study: (5th Sample Collected Since 1995)
Grade 4: TIMSS assesses student knowledge in three content
domains: number, geometric shapes and measures, and data display.
50% of items consisted of number content
Grade 8: TIMSS assesses student knowledge in four content
domains: number, algebra, geometry, and data and chance.
29% of items consisted of number content.
U.S. national sample consisted of 369 schools and 12,569 students at grade 4, and 501 schools and 10,477 students at grade 8. Data was collected from both public and private schools.
In 2011, TIMSS was administered at grade 4 in 57 countries and at grade 8, in 56 countries.
5
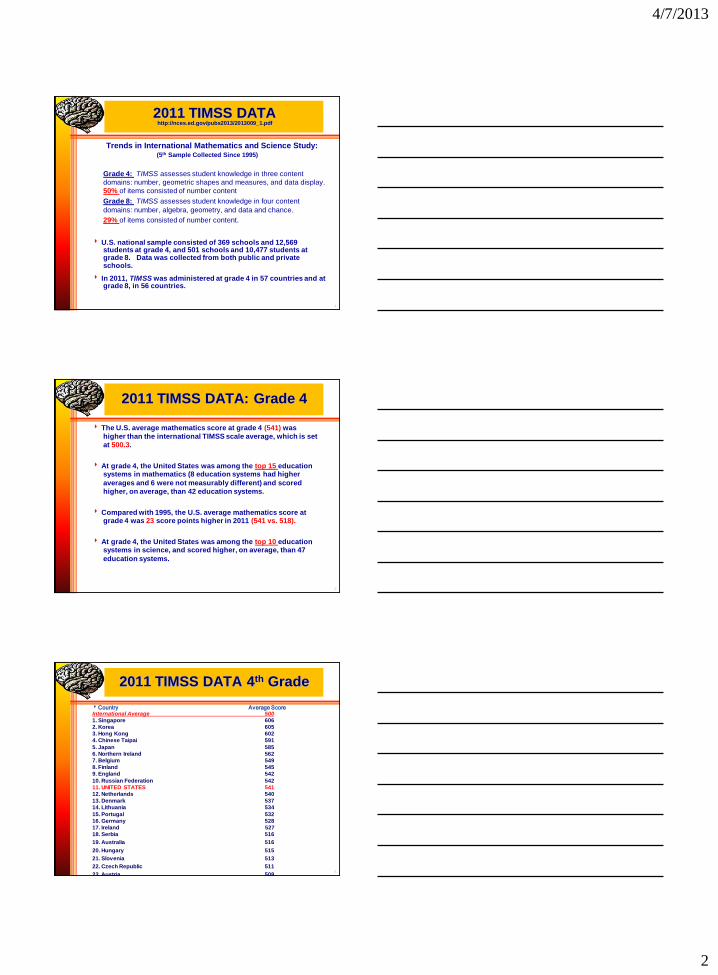
2011 TIMSS DATA: Grade 4
The U.S. average mathematics score at grade 4 (541) was
higher than the international TIMSS scale average, which is set
at 500.3.
At grade 4, the United States was among the top 15 education systems in mathematics (8 education systems had higher
averages and 6 were not measurably different) and scored
higher, on average, than 42 education systems.
Compared with 1995, the U.S. average mathematics score at grade 4 was 23 score points higher in 2011 (541 vs. 518).
At grade 4, the United States was among the top 10 education systems in science, and scored higher, on average, than 47
education systems.
6
2011 TIMSS DATA 4th Grade
Country Average Score International Average 500
1. Singapore 606
2. Korea 605
3. Hong Kong 602
4. Chinese Taipai 591
5. Japan 585
6. Northern Ireland 562
7. Belgium 549
8. Finland 545
9. England 542
10. Russian Federation 542
11. UNITED STATES 541
12. Netherlands 540
13. Denmark 537
14. Lithuania 534
15. Portugal 532
16. Germany 528
17. Ireland 527
18. Serbia 516
19. Australia 516
20. Hungary 515
21. Slovenia 513
22. Czech Republic 511
23. Austria 508
4/7/2013
3
7
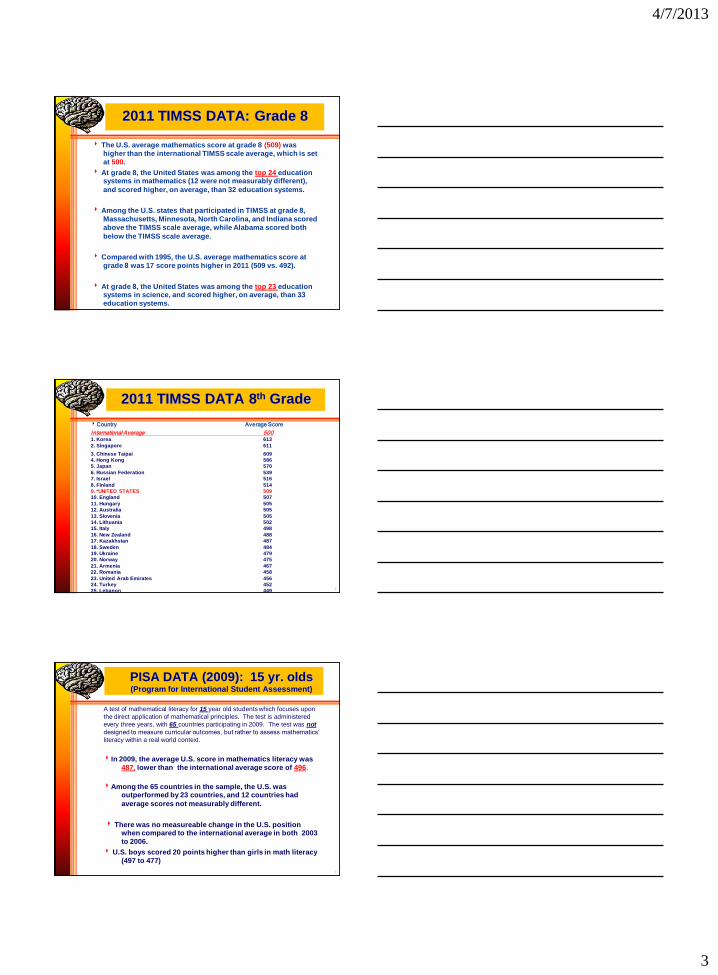
2011 TIMSS DATA: Grade 8
The U.S. average mathematics score at grade 8 (509) was
higher than the international TIMSS scale average, which is set
at 500.
At grade 8, the United States was among the top 24 education systems in mathematics (12 were not measurably different),
and scored higher, on average, than 32 education systems.
Among the U.S. states that participated in TIMSS at grade 8,
Massachusetts, Minnesota, North Carolina, and Indiana scored
above the TIMSS scale average, while Alabama scored both
below the TIMSS scale average.
Compared with 1995, the U.S. average mathematics score at
grade 8 was 17 score points higher in 2011 (509 vs. 492).
At grade 8, the United States was among the top 23 education systems in science, and scored higher, on average, than 33
education systems.
8
2011 TIMSS DATA 8th Grade
Country Average Score
International Average 500 1. Korea 613
2. Singapore 611
3. Chinese Taipai 609
4. Hong Kong 586
5. Japan 570
6. Russian Federation 539
7. Israel 516
8. Finland 514
9. *UNITED STATES 509
10. England 507
11. Hungary 505
12. Australia 505
13. Slovenia 505
14. Lithuania 502
15. Italy 498
16. New Zealand 488
17. Kazakhstan 487
18. Sweden 484
19. Ukraine 479
20. Norway 475
21. Armenia 467
22. Romania 458
23. United Arab Emirates 456
24. Turkey 452
25. Lebanon 449
9
PISA DATA (2009): 15 yr. olds (Program for International Student Assessment)
A test of mathematical literacy for 15 year old students which focuses upon
the direct application of mathematical principles. The test is administered
every three years, with 65 countries participating in 2009. The test was not
designed to measure curricular outcomes, but rather to assess mathematics’
literacy within a real world context.
In 2009, the average U.S. score in mathematics literacy was
487, lower than the international average score of 496.
Among the 65 countries in the sample, the U.S. was outperformed by 23 countries, and 12 countries had
average scores not measurably different.
There was no measureable change in the U.S. position when compared to the international average in both 2003
to 2006.
U.S. boys scored 20 points higher than girls in math literacy
(497 to 477)
4/7/2013
4
10
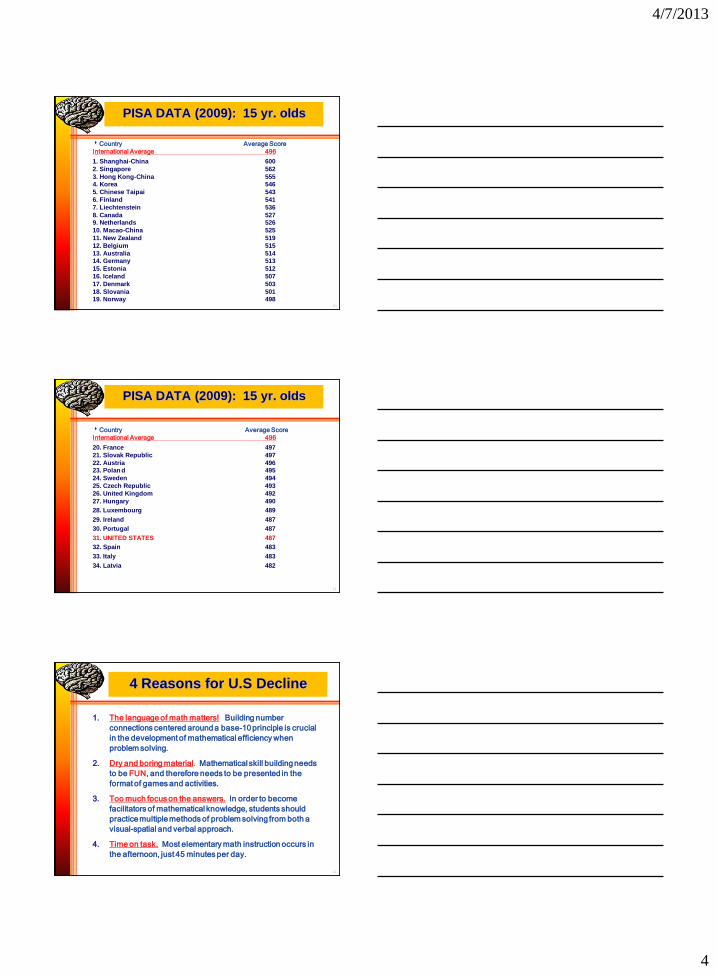
PISA DATA (2009): 15 yr. olds
Country Average Score
International Average 496
1. Shanghai-China 600
2. Singapore 562
3. Hong Kong-China 555
4. Korea 546
5. Chinese Taipai 543
6. Finland 541
7. Liechtenstein 536
8. Canada 527 9. Netherlands 526
10. Macao-China 525
11. New Zealand 519
12. Belgium 515
13. Australia 514 14. Germany 513
15. Estonia 512
16. Iceland 507
17. Denmark 503
18. Slovania 501 19. Norway 498
11
PISA DATA (2009): 15 yr. olds
Country Average Score
International Average 496
20. France 497
21. Slovak Republic 497
22. Austria 496 23. Polan d 495
24. Sweden 494
25. Czech Republic 493
26. United Kingdom 492
27. Hungary 490
28. Luxembourg 489
29. Ireland 487
30. Portugal 487
31. UNITED STATES 487
32. Spain 483
33. Italy 483
34. Latvia 482
12
4 Reasons for U.S Decline
1. The language of math matters! Building number
connections centered around a base-10 principle is crucial
in the development of mathematical efficiency when
problem solving.
2. Dry and boring material. Mathematical skill building needs
to be FUN, and therefore needs to be presented in the
format of games and activities.
3. Too much focus on the answers. In order to become
facilitators of mathematical knowledge, students should
practice multiple methods of problem solving from both a
visual-spatial and verbal approach.
4. Time on task. Most elementary math instruction occurs in
the afternoon, just 45 minutes per day.
4/7/2013
5
13
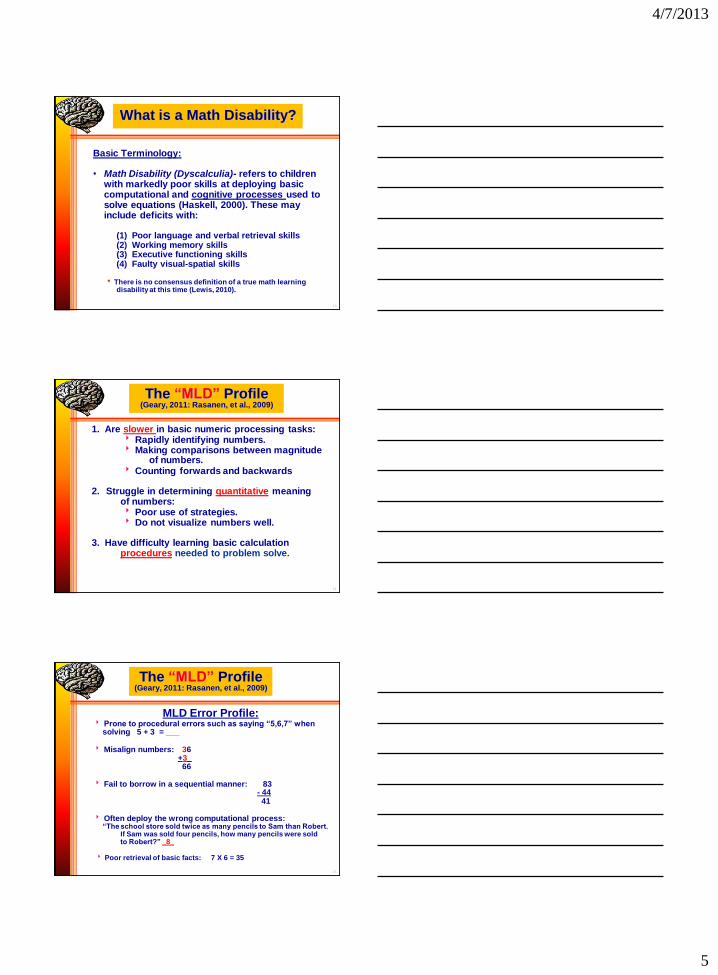
What is a Math Disability?
Basic Terminology: • Math Disability (Dyscalculia)- refers to children
with markedly poor skills at deploying basic computational and cognitive processes used to solve equations (Haskell, 2000). These may include deficits with: (1) Poor language and verbal retrieval skills (2) Working memory skills (3) Executive functioning skills (4) Faulty visual-spatial skills * There is no consensus definition of a true math learning
disability at this time (Lewis, 2010).
14
The “MLD” Profile (Geary, 2011: Rasanen, et al., 2009)
1. Are slower in basic numeric processing tasks: Rapidly identifying numbers. Making comparisons between magnitude
of numbers. Counting forwards and backwards 2. Struggle in determining quantitative meaning
of numbers: Poor use of strategies. Do not visualize numbers well. 3. Have difficulty learning basic calculation
procedures needed to problem solve.
15
The “MLD” Profile (Geary, 2011: Rasanen, et al., 2009)
MLD Error Profile: Prone to procedural errors such as saying “5,6,7” when
solving 5 + 3 = ___ Misalign numbers: 36 +3_ 66 Fail to borrow in a sequential manner: 83 - 44 41 Often deploy the wrong computational process: “The school store sold twice as many pencils to Sam than Robert.
If Sam was sold four pencils, how many pencils were sold to Robert?” _8_
Poor retrieval of basic facts: 7 X 6 = 35
4/7/2013
6
16
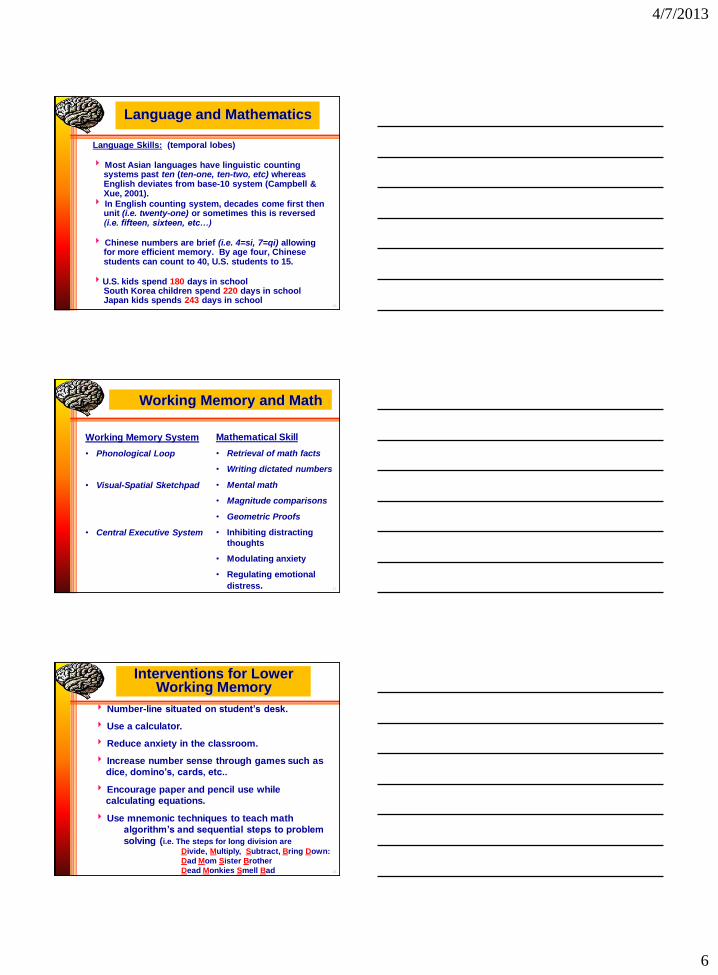
Language and Mathematics
Language Skills: (temporal lobes)
Most Asian languages have linguistic counting systems past ten (ten-one, ten-two, etc) whereas English deviates from base-10 system (Campbell & Xue, 2001).
In English counting system, decades come first then unit (i.e. twenty-one) or sometimes this is reversed (i.e. fifteen, sixteen, etc…)
Chinese numbers are brief (i.e. 4=si, 7=qi) allowing for more efficient memory. By age four, Chinese students can count to 40, U.S. students to 15.
U.S. kids spend 180 days in school South Korea children spend 220 days in school Japan kids spends 243 days in school
17
Working Memory and Math
Working Memory System
• Phonological Loop
• Visual-Spatial Sketchpad
• Central Executive System
Mathematical Skill
• Retrieval of math facts
• Writing dictated numbers
• Mental math
• Magnitude comparisons
• Geometric Proofs
• Inhibiting distracting
thoughts
• Modulating anxiety
• Regulating emotional
distress.
18
Interventions for Lower Working Memory
Number-line situated on student’s desk.
Use a calculator.
Reduce anxiety in the classroom.
Increase number sense through games such as dice, domino’s, cards, etc..
Encourage paper and pencil use while calculating equations.
Use mnemonic techniques to teach math algorithm’s and sequential steps to problem
solving (i.e. The steps for long division are
Divide, Multiply, Subtract, Bring Down:
Dad Mom Sister Brother
Dead Monkies Smell Bad
4/7/2013
7
19
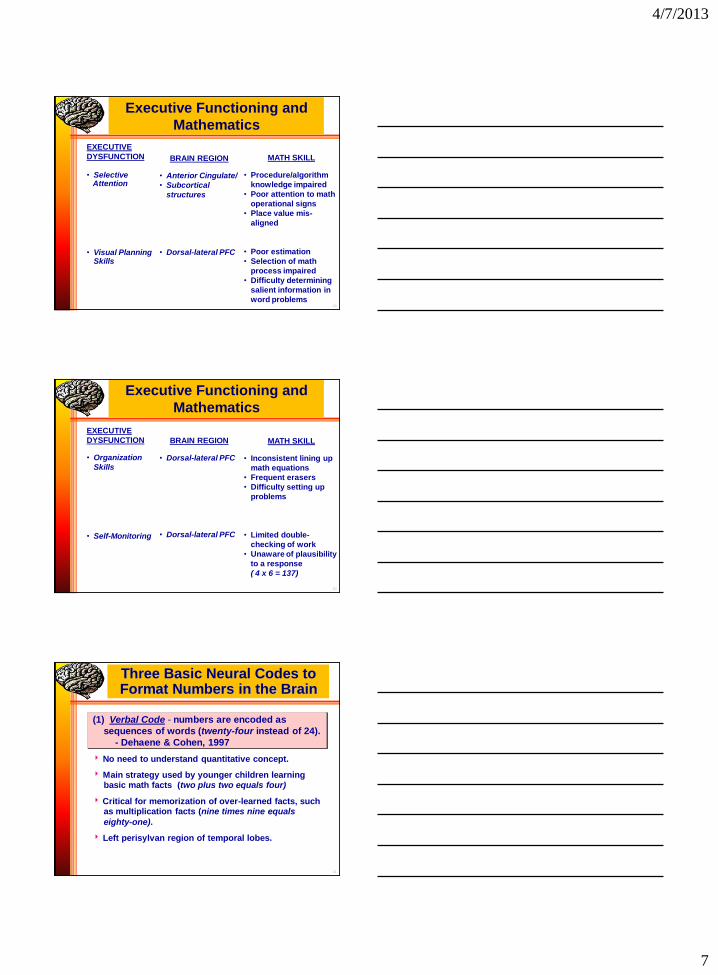
EXECUTIVE
DYSFUNCTION
• Selective Attention • Visual Planning
Skills
BRAIN REGION
• Anterior Cingulate/
• Subcortical
structures
• Dorsal-lateral PFC
MATH SKILL
• Procedure/algorithm
knowledge impaired
• Poor attention to math
operational signs
• Place value mis-
aligned
• Poor estimation
• Selection of math
process impaired
• Difficulty determining
salient information in
word problems
Executive Functioning and
Mathematics
20
EXECUTIVE
DYSFUNCTION
• Organization
Skills • Self-Monitoring
BRAIN REGION
• Dorsal-lateral PFC
• Dorsal-lateral PFC
MATH SKILL
• Inconsistent lining up
math equations
• Frequent erasers
• Difficulty setting up
problems
• Limited double-
checking of work
• Unaware of plausibility
to a response
( 4 x 6 = 137)
Executive Functioning and
Mathematics
21
(1) Verbal Code - numbers are encoded as
sequences of words (twenty-four instead of 24).
- Dehaene & Cohen, 1997
No need to understand quantitative concept.
Main strategy used by younger children learning basic math facts (two plus two equals four)
Critical for memorization of over-learned facts, such as multiplication facts (nine times nine equals
eighty-one).
Left perisylvan region of temporal lobes.
Three Basic Neural Codes to Format Numbers in the Brain
4/7/2013
8
22
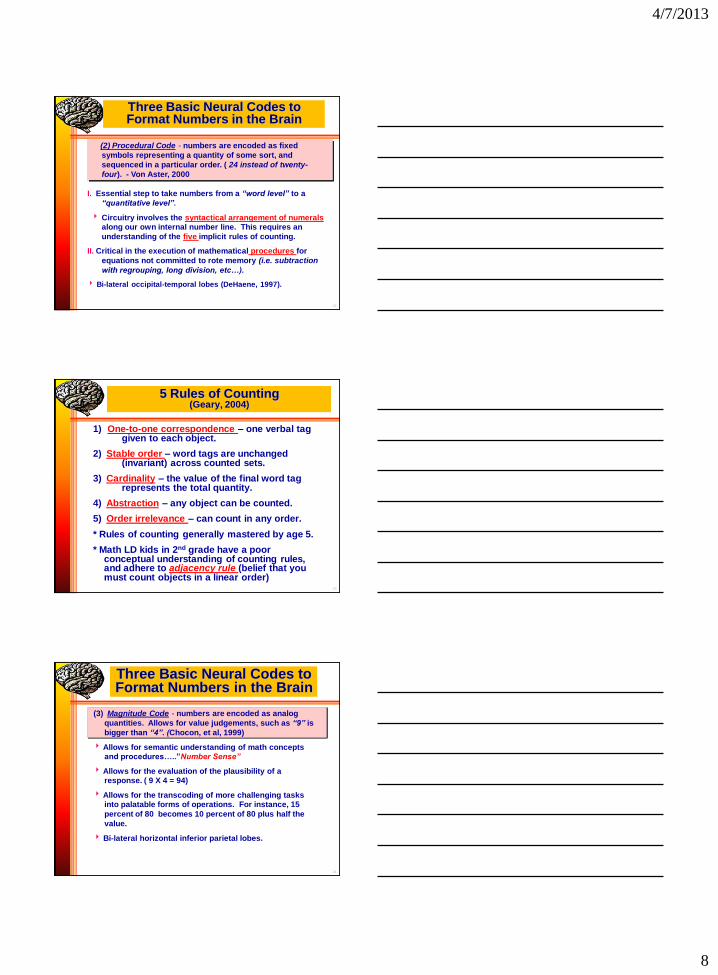
(2) Procedural Code - numbers are encoded as fixed
symbols representing a quantity of some sort, and
sequenced in a particular order. ( 24 instead of twenty-
four). - Von Aster, 2000
I. Essential step to take numbers from a “word level” to a
“quantitative level”.
Circuitry involves the syntactical arrangement of numerals along our own internal number line. This requires an
understanding of the five implicit rules of counting.
II. Critical in the execution of mathematical procedures for
equations not committed to rote memory (i.e. subtraction
with regrouping, long division, etc…).
Bi-lateral occipital-temporal lobes (DeHaene, 1997).
Three Basic Neural Codes to Format Numbers in the Brain
23
5 Rules of Counting (Geary, 2004)
1) One-to-one correspondence – one verbal tag given to each object.
2) Stable order – word tags are unchanged (invariant) across counted sets.
3) Cardinality – the value of the final word tag represents the total quantity.
4) Abstraction – any object can be counted.
5) Order irrelevance – can count in any order.
* Rules of counting generally mastered by age 5.
* Math LD kids in 2nd grade have a poor conceptual understanding of counting rules, and adhere to adjacency rule (belief that you must count objects in a linear order)
24
(3) Magnitude Code - numbers are encoded as analog
quantities. Allows for value judgements, such as “9” is
bigger than “4”. (Chocon, et al, 1999)
Allows for semantic understanding of math concepts and procedures…..”Number Sense”
Allows for the evaluation of the plausibility of a response. ( 9 X 4 = 94)
Allows for the transcoding of more challenging tasks into palatable forms of operations. For instance, 15
percent of 80 becomes 10 percent of 80 plus half the
value.
Bi-lateral horizontal inferior parietal lobes.
Three Basic Neural Codes to Format Numbers in the Brain
4/7/2013
9
25
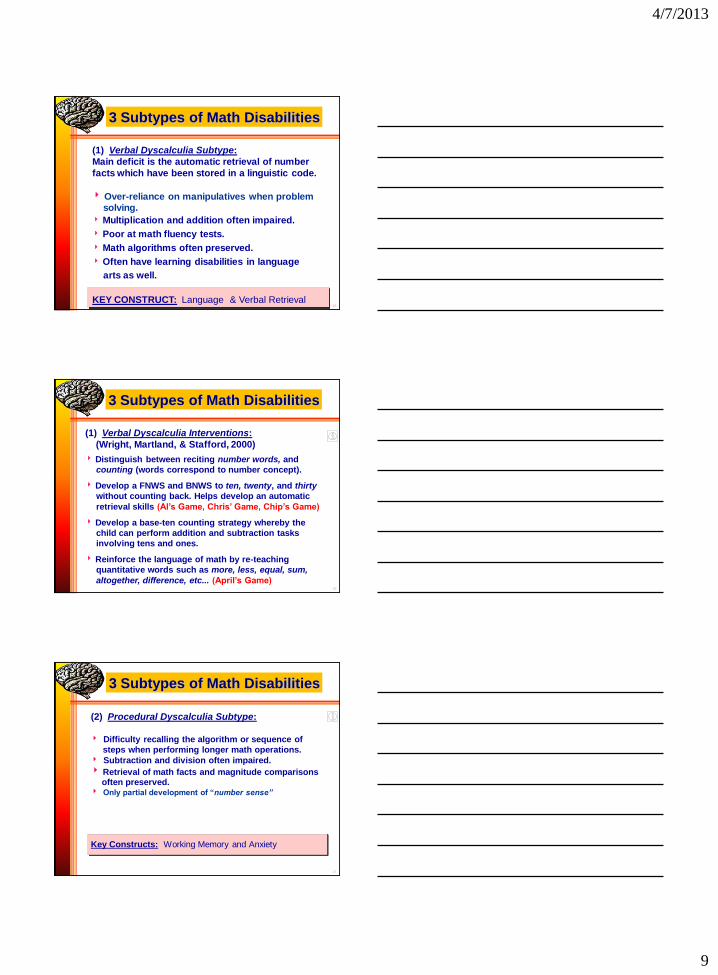
(1) Verbal Dyscalculia Subtype:
Main deficit is the automatic retrieval of number
facts which have been stored in a linguistic code.
Over-reliance on manipulatives when problem solving.
Multiplication and addition often impaired.
Poor at math fluency tests.
Math algorithms often preserved.
Often have learning disabilities in language
arts as well.
KEY CONSTRUCT: Language & Verbal Retrieval
3 Subtypes of Math Disabilities
26
(1) Verbal Dyscalculia Interventions:
(Wright, Martland, & Stafford, 2000)
Distinguish between reciting number words, and
counting (words correspond to number concept).
Develop a FNWS and BNWS to ten, twenty, and thirty
without counting back. Helps develop an automatic
retrieval skills (Al’s Game, Chris’ Game, Chip’s Game)
Develop a base-ten counting strategy whereby the
child can perform addition and subtraction tasks
involving tens and ones.
Reinforce the language of math by re-teaching
quantitative words such as more, less, equal, sum,
altogether, difference, etc... (April’s Game)
3 Subtypes of Math Disabilities
27
(2) Procedural Dyscalculia Subtype:
Difficulty recalling the algorithm or sequence of
steps when performing longer math operations.
Subtraction and division often impaired.
Retrieval of math facts and magnitude comparisons often preserved.
Only partial development of “number sense”
Key Constructs: Working Memory and Anxiety
3 Subtypes of Math Disabilities
4/7/2013
10
28
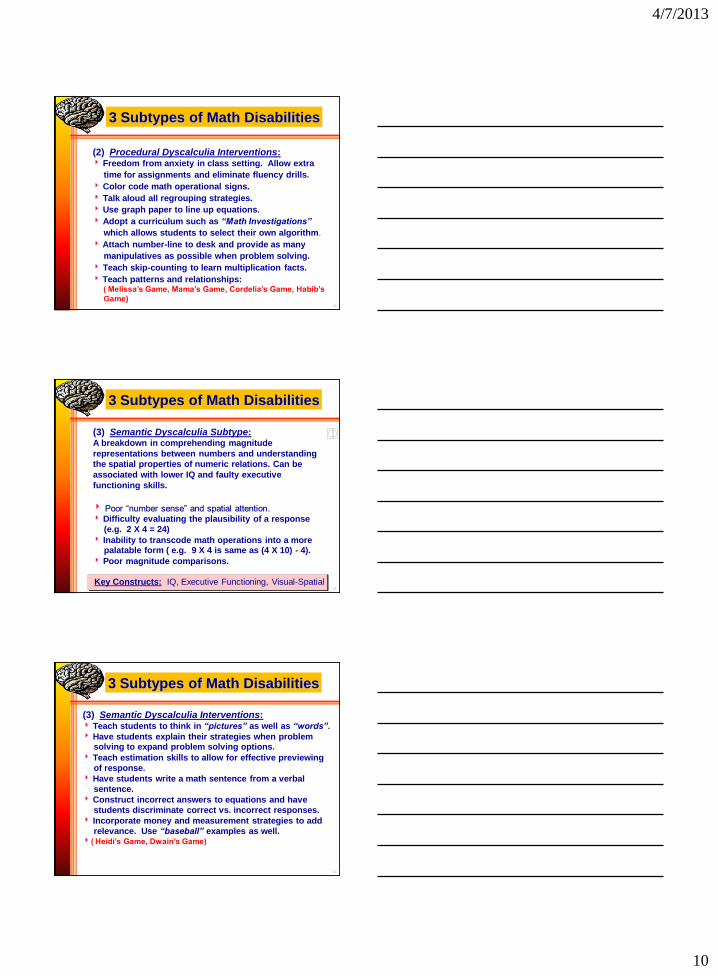
(2) Procedural Dyscalculia Interventions: Freedom from anxiety in class setting. Allow extra
time for assignments and eliminate fluency drills.
Color code math operational signs.
Talk aloud all regrouping strategies.
Use graph paper to line up equations.
Adopt a curriculum such as “Math Investigations”
which allows students to select their own algorithm.
Attach number-line to desk and provide as many
manipulatives as possible when problem solving.
Teach skip-counting to learn multiplication facts.
Teach patterns and relationships: ( Melissa’s Game, Mama’s Game, Cordelia’s Game, Habib’s
Game)
3 Subtypes of Math Disabilities
29
(3) Semantic Dyscalculia Subtype: A breakdown in comprehending magnitude
representations between numbers and understanding
the spatial properties of numeric relations. Can be
associated with lower IQ and faulty executive
functioning skills.
Poor “number sense” and spatial attention.
Difficulty evaluating the plausibility of a response
(e.g. 2 X 4 = 24)
Inability to transcode math operations into a more palatable form ( e.g. 9 X 4 is same as (4 X 10) - 4).
Poor magnitude comparisons.
3 Subtypes of Math Disabilities
Key Constructs: IQ, Executive Functioning, Visual-Spatial
30
(3) Semantic Dyscalculia Interventions: Teach students to think in “pictures” as well as “words”.
Have students explain their strategies when problem solving to expand problem solving options.
Teach estimation skills to allow for effective previewing
of response.
Have students write a math sentence from a verbal
sentence.
Construct incorrect answers to equations and have
students discriminate correct vs. incorrect responses.
Incorporate money and measurement strategies to add
relevance. Use “baseball” examples as well. ( Heidi’s Game, Dwain’s Game)
3 Subtypes of Math Disabilities
4/7/2013
11
31
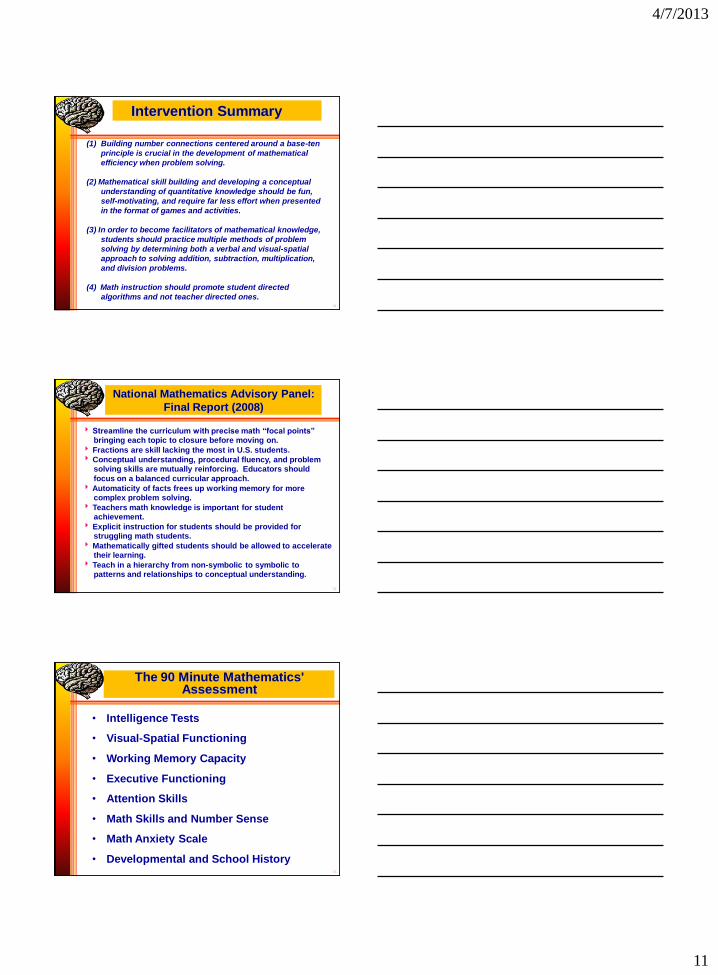
Intervention Summary
(1) Building number connections centered around a base-ten
principle is crucial in the development of mathematical
efficiency when problem solving.
(2) Mathematical skill building and developing a conceptual
understanding of quantitative knowledge should be fun,
self-motivating, and require far less effort when presented
in the format of games and activities.
(3) In order to become facilitators of mathematical knowledge,
students should practice multiple methods of problem
solving by determining both a verbal and visual-spatial
approach to solving addition, subtraction, multiplication,
and division problems.
(4) Math instruction should promote student directed
algorithms and not teacher directed ones.
32
Streamline the curriculum with precise math “focal points” bringing each topic to closure before moving on.
Fractions are skill lacking the most in U.S. students.
Conceptual understanding, procedural fluency, and problem solving skills are mutually reinforcing. Educators should
focus on a balanced curricular approach.
Automaticity of facts frees up working memory for more complex problem solving.
Teachers math knowledge is important for student achievement.
Explicit instruction for students should be provided for struggling math students.
Mathematically gifted students should be allowed to accelerate their learning.
Teach in a hierarchy from non-symbolic to symbolic to patterns and relationships to conceptual understanding.
National Mathematics Advisory Panel:
Final Report (2008)
33
The 90 Minute Mathematics' Assessment
• Intelligence Tests
• Visual-Spatial Functioning
• Working Memory Capacity
• Executive Functioning
• Attention Skills
• Math Skills and Number Sense
• Math Anxiety Scale
• Developmental and School History
4/7/2013
12
34
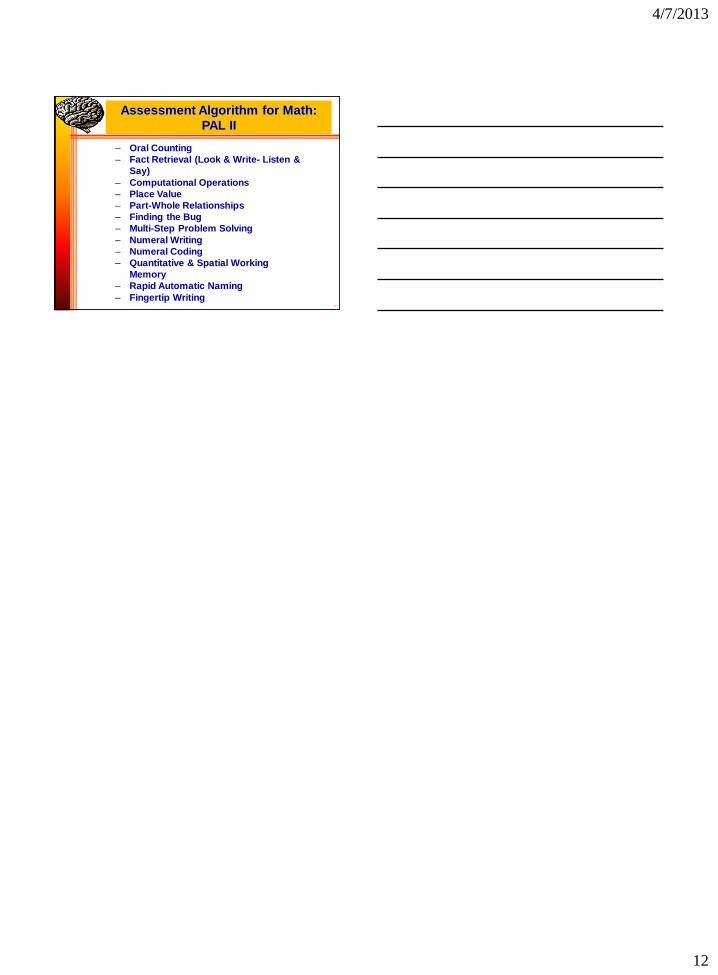
Assessment Algorithm for Math:
PAL II
– Oral Counting
– Fact Retrieval (Look & Write- Listen &
Say)
– Computational Operations
– Place Value
– Part-Whole Relationships
– Finding the Bug
– Multi-Step Problem Solving
– Numeral Writing
– Numeral Coding
– Quantitative & Spatial Working
Memory
– Rapid Automatic Naming
– Fingertip Writing