the narrative in this report is essential for the data ... · yes : yes : no : yes : no : psct :...
TRANSCRIPT
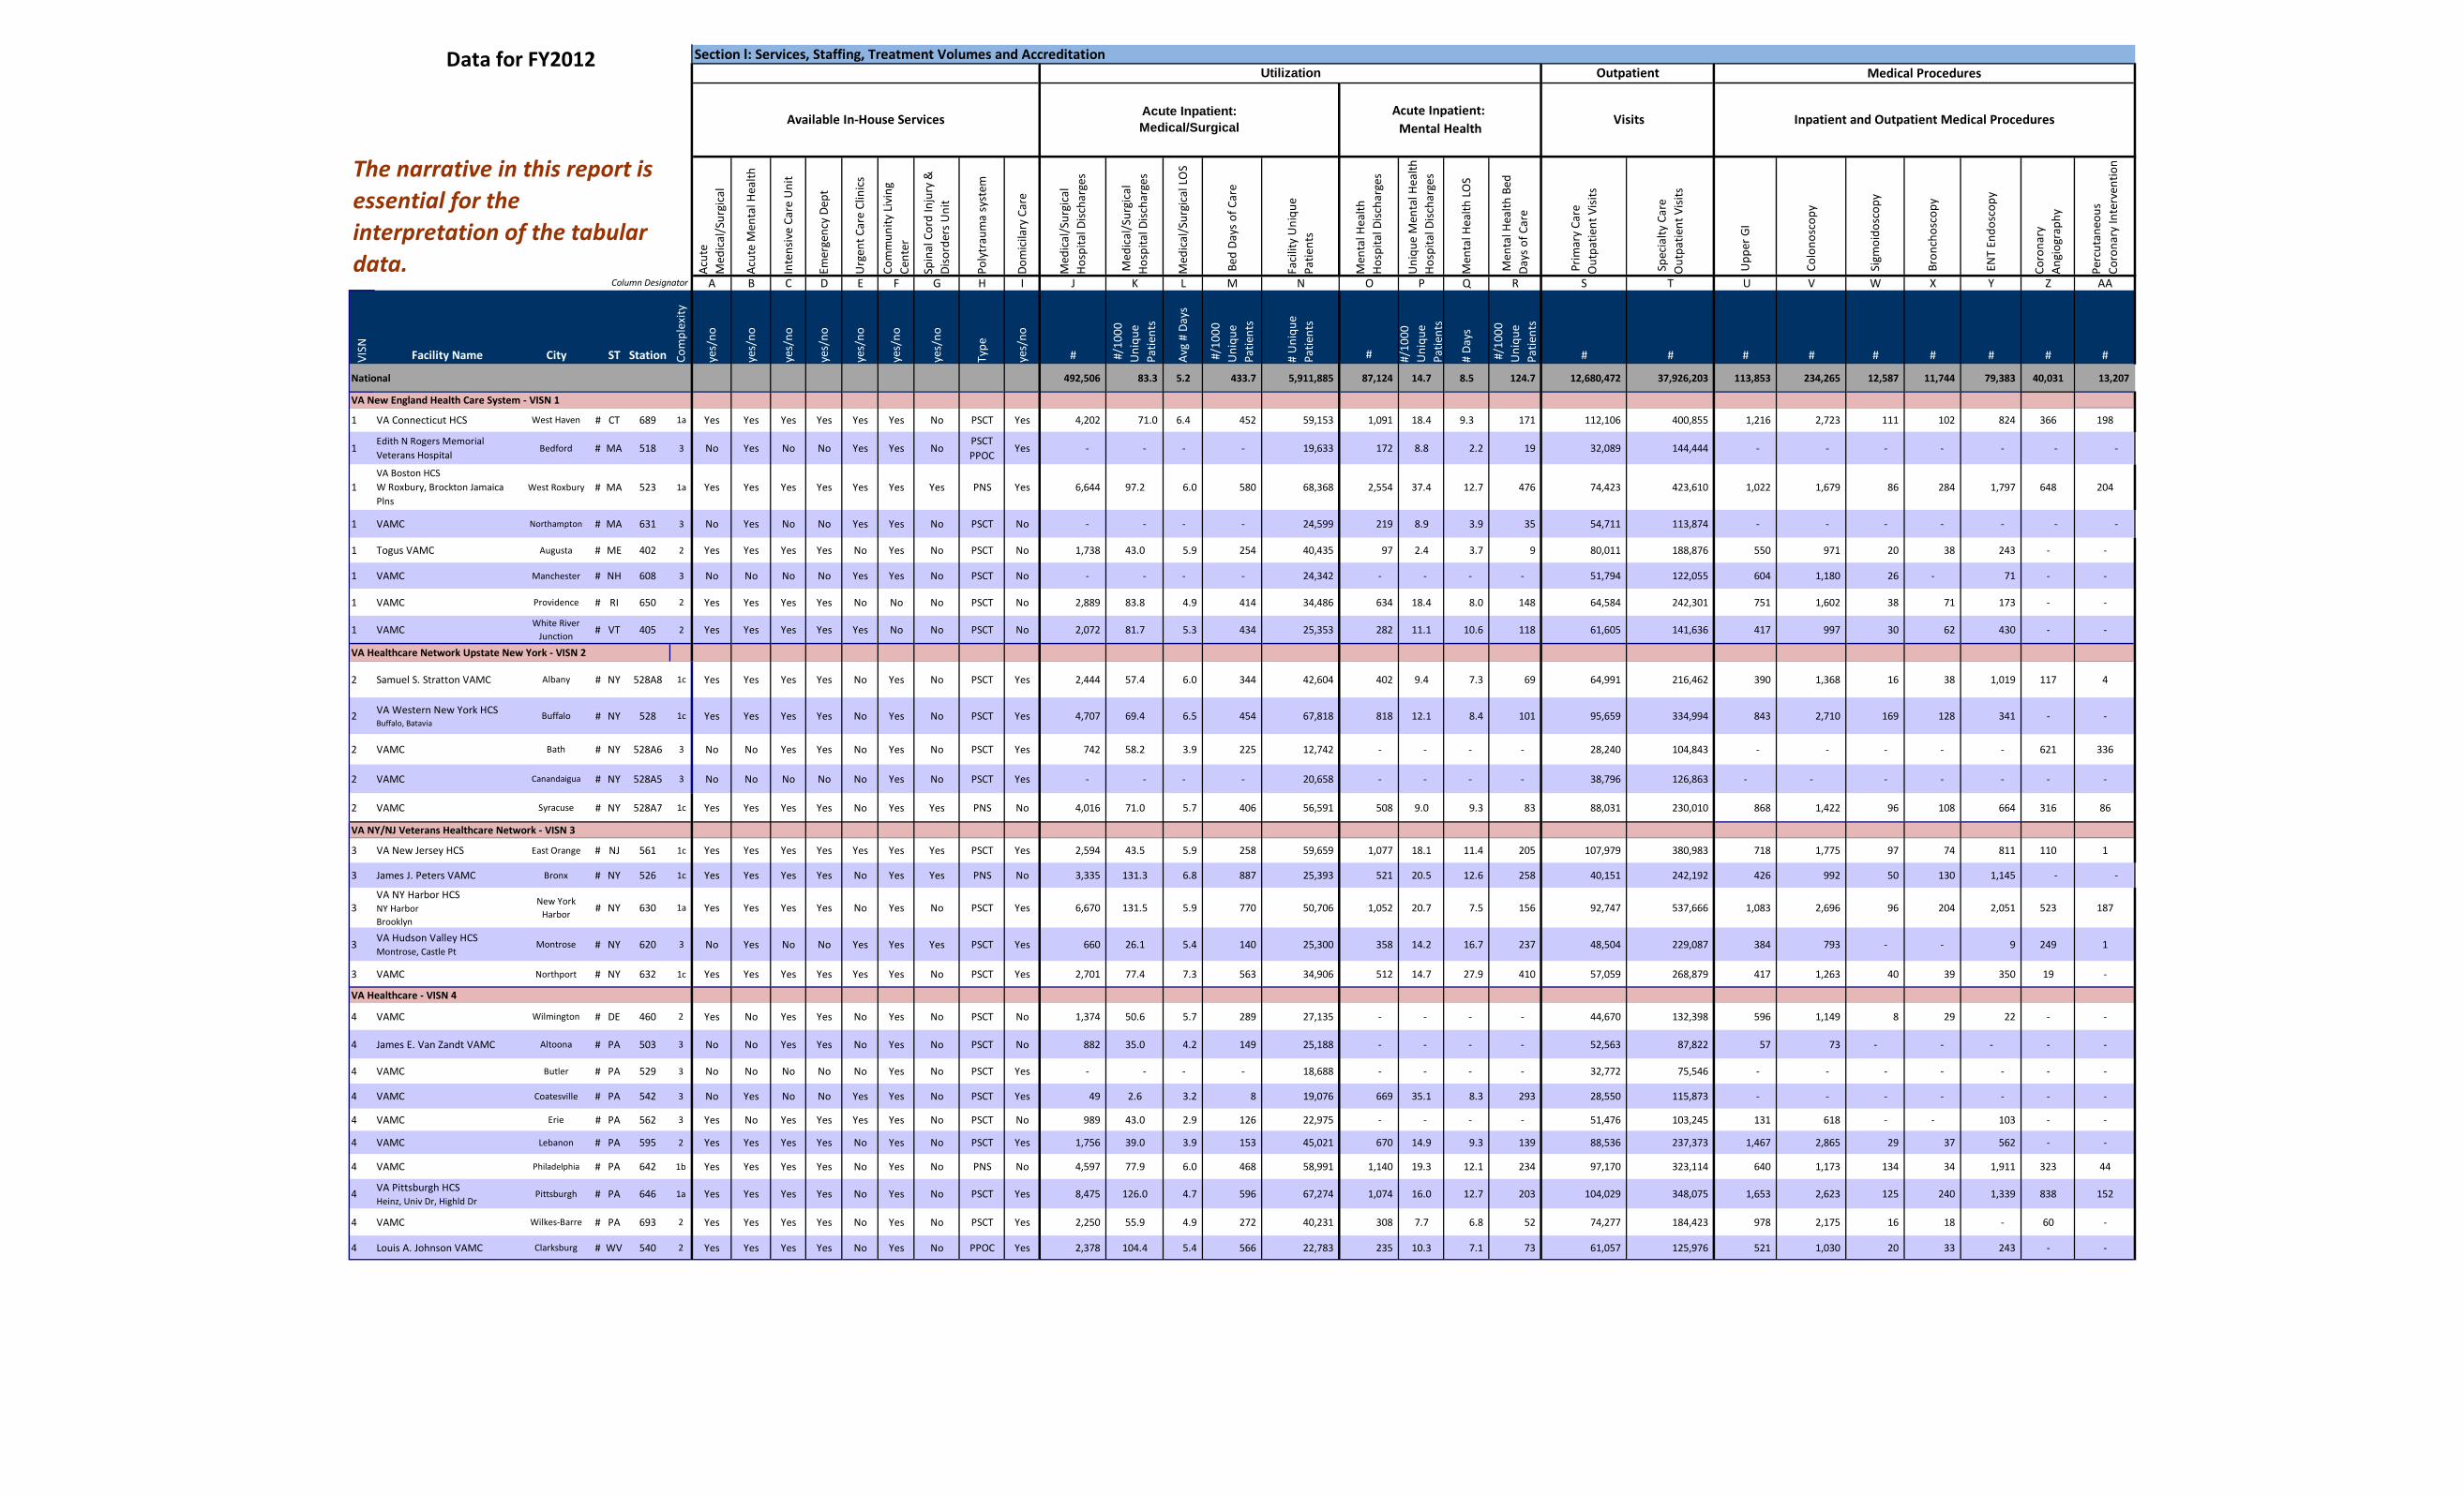
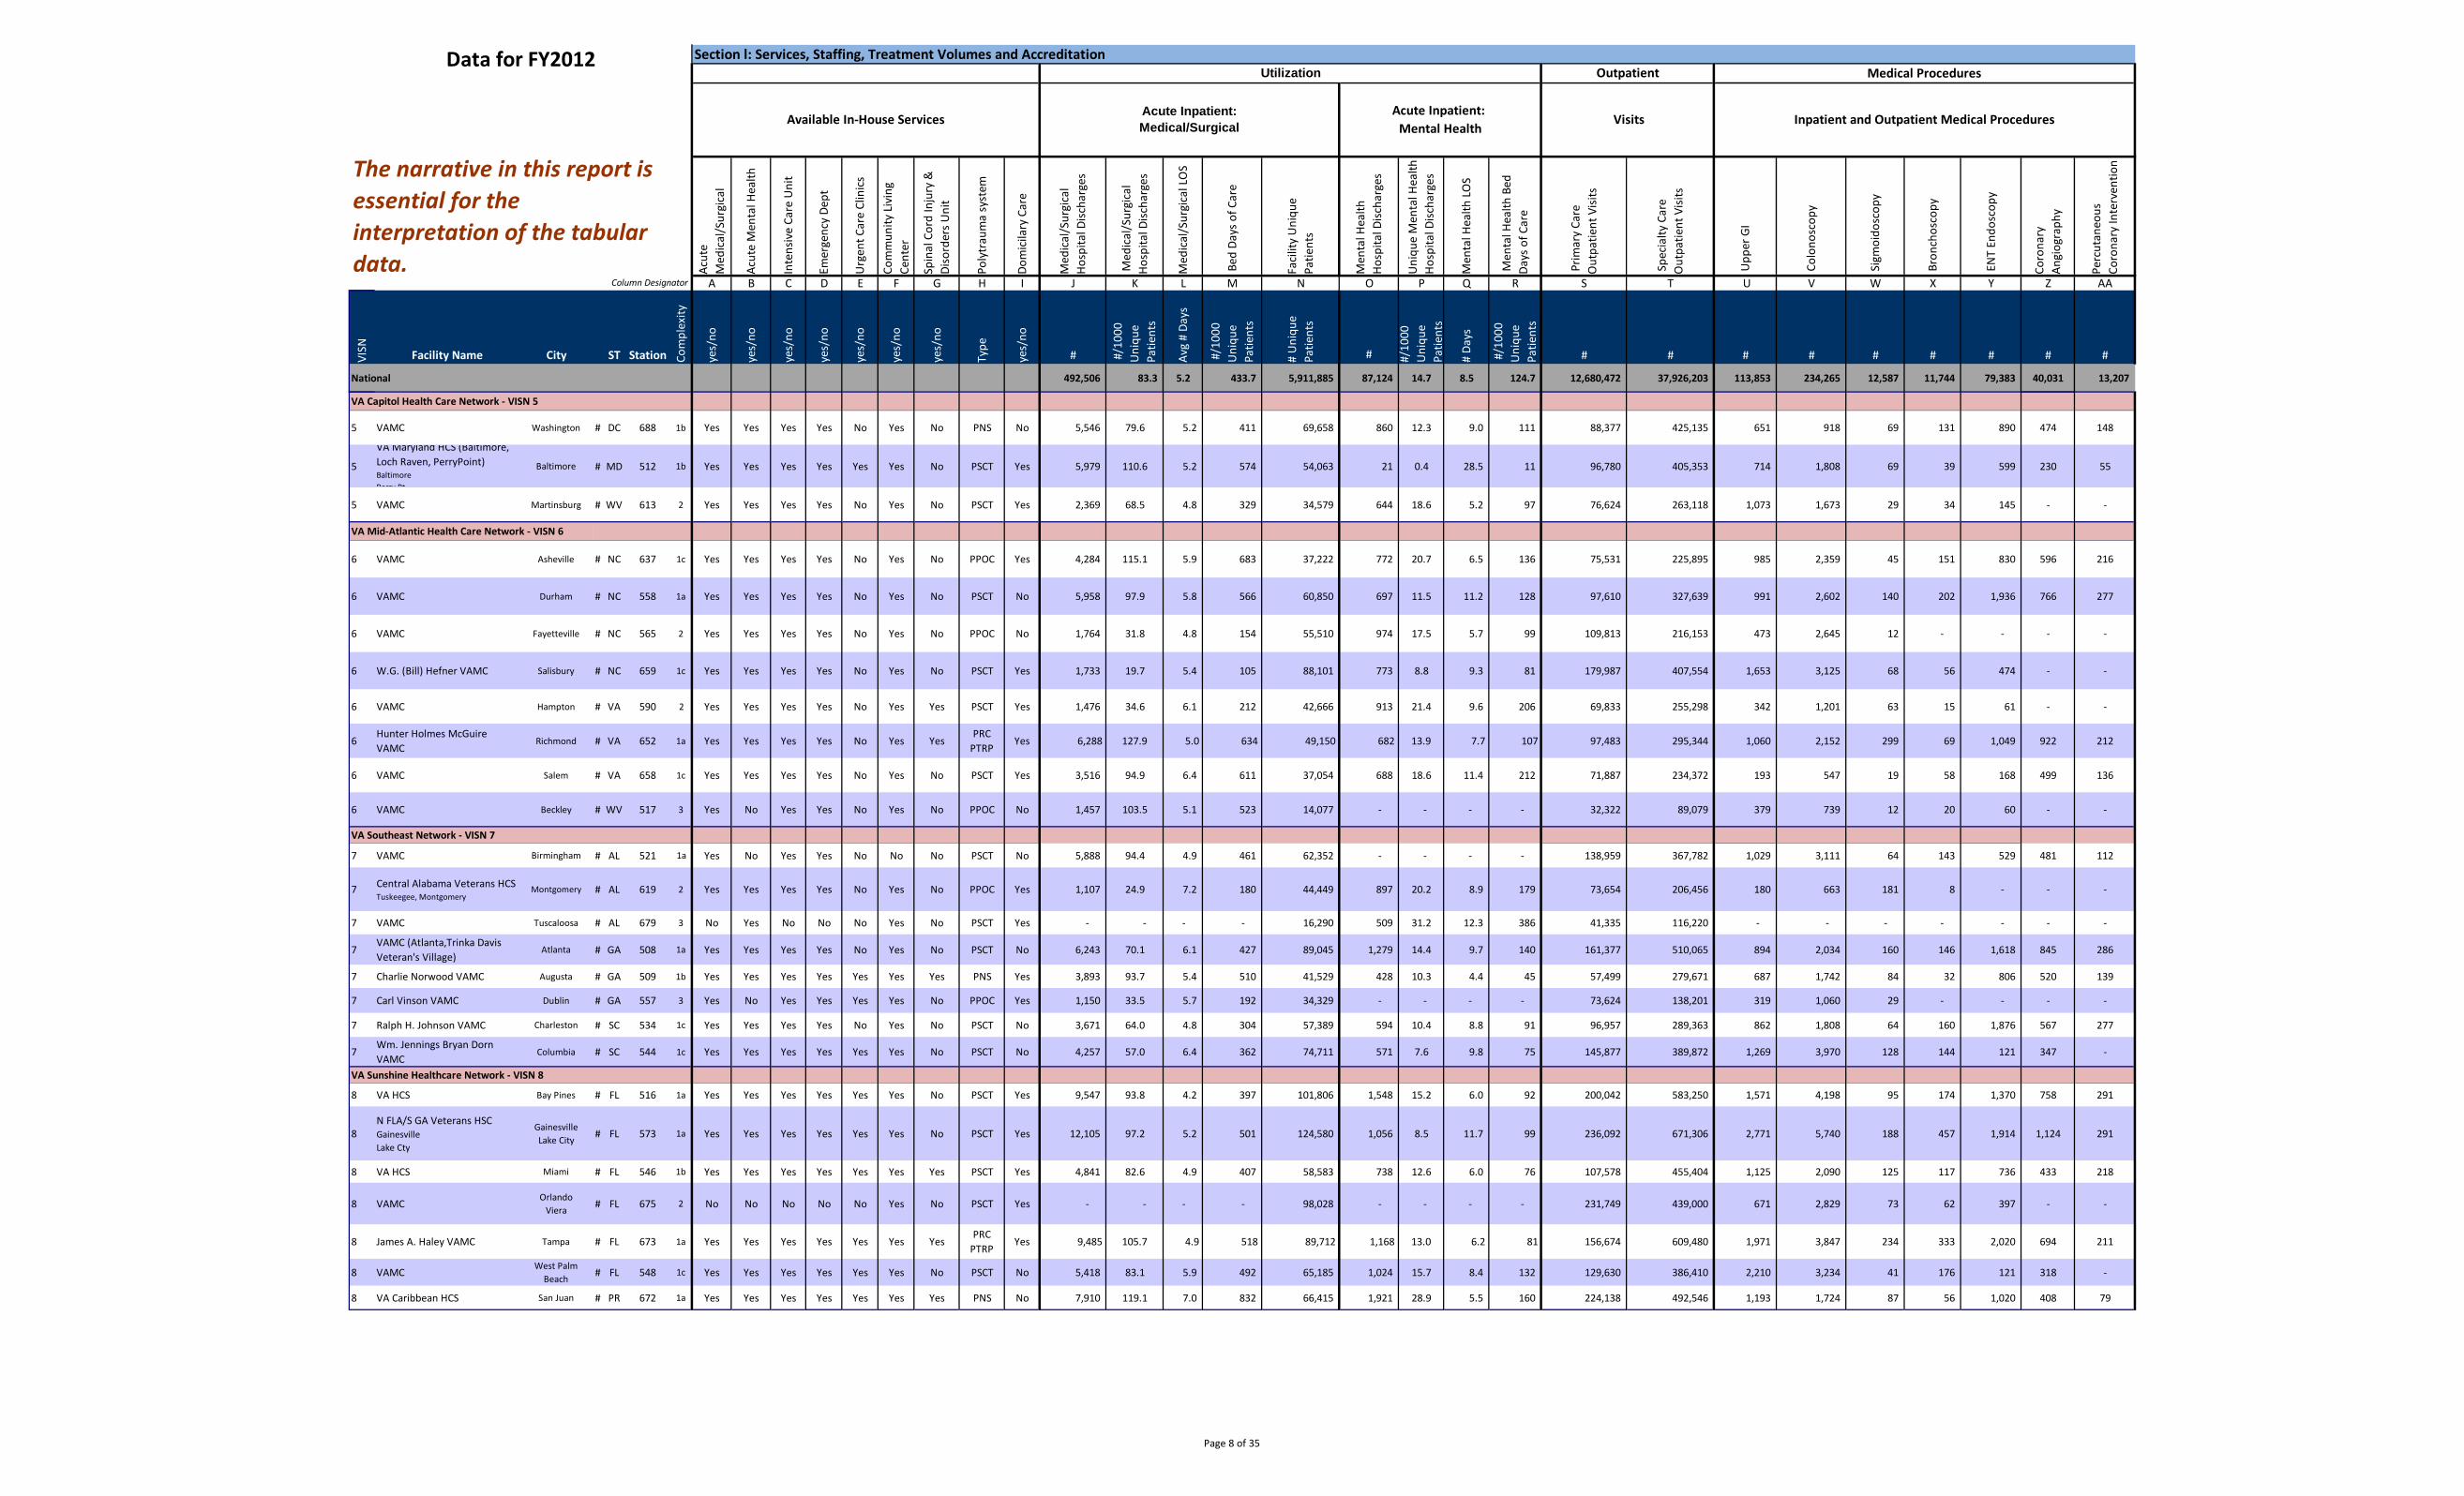
Data for FY2012 Section l: Services, Staffing, Treatment Volumes and Accreditation Utilization Outpatient Medical Procedures
Available In-House Services Acute Inpatient: Medical/Surgical
Acute Inpatient: Mental Health
Visits Inpatient and Outpatient Medical Procedures
The narrative in this report is essential for the gi
cal
a
tl H
ealth
are
Uni
t
ep
tD e Cl
inic
s
y Li
ving
d
njur
y &
Uni
t
syst
em
ar
e
gica
l sc
harg
es ur
gica
l
scha
rges
gi
cal L
OS
f Car
e i
ue
alth
isc
harg
es
al H
ealth
sc
harg
es
alth
LO
S
lth B
ed
t
sits
Vi
re
t sit
sVi
o
y
co
py y
op
y
s nt
erve
ntio
n
interpretation of the tabular data.
Column Designator
Ac
ute
Med
ical
/Sur
Ac
ute
Men
Inte
nsiv
e C
Emer
genc
y
Urg
ent C
ar
Com
mun
itCe
nter
Spin
al C
or I
Di
sord
ers
Poly
trau
ma
Dom
icila
ryC
Med
ical
/Sur
Ho
spita
l Di
Med
ical
/S Ho
spita
l Di
Med
ical
/Sur
Bed
Day
s o
Fa
cilit
y U
nq
Patie
nts
Men
tal H
e Ho
spita
l D U
niqu
e M
ent
Ho
spita
l Di
M
enta
l He
Men
tal H
eaDa
ys o
f Car
e
P
rimar
y Ca
reO
utpa
tien
Spe
cial
ty C
aO
utpa
tien
Upp
er G
I
Col
onos
cp
Sig
moi
dos
Bro
ncho
scop
EN
T En
dosc
Coro
nary
phAn
giog
ray
Perc
utan
eou
Co
rona
ry I
A B C D E F G H I J K L M N O P Q R S T U V W X Y Z AA
xity
ays
Facility Name VISN City ST Station Com
ple
yes/
no
yes/
no
yes/
no
yes/
no
yes/
no
yes/
no
yes/
no
Type
yes/
no
# #/1
000
Uni
que
Patie
nts
Av
g #
D
#/1
000
Uni
que
Patie
nts
qu
# U
nie
Patie
nts
# #/10
00
Uni
que
Patie
nts
# Da
ys
#/1
000
Uni
que
Patie
nts
# # # # # # # # #
National 492,506 83.3 5.2 433.7 5,911,885 87,124 14.7 8.5 124.7 12,680,472 37,926,203 113,853 234,265 12,587 11,744 79,383 40,031 13,207
VA New England Health Care System - VISN 1
1 VA Connecticut HCS West Haven # CT 689 1a Yes Yes Yes Yes Yes Yes No PSCT Yes 4,202 71.0 6.4 452 59,153 1,091 18.4 9.3 171 112,106 400,855 1,216 2,723 111 102 824 366 198
1 Edith N Rogers Memorial Veterans Hospital
Bedford # MA 518 3 No Yes No No Yes Yes No PSCT PPOC
Yes - - - - 19,633 172 8.8 2.2 19 32,089 144,444 - - - - - - -
VA Boston HCS 1 W Roxbury, Brockton Jamaica
Plns West Roxbury # MA 523 1a Yes Yes Yes Yes Yes Yes Yes PNS Yes 6,644 97.2 6.0 580 68,368 2,554 37.4 12.7 476 74,423 423,610 1,022 1,679 86 284 1,797 648 204
1 VAMC Northampton # MA 631 3 No Yes No No Yes Yes No PSCT No - - - - 24,599 219 8.9 3.9 35 54,711 113,874 - - - - - - -
1 Togus VAMC Augusta # ME 402 2 Yes Yes Yes Yes No Yes No PSCT No 1,738 43.0 5.9 254 40,435 97 2.4 3.7 9 80,011 188,876 550 971 20 38 243 - -
1 VAMC Manchester # NH 608 3 No No No No Yes Yes No PSCT No - - - - 24,342 - - - - 51,794 122,055 604 1,180 26 - 71 - -
1 VAMC Providence # RI 650 2 Yes Yes Yes Yes No No No PSCT No 2,889 83.8 4.9 414 34,486 634 18.4 8.0 148 64,584 242,301 751 1,602 38 71 173 - -
1 VAMC White River Junction # VT 405 2 Yes Yes Yes Yes Yes No No PSCT No 2,072 81.7 5.3 434 25,353 282 11.1 10.6 118 61,605 141,636 417 997 30 62 430 - -
VA Healthcare Network Upstate New York - VISN 2
2 Samuel S. Stratton VAMC Albany # NY 528A8 1c Yes Yes Yes Yes No Yes No PSCT Yes 2,444 57.4 6.0 344 42,604 402 9.4 7.3 69 64,991 216,462 390 1,368 16 38 1,019 117 4
2 VA Western New York HCS Buffalo, Batavia
Buffalo # NY 528 1c Yes Yes Yes Yes No Yes No PSCT Yes 4,707 69.4 6.5 454 67,818 818 12.1 8.4 101 95,659 334,994 843 2,710 169 128 341 - -
2 VAMC Bath # NY 528A6 3 No No Yes Yes No Yes No PSCT Yes 742 58.2 3.9 225 12,742 - - - - 28,240 104,843 - - - - - 621 336
2 VAMC Canandaigua # NY 528A5 3 No No No No No Yes No PSCT Yes - - - - 20,658 - - - - 38,796 126,863 - - - - - - -
2 VAMC Syracuse # NY 528A7 1c Yes Yes Yes Yes No Yes Yes PNS No 4,016 71.0 5.7 406 56,591 508 9.0 9.3 83 88,031 230,010 868 1,422 96 108 664 316 86
VA NY/NJ Veterans Healthcare Network - VISN 3
3 VA New Jersey HCS East Orange # NJ 561 1c Yes Yes Yes Yes Yes Yes Yes PSCT Yes 2,594 43.5 5.9 258 59,659 1,077 18.1 11.4 205 107,979 380,983 718 1,775 97 74 811 110 1
3 James J. Peters VAMC Bronx # NY 526 1c Yes Yes Yes Yes No Yes Yes PNS No 3,335 131.3 6.8 887 25,393 521 20.5 12.6 258 40,151 242,192 426 992 50 130 1,145 - -
3 VA NY Harbor HCS
NY Harbor Brooklyn
New York Harbor # NY 630 1a Yes Yes Yes Yes No Yes No PSCT Yes 6,670 131.5 5.9 770 50,706 1,052 20.7 7.5 156 92,747 537,666 1,083 2,696 96 204 2,051 523 187
3 VA Hudson Valley HCS Montrose, Castle Pt
Montrose # NY 620 3 No Yes No No Yes Yes Yes PSCT Yes 660 26.1 5.4 140 25,300 358 14.2 16.7 237 48,504 229,087 384 793 - - 9 249 1
3 VAMC Northport # NY 632 1c Yes Yes Yes Yes Yes Yes No PSCT Yes 2,701 77.4 7.3 563 34,906 512 14.7 27.9 410 57,059 268,879 417 1,263 40 39 350 19 -
VA Healthcare - VISN 4
4 VAMC Wilmington # DE 460 2 Yes No Yes Yes No Yes No PSCT No 1,374 50.6 5.7 289 27,135 - - - - 44,670 132,398 596 1,149 8 29 22 - -
4 James E. Van Zandt VAMC Altoona # PA 503 3 No No Yes Yes No Yes No PSCT No 882 35.0 4.2 149 25,188 - - - - 52,563 87,822 57 73 - - - - -
4 VAMC Butler # PA 529 3 No No No No No Yes No PSCT Yes - - - - 18,688 - - - - 32,772 75,546 - - - - - - -
4 VAMC Coatesville # PA 542 3 No Yes No No Yes Yes No PSCT Yes 49 2.6 3.2 8 19,076 669 35.1 8.3 293 28,550 115,873 - - - - - - -
4 VAMC Erie # PA 562 3 Yes No Yes Yes Yes Yes No PSCT No 989 43.0 2.9 126 22,975 - - - - 51,476 103,245 131 618 - - 103 - -
4 VAMC Lebanon # PA 595 2 Yes Yes Yes Yes No Yes No PSCT Yes 1,756 39.0 3.9 153 45,021 670 14.9 9.3 139 88,536 237,373 1,467 2,865 29 37 562 - -
4 VAMC Philadelphia # PA 642 1b Yes Yes Yes Yes No Yes No PNS No 4,597 77.9 6.0 468 58,991 1,140 19.3 12.1 234 97,170 323,114 640 1,173 134 34 1,911 323 44
4 VA Pittsburgh HCS Heinz, Univ Dr, Highld Dr
Pittsburgh # PA 646 1a Yes Yes Yes Yes No Yes No PSCT Yes 8,475 126.0 4.7 596 67,274 1,074 16.0 12.7 203 104,029 348,075 1,653 2,623 125 240 1,339 838 152
4 VAMC Wilkes-Barre # PA 693 2 Yes Yes Yes Yes No Yes No PSCT Yes 2,250 55.9 4.9 272 40,231 308 7.7 6.8 52 74,277 184,423 978 2,175 16 18 - 60 -
4 Louis A. Johnson VAMC Clarksburg # WV 540 2 Yes Yes Yes Yes No Yes No PPOC Yes 2,378 104.4 5.4 566 22,783 235 10.3 7.1 73 61,057 125,976 521 1,030 20 33 243 - -
VISN Facility Name City ST Station Com
plex
ity
National
VA New England Health Care System - VISN 1
1 VA Connecticut HCS West Haven # CT 689 1a
1 Edith N Rogers Memorial Veterans Hospital
Bedford # MA 518 3
1 VA Boston HCS W Roxbury, Brockton Jamaica Plns
West Roxbury # MA 523 1a
1 VAMC Northampton # MA 631 3
1 Togus VAMC Augusta # ME 402 2
1 VAMC Manchester # NH 608 3
1 VAMC Providence # RI 650 2
1 VAMC White River Junction # VT 405 2
VA Healthcare Network Upstate New York - VISN 2
2 Samuel S. Stratton VAMC Albany # NY 528A8 1c
2 VA Western New York HCS Buffalo, Batavia
Buffalo # NY 528 1c
2 VAMC Bath # NY 528A6 3
2 VAMC Canandaigua # NY 528A5 3
2 VAMC Syracuse # NY 528A7 1c
VA NY/NJ Veterans Healthcare Network - VISN 3
3 VA New Jersey HCS East Orange # NJ 561 1c
3 James J. Peters VAMC Bronx # NY 526 1c
3 VA NY Harbor HCS NY Harbor Brooklyn
New York Harbor # NY 630 1a
3 VA Hudson Valley HCS Montrose, Castle Pt
Montrose # NY 620 3
3 VAMC Northport # NY 632 1c
VA Healthcare - VISN 4
4 VAMC Wilmington # DE 460 2
4 James E. Van Zandt VAMC Altoona # PA 503 3
4 VAMC Butler # PA 529 3
4 VAMC Coatesville # PA 542 3
4 VAMC Erie # PA 562 3
4 VAMC Lebanon # PA 595 2
4 VAMC Philadelphia # PA 642 1b
4 VA Pittsburgh HCS Heinz, Univ Dr, Highld Dr
Pittsburgh # PA 646 1a
4 VAMC Wilkes-Barre # PA 693 2
4 Louis A. Johnson VAMC Clarksburg # WV 540 2
Data for FY2012
Column Designator
The narrative in this report is essential for the interpretation of the tabular data. CT
sca
ns
MRI
scan
s
Mam
mog
raph
y
Aver
age
Daily
Cen
sus
(ADC
)
Uni
que
Resid
ents
Long
Sta
y De
men
tiaCa
re (4
2)
Long
Sta
y Co
ntin
uing
Care
(44)
Long
Sta
y M
enta
lHe
alth
Rec
over
y (4
5)
Long
Sta
y Sp
inal
Cor
d In
jury
and
Diso
rder
s(4
6)
Resp
ite C
are
(47)
Shor
t Sta
yRe
habi
litat
ion
(64)
Shor
t Sta
y Re
sotr
ativ
eCa
re (6
6)
Shor
t Sta
y Co
ntin
uing
Care
for t
hose
Awai
ting
Plac
emen
t
Shor
t Sta
y M
enta
lHe
alth
Rec
over
y(68
)
Shor
t Sta
y De
men
tiaCa
re (6
9)
Geria
tric
Eva
luat
ion
and
Man
agem
ent
(GEM
) - (8
1)
Shor
t Sta
y Sk
illed
Nur
sing
Care
(95)
Hosp
ice
(may
exc
eed
90 d
ays)
(96)
Artif
act o
f cul
ture
chan
ge m
etric
Tot
alSc
ore
Artif
act o
f cul
ture
chan
ge m
etric
Per
cent
In
crea
seU
nann
ounc
ed su
rvey
outc
omes
: # o
f A-G
findi
ngs
Una
nnou
nced
surv
eyou
tcom
es: #
of H
-Lfin
ding
s
IV in
fect
ions
Urin
ary
Trac
tIn
fect
ions
Cons
isten
t As
signm
ent -
Lon
gSt
ayCo
nsist
ent
Assig
nmen
t -Sh
ort
Stay
AB AC AD AE AF AG AH AI AJ AK AL AM AN AO AP AQ AR AS AZ BA BB BC BD BE BF BG
# # # # # Pct Pct Pct Pct Pct Pct Pct Pct Pct Pct Pct Pct Pct # Pct # # # # Pct Pct
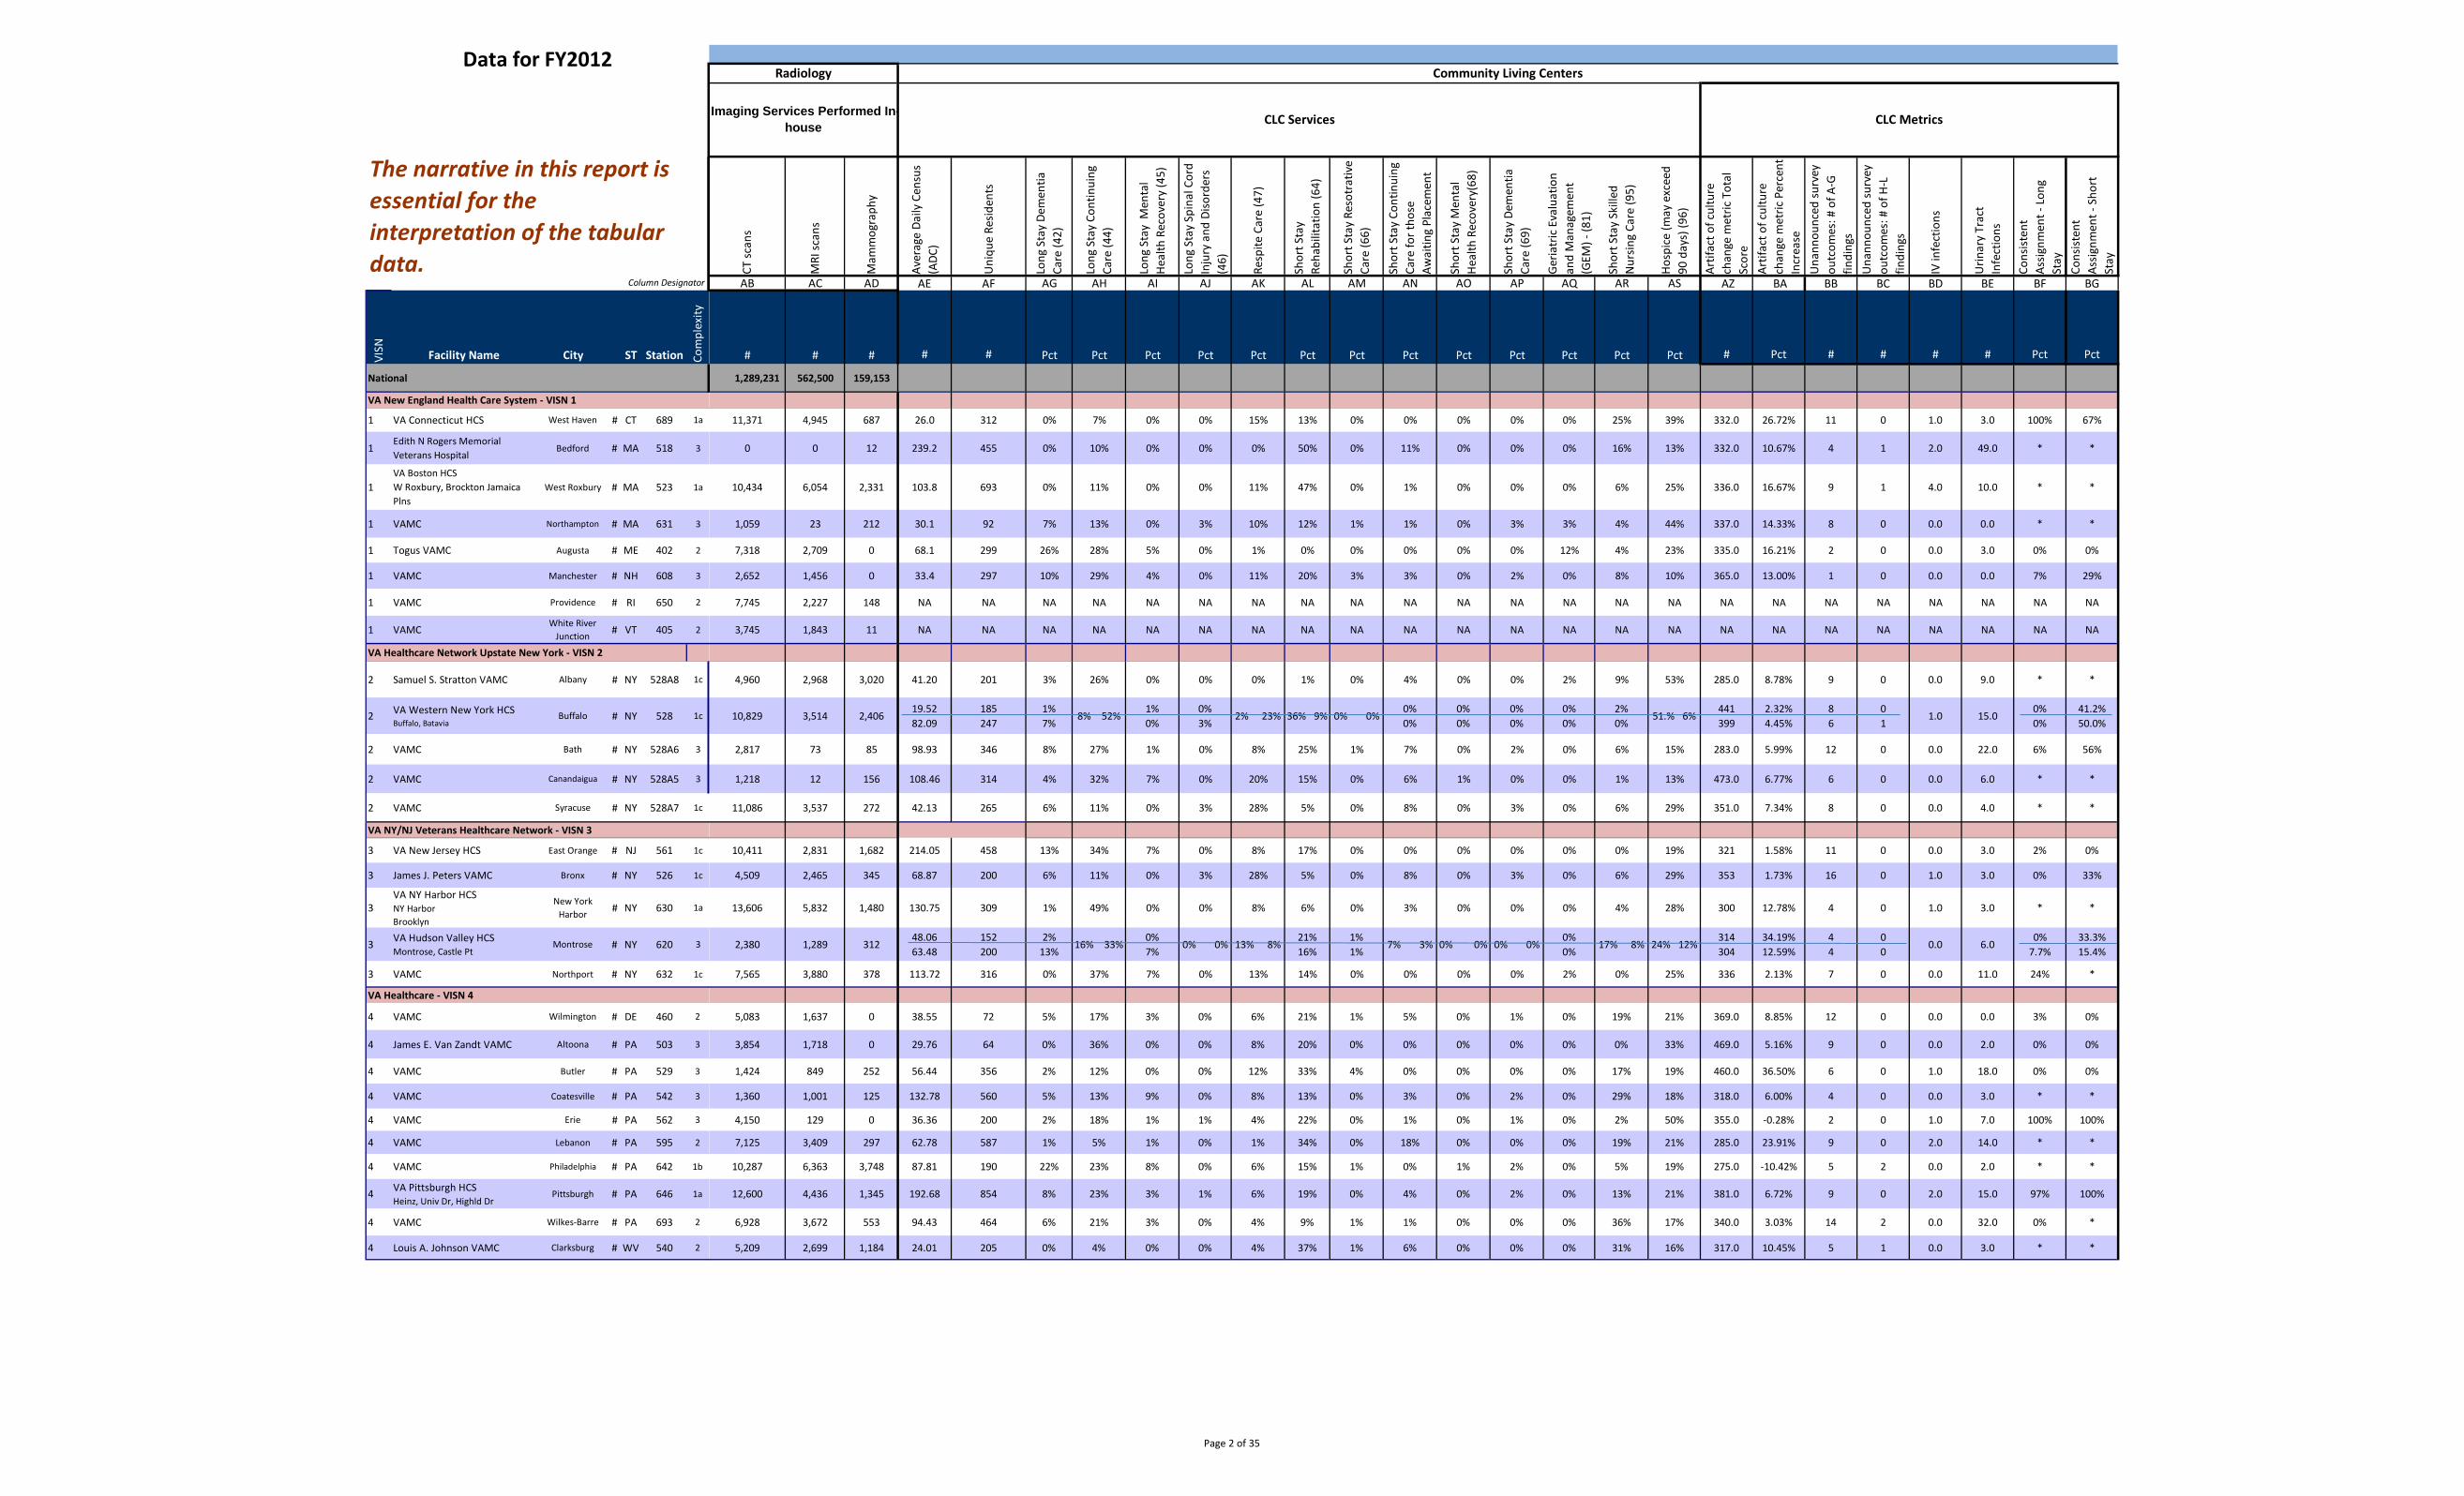
1,289,231 562,500 159,153
11,371 4,945 687 26.0 312 0% 7% 0% 0% 15% 13% 0% 0% 0% 0% 0% 25% 39% 332.0 26.72% 11 0 1.0 3.0 100% 67%
0 0 12 239.2 455 0% 10% 0% 0% 0% 50% 0% 11% 0% 0% 0% 16% 13% 332.0 10.67% 4 1 2.0 49.0 * *
10,434 6,054 2,331 103.8 693 0% 11% 0% 0% 11% 47% 0% 1% 0% 0% 0% 6% 25% 336.0 16.67% 9 1 4.0 10.0 * *
1,059 23 212 30.1 92 7% 13% 0% 3% 10% 12% 1% 1% 0% 3% 3% 4% 44% 337.0 14.33% 8 0 0.0 0.0 * *
7,318 2,709 0 68.1 299 26% 28% 5% 0% 1% 0% 0% 0% 0% 0% 12% 4% 23% 335.0 16.21% 2 0 0.0 3.0 0% 0%
2,652 1,456 0 33.4 297 10% 29% 4% 0% 11% 20% 3% 3% 0% 2% 0% 8% 10% 365.0 13.00% 1 0 0.0 0.0 7% 29%
7,745 2,227 148 NA NA NA NA NA NA NA NA NA NA NA NA NA NA NA NA NA NA NA NA NA NA NA
3,745 1,843 11 NA NA NA NA NA NA NA NA NA NA NA NA NA NA NA NA NA NA NA NA NA NA NA
4,960 2,968 3,020 41.20 201 3% 26% 0% 0% 0% 1% 0% 4% 0% 0% 2% 9% 53% 285.0 8.78% 9 0 0.0 9.0 * *
10,829 3,514 2,406 19.52 82.09
185 247
1% 7%
8% 52% 1% 0%
0% 3%
2% 23% 36% 9% 0% 0% 0% 0%
0% 0%
0% 0%
0% 0%
2% 0%
51.% 6% 441 399
2.32% 4.45%
8 6
0 1
1.0 15.0 0% 0%
41.2% 50.0%
2,817 73 85 98.93 346 8% 27% 1% 0% 8% 25% 1% 7% 0% 2% 0% 6% 15% 283.0 5.99% 12 0 0.0 22.0 6% 56%
1,218 12 156 108.46 314 4% 32% 7% 0% 20% 15% 0% 6% 1% 0% 0% 1% 13% 473.0 6.77% 6 0 0.0 6.0 * *
11,086 3,537 272 42.13 265 6% 11% 0% 3% 28% 5% 0% 8% 0% 3% 0% 6% 29% 351.0 7.34% 8 0 0.0 4.0 * *
10,411 2,831 1,682 214.05 458 13% 34% 7% 0% 8% 17% 0% 0% 0% 0% 0% 0% 19% 321 1.58% 11 0 0.0 3.0 2% 0%
4,509 2,465 345 68.87 200 6% 11% 0% 3% 28% 5% 0% 8% 0% 3% 0% 6% 29% 353 1.73% 16 0 1.0 3.0 0% 33%
13,606 5,832 1,480 130.75 309 1% 49% 0% 0% 8% 6% 0% 3% 0% 0% 0% 4% 28% 300 12.78% 4 0 1.0 3.0 * *
2,380 1,289 312 48.06 63.48
152 200
2% 13%
16% 33% 0% 7%
0% 0% 13% 8% 21% 16%
1% 1%
7% 3% 0% 0% 0% 0% 0% 0%
17% 8% 24% 12% 314 304
34.19% 12.59%
4 4
0 0
0.0 6.0 0%
7.7% 33.3% 15.4%
7,565 3,880 378 113.72 316 0% 37% 7% 0% 13% 14% 0% 0% 0% 0% 2% 0% 25% 336 2.13% 7 0 0.0 11.0 24% *
5,083 1,637 0 38.55 72 5% 17% 3% 0% 6% 21% 1% 5% 0% 1% 0% 19% 21% 369.0 8.85% 12 0 0.0 0.0 3% 0%
3,854 1,718 0 29.76 64 0% 36% 0% 0% 8% 20% 0% 0% 0% 0% 0% 0% 33% 469.0 5.16% 9 0 0.0 2.0 0% 0%
1,424 849 252 56.44 356 2% 12% 0% 0% 12% 33% 4% 0% 0% 0% 0% 17% 19% 460.0 36.50% 6 0 1.0 18.0 0% 0%
1,360 1,001 125 132.78 560 5% 13% 9% 0% 8% 13% 0% 3% 0% 2% 0% 29% 18% 318.0 6.00% 4 0 0.0 3.0 * *
4,150 129 0 36.36 200 2% 18% 1% 1% 4% 22% 0% 1% 0% 1% 0% 2% 50% 355.0 -0.28% 2 0 1.0 7.0 100% 100%
7,125 3,409 297 62.78 587 1% 5% 1% 0% 1% 34% 0% 18% 0% 0% 0% 19% 21% 285.0 23.91% 9 0 2.0 14.0 * *
10,287 6,363 3,748 87.81 190 22% 23% 8% 0% 6% 15% 1% 0% 1% 2% 0% 5% 19% 275.0 -10.42% 5 2 0.0 2.0 * *
12,600 4,436 1,345 192.68 854 8% 23% 3% 1% 6% 19% 0% 4% 0% 2% 0% 13% 21% 381.0 6.72% 9 0 2.0 15.0 97% 100%
6,928 3,672 553 94.43 464 6% 21% 3% 0% 4% 9% 1% 1% 0% 0% 0% 36% 17% 340.0 3.03% 14 2 0.0 32.0 0% *
5,209 2,699 1,184 24.01 205 0% 4% 0% 0% 4% 37% 1% 6% 0% 0% 0% 31% 16% 317.0 10.45% 5 1 0.0 3.0 * *
CLC Services
Radiology Community Living Centers
CLC Metrics Imaging Services Performed In-house
Page 2 of 35
Data for FY2012
Column Designator
The narrative in this report is essential for the interpretation of the tabular data.
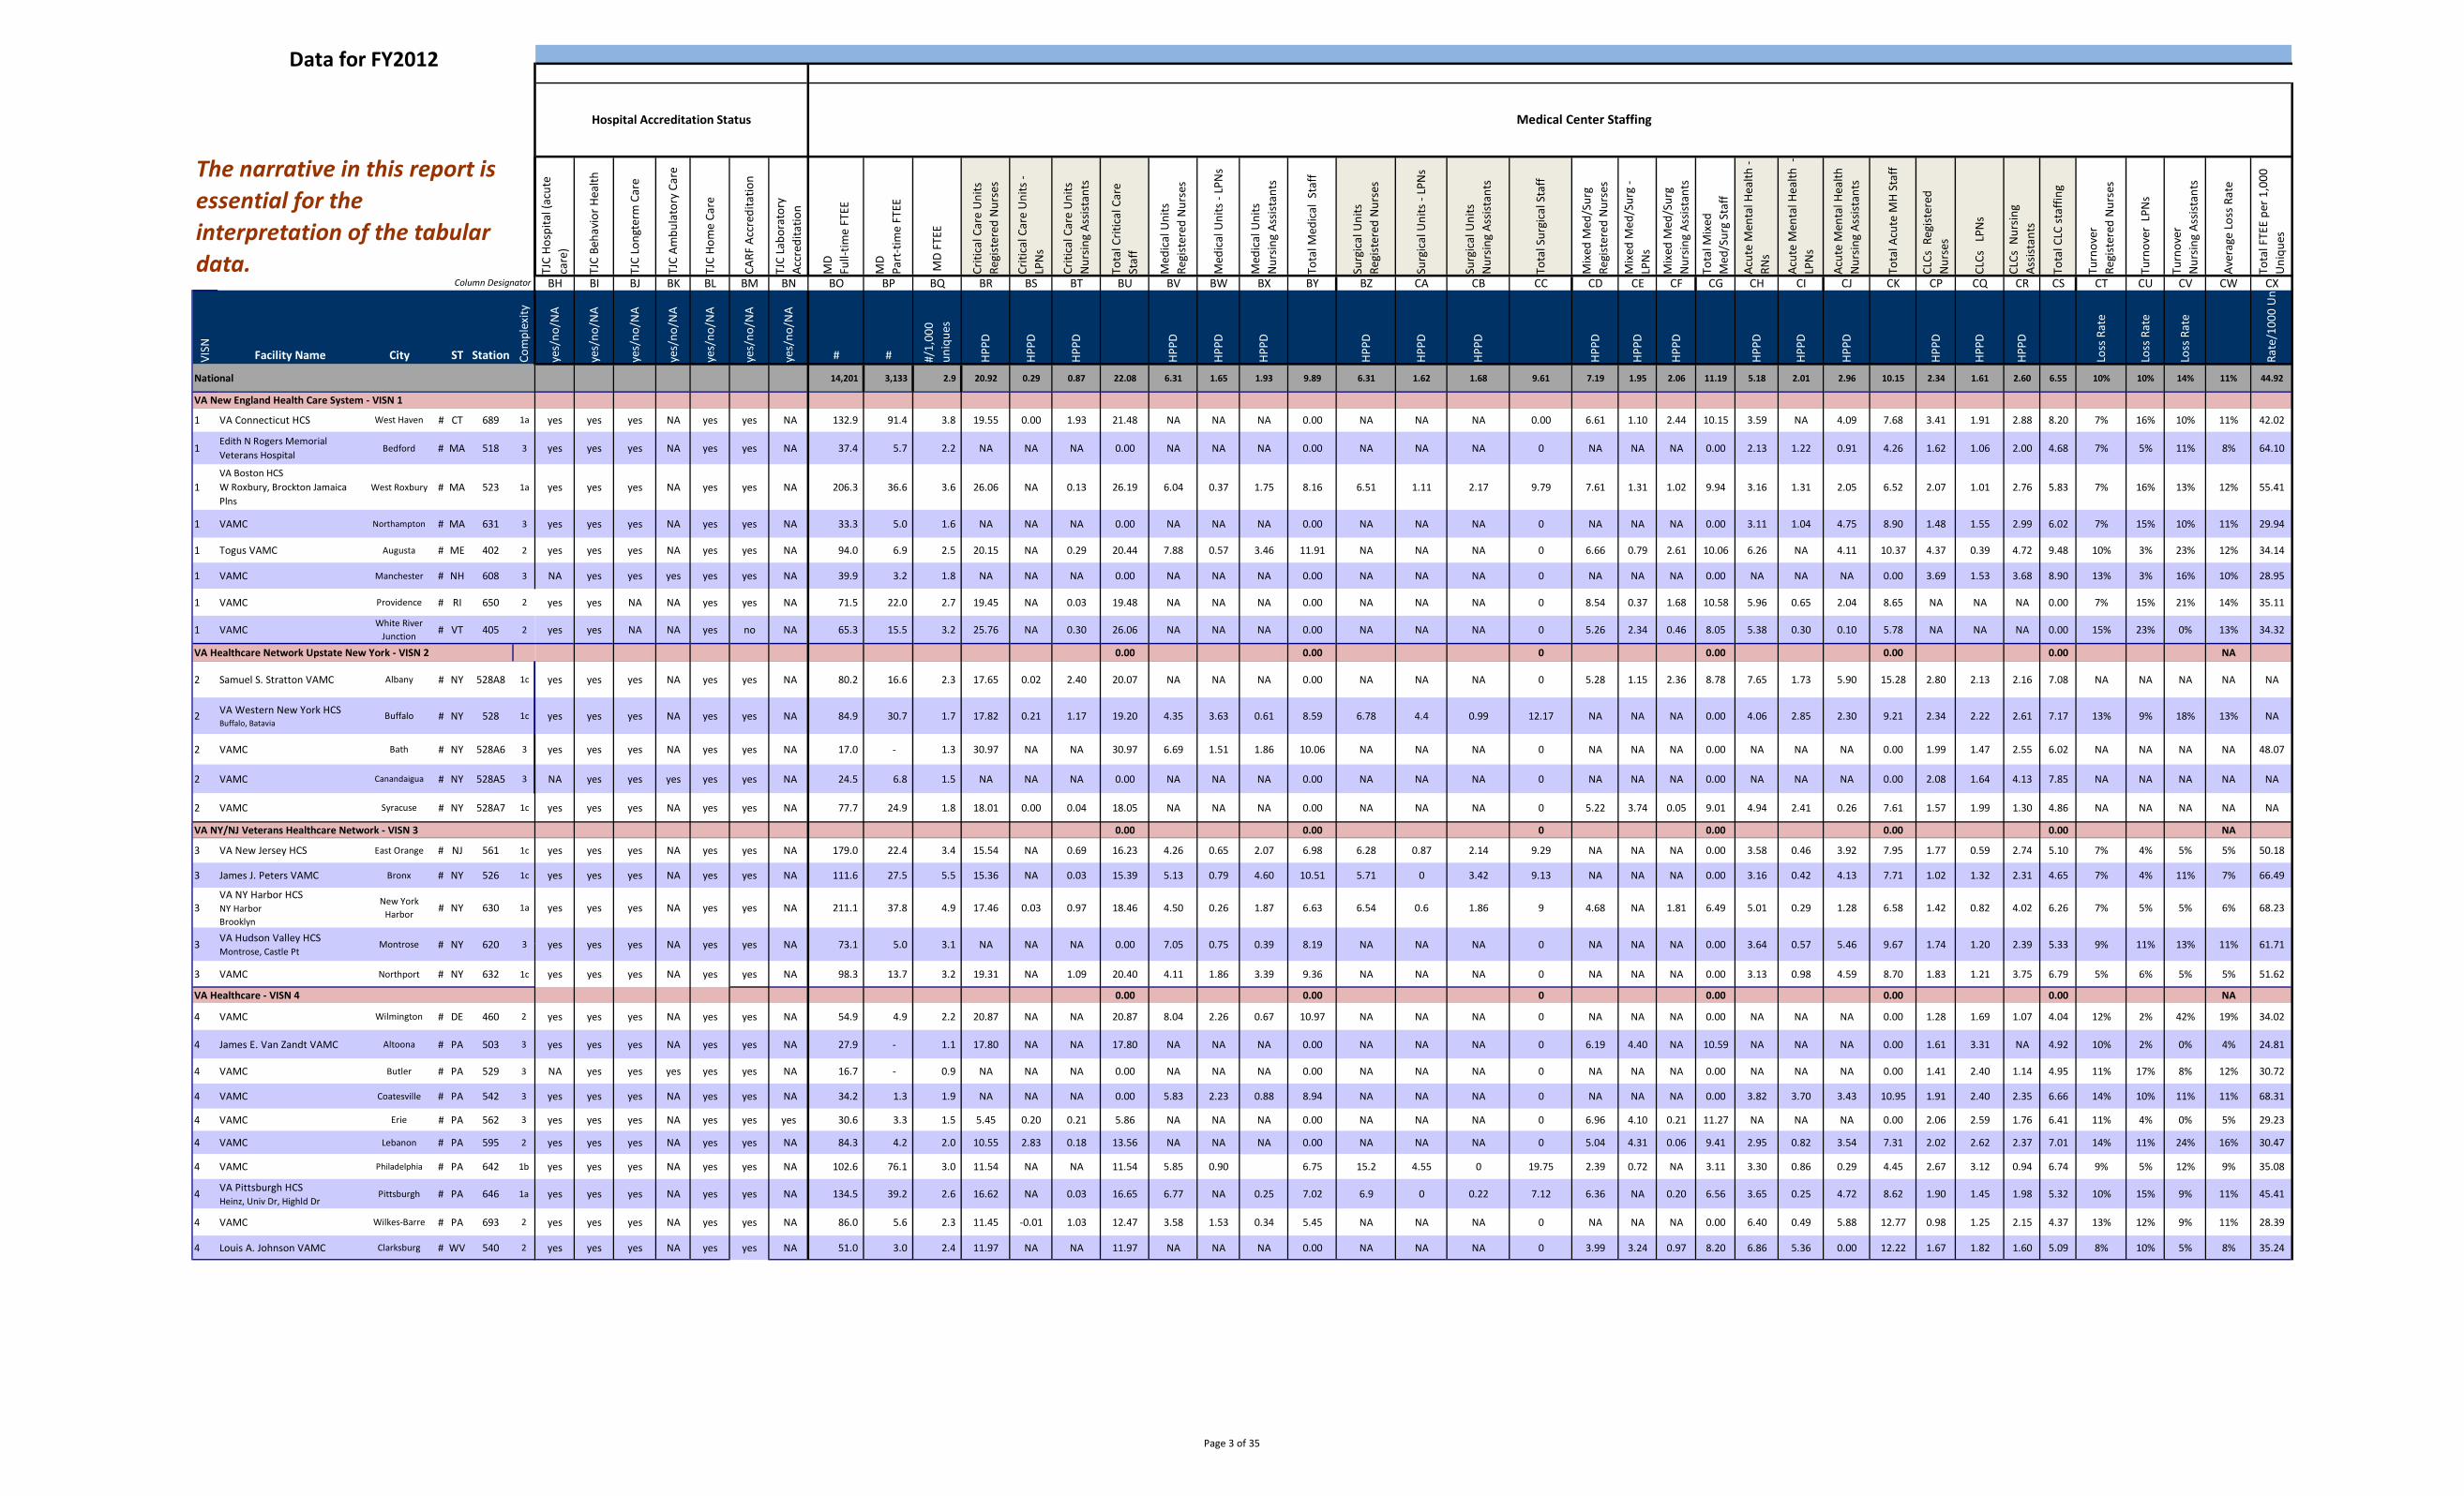
Hospital Accreditation Status Medical Center Staffing
TJC
Hosp
ital (
acut
eca
re)
TJC
Beha
vior
Hea
lth
TJC
Long
term
Car
e
TJC
Ambu
lato
ry C
are
TJC
Hom
e Ca
re
CARF
Acc
redi
tatio
n
TJC
Labo
rato
ryAc
cred
itatio
n
MD
Full-
time
FTEE
MD
Part
-tim
e FT
EE
MD
FTEE
Criti
cal C
are
Uni
tsRe
gist
ered
Nur
ses
Criti
cal C
are
Uni
ts -
LPN
s
Criti
cal C
are
Uni
tsN
ursin
g As
sista
nts
Tota
l Crit
ical
Car
eSt
aff
Med
ical
Uni
tsRe
gist
ered
Nur
ses
Med
ical
Uni
ts -
LPN
s
Med
ical
Uni
tsN
ursin
g As
sista
nts
Tota
l Med
ical
Sta
ff
Surg
ical
Uni
tsRe
gist
ered
Nur
ses
Surg
ical
Uni
ts -
LPN
s
Surg
ical
Uni
tsN
ursin
g As
sista
nts
Tota
l Sur
gica
l Sta
ff
Mix
ed M
ed/S
urg
Regi
ster
ed N
urse
s
Mix
ed M
ed/S
urg
-LP
Ns
Mix
ed M
ed/S
urg
Nur
sing
Assis
tant
s
Tota
l Mix
edM
ed/S
urg
Staf
f
Acut
e M
enta
l Hea
lth -
RNs
Acut
e M
enta
l Hea
lth -
LPN
s
Acut
e M
enta
l Hea
lthN
ursin
g As
sista
nts
Tota
l Acu
te M
H St
aff
CLCs
Reg
ister
edN
urse
s
CLCs
LPN
s
CLCs
Nur
sing
Assis
tant
s
Tota
l CLC
staf
fing
Turn
over
Re
gist
ered
Nur
ses
Turn
over
LPN
s
Turn
over
N
ursin
g As
sista
nts
Aver
age
Loss
Rat
e
Tota
l FTE
E pe
r 1,0
00
Uni
ques
BH BI BJ BK BL BM BN BO BP BQ BR BS BT BU BV BW BX BY BZ CA CB CC CD CE CF CG CH CI CJ CK CP CQ CR CS CT CU CV CW CX
VISN Facility Name City ST Station Com
plex
ity
yes/
no/N
A
yes/
no/N
A
yes/
no/N
A
yes/
no/N
A
yes/
no/N
A
yes/
no/N
A
yes/
no/N
A
# # #/1,
000
uniq
ues
HPPD
HPPD
HPPD
HPPD
HPPD
HPPD
HPPD
HPPD
HPPD
HPPD
HPPD
HPPD
HPPD
HPPD
HPPD
HPPD
HPPD
HPPD
Loss
Rat
e
Loss
Rat
e
Loss
Rat
e
Rate
/100
0 U
n
National 14,201 3,133 2.9 20.92 0.29 0.87 22.08 6.31 1.65 1.93 9.89 6.31 1.62 1.68 9.61 7.19 1.95 2.06 11.19 5.18 2.01 2.96 10.15 2.34 1.61 2.60 6.55 10% 10% 14% 11% 44.92
VA New England Health Care System - VISN 1
1 VA Connecticut HCS West Haven # CT 689 1a yes yes yes NA yes yes NA 132.9 91.4 3.8 19.55 0.00 1.93 21.48 NA NA NA 0.00 NA NA NA 0.00 6.61 1.10 2.44 10.15 3.59 NA 4.09 7.68 3.41 1.91 2.88 8.20 7% 16% 10% 11% 42.02
1 Edith N Rogers Memorial Veterans Hospital
Bedford # MA 518 3 yes yes yes NA yes yes NA 37.4 5.7 2.2 NA NA NA 0.00 NA NA NA 0.00 NA NA NA 0 NA NA NA 0.00 2.13 1.22 0.91 4.26 1.62 1.06 2.00 4.68 7% 5% 11% 8% 64.10
1 VA Boston HCS W Roxbury, Brockton Jamaica Plns
West Roxbury # MA 523 1a yes yes yes NA yes yes NA 206.3 36.6 3.6 26.06 NA 0.13 26.19 6.04 0.37 1.75 8.16 6.51 1.11 2.17 9.79 7.61 1.31 1.02 9.94 3.16 1.31 2.05 6.52 2.07 1.01 2.76 5.83 7% 16% 13% 12% 55.41
1 VAMC Northampton # MA 631 3 yes yes yes NA yes yes NA 33.3 5.0 1.6 NA NA NA 0.00 NA NA NA 0.00 NA NA NA 0 NA NA NA 0.00 3.11 1.04 4.75 8.90 1.48 1.55 2.99 6.02 7% 15% 10% 11% 29.94
1 Togus VAMC Augusta # ME 402 2 yes yes yes NA yes yes NA 94.0 6.9 2.5 20.15 NA 0.29 20.44 7.88 0.57 3.46 11.91 NA NA NA 0 6.66 0.79 2.61 10.06 6.26 NA 4.11 10.37 4.37 0.39 4.72 9.48 10% 3% 23% 12% 34.14
1 VAMC Manchester # NH 608 3 NA yes yes yes yes yes NA 39.9 3.2 1.8 NA NA NA 0.00 NA NA NA 0.00 NA NA NA 0 NA NA NA 0.00 NA NA NA 0.00 3.69 1.53 3.68 8.90 13% 3% 16% 10% 28.95
1 VAMC Providence # RI 650 2 yes yes NA NA yes yes NA 71.5 22.0 2.7 19.45 NA 0.03 19.48 NA NA NA 0.00 NA NA NA 0 8.54 0.37 1.68 10.58 5.96 0.65 2.04 8.65 NA NA NA 0.00 7% 15% 21% 14% 35.11
1 VAMC White River Junction # VT 405 2 yes yes NA NA yes no NA 65.3 15.5 3.2 25.76 NA 0.30 26.06 NA NA NA 0.00 NA NA NA 0 5.26 2.34 0.46 8.05 5.38 0.30 0.10 5.78 NA NA NA 0.00 15% 23% 0% 13% 34.32
VA Healthcare Network Upstate New York - VISN 2 0.00 0.00 0 0.00 0.00 0.00 NA
2 Samuel S. Stratton VAMC Albany # NY 528A8 1c yes yes yes NA yes yes NA 80.2 16.6 2.3 17.65 0.02 2.40 20.07 NA NA NA 0.00 NA NA NA 0 5.28 1.15 2.36 8.78 7.65 1.73 5.90 15.28 2.80 2.13 2.16 7.08 NA NA NA NA NA
2 VA Western New York HCS Buffalo, Batavia
Buffalo # NY 528 1c yes yes yes NA yes yes NA 84.9 30.7 1.7 17.82 0.21 1.17 19.20 4.35 3.63 0.61 8.59 6.78 4.4 0.99 12.17 NA NA NA 0.00 4.06 2.85 2.30 9.21 2.34 2.22 2.61 7.17 13% 9% 18% 13% NA
2 VAMC Bath # NY 528A6 3 yes yes yes NA yes yes NA 17.0 - 1.3 30.97 NA NA 30.97 6.69 1.51 1.86 10.06 NA NA NA 0 NA NA NA 0.00 NA NA NA 0.00 1.99 1.47 2.55 6.02 NA NA NA NA 48.07
2 VAMC Canandaigua # NY 528A5 3 NA yes yes yes yes yes NA 24.5 6.8 1.5 NA NA NA 0.00 NA NA NA 0.00 NA NA NA 0 NA NA NA 0.00 NA NA NA 0.00 2.08 1.64 4.13 7.85 NA NA NA NA NA
2 VAMC Syracuse # NY 528A7 1c yes yes yes NA yes yes NA 77.7 24.9 1.8 18.01 0.00 0.04 18.05 NA NA NA 0.00 NA NA NA 0 5.22 3.74 0.05 9.01 4.94 2.41 0.26 7.61 1.57 1.99 1.30 4.86 NA NA NA NA NA
VA NY/NJ Veterans Healthcare Network - VISN 3 0.00 0.00 0 0.00 0.00 0.00 NA
3 VA New Jersey HCS East Orange # NJ 561 1c yes yes yes NA yes yes NA 179.0 22.4 3.4 15.54 NA 0.69 16.23 4.26 0.65 2.07 6.98 6.28 0.87 2.14 9.29 NA NA NA 0.00 3.58 0.46 3.92 7.95 1.77 0.59 2.74 5.10 7% 4% 5% 5% 50.18
3 James J. Peters VAMC Bronx # NY 526 1c yes yes yes NA yes yes NA 111.6 27.5 5.5 15.36 NA 0.03 15.39 5.13 0.79 4.60 10.51 5.71 0 3.42 9.13 NA NA NA 0.00 3.16 0.42 4.13 7.71 1.02 1.32 2.31 4.65 7% 4% 11% 7% 66.49
3 VA NY Harbor HCS NY Harbor Brooklyn
New York Harbor # NY 630 1a yes yes yes NA yes yes NA 211.1 37.8 4.9 17.46 0.03 0.97 18.46 4.50 0.26 1.87 6.63 6.54 0.6 1.86 9 4.68 NA 1.81 6.49 5.01 0.29 1.28 6.58 1.42 0.82 4.02 6.26 7% 5% 5% 6% 68.23
3 VA Hudson Valley HCS Montrose, Castle Pt
Montrose # NY 620 3 yes yes yes NA yes yes NA 73.1 5.0 3.1 NA NA NA 0.00 7.05 0.75 0.39 8.19 NA NA NA 0 NA NA NA 0.00 3.64 0.57 5.46 9.67 1.74 1.20 2.39 5.33 9% 11% 13% 11% 61.71
3 VAMC Northport # NY 632 1c yes yes yes NA yes yes NA 98.3 13.7 3.2 19.31 NA 1.09 20.40 4.11 1.86 3.39 9.36 NA NA NA 0 NA NA NA 0.00 3.13 0.98 4.59 8.70 1.83 1.21 3.75 6.79 5% 6% 5% 5% 51.62
VA Healthcare - VISN 4 0.00 0.00 0 0.00 0.00 0.00 NA
4 VAMC Wilmington # DE 460 2 yes yes yes NA yes yes NA 54.9 4.9 2.2 20.87 NA NA 20.87 8.04 2.26 0.67 10.97 NA NA NA 0 NA NA NA 0.00 NA NA NA 0.00 1.28 1.69 1.07 4.04 12% 2% 42% 19% 34.02
4 James E. Van Zandt VAMC Altoona # PA 503 3 yes yes yes NA yes yes NA 27.9 - 1.1 17.80 NA NA 17.80 NA NA NA 0.00 NA NA NA 0 6.19 4.40 NA 10.59 NA NA NA 0.00 1.61 3.31 NA 4.92 10% 2% 0% 4% 24.81
4 VAMC Butler # PA 529 3 NA yes yes yes yes yes NA 16.7 - 0.9 NA NA NA 0.00 NA NA NA 0.00 NA NA NA 0 NA NA NA 0.00 NA NA NA 0.00 1.41 2.40 1.14 4.95 11% 17% 8% 12% 30.72
4 VAMC Coatesville # PA 542 3 yes yes yes NA yes yes NA 34.2 1.3 1.9 NA NA NA 0.00 5.83 2.23 0.88 8.94 NA NA NA 0 NA NA NA 0.00 3.82 3.70 3.43 10.95 1.91 2.40 2.35 6.66 14% 10% 11% 11% 68.31
4 VAMC Erie # PA 562 3 yes yes yes NA yes yes yes 30.6 3.3 1.5 5.45 0.20 0.21 5.86 NA NA NA 0.00 NA NA NA 0 6.96 4.10 0.21 11.27 NA NA NA 0.00 2.06 2.59 1.76 6.41 11% 4% 0% 5% 29.23
4 VAMC Lebanon # PA 595 2 yes yes yes NA yes yes NA 84.3 4.2 2.0 10.55 2.83 0.18 13.56 NA NA NA 0.00 NA NA NA 0 5.04 4.31 0.06 9.41 2.95 0.82 3.54 7.31 2.02 2.62 2.37 7.01 14% 11% 24% 16% 30.47
4 VAMC Philadelphia # PA 642 1b yes yes yes NA yes yes NA 102.6 76.1 3.0 11.54 NA NA 11.54 5.85 0.90 6.75 15.2 4.55 0 19.75 2.39 0.72 NA 3.11 3.30 0.86 0.29 4.45 2.67 3.12 0.94 6.74 9% 5% 12% 9% 35.08
4 VA Pittsburgh HCS Heinz, Univ Dr, Highld Dr
Pittsburgh # PA 646 1a yes yes yes NA yes yes NA 134.5 39.2 2.6 16.62 NA 0.03 16.65 6.77 NA 0.25 7.02 6.9 0 0.22 7.12 6.36 NA 0.20 6.56 3.65 0.25 4.72 8.62 1.90 1.45 1.98 5.32 10% 15% 9% 11% 45.41
4 VAMC Wilkes-Barre # PA 693 2 yes yes yes NA yes yes NA 86.0 5.6 2.3 11.45 -0.01 1.03 12.47 3.58 1.53 0.34 5.45 NA NA NA 0 NA NA NA 0.00 6.40 0.49 5.88 12.77 0.98 1.25 2.15 4.37 13% 12% 9% 11% 28.39
4 Louis A. Johnson VAMC Clarksburg # WV 540 2 yes yes yes NA yes yes NA 51.0 3.0 2.4 11.97 NA NA 11.97 NA NA NA 0.00 NA NA NA 0 3.99 3.24 0.97 8.20 6.86 5.36 0.00 12.22 1.67 1.82 1.60 5.09 8% 10% 5% 8% 35.24
Page 3 of 35
Data for FY2012
Column Designator
The narrative in this report is essential for the interpretation of the tabular data.
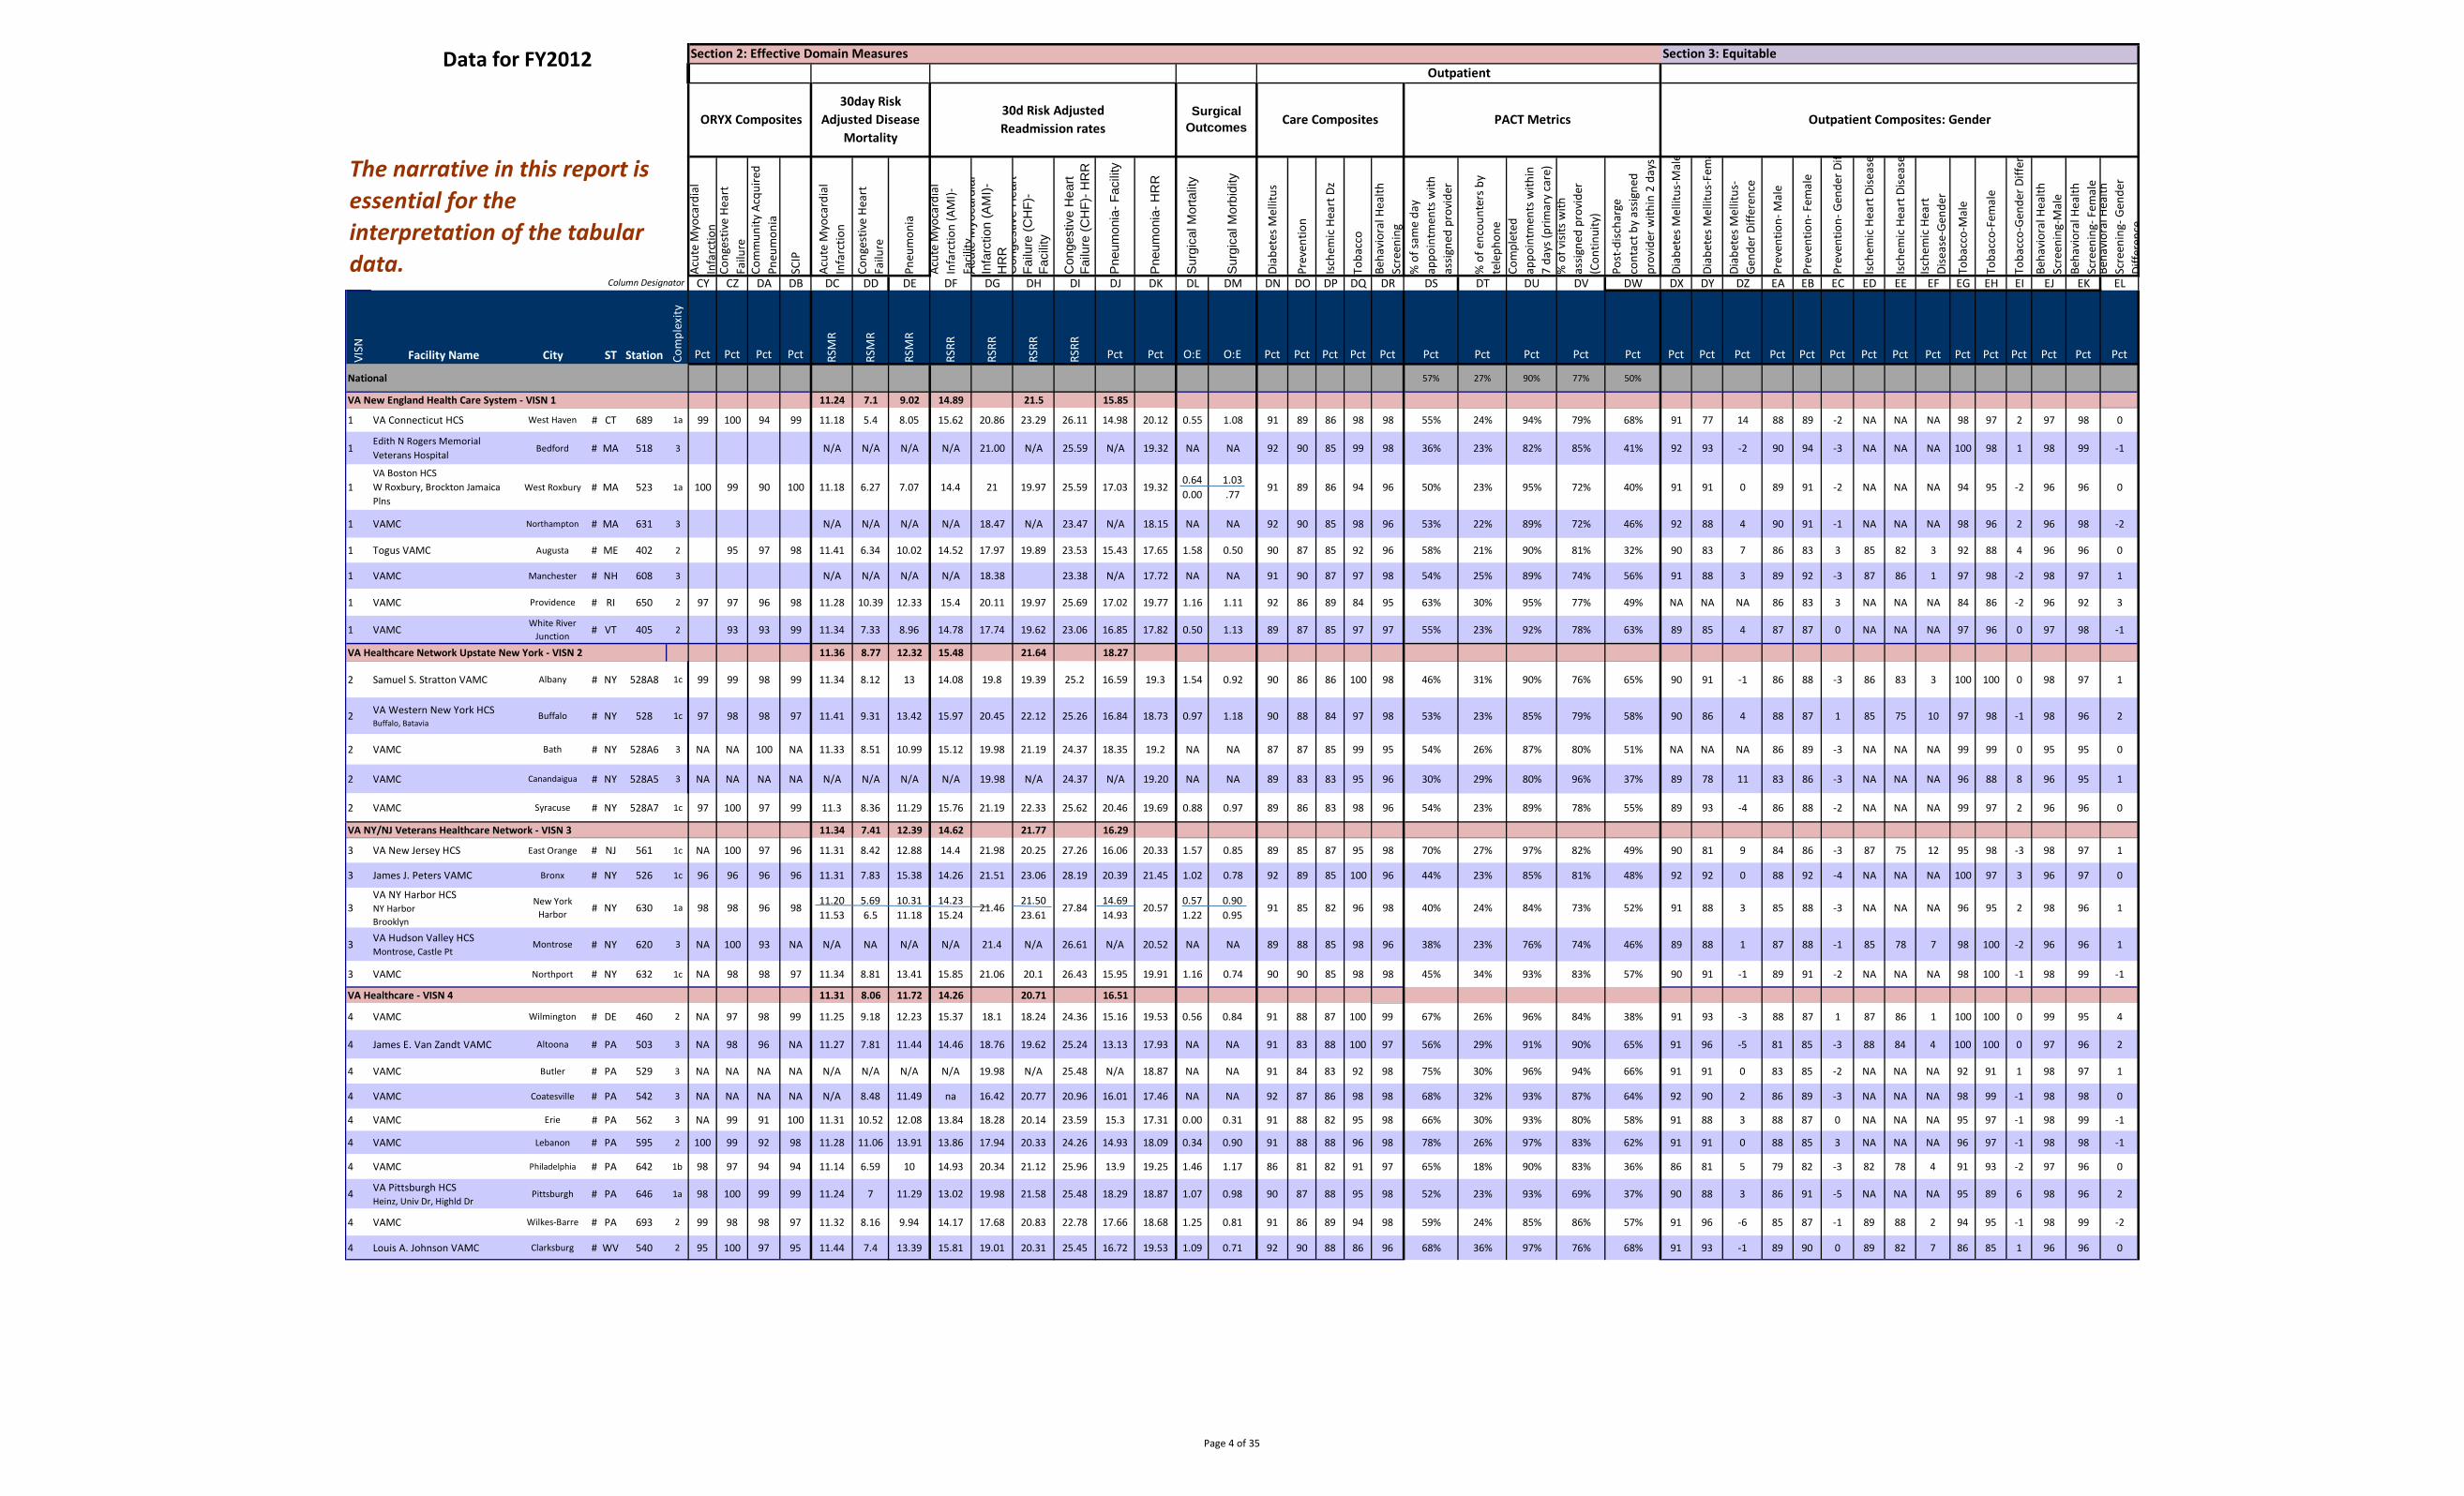
Section 2: Effective Domain Measures Section 3: Equitable Outpatient
ORYX Composites 30day Risk
Adjusted Disease Mortality
30d Risk Adjusted Readmission rates
Surgical Outcomes Care Composites PACT Metrics Outpatient Composites: Gender
Acut
e M
yoca
rdia
l In
farc
tion
Cong
estiv
e He
art
Failu
reCo
mm
unity
Acq
uire
d Pn
eum
onia
SCIP
Acut
e M
yoca
rdia
l In
farc
tion
Cong
estiv
e He
art
Failu
re
Pneu
mon
ia
Acut
e M
yoca
rdia
l In
farc
tion
(AM
I)-
Faci
lity
DF
Acu
te M
yoca
rdia
lIn
farc
tion
(AM
I)-
HR
RC
onge
stiv
e H
eart
Failu
re (C
HF)
- Fa
cilit
y
Con
gest
ive
Hea
rtFa
ilure
(CH
F)- H
RR
Pne
umon
ia- F
acili
ty
Pne
umon
ia- H
RR
Sur
gica
l Mor
talit
y
Sur
gica
l Mor
bidi
ty
Diab
etes
Mel
litus
Prev
entio
n
Isch
emic
Hea
rt D
z
Toba
cco
Beha
vior
al H
ealth
Scre
enin
g%
of s
ame
day
appo
intm
ents
with
as
signe
d pr
ovid
er
% o
f enc
ount
ers b
yte
leph
one
Com
plet
edap
poin
tmen
ts w
ithin
7
days
(prim
ary
care
)%
of v
isits
with
assig
ned
prov
ider
(Con
tinui
ty)
Post
-disc
harg
eco
ntac
t by
assig
ned
prov
ider
with
in 2
day
s
Diab
etes
Mel
litus
-Mal
e
Diab
etes
Mel
litus
-Fem
a
Diab
etes
Mel
litus
-Ge
nder
Diff
eren
ce
Prev
entio
n- M
ale
Prev
entio
n- F
emal
e
Prev
entio
n- G
ende
r Dif
Isch
emic
Hea
rt D
iseas
e
Isch
emic
Hea
rt D
iseas
e
Isch
emic
Hea
rt
Dise
ase-
Gend
er
Toba
cco-
Mal
e
Toba
cco-
Fem
ale
Toba
cco-
Gend
er D
iffer
e
Beha
vior
al H
ealth
Scre
enin
g-M
ale
Beha
vior
al H
ealth
Scre
enin
g- F
emal
eBe
havi
oral
Hea
lthSc
reen
ing-
Gen
der
Diffe
renc
e
CY CZ DA DB DC DD DE DG DH DI DJ DK DL DM DN DO DP DQ DR DS DT DU DV DW DX DY DZ EA EB EC ED EE EF EG EH EI EJ EK EL
VISN Facility Name City ST Station Com
plex
ity
Pct Pct Pct Pct RSM
R
RSM
R
RSM
R
RSRR
RSRR
RSRR
RSRR
Pct Pct O:E O:E Pct Pct Pct Pct Pct Pct Pct Pct Pct Pct Pct Pct Pct Pct Pct Pct Pct Pct Pct Pct Pct Pct Pct Pct Pct
National 57% 27% 90% 77% 50%
VA New England Health Care System - VISN 1 11.24 7.1 9.02 14.89 21.5 15.85
1 VA Connecticut HCS West Haven # CT 689 1a 99 100 94 99 11.18 5.4 8.05 15.62 20.86 23.29 26.11 14.98 20.12 0.55 1.08 91 89 86 98 98 55% 24% 94% 79% 68% 91 77 14 88 89 -2 NA NA NA 98 97 2 97 98 0
1 Edith N Rogers Memorial Veterans Hospital
Bedford # MA 518 3 N/A N/A N/A N/A 21.00 N/A 25.59 N/A 19.32 NA NA 92 90 85 99 98 36% 23% 82% 85% 41% 92 93 -2 90 94 -3 NA NA NA 100 98 1 98 99 -1
1 VA Boston HCS W Roxbury, Brockton Jamaica Plns
West Roxbury # MA 523 1a 100 99 90 100 11.18 6.27 7.07 14.4 21 19.97 25.59 17.03 19.32 0.64 0.00
1.03 .77
91 89 86 94 96 50% 23% 95% 72% 40% 91 91 0 89 91 -2 NA NA NA 94 95 -2 96 96 0
1 VAMC Northampton # MA 631 3 N/A N/A N/A N/A 18.47 N/A 23.47 N/A 18.15 NA NA 92 90 85 98 96 53% 22% 89% 72% 46% 92 88 4 90 91 -1 NA NA NA 98 96 2 96 98 -2
1 Togus VAMC Augusta # ME 402 2 95 97 98 11.41 6.34 10.02 14.52 17.97 19.89 23.53 15.43 17.65 1.58 0.50 90 87 85 92 96 58% 21% 90% 81% 32% 90 83 7 86 83 3 85 82 3 92 88 4 96 96 0
1 VAMC Manchester # NH 608 3 N/A N/A N/A N/A 18.38 23.38 N/A 17.72 NA NA 91 90 87 97 98 54% 25% 89% 74% 56% 91 88 3 89 92 -3 87 86 1 97 98 -2 98 97 1
1 VAMC Providence # RI 650 2 97 97 96 98 11.28 10.39 12.33 15.4 20.11 19.97 25.69 17.02 19.77 1.16 1.11 92 86 89 84 95 63% 30% 95% 77% 49% NA NA NA 86 83 3 NA NA NA 84 86 -2 96 92 3
1 VAMC White River Junction # VT 405 2 93 93 99 11.34 7.33 8.96 14.78 17.74 19.62 23.06 16.85 17.82 0.50 1.13 89 87 85 97 97 55% 23% 92% 78% 63% 89 85 4 87 87 0 NA NA NA 97 96 0 97 98 -1
VA Healthcare Network Upstate New York - VISN 2 11.36 8.77 12.32 15.48 21.64 18.27
2 Samuel S. Stratton VAMC Albany # NY 528A8 1c 99 99 98 99 11.34 8.12 13 14.08 19.8 19.39 25.2 16.59 19.3 1.54 0.92 90 86 86 100 98 46% 31% 90% 76% 65% 90 91 -1 86 88 -3 86 83 3 100 100 0 98 97 1
2 VA Western New York HCS Buffalo, Batavia
Buffalo # NY 528 1c 97 98 98 97 11.41 9.31 13.42 15.97 20.45 22.12 25.26 16.84 18.73 0.97 1.18 90 88 84 97 98 53% 23% 85% 79% 58% 90 86 4 88 87 1 85 75 10 97 98 -1 98 96 2
2 VAMC Bath # NY 528A6 3 NA NA 100 NA 11.33 8.51 10.99 15.12 19.98 21.19 24.37 18.35 19.2 NA NA 87 87 85 99 95 54% 26% 87% 80% 51% NA NA NA 86 89 -3 NA NA NA 99 99 0 95 95 0
2 VAMC Canandaigua # NY 528A5 3 NA NA NA NA N/A N/A N/A N/A 19.98 N/A 24.37 N/A 19.20 NA NA 89 83 83 95 96 30% 29% 80% 96% 37% 89 78 11 83 86 -3 NA NA NA 96 88 8 96 95 1
2 VAMC Syracuse # NY 528A7 1c 97 100 97 99 11.3 8.36 11.29 15.76 21.19 22.33 25.62 20.46 19.69 0.88 0.97 89 86 83 98 96 54% 23% 89% 78% 55% 89 93 -4 86 88 -2 NA NA NA 99 97 2 96 96 0
VA NY/NJ Veterans Healthcare Network - VISN 3 11.34 7.41 12.39 14.62 21.77 16.29
3 VA New Jersey HCS East Orange # NJ 561 1c NA 100 97 96 11.31 8.42 12.88 14.4 21.98 20.25 27.26 16.06 20.33 1.57 0.85 89 85 87 95 98 70% 27% 97% 82% 49% 90 81 9 84 86 -3 87 75 12 95 98 -3 98 97 1
3 James J. Peters VAMC Bronx # NY 526 1c 96 96 96 96 11.31 7.83 15.38 14.26 21.51 23.06 28.19 20.39 21.45 1.02 0.78 92 89 85 100 96 44% 23% 85% 81% 48% 92 92 0 88 92 -4 NA NA NA 100 97 3 96 97 0
3 VA NY Harbor HCS NY Harbor Brooklyn
New York Harbor # NY 630 1a 98 98 96 98
11.20 11.53
5.69 6.5
10.31 11.18
14.23 15.24
21.46 21.50 23.61
27.84 14.69
20.57 0.57 1.22
0.90 0.95
91 85 82 96 98 40% 24% 84% 73% 52% 91 88 3 85 88 -3 NA NA NA 96 95 2 98 96 114.93
3 VA Hudson Valley HCS Montrose, Castle Pt
Montrose # NY 620 3 NA 100 93 NA N/A NA N/A N/A 21.4 N/A 26.61 N/A 20.52 NA NA 89 88 85 98 96 38% 23% 76% 74% 46% 89 88 1 87 88 -1 85 78 7 98 100 -2 96 96 1
3 VAMC Northport # NY 632 1c NA 98 98 97 11.34 8.81 13.41 15.85 21.06 20.1 26.43 15.95 19.91 1.16 0.74 90 90 85 98 98 45% 34% 93% 83% 57% 90 91 -1 89 91 -2 NA NA NA 98 100 -1 98 99 -1
VA Healthcare - VISN 4 11.31 8.06 11.72 14.26 20.71 16.51
4 VAMC Wilmington # DE 460 2 NA 97 98 99 11.25 9.18 12.23 15.37 18.1 18.24 24.36 15.16 19.53 0.56 0.84 91 88 87 100 99 67% 26% 96% 84% 38% 91 93 -3 88 87 1 87 86 1 100 100 0 99 95 4
4 James E. Van Zandt VAMC Altoona # PA 503 3 NA 98 96 NA 11.27 7.81 11.44 14.46 18.76 19.62 25.24 13.13 17.93 NA NA 91 83 88 100 97 56% 29% 91% 90% 65% 91 96 -5 81 85 -3 88 84 4 100 100 0 97 96 2
4 VAMC Butler # PA 529 3 NA NA NA NA N/A N/A N/A N/A 19.98 N/A 25.48 N/A 18.87 NA NA 91 84 83 92 98 75% 30% 96% 94% 66% 91 91 0 83 85 -2 NA NA NA 92 91 1 98 97 1
4 VAMC Coatesville # PA 542 3 NA NA NA NA N/A 8.48 11.49 na 16.42 20.77 20.96 16.01 17.46 NA NA 92 87 86 98 98 68% 32% 93% 87% 64% 92 90 2 86 89 -3 NA NA NA 98 99 -1 98 98 0
4 VAMC Erie # PA 562 3 NA 99 91 100 11.31 10.52 12.08 13.84 18.28 20.14 23.59 15.3 17.31 0.00 0.31 91 88 82 95 98 66% 30% 93% 80% 58% 91 88 3 88 87 0 NA NA NA 95 97 -1 98 99 -1
4 VAMC Lebanon # PA 595 2 100 99 92 98 11.28 11.06 13.91 13.86 17.94 20.33 24.26 14.93 18.09 0.34 0.90 91 88 88 96 98 78% 26% 97% 83% 62% 91 91 0 88 85 3 NA NA NA 96 97 -1 98 98 -1
4 VAMC Philadelphia # PA 642 1b 98 97 94 94 11.14 6.59 10 14.93 20.34 21.12 25.96 13.9 19.25 1.46 1.17 86 81 82 91 97 65% 18% 90% 83% 36% 86 81 5 79 82 -3 82 78 4 91 93 -2 97 96 0
4 VA Pittsburgh HCS Heinz, Univ Dr, Highld Dr
Pittsburgh # PA 646 1a 98 100 99 99 11.24 7 11.29 13.02 19.98 21.58 25.48 18.29 18.87 1.07 0.98 90 87 88 95 98 52% 23% 93% 69% 37% 90 88 3 86 91 -5 NA NA NA 95 89 6 98 96 2
4 VAMC Wilkes-Barre # PA 693 2 99 98 98 97 11.32 8.16 9.94 14.17 17.68 20.83 22.78 17.66 18.68 1.25 0.81 91 86 89 94 98 59% 24% 85% 86% 57% 91 96 -6 85 87 -1 89 88 2 94 95 -1 98 99 -2
4 Louis A. Johnson VAMC Clarksburg # WV 540 2 95 100 97 95 11.44 7.4 13.39 15.81 19.01 20.31 25.45 16.72 19.53 1.09 0.71 92 90 88 86 96 68% 36% 97% 76% 68% 91 93 -1 89 90 0 89 82 7 86 85 1 96 96 0
Page 4 of 35
Data for FY2012
Column Designator
The narrative in this report is essential for the interpretation of the tabular data.
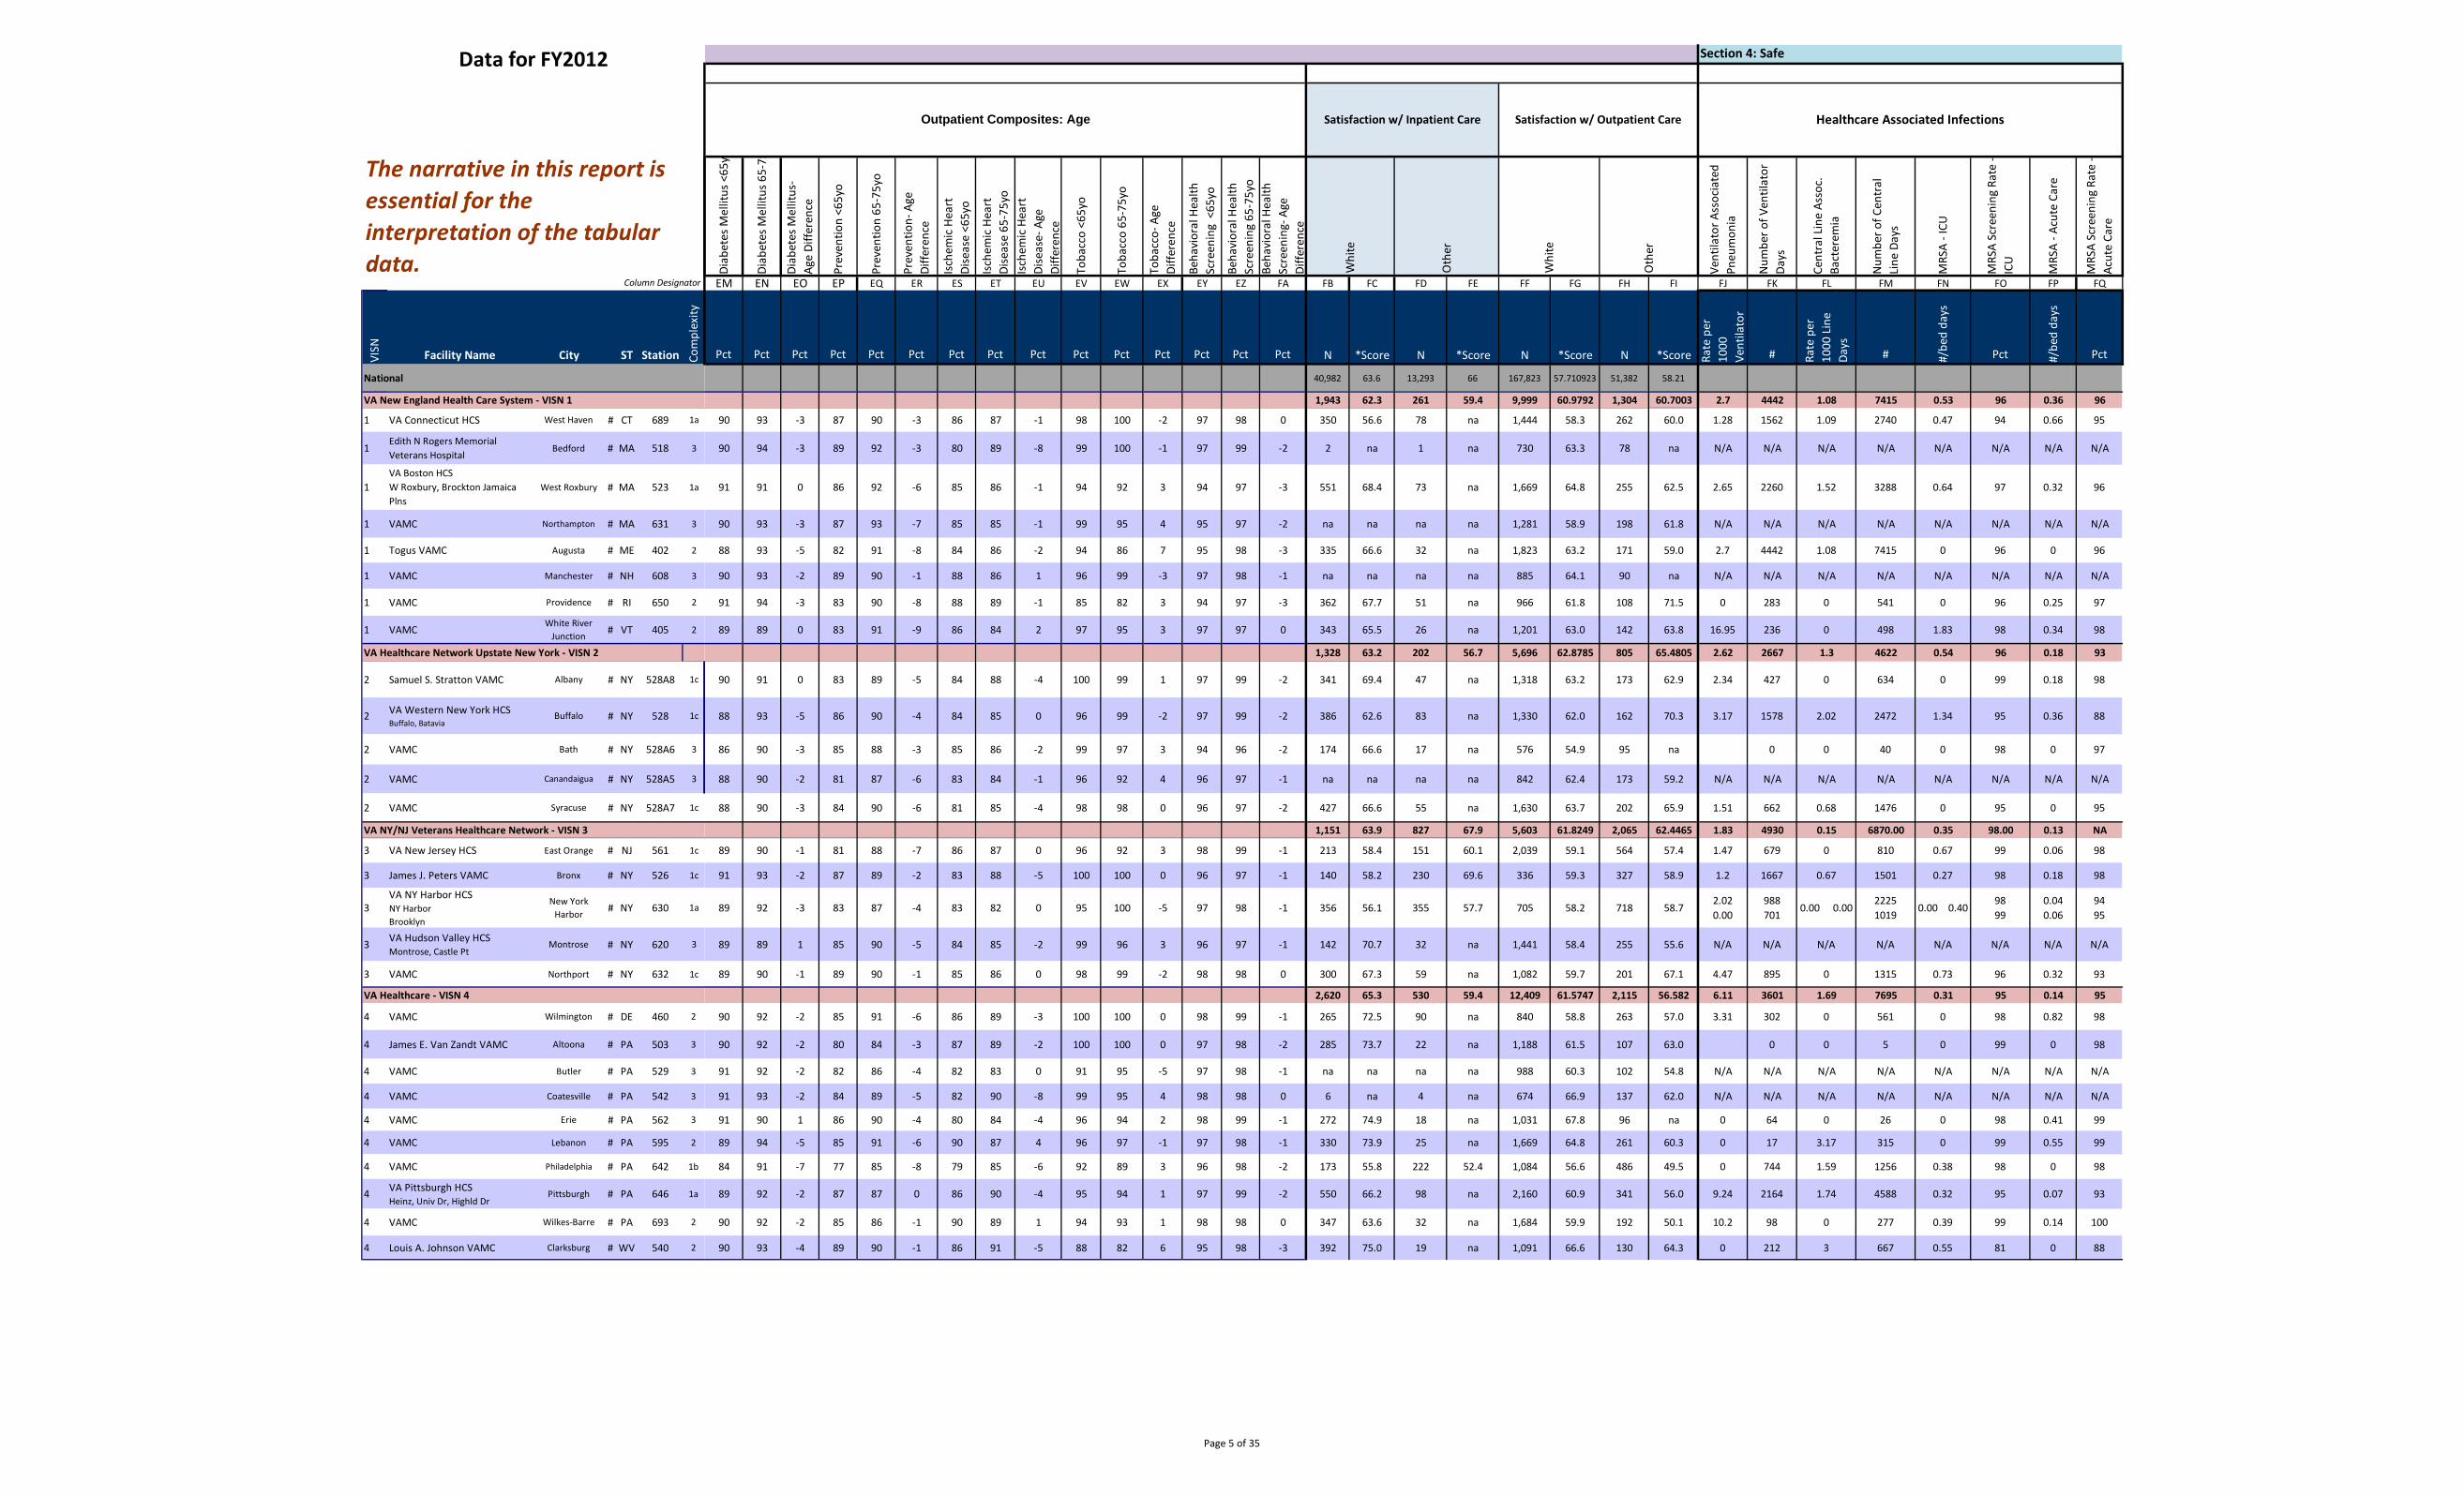
Section 4: Safe
Outpatient Composites: Age Satisfaction w/ Inpatient Care Satisfaction w/ Outpatient Care Healthcare Associated Infections
Diab
etes
Mel
litus
<65
y
Diab
etes
Mel
litus
65-
75
Diab
etes
Mel
litus
-Ag
e Di
ffere
nce
Prev
entio
n <6
5yo
Prev
entio
n 65
-75y
o
Prev
entio
n- A
geDi
ffere
nce
Isch
emic
Hea
rt
Dise
ase
<65y
o
Isch
emic
Hea
rt
Dise
ase
65-7
5yo
Isch
emic
Hea
rt
Dise
ase-
Age
Diffe
renc
e
Toba
cco
<65y
o
Toba
cco
65-7
5yo
Toba
cco-
Age
Diffe
renc
e
Beha
vior
al H
ealth
Scre
enin
g <
65yo
Beha
vior
al H
ealth
Scre
enin
g 65
-75y
oBe
havi
oral
Hea
lthSc
reen
ing-
Age
Diffe
renc
e
Whi
te
Oth
er
Whi
te
Oth
er
Vent
ilato
r Ass
ocia
ted
Pneu
mon
ia
Num
ber o
f Ven
tilat
orDa
ys
Cent
ral L
ine
Asso
c.Ba
cter
emia
Num
ber o
f Cen
tral
Line
Day
s
MRS
A -I
CU
MRS
A Sc
reen
ing
Rate
-IC
U
MRS
A -A
cute
Car
e
MRS
A Sc
reen
ing
Rate
-Ac
ute
Care
EM EN EO EP EQ ER ES ET EU EV EW EX EY EZ FA FB FC FD FE FF FG FH FI FJ FK FL FM FN FO FP FQ
VISN Facility Name City ST Station Com
plex
ity
Pct Pct Pct Pct Pct Pct Pct Pct Pct Pct Pct Pct Pct Pct Pct N *Score N *Score N *Score N *Score Rate
per
1000
Vent
ilato
r
# Rate
per
1000
Lin
eDa
ys
# #/be
d da
ys
Pct #/be
d da
ys
Pct
National 40,982 63.6 13,293 66 167,823 57.710923 51,382 58.21
VA New England Health Care System - VISN 1 1,943 62.3 261 59.4 9,999 60.9792 1,304 60.7003 2.7 4442 1.08 7415 0.53 96 0.36 96
1 VA Connecticut HCS West Haven # CT 689 1a 90 93 -3 87 90 -3 86 87 -1 98 100 -2 97 98 0 350 56.6 78 na 1,444 58.3 262 60.0 1.28 1562 1.09 2740 0.47 94 0.66 95
1 Edith N Rogers Memorial Veterans Hospital
Bedford # MA 518 3 90 94 -3 89 92 -3 80 89 -8 99 100 -1 97 99 -2 2 na 1 na 730 63.3 78 na N/A N/A N/A N/A N/A N/A N/A N/A
1 VA Boston HCS W Roxbury, Brockton Jamaica Plns
West Roxbury # MA 523 1a 91 91 0 86 92 -6 85 86 -1 94 92 3 94 97 -3 551 68.4 73 na 1,669 64.8 255 62.5 2.65 2260 1.52 3288 0.64 97 0.32 96
1 VAMC Northampton # MA 631 3 90 93 -3 87 93 -7 85 85 -1 99 95 4 95 97 -2 na na na na 1,281 58.9 198 61.8 N/A N/A N/A N/A N/A N/A N/A N/A
1 Togus VAMC Augusta # ME 402 2 88 93 -5 82 91 -8 84 86 -2 94 86 7 95 98 -3 335 66.6 32 na 1,823 63.2 171 59.0 2.7 4442 1.08 7415 0 96 0 96
1 VAMC Manchester # NH 608 3 90 93 -2 89 90 -1 88 86 1 96 99 -3 97 98 -1 na na na na 885 64.1 90 na N/A N/A N/A N/A N/A N/A N/A N/A
1 VAMC Providence # RI 650 2 91 94 -3 83 90 -8 88 89 -1 85 82 3 94 97 -3 362 67.7 51 na 966 61.8 108 71.5 0 283 0 541 0 96 0.25 97
1 VAMC White River Junction # VT 405 2 89 89 0 83 91 -9 86 84 2 97 95 3 97 97 0 343 65.5 26 na 1,201 63.0 142 63.8 16.95 236 0 498 1.83 98 0.34 98
VA Healthcare Network Upstate New York - VISN 2 1,328 63.2 202 56.7 5,696 62.8785 805 65.4805 2.62 2667 1.3 4622 0.54 96 0.18 93
2 Samuel S. Stratton VAMC Albany # NY 528A8 1c 90 91 0 83 89 -5 84 88 -4 100 99 1 97 99 -2 341 69.4 47 na 1,318 63.2 173 62.9 2.34 427 0 634 0 99 0.18 98
2 VA Western New York HCS Buffalo, Batavia
Buffalo # NY 528 1c 88 93 -5 86 90 -4 84 85 0 96 99 -2 97 99 -2 386 62.6 83 na 1,330 62.0 162 70.3 3.17 1578 2.02 2472 1.34 95 0.36 88
2 VAMC Bath # NY 528A6 3 86 90 -3 85 88 -3 85 86 -2 99 97 3 94 96 -2 174 66.6 17 na 576 54.9 95 na 0 0 40 0 98 0 97
2 VAMC Canandaigua # NY 528A5 3 88 90 -2 81 87 -6 83 84 -1 96 92 4 96 97 -1 na na na na 842 62.4 173 59.2 N/A N/A N/A N/A N/A N/A N/A N/A
2 VAMC Syracuse # NY 528A7 1c 88 90 -3 84 90 -6 81 85 -4 98 98 0 96 97 -2 427 66.6 55 na 1,630 63.7 202 65.9 1.51 662 0.68 1476 0 95 0 95
VA NY/NJ Veterans Healthcare Network - VISN 3 1,151 63.9 827 67.9 5,603 61.8249 2,065 62.4465 1.83 4930 0.15 6870.00 0.35 98.00 0.13 NA
3 VA New Jersey HCS East Orange # NJ 561 1c 89 90 -1 81 88 -7 86 87 0 96 92 3 98 99 -1 213 58.4 151 60.1 2,039 59.1 564 57.4 1.47 679 0 810 0.67 99 0.06 98
3 James J. Peters VAMC Bronx # NY 526 1c 91 93 -2 87 89 -2 83 88 -5 100 100 0 96 97 -1 140 58.2 230 69.6 336 59.3 327 58.9 1.2 1667 0.67 1501 0.27 98 0.18 98
3 VA NY Harbor HCS NY Harbor Brooklyn
New York Harbor # NY 630 1a 89 92 -3 83 87 -4 83 82 0 95 100 -5 97 98 -1 356 56.1 355 57.7 705 58.2 718 58.7
2.02 0.00
988 701
0.00 0.00 2225 1019
0.00 0.40 98 99
0.04 0.06
94 95
3 VA Hudson Valley HCS Montrose, Castle Pt
Montrose # NY 620 3 89 89 1 85 90 -5 84 85 -2 99 96 3 96 97 -1 142 70.7 32 na 1,441 58.4 255 55.6 N/A N/A N/A N/A N/A N/A N/A N/A
3 VAMC Northport # NY 632 1c 89 90 -1 89 90 -1 85 86 0 98 99 -2 98 98 0 300 67.3 59 na 1,082 59.7 201 67.1 4.47 895 0 1315 0.73 96 0.32 93
VA Healthcare - VISN 4 2,620 65.3 530 59.4 12,409 61.5747 2,115 56.582 6.11 3601 1.69 7695 0.31 95 0.14 95
4 VAMC Wilmington # DE 460 2 90 92 -2 85 91 -6 86 89 -3 100 100 0 98 99 -1 265 72.5 90 na 840 58.8 263 57.0 3.31 302 0 561 0 98 0.82 98
4 James E. Van Zandt VAMC Altoona # PA 503 3 90 92 -2 80 84 -3 87 89 -2 100 100 0 97 98 -2 285 73.7 22 na 1,188 61.5 107 63.0 0 0 5 0 99 0 98
4 VAMC Butler # PA 529 3 91 92 -2 82 86 -4 82 83 0 91 95 -5 97 98 -1 na na na na 988 60.3 102 54.8 N/A N/A N/A N/A N/A N/A N/A N/A
4 VAMC Coatesville # PA 542 3 91 93 -2 84 89 -5 82 90 -8 99 95 4 98 98 0 6 na 4 na 674 66.9 137 62.0 N/A N/A N/A N/A N/A N/A N/A N/A
4 VAMC Erie # PA 562 3 91 90 1 86 90 -4 80 84 -4 96 94 2 98 99 -1 272 74.9 18 na 1,031 67.8 96 na 0 64 0 26 0 98 0.41 99
4 VAMC Lebanon # PA 595 2 89 94 -5 85 91 -6 90 87 4 96 97 -1 97 98 -1 330 73.9 25 na 1,669 64.8 261 60.3 0 17 3.17 315 0 99 0.55 99
4 VAMC Philadelphia # PA 642 1b 84 91 -7 77 85 -8 79 85 -6 92 89 3 96 98 -2 173 55.8 222 52.4 1,084 56.6 486 49.5 0 744 1.59 1256 0.38 98 0 98
4 VA Pittsburgh HCS Heinz, Univ Dr, Highld Dr
Pittsburgh # PA 646 1a 89 92 -2 87 87 0 86 90 -4 95 94 1 97 99 -2 550 66.2 98 na 2,160 60.9 341 56.0 9.24 2164 1.74 4588 0.32 95 0.07 93
4 VAMC Wilkes-Barre # PA 693 2 90 92 -2 85 86 -1 90 89 1 94 93 1 98 98 0 347 63.6 32 na 1,684 59.9 192 50.1 10.2 98 0 277 0.39 99 0.14 100
4 Louis A. Johnson VAMC Clarksburg # WV 540 2 90 93 -4 89 90 -1 86 91 -5 88 82 6 95 98 -3 392 75.0 19 na 1,091 66.6 130 64.3 0 212 3 667 0.55 81 0 88
Page 5 of 35
Data for FY2012
Column Designator
The narrative in this report is essential for the interpretation of the tabular data.
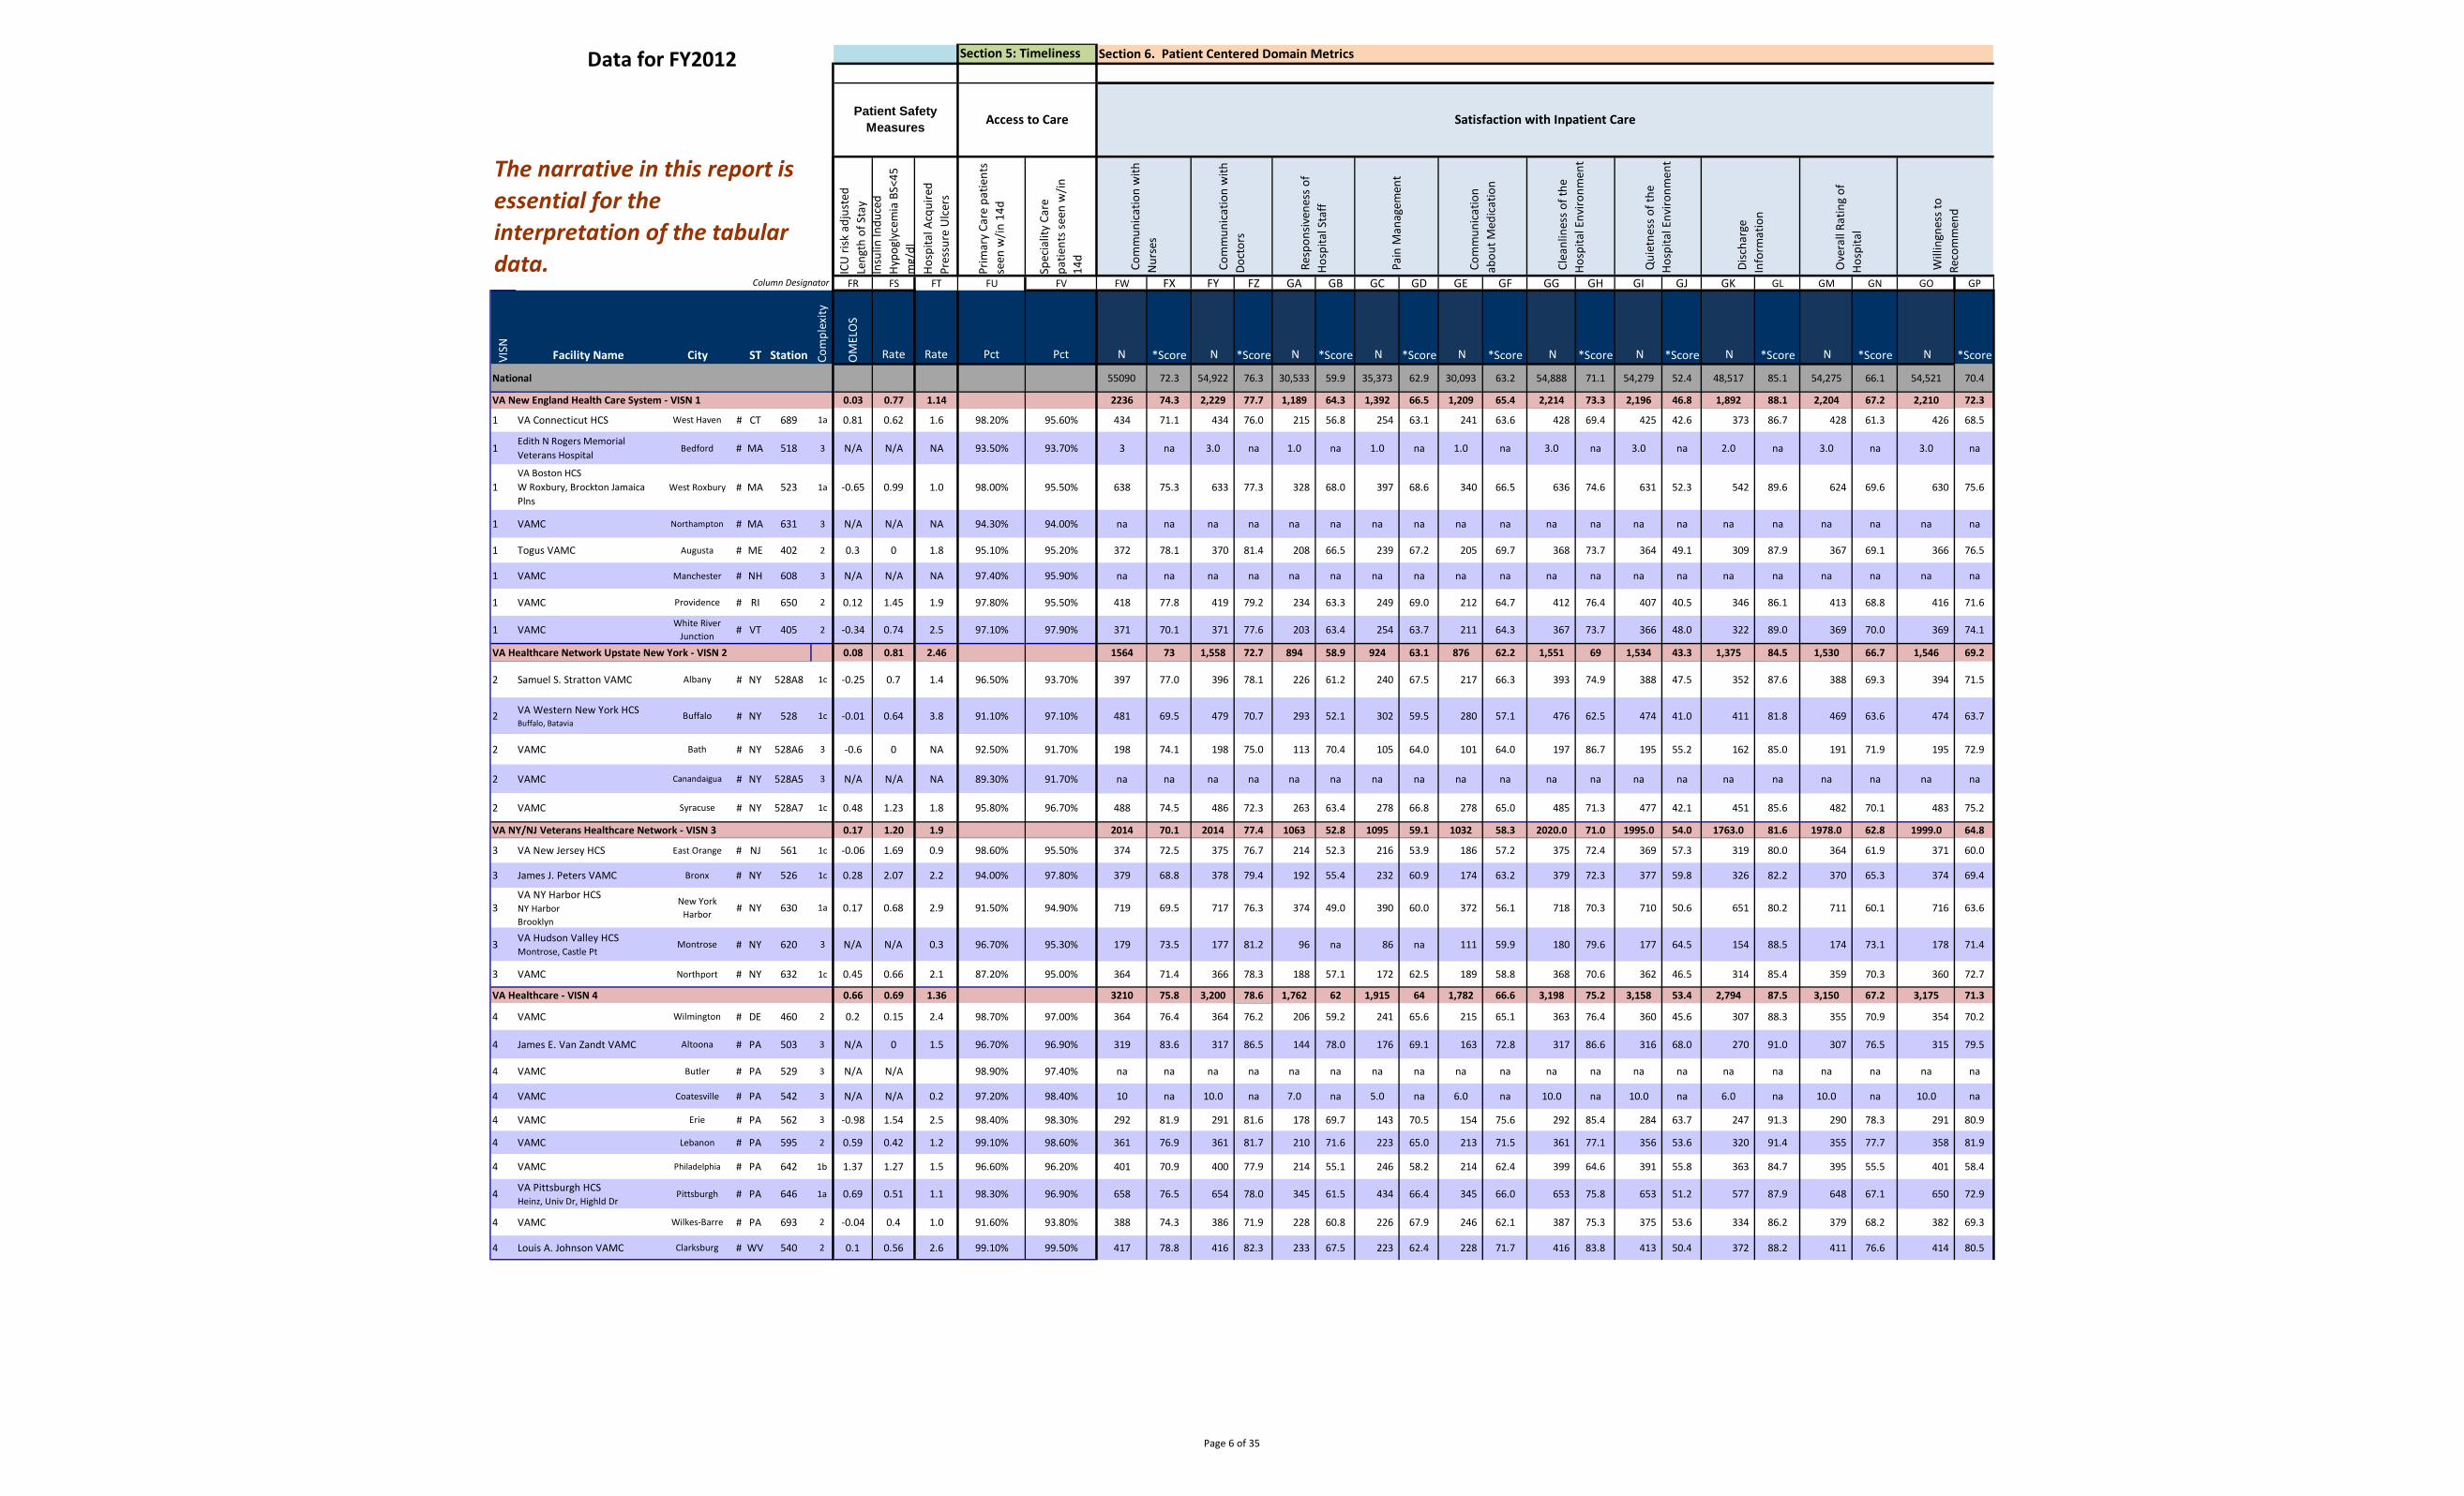
Section 5: Timeliness Section 6. Patient Centered Domain Metrics
Patient Safety Measures Access to Care Satisfaction with Inpatient Care
ICU
risk
adj
uste
d Le
ngth
of S
tay
Insu
lin In
duce
d Hy
pogl
ycem
ia B
S<45
m
g/dl
Hosp
ital A
cqui
red
Pres
sure
Ulc
ers
Prim
ary
Care
pat
ient
sse
en w
/in 1
4d
Spec
ialit
y Ca
repa
tient
s see
n w
/in14
d
Com
mun
icat
ion
with
N
urse
s
Com
mun
icat
ion
with
Do
ctor
s
Res
pons
iven
ess o
fHo
spita
l Sta
ff
Pai
n M
anag
emen
t
Com
mun
icat
ion
abou
t Med
icat
ion
Cle
anlin
ess o
f the
Hosp
ital E
nviro
nmen
t
Qui
etne
ss o
f the
Hosp
ital E
nviro
nmen
t
Disc
harg
eIn
form
atio
n
Ove
rall
Ratin
g of
Hosp
ital
Will
ingn
ess t
oRe
com
men
d
FR FS FT FU FV FW FX FY FZ GA GB GC GD GE GF GG GH GI GJ GK GL GM GN GO GP
VISN Facility Name City ST Station Com
plex
ity
OM
ELO
S
Rate Rate Pct Pct N *Score N *Score N *Score N *Score N *Score N *Score N *Score N *Score N *Score N *Score
National 55090 72.3 54,922 76.3 30,533 59.9 35,373 62.9 30,093 63.2 54,888 71.1 54,279 52.4 48,517 85.1 54,275 66.1 54,521 70.4
VA New England Health Care System - VISN 1 0.03 0.77 1.14 2236 74.3 2,229 77.7 1,189 64.3 1,392 66.5 1,209 65.4 2,214 73.3 2,196 46.8 1,892 88.1 2,204 67.2 2,210 72.3
1 VA Connecticut HCS West Haven # CT 689 1a 0.81 0.62 1.6 98.20% 95.60% 434 71.1 434 76.0 215 56.8 254 63.1 241 63.6 428 69.4 425 42.6 373 86.7 428 61.3 426 68.5
1 Edith N Rogers Memorial Veterans Hospital
Bedford # MA 518 3 N/A N/A NA 93.50% 93.70% 3 na 3.0 na 1.0 na 1.0 na 1.0 na 3.0 na 3.0 na 2.0 na 3.0 na 3.0 na
1 VA Boston HCS W Roxbury, Brockton Jamaica Plns
West Roxbury # MA 523 1a -0.65 0.99 1.0 98.00% 95.50% 638 75.3 633 77.3 328 68.0 397 68.6 340 66.5 636 74.6 631 52.3 542 89.6 624 69.6 630 75.6
1 VAMC Northampton # MA 631 3 N/A N/A NA 94.30% 94.00% na na na na na na na na na na na na na na na na na na na na
1 Togus VAMC Augusta # ME 402 2 0.3 0 1.8 95.10% 95.20% 372 78.1 370 81.4 208 66.5 239 67.2 205 69.7 368 73.7 364 49.1 309 87.9 367 69.1 366 76.5
1 VAMC Manchester # NH 608 3 N/A N/A NA 97.40% 95.90% na na na na na na na na na na na na na na na na na na na na
1 VAMC Providence # RI 650 2 0.12 1.45 1.9 97.80% 95.50% 418 77.8 419 79.2 234 63.3 249 69.0 212 64.7 412 76.4 407 40.5 346 86.1 413 68.8 416 71.6
1 VAMC White River Junction # VT 405 2 -0.34 0.74 2.5 97.10% 97.90% 371 70.1 371 77.6 203 63.4 254 63.7 211 64.3 367 73.7 366 48.0 322 89.0 369 70.0 369 74.1
VA Healthcare Network Upstate New York - VISN 2 0.08 0.81 2.46 1564 73 1,558 72.7 894 58.9 924 63.1 876 62.2 1,551 69 1,534 43.3 1,375 84.5 1,530 66.7 1,546 69.2
2 Samuel S. Stratton VAMC Albany # NY 528A8 1c -0.25 0.7 1.4 96.50% 93.70% 397 77.0 396 78.1 226 61.2 240 67.5 217 66.3 393 74.9 388 47.5 352 87.6 388 69.3 394 71.5
2 VA Western New York HCS Buffalo, Batavia
Buffalo # NY 528 1c -0.01 0.64 3.8 91.10% 97.10% 481 69.5 479 70.7 293 52.1 302 59.5 280 57.1 476 62.5 474 41.0 411 81.8 469 63.6 474 63.7
2 VAMC Bath # NY 528A6 3 -0.6 0 NA 92.50% 91.70% 198 74.1 198 75.0 113 70.4 105 64.0 101 64.0 197 86.7 195 55.2 162 85.0 191 71.9 195 72.9
2 VAMC Canandaigua # NY 528A5 3 N/A N/A NA 89.30% 91.70% na na na na na na na na na na na na na na na na na na na na
2 VAMC Syracuse # NY 528A7 1c 0.48 1.23 1.8 95.80% 96.70% 488 74.5 486 72.3 263 63.4 278 66.8 278 65.0 485 71.3 477 42.1 451 85.6 482 70.1 483 75.2
VA NY/NJ Veterans Healthcare Network - VISN 3 0.17 1.20 1.9 2014 70.1 2014 77.4 1063 52.8 1095 59.1 1032 58.3 2020.0 71.0 1995.0 54.0 1763.0 81.6 1978.0 62.8 1999.0 64.8
3 VA New Jersey HCS East Orange # NJ 561 1c -0.06 1.69 0.9 98.60% 95.50% 374 72.5 375 76.7 214 52.3 216 53.9 186 57.2 375 72.4 369 57.3 319 80.0 364 61.9 371 60.0
3 James J. Peters VAMC Bronx # NY 526 1c 0.28 2.07 2.2 94.00% 97.80% 379 68.8 378 79.4 192 55.4 232 60.9 174 63.2 379 72.3 377 59.8 326 82.2 370 65.3 374 69.4
3 VA NY Harbor HCS NY Harbor Brooklyn
New York Harbor # NY 630 1a 0.17 0.68 2.9 91.50% 94.90% 719 69.5 717 76.3 374 49.0 390 60.0 372 56.1 718 70.3 710 50.6 651 80.2 711 60.1 716 63.6
3 VA Hudson Valley HCS Montrose, Castle Pt
Montrose # NY 620 3 N/A N/A 0.3 96.70% 95.30% 179 73.5 177 81.2 96 na 86 na 111 59.9 180 79.6 177 64.5 154 88.5 174 73.1 178 71.4
3 VAMC Northport # NY 632 1c 0.45 0.66 2.1 87.20% 95.00% 364 71.4 366 78.3 188 57.1 172 62.5 189 58.8 368 70.6 362 46.5 314 85.4 359 70.3 360 72.7
VA Healthcare - VISN 4 0.66 0.69 1.36 3210 75.8 3,200 78.6 1,762 62 1,915 64 1,782 66.6 3,198 75.2 3,158 53.4 2,794 87.5 3,150 67.2 3,175 71.3
4 VAMC Wilmington # DE 460 2 0.2 0.15 2.4 98.70% 97.00% 364 76.4 364 76.2 206 59.2 241 65.6 215 65.1 363 76.4 360 45.6 307 88.3 355 70.9 354 70.2
4 James E. Van Zandt VAMC Altoona # PA 503 3 N/A 0 1.5 96.70% 96.90% 319 83.6 317 86.5 144 78.0 176 69.1 163 72.8 317 86.6 316 68.0 270 91.0 307 76.5 315 79.5
4 VAMC Butler # PA 529 3 N/A N/A 98.90% 97.40% na na na na na na na na na na na na na na na na na na na na
4 VAMC Coatesville # PA 542 3 N/A N/A 0.2 97.20% 98.40% 10 na 10.0 na 7.0 na 5.0 na 6.0 na 10.0 na 10.0 na 6.0 na 10.0 na 10.0 na
4 VAMC Erie # PA 562 3 -0.98 1.54 2.5 98.40% 98.30% 292 81.9 291 81.6 178 69.7 143 70.5 154 75.6 292 85.4 284 63.7 247 91.3 290 78.3 291 80.9
4 VAMC Lebanon # PA 595 2 0.59 0.42 1.2 99.10% 98.60% 361 76.9 361 81.7 210 71.6 223 65.0 213 71.5 361 77.1 356 53.6 320 91.4 355 77.7 358 81.9
4 VAMC Philadelphia # PA 642 1b 1.37 1.27 1.5 96.60% 96.20% 401 70.9 400 77.9 214 55.1 246 58.2 214 62.4 399 64.6 391 55.8 363 84.7 395 55.5 401 58.4
4 VA Pittsburgh HCS Heinz, Univ Dr, Highld Dr
Pittsburgh # PA 646 1a 0.69 0.51 1.1 98.30% 96.90% 658 76.5 654 78.0 345 61.5 434 66.4 345 66.0 653 75.8 653 51.2 577 87.9 648 67.1 650 72.9
4 VAMC Wilkes-Barre # PA 693 2 -0.04 0.4 1.0 91.60% 93.80% 388 74.3 386 71.9 228 60.8 226 67.9 246 62.1 387 75.3 375 53.6 334 86.2 379 68.2 382 69.3
4 Louis A. Johnson VAMC Clarksburg # WV 540 2 0.1 0.56 2.6 99.10% 99.50% 417 78.8 416 82.3 233 67.5 223 62.4 228 71.7 416 83.8 413 50.4 372 88.2 411 76.6 414 80.5
Page 6 of 35
VISN Facility Name City ST Station Com
plex
ity
National
VA New England Health Care System - VISN 1
1 VA Connecticut HCS West Haven # CT 689 1a
1 Edith N Rogers Memorial Veterans Hospital
Bedford # MA 518 3
1 VA Boston HCS W Roxbury, Brockton Jamaica Plns
West Roxbury # MA 523 1a
1 VAMC Northampton # MA 631 3
1 Togus VAMC Augusta # ME 402 2
1 VAMC Manchester # NH 608 3
1 VAMC Providence # RI 650 2
1 VAMC White River Junction # VT 405 2
VA Healthcare Network Upstate New York - VISN 2
2 Samuel S. Stratton VAMC Albany # NY 528A8 1c
2 VA Western New York HCS Buffalo, Batavia
Buffalo # NY 528 1c
2 VAMC Bath # NY 528A6 3
2 VAMC Canandaigua # NY 528A5 3
2 VAMC Syracuse # NY 528A7 1c
VA NY/NJ Veterans Healthcare Network - VISN 3
3 VA New Jersey HCS East Orange # NJ 561 1c
3 James J. Peters VAMC Bronx # NY 526 1c
3 VA NY Harbor HCS NY Harbor Brooklyn
New York Harbor # NY 630 1a
3 VA Hudson Valley HCS Montrose, Castle Pt
Montrose # NY 620 3
3 VAMC Northport # NY 632 1c
VA Healthcare - VISN 4
4 VAMC Wilmington # DE 460 2
4 James E. Van Zandt VAMC Altoona # PA 503 3
4 VAMC Butler # PA 529 3
4 VAMC Coatesville # PA 542 3
4 VAMC Erie # PA 562 3
4 VAMC Lebanon # PA 595 2
4 VAMC Philadelphia # PA 642 1b
4 VA Pittsburgh HCS Heinz, Univ Dr, Highld Dr
Pittsburgh # PA 646 1a
4 VAMC Wilkes-Barre # PA 693 2
4 Louis A. Johnson VAMC Clarksburg # WV 540 2
Data for FY2012
Column Designator
The narrative in this report is essential for the interpretation of the tabular data. Ho
spita
lizat
ions
for a
ll 12
Con
ditio
ns
Hosp
italiz
atio
ns fo
rCo
nges
tive
Hear
t Fa
ilure
Hosp
italiz
atio
ns fo
rPn
eum
onia
GQ GR GS GT GU GV GW GX GY GZ HA HB HC HD HE HF HG
N *Score N *Score N *Score N *Score N *Score N *Score N *Score # pe
r 100
0 AC
SC
Patie
nts
# pe
r 100
0 CH
F Pa
tient
s
# pe
r 100
0 Pn
eum
onia
Patie
nts
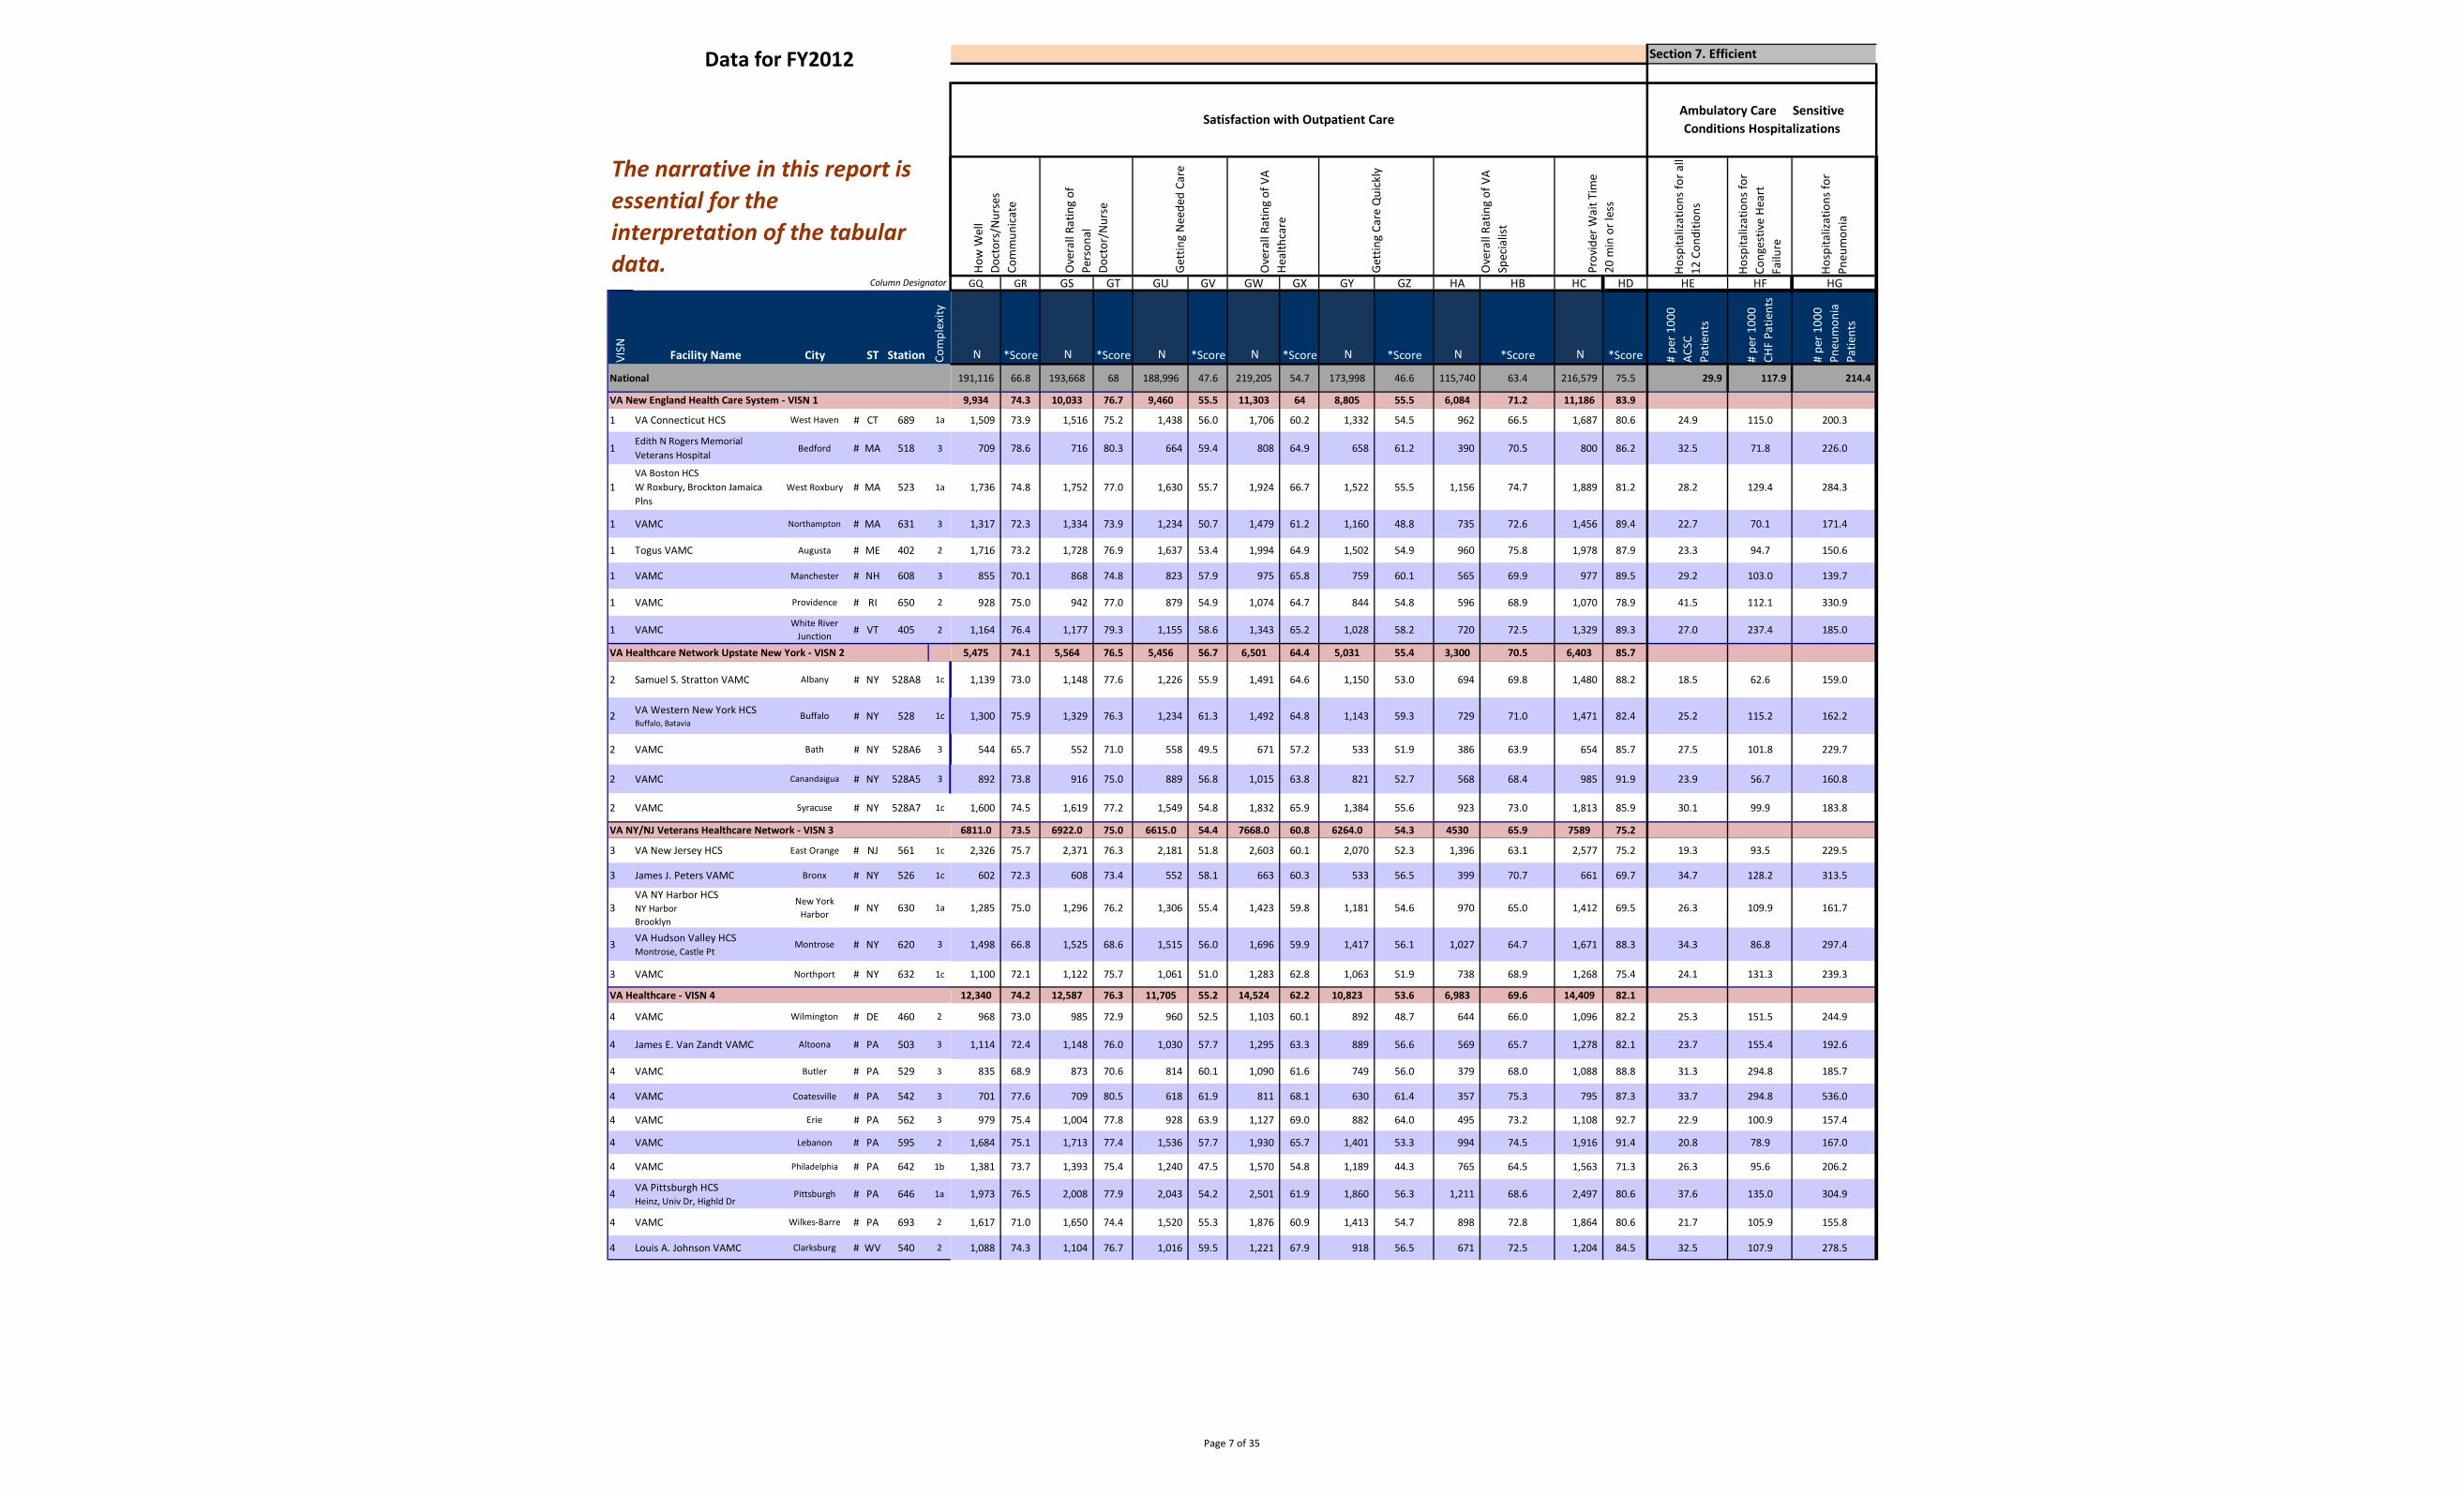
191,116 66.8 193,668 68 188,996 47.6 219,205 54.7 173,998 46.6 115,740 63.4 216,579 75.5 29.9 117.9 214.4
9,934 74.3 10,033 76.7 9,460 55.5 11,303 64 8,805 55.5 6,084 71.2 11,186 83.9
1,509 73.9 1,516 75.2 1,438 56.0 1,706 60.2 1,332 54.5 962 66.5 1,687 80.6 24.9 115.0 200.3
709 78.6 716 80.3 664 59.4 808 64.9 658 61.2 390 70.5 800 86.2 32.5 71.8 226.0
1,736 74.8 1,752 77.0 1,630 55.7 1,924 66.7 1,522 55.5 1,156 74.7 1,889 81.2 28.2 129.4 284.3
1,317 72.3 1,334 73.9 1,234 50.7 1,479 61.2 1,160 48.8 735 72.6 1,456 89.4 22.7 70.1 171.4
1,716 73.2 1,728 76.9 1,637 53.4 1,994 64.9 1,502 54.9 960 75.8 1,978 87.9 23.3 94.7 150.6
855 70.1 868 74.8 823 57.9 975 65.8 759 60.1 565 69.9 977 89.5 29.2 103.0 139.7
928 75.0 942 77.0 879 54.9 1,074 64.7 844 54.8 596 68.9 1,070 78.9 41.5 112.1 330.9
1,164 76.4 1,177 79.3 1,155 58.6 1,343 65.2 1,028 58.2 720 72.5 1,329 89.3 27.0 237.4 185.0
5,475 74.1 5,564 76.5 5,456 56.7 6,501 64.4 5,031 55.4 3,300 70.5 6,403 85.7
1,139 73.0 1,148 77.6 1,226 55.9 1,491 64.6 1,150 53.0 694 69.8 1,480 88.2 18.5 62.6 159.0
1,300 75.9 1,329 76.3 1,234 61.3 1,492 64.8 1,143 59.3 729 71.0 1,471 82.4 25.2 115.2 162.2
544 65.7 552 71.0 558 49.5 671 57.2 533 51.9 386 63.9 654 85.7 27.5 101.8 229.7
892 73.8 916 75.0 889 56.8 1,015 63.8 821 52.7 568 68.4 985 91.9 23.9 56.7 160.8
1,600 74.5 1,619 77.2 1,549 54.8 1,832 65.9 1,384 55.6 923 73.0 1,813 85.9 30.1 99.9 183.8
6811.0 73.5 6922.0 75.0 6615.0 54.4 7668.0 60.8 6264.0 54.3 4530 65.9 7589 75.2
2,326 75.7 2,371 76.3 2,181 51.8 2,603 60.1 2,070 52.3 1,396 63.1 2,577 75.2 19.3 93.5 229.5
602 72.3 608 73.4 552 58.1 663 60.3 533 56.5 399 70.7 661 69.7 34.7 128.2 313.5
1,285 75.0 1,296 76.2 1,306 55.4 1,423 59.8 1,181 54.6 970 65.0 1,412 69.5 26.3 109.9 161.7
1,498 66.8 1,525 68.6 1,515 56.0 1,696 59.9 1,417 56.1 1,027 64.7 1,671 88.3 34.3 86.8 297.4
1,100 72.1 1,122 75.7 1,061 51.0 1,283 62.8 1,063 51.9 738 68.9 1,268 75.4 24.1 131.3 239.3
12,340 74.2 12,587 76.3 11,705 55.2 14,524 62.2 10,823 53.6 6,983 69.6 14,409 82.1
968 73.0 985 72.9 960 52.5 1,103 60.1 892 48.7 644 66.0 1,096 82.2 25.3 151.5 244.9
1,114 72.4 1,148 76.0 1,030 57.7 1,295 63.3 889 56.6 569 65.7 1,278 82.1 23.7 155.4 192.6
835 68.9 873 70.6 814 60.1 1,090 61.6 749 56.0 379 68.0 1,088 88.8 31.3 294.8 185.7
701 77.6 709 80.5 618 61.9 811 68.1 630 61.4 357 75.3 795 87.3 33.7 294.8 536.0
979 75.4 1,004 77.8 928 63.9 1,127 69.0 882 64.0 495 73.2 1,108 92.7 22.9 100.9 157.4
1,684 75.1 1,713 77.4 1,536 57.7 1,930 65.7 1,401 53.3 994 74.5 1,916 91.4 20.8 78.9 167.0
1,381 73.7 1,393 75.4 1,240 47.5 1,570 54.8 1,189 44.3 765 64.5 1,563 71.3 26.3 95.6 206.2
1,973 76.5 2,008 77.9 2,043 54.2 2,501 61.9 1,860 56.3 1,211 68.6 2,497 80.6 37.6 135.0 304.9
1,617 71.0 1,650 74.4 1,520 55.3 1,876 60.9 1,413 54.7 898 72.8 1,864 80.6 21.7 105.9 155.8
1,088 74.3 1,104 76.7 1,016 59.5 1,221 67.9 918 56.5 671 72.5 1,204 84.5 32.5 107.9 278.5
Ambulatory Care Sensitive Conditions Hospitalizations
Prov
ider
Wai
t Tim
e20
min
or l
ess
How
Wel
l Do
ctor
s/N
urse
s Co
mm
unic
ate
Ove
rall
Ratin
g of
Pers
onal
Doct
or/N
urse
Gett
ing
Nee
ded
Care
Ove
rall
Ratin
g of
VA
Heal
thca
re
Gett
ing
Care
Qui
ckly
Satisfaction with Outpatient Care
Section 7. Efficient
Ove
rall
Ratin
g of
VA
Spec
ialis
t
Page 7 of 35
Data for FY2012
Column Designator
The narrative in this report is essential for the interpretation of the tabular data.
Section l: Services, Staffing, Treatment Volumes and Accreditation Utilization Outpatient Medical Procedures
Available In-House Services Acute Inpatient: Medical/Surgical
Acute Inpatient: Mental Health
Visits Inpatient and Outpatient Medical Procedures
Acut
eM
edic
al/S
urgi
cal
Acut
e M
enta
l Hea
lth
Inte
nsiv
e Ca
re U
nit
Emer
genc
y De
pt
Urg
ent C
are
Clin
ics
Com
mun
ity L
ivin
gCe
nter
Spin
al C
ord
Inju
ry &
Diso
rder
s Uni
t
Poly
trau
ma
syst
em
Dom
icila
ry C
are
Med
ical
/Sur
gica
l Ho
spita
l Disc
harg
es
Med
ical
/Sur
gica
lHo
spita
l Disc
harg
es
Med
ical
/Sur
gica
l LO
S
Bed
Day
s of C
are
Faci
lity
Uni
que
Patie
nts
Men
tal H
ealth
Hosp
ital D
ischa
rges
Uni
que
Men
tal H
ealth
Ho
spita
l Disc
harg
es
Men
tal H
ealth
LO
S
Men
tal H
ealth
Bed
Days
of C
are
Prim
ary
Care
Out
patie
nt V
isits
Spe
cial
ty C
are
Out
patie
nt V
isits
Upp
er G
I
Col
onos
copy
Sig
moi
dosc
opy
Bro
ncho
scop
y
EN
T En
dosc
opy
Coro
nary
Angi
ogra
phy
Perc
utan
eous
Coro
nary
Inte
rven
tion
A B C D E F G H I J K L M N O P Q R S T U V W X Y Z AA
VISN Facility Name City ST Station Com
plex
ity
yes/
no
yes/
no
yes/
no
yes/
no
yes/
no
yes/
no
yes/
no
Type
yes/
no
# #/1
000
Uni
que
Patie
nts
Avg
# Da
ys
#/1
000
Uni
que
Patie
nts
# U
niqu
ePa
tient
s
# #/10
00
Uni
que
Patie
nts
# Da
ys
#/1
000
Uni
que
Patie
nts
# # # # # # # # #
National 492,506 83.3 5.2 433.7 5,911,885 87,124 14.7 8.5 124.7 12,680,472 37,926,203 113,853 234,265 12,587 11,744 79,383 40,031 13,207
VA Capitol Health Care Network - VISN 5
5 VAMC Washington # DC 688 1b Yes Yes Yes Yes No Yes No PNS No 5,546 79.6 5.2 411 69,658 860 12.3 9.0 111 88,377 425,135 651 918 69 131 890 474 148
5
VA Maryland HCS (Baltimore, Loch Raven, PerryPoint) Baltimore Perry Pt
Baltimore # MD 512 1b Yes Yes Yes Yes Yes Yes No PSCT Yes 5,979 110.6 5.2 574 54,063 21 0.4 28.5 11 96,780 405,353 714 1,808 69 39 599 230 55
5 VAMC Martinsburg # WV 613 2 Yes Yes Yes Yes No Yes No PSCT Yes 2,369 68.5 4.8 329 34,579 644 18.6 5.2 97 76,624 263,118 1,073 1,673 29 34 145 - -
VA Mid-Atlantic Health Care Network - VISN 6
6 VAMC Asheville # NC 637 1c Yes Yes Yes Yes No Yes No PPOC Yes 4,284 115.1 5.9 683 37,222 772 20.7 6.5 136 75,531 225,895 985 2,359 45 151 830 596 216
6 VAMC Durham # NC 558 1a Yes Yes Yes Yes No Yes No PSCT No 5,958 97.9 5.8 566 60,850 697 11.5 11.2 128 97,610 327,639 991 2,602 140 202 1,936 766 277
6 VAMC Fayetteville # NC 565 2 Yes Yes Yes Yes No Yes No PPOC No 1,764 31.8 4.8 154 55,510 974 17.5 5.7 99 109,813 216,153 473 2,645 12 - - - -
6 W.G. (Bill) Hefner VAMC Salisbury # NC 659 1c Yes Yes Yes Yes No Yes No PSCT Yes 1,733 19.7 5.4 105 88,101 773 8.8 9.3 81 179,987 407,554 1,653 3,125 68 56 474 - -
6 VAMC Hampton # VA 590 2 Yes Yes Yes Yes No Yes Yes PSCT Yes 1,476 34.6 6.1 212 42,666 913 21.4 9.6 206 69,833 255,298 342 1,201 63 15 61 - -
6 Hunter Holmes McGuire VAMC
Richmond # VA 652 1a Yes Yes Yes Yes No Yes Yes PRC
PTRP Yes 6,288 127.9 5.0 634 49,150 682 13.9 7.7 107 97,483 295,344 1,060 2,152 299 69 1,049 922 212
6 VAMC Salem # VA 658 1c Yes Yes Yes Yes No Yes No PSCT Yes 3,516 94.9 6.4 611 37,054 688 18.6 11.4 212 71,887 234,372 193 547 19 58 168 499 136
6 VAMC Beckley # WV 517 3 Yes No Yes Yes No Yes No PPOC No 1,457 103.5 5.1 523 14,077 - - - - 32,322 89,079 379 739 12 20 60 - -
VA Southeast Network - VISN 7
7 VAMC Birmingham # AL 521 1a Yes No Yes Yes No No No PSCT No 5,888 94.4 4.9 461 62,352 - - - - 138,959 367,782 1,029 3,111 64 143 529 481 112
7 Central Alabama Veterans HCS Tuskeegee, Montgomery
Montgomery # AL 619 2 Yes Yes Yes Yes No Yes No PPOC Yes 1,107 24.9 7.2 180 44,449 897 20.2 8.9 179 73,654 206,456 180 663 181 8 - - -
7 VAMC Tuscaloosa # AL 679 3 No Yes No No No Yes No PSCT Yes - - - - 16,290 509 31.2 12.3 386 41,335 116,220 - - - - - - -
7 VAMC (Atlanta,Trinka Davis Veteran's Village)
Atlanta # GA 508 1a Yes Yes Yes Yes No Yes No PSCT No 6,243 70.1 6.1 427 89,045 1,279 14.4 9.7 140 161,377 510,065 894 2,034 160 146 1,618 845 286
7 Charlie Norwood VAMC Augusta # GA 509 1b Yes Yes Yes Yes Yes Yes Yes PNS Yes 3,893 93.7 5.4 510 41,529 428 10.3 4.4 45 57,499 279,671 687 1,742 84 32 806 520 139
7 Carl Vinson VAMC Dublin # GA 557 3 Yes No Yes Yes Yes Yes No PPOC Yes 1,150 33.5 5.7 192 34,329 - - - - 73,624 138,201 319 1,060 29 - - - -
7 Ralph H. Johnson VAMC Charleston # SC 534 1c Yes Yes Yes Yes No Yes No PSCT No 3,671 64.0 4.8 304 57,389 594 10.4 8.8 91 96,957 289,363 862 1,808 64 160 1,876 567 277
7 Wm. Jennings Bryan Dorn VAMC
Columbia # SC 544 1c Yes Yes Yes Yes Yes Yes No PSCT No 4,257 57.0 6.4 362 74,711 571 7.6 9.8 75 145,877 389,872 1,269 3,970 128 144 121 347 -
VA Sunshine Healthcare Network - VISN 8
8 VA HCS Bay Pines # FL 516 1a Yes Yes Yes Yes Yes Yes No PSCT Yes 9,547 93.8 4.2 397 101,806 1,548 15.2 6.0 92 200,042 583,250 1,571 4,198 95 174 1,370 758 291
8 N FLA/S GA Veterans HSC Gainesville Lake Cty
Gainesville Lake City # FL 573 1a Yes Yes Yes Yes Yes Yes No PSCT Yes 12,105 97.2 5.2 501 124,580 1,056 8.5 11.7 99 236,092 671,306 2,771 5,740 188 457 1,914 1,124 291
8 VA HCS Miami # FL 546 1b Yes Yes Yes Yes Yes Yes Yes PSCT Yes 4,841 82.6 4.9 407 58,583 738 12.6 6.0 76 107,578 455,404 1,125 2,090 125 117 736 433 218
8 VAMC Orlando Viera # FL 675 2 No No No No No Yes No PSCT Yes - - - - 98,028 - - - - 231,749 439,000 671 2,829 73 62 397 - -
8 James A. Haley VAMC Tampa # FL 673 1a Yes Yes Yes Yes Yes Yes Yes PRC
PTRP Yes 9,485 105.7 4.9 518 89,712 1,168 13.0 6.2 81 156,674 609,480 1,971 3,847 234 333 2,020 694 211
8 VAMC West Palm Beach # FL 548 1c Yes Yes Yes Yes Yes Yes No PSCT No 5,418 83.1 5.9 492 65,185 1,024 15.7 8.4 132 129,630 386,410 2,210 3,234 41 176 121 318 -
8 VA Caribbean HCS San Juan # PR 672 1a Yes Yes Yes Yes Yes Yes Yes PNS No 7,910 119.1 7.0 832 66,415 1,921 28.9 5.5 160 224,138 492,546 1,193 1,724 87 56 1,020 408 79
Page 8 of 35
VISN Facility Name City ST Station Com
plex
ity
National
Data for FY2012
Column Designator
The narrative in this report is essential for the interpretation of the tabular data.
VA Capitol Health Care Network - VISN 5
5 VAMC Washington # DC 688 1b
5
VA Maryland HCS (Baltimore, Loch Raven, PerryPoint) Baltimore Perry Pt
Baltimore # MD 512 1b
5 VAMC Martinsburg # WV 613 2
VA Mid-Atlantic Health Care Network - VISN 6
6 VAMC Asheville # NC 637 1c
6 VAMC Durham # NC 558 1a
6 VAMC Fayetteville # NC 565 2
6 W.G. (Bill) Hefner VAMC Salisbury # NC 659 1c
6 VAMC Hampton # VA 590 2
6 Hunter Holmes McGuire VAMC
Richmond # VA 652 1a
6 VAMC Salem # VA 658 1c
6 VAMC Beckley # WV 517 3
VA Southeast Network - VISN 7
7 VAMC Birmingham # AL 521 1a
7 Central Alabama Veterans HCS Tuskeegee, Montgomery
Montgomery # AL 619 2
7 VAMC Tuscaloosa # AL 679 3
7 VAMC (Atlanta,Trinka Davis Veteran's Village)
Atlanta # GA 508 1a
7 Charlie Norwood VAMC Augusta # GA 509 1b
7 Carl Vinson VAMC Dublin # GA 557 3
7 Ralph H. Johnson VAMC Charleston # SC 534 1c
7 Wm. Jennings Bryan Dorn VAMC
Columbia # SC 544 1c
VA Sunshine Healthcare Network - VISN 8
8 VA HCS Bay Pines # FL 516 1a
8 N FLA/S GA Veterans HSC Gainesville Lake Cty
Gainesville Lake City # FL 573 1a
8 VA HCS Miami # FL 546 1b
8 VAMC Orlando Viera # FL 675 2
8 James A. Haley VAMC Tampa # FL 673 1a
8 VAMC West Palm Beach # FL 548 1c
8 VA Caribbean HCS San Juan # PR 672 1a
CT s
cans
MRI
scan
s
Mam
mog
raph
y
Aver
age
Daily
Cen
sus
(ADC
)
Uni
que
Resid
ents
Long
Sta
y De
men
tiaCa
re (4
2)
Long
Sta
y Co
ntin
uing
Care
(44)
Long
Sta
y M
enta
lHe
alth
Rec
over
y (4
5)
Long
Sta
y Sp
inal
Cor
d In
jury
and
Diso
rder
s(4
6)
Resp
ite C
are
(47)
Shor
t Sta
yRe
habi
litat
ion
(64)
Shor
t Sta
y Re
sotr
ativ
eCa
re (6
6)
Shor
t Sta
y Co
ntin
uing
Care
for t
hose
Awai
ting
Plac
emen
t
Shor
t Sta
y M
enta
lHe
alth
Rec
over
y(68
)
Shor
t Sta
y De
men
tiaCa
re (6
9)
Geria
tric
Eva
luat
ion
and
Man
agem
ent
(GEM
) - (8
1)
Shor
t Sta
y Sk
illed
Nur
sing
Care
(95)
Hosp
ice
(may
exc
eed
90 d
ays)
(96)
Artif
act o
f cul
ture
chan
ge m
etric
Tot
alSc
ore
Artif
act o
f cul
ture
chan
ge m
etric
Per
cent
In
crea
seU
nann
ounc
ed su
rvey
outc
omes
: # o
f A-G
findi
ngs
Una
nnou
nced
surv
eyou
tcom
es: #
of H
-Lfin
ding
s
IV in
fect
ions
Urin
ary
Trac
tIn
fect
ions
Cons
isten
t As
signm
ent -
Lon
gSt
ayCo
nsist
ent
Assig
nmen
t -Sh
ort
Stay
AB AC AD AE AF AG AH AI AJ AK AL AM AN AO AP AQ AR AS AZ BA BB BC BD BE BF BG
# # # # # Pct Pct Pct Pct Pct Pct Pct Pct Pct Pct Pct Pct Pct # Pct # # # # Pct Pct
1,289,231 562,500 159,153
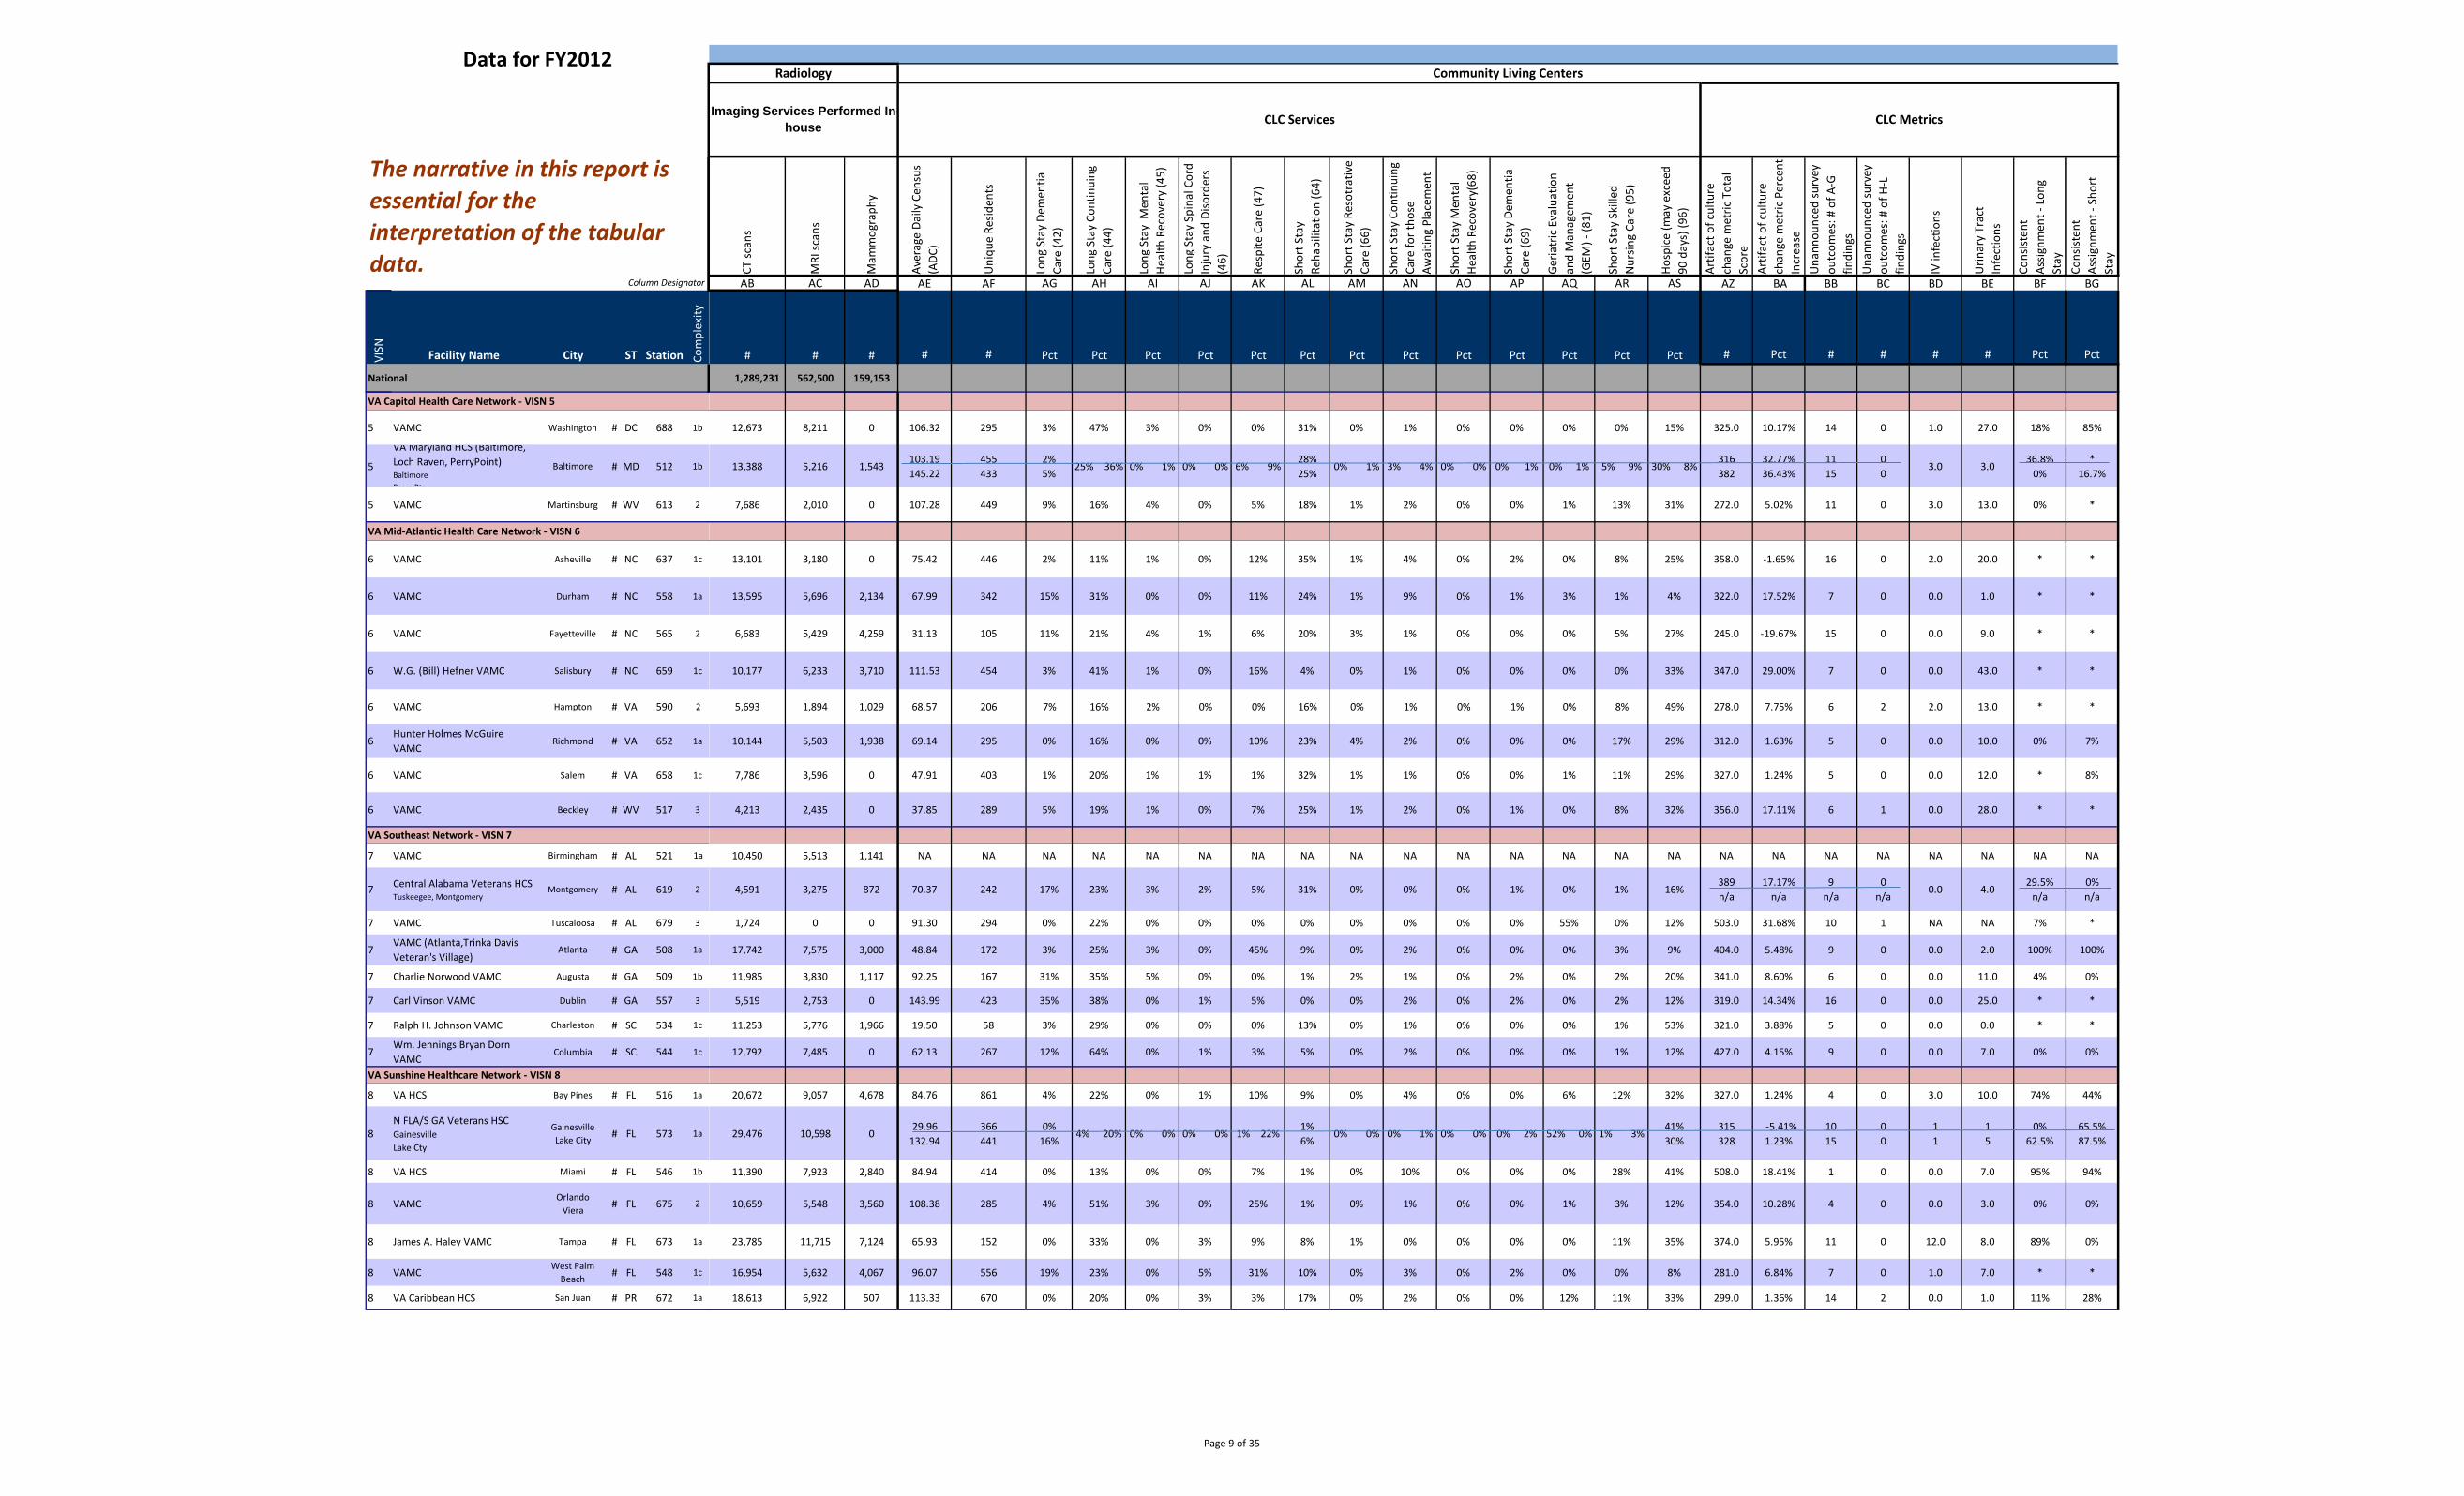
CLC Services
Radiology Community Living Centers
CLC Metrics Imaging Services Performed In-house
12,673 8,211 0 106.32 295 3% 47% 3% 0% 0% 31% 0% 1% 0% 0% 0% 0% 15% 325.0 10.17% 14 0 1.0 27.0 18% 85%
13,388 5,216 1,543 103.19 145.22
455 433
2% 5%
25% 36% 0% 1% 0% 0% 6% 9% 28% 25%
0% 1% 3% 4% 0% 0% 0% 1% 0% 1% 5% 9% 30% 8% 316 382
32.77% 36.43%
11 15
0 0
3.0 3.0 36.8%
0% *
16.7%
7,686 2,010 0 107.28 449 9% 16% 4% 0% 5% 18% 1% 2% 0% 0% 1% 13% 31% 272.0 5.02% 11 0 3.0 13.0 0% *
13,101 3,180 0 75.42 446 2% 11% 1% 0% 12% 35% 1% 4% 0% 2% 0% 8% 25% 358.0 -1.65% 16 0 2.0 20.0 * *
13,595 5,696 2,134 67.99 342 15% 31% 0% 0% 11% 24% 1% 9% 0% 1% 3% 1% 4% 322.0 17.52% 7 0 0.0 1.0 * *
6,683 5,429 4,259 31.13 105 11% 21% 4% 1% 6% 20% 3% 1% 0% 0% 0% 5% 27% 245.0 -19.67% 15 0 0.0 9.0 * *
10,177 6,233 3,710 111.53 454 3% 41% 1% 0% 16% 4% 0% 1% 0% 0% 0% 0% 33% 347.0 29.00% 7 0 0.0 43.0 * *
5,693 1,894 1,029 68.57 206 7% 16% 2% 0% 0% 16% 0% 1% 0% 1% 0% 8% 49% 278.0 7.75% 6 2 2.0 13.0 * *
10,144 5,503 1,938 69.14 295 0% 16% 0% 0% 10% 23% 4% 2% 0% 0% 0% 17% 29% 312.0 1.63% 5 0 0.0 10.0 0% 7%
7,786 3,596 0 47.91 403 1% 20% 1% 1% 1% 32% 1% 1% 0% 0% 1% 11% 29% 327.0 1.24% 5 0 0.0 12.0 * 8%
4,213 2,435 0 37.85 289 5% 19% 1% 0% 7% 25% 1% 2% 0% 1% 0% 8% 32% 356.0 17.11% 6 1 0.0 28.0 * *
10,450 5,513 1,141 NA NA NA NA NA NA NA NA NA NA NA NA NA NA NA NA NA NA NA NA NA NA NA
4,591 3,275 872 70.37 242 17% 23% 3% 2% 5% 31% 0% 0% 0% 1% 0% 1% 16% 389 n/a
17.17% n/a
9 n/a
0 n/a
0.0 4.0 29.5%
n/a 0% n/a
1,724 0 0 91.30 294 0% 22% 0% 0% 0% 0% 0% 0% 0% 0% 55% 0% 12% 503.0 31.68% 10 1 NA NA 7% *
17,742 7,575 3,000 48.84 172 3% 25% 3% 0% 45% 9% 0% 2% 0% 0% 0% 3% 9% 404.0 5.48% 9 0 0.0 2.0 100% 100%
11,985 3,830 1,117 92.25 167 31% 35% 5% 0% 0% 1% 2% 1% 0% 2% 0% 2% 20% 341.0 8.60% 6 0 0.0 11.0 4% 0%
5,519 2,753 0 143.99 423 35% 38% 0% 1% 5% 0% 0% 2% 0% 2% 0% 2% 12% 319.0 14.34% 16 0 0.0 25.0 * *
11,253 5,776 1,966 19.50 58 3% 29% 0% 0% 0% 13% 0% 1% 0% 0% 0% 1% 53% 321.0 3.88% 5 0 0.0 0.0 * *
12,792 7,485 0 62.13 267 12% 64% 0% 1% 3% 5% 0% 2% 0% 0% 0% 1% 12% 427.0 4.15% 9 0 0.0 7.0 0% 0%
20,672 9,057 4,678 84.76 861 4% 22% 0% 1% 10% 9% 0% 4% 0% 0% 6% 12% 32% 327.0 1.24% 4 0 3.0 10.0 74% 44%
29,476 10,598 0 29.96
132.94 366 441
0% 16%
4% 20% 0% 0% 0% 0% 1% 22% 1% 6%
0% 0% 0% 1% 0% 0% 0% 2% 52% 0% 1% 3% 41% 30%
315 328
-5.41% 1.23%
10 15
0 0
1 1
1 5
0% 62.5%
65.5% 87.5%
11,390 7,923 2,840 84.94 414 0% 13% 0% 0% 7% 1% 0% 10% 0% 0% 0% 28% 41% 508.0 18.41% 1 0 0.0 7.0 95% 94%
10,659 5,548 3,560 108.38 285 4% 51% 3% 0% 25% 1% 0% 1% 0% 0% 1% 3% 12% 354.0 10.28% 4 0 0.0 3.0 0% 0%
23,785 11,715 7,124 65.93 152 0% 33% 0% 3% 9% 8% 1% 0% 0% 0% 0% 11% 35% 374.0 5.95% 11 0 12.0 8.0 89% 0%
16,954 5,632 4,067 96.07 556 19% 23% 0% 5% 31% 10% 0% 3% 0% 2% 0% 0% 8% 281.0 6.84% 7 0 1.0 7.0 * *
18,613 6,922 507 113.33 670 0% 20% 0% 3% 3% 17% 0% 2% 0% 0% 12% 11% 33% 299.0 1.36% 14 2 0.0 1.0 11% 28%
Page 9 of 35
Data for FY2012
Column Designator
The narrative in this report is essential for the interpretation of the tabular data.
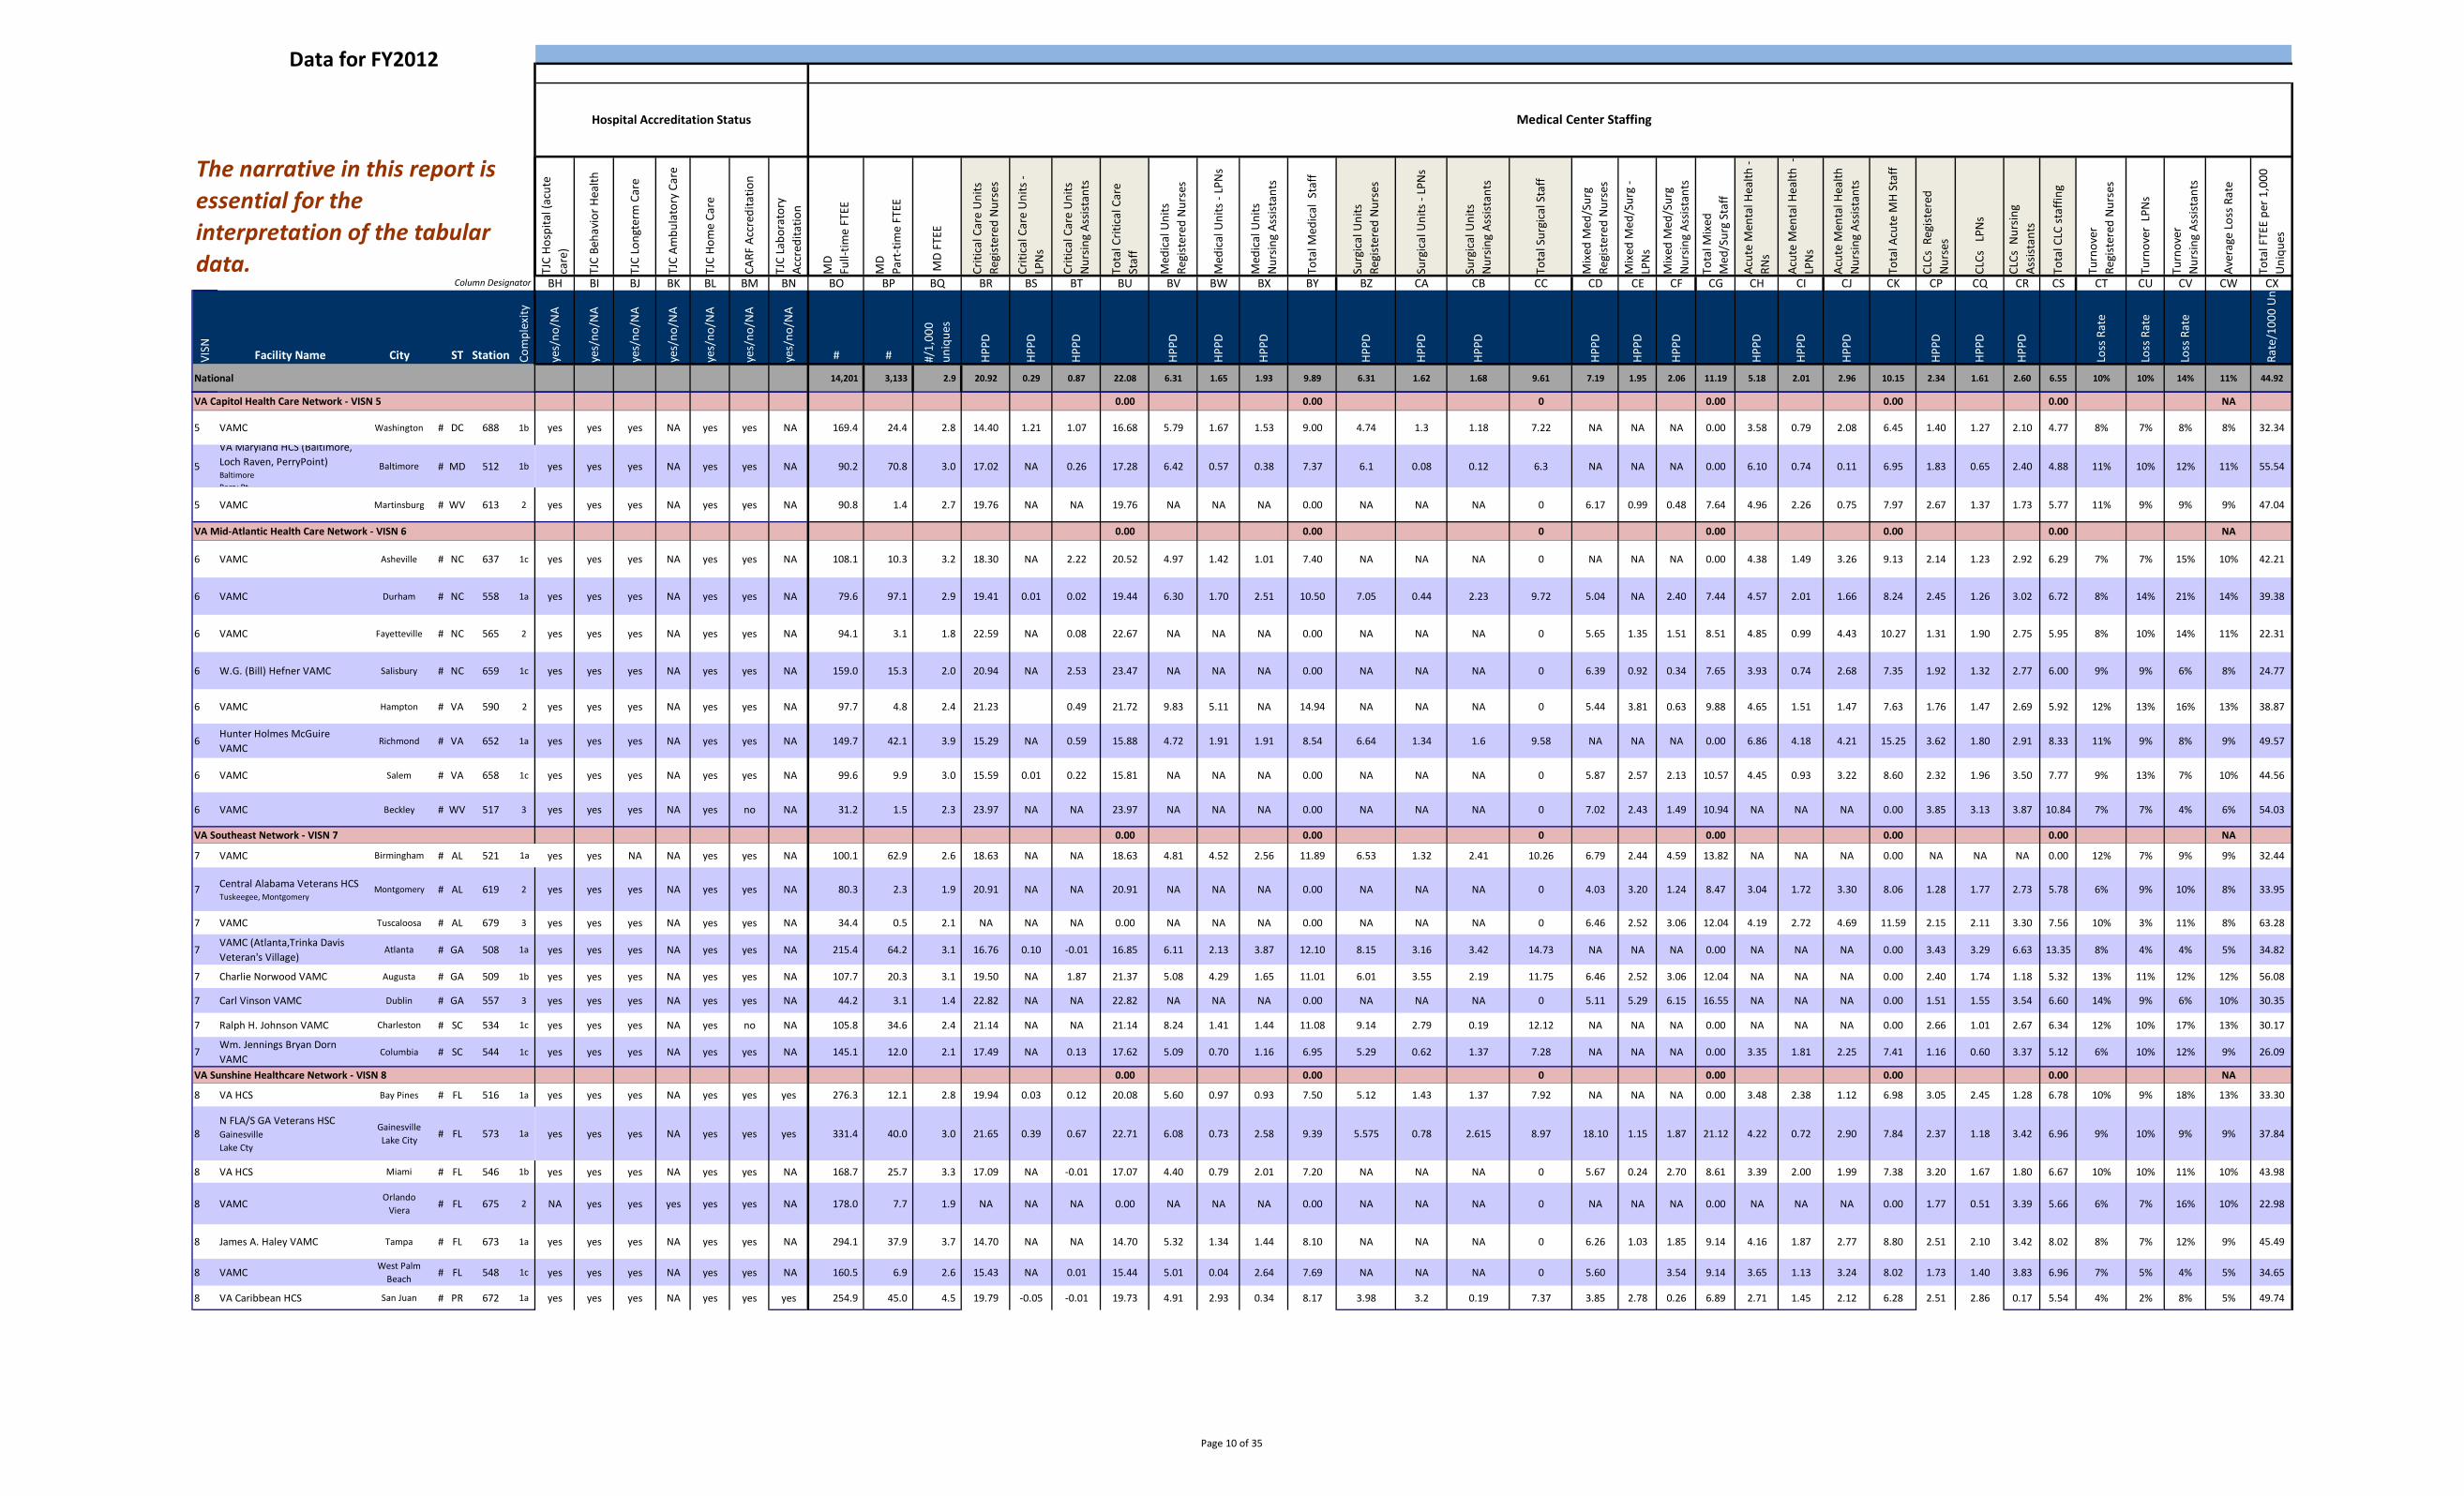
Hospital Accreditation Status Medical Center Staffing
TJC
Hosp
ital (
acut
eca
re)
TJC
Beha
vior
Hea
lth
TJC
Long
term
Car
e
TJC
Ambu
lato
ry C
are
TJC
Hom
e Ca
re
CARF
Acc
redi
tatio
n
TJC
Labo
rato
ryAc
cred
itatio
n
MD
Full-
time
FTEE
MD
Part
-tim
e FT
EE
MD
FTEE
Criti
cal C
are
Uni
tsRe
gist
ered
Nur
ses
Criti
cal C
are
Uni
ts -
LPN
s
Criti
cal C
are
Uni
tsN
ursin
g As
sista
nts
Tota
l Crit
ical
Car
eSt
aff
Med
ical
Uni
tsRe
gist
ered
Nur
ses
Med
ical
Uni
ts -
LPN
s
Med
ical
Uni
tsN
ursin
g As
sista
nts
Tota
l Med
ical
Sta
ff
Surg
ical
Uni
tsRe
gist
ered
Nur
ses
Surg
ical
Uni
ts -
LPN
s
Surg
ical
Uni
tsN
ursin
g As
sista
nts
Tota
l Sur
gica
l Sta
ff
Mix
ed M
ed/S
urg
Regi
ster
ed N
urse
s
Mix
ed M
ed/S
urg
-LP
Ns
Mix
ed M
ed/S
urg
Nur
sing
Assis
tant
s
Tota
l Mix
edM
ed/S
urg
Staf
f
Acut
e M
enta
l Hea
lth -
RNs
Acut
e M
enta
l Hea
lth -
LPN
s
Acut
e M
enta
l Hea
lthN
ursin
g As
sista
nts
Tota
l Acu
te M
H St
aff
CLCs
Reg
ister
edN
urse
s
CLCs
LPN
s
CLCs
Nur
sing
Assis
tant
s
Tota
l CLC
staf
fing
Turn
over
Re
gist
ered
Nur
ses
Turn
over
LPN
s
Turn
over
N
ursin
g As
sista
nts
Aver
age
Loss
Rat
e
Tota
l FTE
E pe
r 1,0
00
Uni
ques
BH BI BJ BK BL BM BN BO BP BQ BR BS BT BU BV BW BX BY BZ CA CB CC CD CE CF CG CH CI CJ CK CP CQ CR CS CT CU CV CW CX
VISN Facility Name City ST Station Com
plex
ity
yes/
no/N
A
yes/
no/N
A
yes/
no/N
A
yes/
no/N
A
yes/
no/N
A
yes/
no/N
A
yes/
no/N
A
# # #/1,
000
uniq
ues
HPPD
HPPD
HPPD
HPPD
HPPD
HPPD
HPPD
HPPD
HPPD
HPPD
HPPD
HPPD
HPPD
HPPD
HPPD
HPPD
HPPD
HPPD
Loss
Rat
e
Loss
Rat
e
Loss
Rat
e
Rate
/100
0 U
n
National 14,201 3,133 2.9 20.92 0.29 0.87 22.08 6.31 1.65 1.93 9.89 6.31 1.62 1.68 9.61 7.19 1.95 2.06 11.19 5.18 2.01 2.96 10.15 2.34 1.61 2.60 6.55 10% 10% 14% 11% 44.92
VA Capitol Health Care Network - VISN 5 0.00 0.00 0 0.00 0.00 0.00 NA
5 VAMC Washington # DC 688 1b yes yes yes NA yes yes NA 169.4 24.4 2.8 14.40 1.21 1.07 16.68 5.79 1.67 1.53 9.00 4.74 1.3 1.18 7.22 NA NA NA 0.00 3.58 0.79 2.08 6.45 1.40 1.27 2.10 4.77 8% 7% 8% 8% 32.34
5
VA Maryland HCS (Baltimore, Loch Raven, PerryPoint) Baltimore Perry Pt
Baltimore # MD 512 1b yes yes yes NA yes yes NA 90.2 70.8 3.0 17.02 NA 0.26 17.28 6.42 0.57 0.38 7.37 6.1 0.08 0.12 6.3 NA NA NA 0.00 6.10 0.74 0.11 6.95 1.83 0.65 2.40 4.88 11% 10% 12% 11% 55.54
5 VAMC Martinsburg # WV 613 2 yes yes yes NA yes yes NA 90.8 1.4 2.7 19.76 NA NA 19.76 NA NA NA 0.00 NA NA NA 0 6.17 0.99 0.48 7.64 4.96 2.26 0.75 7.97 2.67 1.37 1.73 5.77 11% 9% 9% 9% 47.04
VA Mid-Atlantic Health Care Network - VISN 6 0.00 0.00 0 0.00 0.00 0.00 NA
6 VAMC Asheville # NC 637 1c yes yes yes NA yes yes NA 108.1 10.3 3.2 18.30 NA 2.22 20.52 4.97 1.42 1.01 7.40 NA NA NA 0 NA NA NA 0.00 4.38 1.49 3.26 9.13 2.14 1.23 2.92 6.29 7% 7% 15% 10% 42.21
6 VAMC Durham # NC 558 1a yes yes yes NA yes yes NA 79.6 97.1 2.9 19.41 0.01 0.02 19.44 6.30 1.70 2.51 10.50 7.05 0.44 2.23 9.72 5.04 NA 2.40 7.44 4.57 2.01 1.66 8.24 2.45 1.26 3.02 6.72 8% 14% 21% 14% 39.38
6 VAMC Fayetteville # NC 565 2 yes yes yes NA yes yes NA 94.1 3.1 1.8 22.59 NA 0.08 22.67 NA NA NA 0.00 NA NA NA 0 5.65 1.35 1.51 8.51 4.85 0.99 4.43 10.27 1.31 1.90 2.75 5.95 8% 10% 14% 11% 22.31
6 W.G. (Bill) Hefner VAMC Salisbury # NC 659 1c yes yes yes NA yes yes NA 159.0 15.3 2.0 20.94 NA 2.53 23.47 NA NA NA 0.00 NA NA NA 0 6.39 0.92 0.34 7.65 3.93 0.74 2.68 7.35 1.92 1.32 2.77 6.00 9% 9% 6% 8% 24.77
6 VAMC Hampton # VA 590 2 yes yes yes NA yes yes NA 97.7 4.8 2.4 21.23 0.49 21.72 9.83 5.11 NA 14.94 NA NA NA 0 5.44 3.81 0.63 9.88 4.65 1.51 1.47 7.63 1.76 1.47 2.69 5.92 12% 13% 16% 13% 38.87
6 Hunter Holmes McGuire VAMC
Richmond # VA 652 1a yes yes yes NA yes yes NA 149.7 42.1 3.9 15.29 NA 0.59 15.88 4.72 1.91 1.91 8.54 6.64 1.34 1.6 9.58 NA NA NA 0.00 6.86 4.18 4.21 15.25 3.62 1.80 2.91 8.33 11% 9% 8% 9% 49.57
6 VAMC Salem # VA 658 1c yes yes yes NA yes yes NA 99.6 9.9 3.0 15.59 0.01 0.22 15.81 NA NA NA 0.00 NA NA NA 0 5.87 2.57 2.13 10.57 4.45 0.93 3.22 8.60 2.32 1.96 3.50 7.77 9% 13% 7% 10% 44.56
6 VAMC Beckley # WV 517 3 yes yes yes NA yes no NA 31.2 1.5 2.3 23.97 NA NA 23.97 NA NA NA 0.00 NA NA NA 0 7.02 2.43 1.49 10.94 NA NA NA 0.00 3.85 3.13 3.87 10.84 7% 7% 4% 6% 54.03
VA Southeast Network - VISN 7 0.00 0.00 0 0.00 0.00 0.00 NA
7 VAMC Birmingham # AL 521 1a yes yes NA NA yes yes NA 100.1 62.9 2.6 18.63 NA NA 18.63 4.81 4.52 2.56 11.89 6.53 1.32 2.41 10.26 6.79 2.44 4.59 13.82 NA NA NA 0.00 NA NA NA 0.00 12% 7% 9% 9% 32.44
7 Central Alabama Veterans HCS Tuskeegee, Montgomery
Montgomery # AL 619 2 yes yes yes NA yes yes NA 80.3 2.3 1.9 20.91 NA NA 20.91 NA NA NA 0.00 NA NA NA 0 4.03 3.20 1.24 8.47 3.04 1.72 3.30 8.06 1.28 1.77 2.73 5.78 6% 9% 10% 8% 33.95
7 VAMC Tuscaloosa # AL 679 3 yes yes yes NA yes yes NA 34.4 0.5 2.1 NA NA NA 0.00 NA NA NA 0.00 NA NA NA 0 6.46 2.52 3.06 12.04 4.19 2.72 4.69 11.59 2.15 2.11 3.30 7.56 10% 3% 11% 8% 63.28
7 VAMC (Atlanta,Trinka Davis Veteran's Village)
Atlanta # GA 508 1a yes yes yes NA yes yes NA 215.4 64.2 3.1 16.76 0.10 -0.01 16.85 6.11 2.13 3.87 12.10 8.15 3.16 3.42 14.73 NA NA NA 0.00 NA NA NA 0.00 3.43 3.29 6.63 13.35 8% 4% 4% 5% 34.82
7 Charlie Norwood VAMC Augusta # GA 509 1b yes yes yes NA yes yes NA 107.7 20.3 3.1 19.50 NA 1.87 21.37 5.08 4.29 1.65 11.01 6.01 3.55 2.19 11.75 6.46 2.52 3.06 12.04 NA NA NA 0.00 2.40 1.74 1.18 5.32 13% 11% 12% 12% 56.08
7 Carl Vinson VAMC Dublin # GA 557 3 yes yes yes NA yes yes NA 44.2 3.1 1.4 22.82 NA NA 22.82 NA NA NA 0.00 NA NA NA 0 5.11 5.29 6.15 16.55 NA NA NA 0.00 1.51 1.55 3.54 6.60 14% 9% 6% 10% 30.35
7 Ralph H. Johnson VAMC Charleston # SC 534 1c yes yes yes NA yes no NA 105.8 34.6 2.4 21.14 NA NA 21.14 8.24 1.41 1.44 11.08 9.14 2.79 0.19 12.12 NA NA NA 0.00 NA NA NA 0.00 2.66 1.01 2.67 6.34 12% 10% 17% 13% 30.17
7 Wm. Jennings Bryan Dorn VAMC
Columbia # SC 544 1c yes yes yes NA yes yes NA 145.1 12.0 2.1 17.49 NA 0.13 17.62 5.09 0.70 1.16 6.95 5.29 0.62 1.37 7.28 NA NA NA 0.00 3.35 1.81 2.25 7.41 1.16 0.60 3.37 5.12 6% 10% 12% 9% 26.09
VA Sunshine Healthcare Network - VISN 8 0.00 0.00 0 0.00 0.00 0.00 NA
8 VA HCS Bay Pines # FL 516 1a yes yes yes NA yes yes yes 276.3 12.1 2.8 19.94 0.03 0.12 20.08 5.60 0.97 0.93 7.50 5.12 1.43 1.37 7.92 NA NA NA 0.00 3.48 2.38 1.12 6.98 3.05 2.45 1.28 6.78 10% 9% 18% 13% 33.30
8 N FLA/S GA Veterans HSC Gainesville Lake Cty
Gainesville Lake City # FL 573 1a yes yes yes NA yes yes yes 331.4 40.0 3.0 21.65 0.39 0.67 22.71 6.08 0.73 2.58 9.39 5.575 0.78 2.615 8.97 18.10 1.15 1.87 21.12 4.22 0.72 2.90 7.84 2.37 1.18 3.42 6.96 9% 10% 9% 9% 37.84
8 VA HCS Miami # FL 546 1b yes yes yes NA yes yes NA 168.7 25.7 3.3 17.09 NA -0.01 17.07 4.40 0.79 2.01 7.20 NA NA NA 0 5.67 0.24 2.70 8.61 3.39 2.00 1.99 7.38 3.20 1.67 1.80 6.67 10% 10% 11% 10% 43.98
8 VAMC Orlando Viera # FL 675 2 NA yes yes yes yes yes NA 178.0 7.7 1.9 NA NA NA 0.00 NA NA NA 0.00 NA NA NA 0 NA NA NA 0.00 NA NA NA 0.00 1.77 0.51 3.39 5.66 6% 7% 16% 10% 22.98
8 James A. Haley VAMC Tampa # FL 673 1a yes yes yes NA yes yes NA 294.1 37.9 3.7 14.70 NA NA 14.70 5.32 1.34 1.44 8.10 NA NA NA 0 6.26 1.03 1.85 9.14 4.16 1.87 2.77 8.80 2.51 2.10 3.42 8.02 8% 7% 12% 9% 45.49
8 VAMC West Palm Beach # FL 548 1c yes yes yes NA yes yes NA 160.5 6.9 2.6 15.43 NA 0.01 15.44 5.01 0.04 2.64 7.69 NA NA NA 0 5.60 3.54 9.14 3.65 1.13 3.24 8.02 1.73 1.40 3.83 6.96 7% 5% 4% 5% 34.65
8 VA Caribbean HCS San Juan # PR 672 1a yes yes yes NA yes yes yes 254.9 45.0 4.5 19.79 -0.05 -0.01 19.73 4.91 2.93 0.34 8.17 3.98 3.2 0.19 7.37 3.85 2.78 0.26 6.89 2.71 1.45 2.12 6.28 2.51 2.86 0.17 5.54 4% 2% 8% 5% 49.74
Page 10 of 35
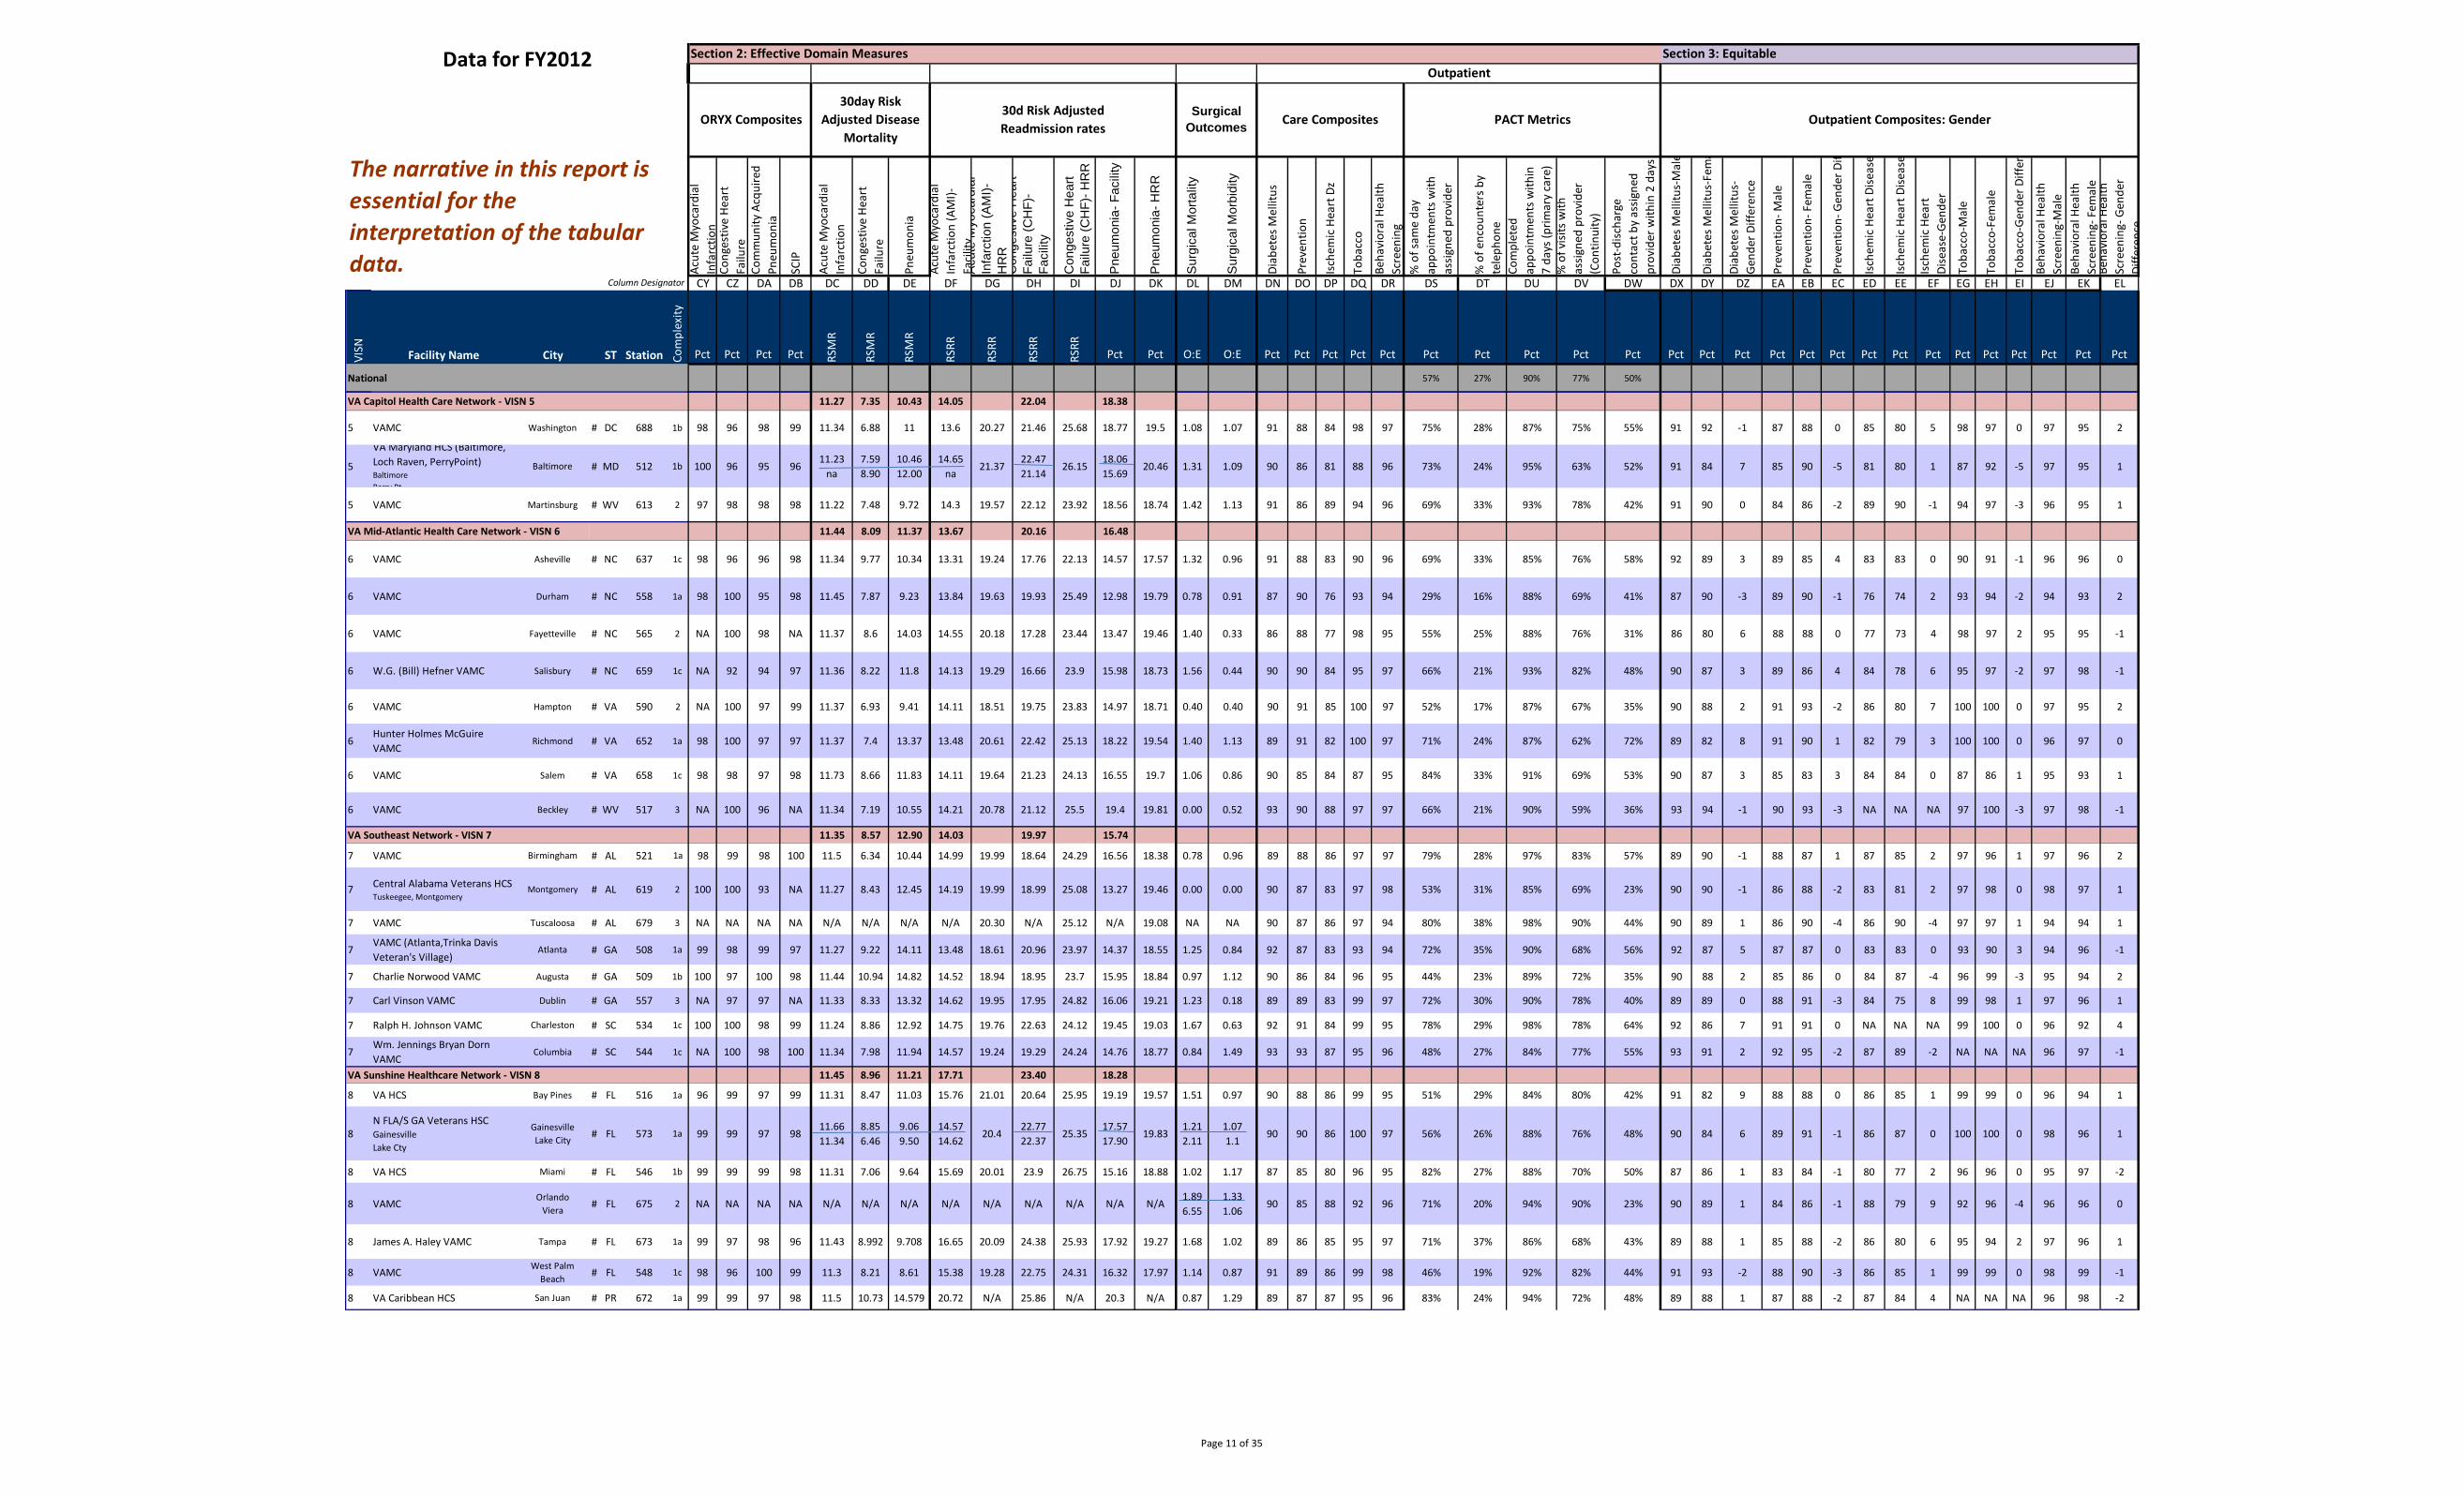
Data for FY2012
Column Designator
The narrative in this report is essential for the interpretation of the tabular data.
Section 2: Effective Domain Measures Section 3: Equitable Outpatient
ORYX Composites 30day Risk
Adjusted Disease Mortality
30d Risk Adjusted Readmission rates
Surgical Outcomes Care Composites PACT Metrics Outpatient Composites: Gender
Acut
e M
yoca
rdia
l In
farc
tion
Cong
estiv
e He
art
Failu
reCo
mm
unity
Acq
uire
d Pn
eum
onia
SCIP
Acut
e M
yoca
rdia
l In
farc
tion
Cong
estiv
e He
art
Failu
re
Pneu
mon
ia
Acut
e M
yoca
rdia
l In
farc
tion
(AM
I)-
Faci
lity
DF
Acu
te M
yoca
rdia
lIn
farc
tion
(AM
I)-
HR
RC
onge
stiv
e H
eart
Failu
re (C
HF)
- Fa
cilit
y
Con
gest
ive
Hea
rtFa
ilure
(CH
F)- H
RR
Pne
umon
ia- F
acili
ty
Pne
umon
ia- H
RR
Sur
gica
l Mor
talit
y
Sur
gica
l Mor
bidi
ty
Diab
etes
Mel
litus
Prev
entio
n
Isch
emic
Hea
rt D
z
Toba
cco
Beha
vior
al H
ealth
Scre
enin
g%
of s
ame
day
appo
intm
ents
with
as
signe
d pr
ovid
er
% o
f enc
ount
ers b
yte
leph
one
Com
plet
edap
poin
tmen
ts w
ithin
7
days
(prim
ary
care
)%
of v
isits
with
assig
ned
prov
ider
(Con
tinui
ty)
Post
-disc
harg
eco
ntac
t by
assig
ned
prov
ider
with
in 2
day
s
Diab
etes
Mel
litus
-Mal
e
Diab
etes
Mel
litus
-Fem
a
Diab
etes
Mel
litus
-Ge
nder
Diff
eren
ce
Prev
entio
n- M
ale
Prev
entio
n- F
emal
e
Prev
entio
n- G
ende
r Dif
Isch
emic
Hea
rt D
iseas
e
Isch
emic
Hea
rt D
iseas
e
Isch
emic
Hea
rt
Dise
ase-
Gend
er
Toba
cco-
Mal
e
Toba
cco-
Fem
ale
Toba
cco-
Gend
er D
iffer
e
Beha
vior
al H
ealth
Scre
enin
g-M
ale
Beha
vior
al H
ealth
Scre
enin
g- F
emal
eBe
havi
oral
Hea
lthSc
reen
ing-
Gen
der
Diffe
renc
e
CY CZ DA DB DC DD DE DG DH DI DJ DK DL DM DN DO DP DQ DR DS DT DU DV DW DX DY DZ EA EB EC ED EE EF EG EH EI EJ EK EL
VISN Facility Name City ST Station Com
plex
ity
Pct Pct Pct Pct RSM
R
RSM
R
RSM
R
RSRR
RSRR
RSRR
RSRR
Pct Pct O:E O:E Pct Pct Pct Pct Pct Pct Pct Pct Pct Pct Pct Pct Pct Pct Pct Pct Pct Pct Pct Pct Pct Pct Pct Pct Pct
National 57% 27% 90% 77% 50%
VA Capitol Health Care Network - VISN 5 11.27 7.35 10.43 14.05 22.04 18.38
5 VAMC Washington # DC 688 1b 98 96 98 99 11.34 6.88 11 13.6 20.27 21.46 25.68 18.77 19.5 1.08 1.07 91 88 84 98 97 75% 28% 87% 75% 55% 91 92 -1 87 88 0 85 80 5 98 97 0 97 95 2
5
VA Maryland HCS (Baltimore, Loch Raven, PerryPoint) Baltimore Perry Pt
Baltimore # MD 512 1b 100 96 95 96 11.23
na 7.59 8.90
10.46 12.00
14.65 na
21.37 22.47 21.14
26.15 18.06 15.69
20.46 1.31 1.09 90 86 81 88 96 73% 24% 95% 63% 52% 91 84 7 85 90 -5 81 80 1 87 92 -5 97 95 1
5 VAMC Martinsburg # WV 613 2 97 98 98 98 11.22 7.48 9.72 14.3 19.57 22.12 23.92 18.56 18.74 1.42 1.13 91 86 89 94 96 69% 33% 93% 78% 42% 91 90 0 84 86 -2 89 90 -1 94 97 -3 96 95 1
VA Mid-Atlantic Health Care Network - VISN 6 11.44 8.09 11.37 13.67 20.16 16.48
6 VAMC Asheville # NC 637 1c 98 96 96 98 11.34 9.77 10.34 13.31 19.24 17.76 22.13 14.57 17.57 1.32 0.96 91 88 83 90 96 69% 33% 85% 76% 58% 92 89 3 89 85 4 83 83 0 90 91 -1 96 96 0
6 VAMC Durham # NC 558 1a 98 100 95 98 11.45 7.87 9.23 13.84 19.63 19.93 25.49 12.98 19.79 0.78 0.91 87 90 76 93 94 29% 16% 88% 69% 41% 87 90 -3 89 90 -1 76 74 2 93 94 -2 94 93 2
6 VAMC Fayetteville # NC 565 2 NA 100 98 NA 11.37 8.6 14.03 14.55 20.18 17.28 23.44 13.47 19.46 1.40 0.33 86 88 77 98 95 55% 25% 88% 76% 31% 86 80 6 88 88 0 77 73 4 98 97 2 95 95 -1
6 W.G. (Bill) Hefner VAMC Salisbury # NC 659 1c NA 92 94 97 11.36 8.22 11.8 14.13 19.29 16.66 23.9 15.98 18.73 1.56 0.44 90 90 84 95 97 66% 21% 93% 82% 48% 90 87 3 89 86 4 84 78 6 95 97 -2 97 98 -1
6 VAMC Hampton # VA 590 2 NA 100 97 99 11.37 6.93 9.41 14.11 18.51 19.75 23.83 14.97 18.71 0.40 0.40 90 91 85 100 97 52% 17% 87% 67% 35% 90 88 2 91 93 -2 86 80 7 100 100 0 97 95 2
6 Hunter Holmes McGuire VAMC
Richmond # VA 652 1a 98 100 97 97 11.37 7.4 13.37 13.48 20.61 22.42 25.13 18.22 19.54 1.40 1.13 89 91 82 100 97 71% 24% 87% 62% 72% 89 82 8 91 90 1 82 79 3 100 100 0 96 97 0
6 VAMC Salem # VA 658 1c 98 98 97 98 11.73 8.66 11.83 14.11 19.64 21.23 24.13 16.55 19.7 1.06 0.86 90 85 84 87 95 84% 33% 91% 69% 53% 90 87 3 85 83 3 84 84 0 87 86 1 95 93 1
6 VAMC Beckley # WV 517 3 NA 100 96 NA 11.34 7.19 10.55 14.21 20.78 21.12 25.5 19.4 19.81 0.00 0.52 93 90 88 97 97 66% 21% 90% 59% 36% 93 94 -1 90 93 -3 NA NA NA 97 100 -3 97 98 -1
VA Southeast Network - VISN 7 11.35 8.57 12.90 14.03 19.97 15.74
7 VAMC Birmingham # AL 521 1a 98 99 98 100 11.5 6.34 10.44 14.99 19.99 18.64 24.29 16.56 18.38 0.78 0.96 89 88 86 97 97 79% 28% 97% 83% 57% 89 90 -1 88 87 1 87 85 2 97 96 1 97 96 2
7 Central Alabama Veterans HCS Tuskeegee, Montgomery
Montgomery # AL 619 2 100 100 93 NA 11.27 8.43 12.45 14.19 19.99 18.99 25.08 13.27 19.46 0.00 0.00 90 87 83 97 98 53% 31% 85% 69% 23% 90 90 -1 86 88 -2 83 81 2 97 98 0 98 97 1
7 VAMC Tuscaloosa # AL 679 3 NA NA NA NA N/A N/A N/A N/A 20.30 N/A 25.12 N/A 19.08 NA NA 90 87 86 97 94 80% 38% 98% 90% 44% 90 89 1 86 90 -4 86 90 -4 97 97 1 94 94 1
7 VAMC (Atlanta,Trinka Davis Veteran's Village)
Atlanta # GA 508 1a 99 98 99 97 11.27 9.22 14.11 13.48 18.61 20.96 23.97 14.37 18.55 1.25 0.84 92 87 83 93 94 72% 35% 90% 68% 56% 92 87 5 87 87 0 83 83 0 93 90 3 94 96 -1
7 Charlie Norwood VAMC Augusta # GA 509 1b 100 97 100 98 11.44 10.94 14.82 14.52 18.94 18.95 23.7 15.95 18.84 0.97 1.12 90 86 84 96 95 44% 23% 89% 72% 35% 90 88 2 85 86 0 84 87 -4 96 99 -3 95 94 2
7 Carl Vinson VAMC Dublin # GA 557 3 NA 97 97 NA 11.33 8.33 13.32 14.62 19.95 17.95 24.82 16.06 19.21 1.23 0.18 89 89 83 99 97 72% 30% 90% 78% 40% 89 89 0 88 91 -3 84 75 8 99 98 1 97 96 1
7 Ralph H. Johnson VAMC Charleston # SC 534 1c 100 100 98 99 11.24 8.86 12.92 14.75 19.76 22.63 24.12 19.45 19.03 1.67 0.63 92 91 84 99 95 78% 29% 98% 78% 64% 92 86 7 91 91 0 NA NA NA 99 100 0 96 92 4
7 Wm. Jennings Bryan Dorn VAMC
Columbia # SC 544 1c NA 100 98 100 11.34 7.98 11.94 14.57 19.24 19.29 24.24 14.76 18.77 0.84 1.49 93 93 87 95 96 48% 27% 84% 77% 55% 93 91 2 92 95 -2 87 89 -2 NA NA NA 96 97 -1
VA Sunshine Healthcare Network - VISN 8 11.45 8.96 11.21 17.71 23.40 18.28
8 VA HCS Bay Pines # FL 516 1a 96 99 97 99 11.31 8.47 11.03 15.76 21.01 20.64 25.95 19.19 19.57 1.51 0.97 90 88 86 99 95 51% 29% 84% 80% 42% 91 82 9 88 88 0 86 85 1 99 99 0 96 94 1
8 N FLA/S GA Veterans HSC Gainesville Lake Cty
Gainesville Lake City # FL 573 1a 99 99 97 98
11.66 11.34
8.85 6.46
9.06 9.50
14.57 14.62
20.4 22.77 22.37
25.35 17.57 17.90
19.83 1.21 2.11
1.07 1.1
90 90 86 100 97 56% 26% 88% 76% 48% 90 84 6 89 91 -1 86 87 0 100 100 0 98 96 1
8 VA HCS Miami # FL 546 1b 99 99 99 98 11.31 7.06 9.64 15.69 20.01 23.9 26.75 15.16 18.88 1.02 1.17 87 85 80 96 95 82% 27% 88% 70% 50% 87 86 1 83 84 -1 80 77 2 96 96 0 95 97 -2
8 VAMC Orlando Viera # FL 675 2 NA NA NA NA N/A N/A N/A N/A N/A N/A N/A N/A N/A
1.89 6.55
1.33 1.06
90 85 88 92 96 71% 20% 94% 90% 23% 90 89 1 84 86 -1 88 79 9 92 96 -4 96 96 0
8 James A. Haley VAMC Tampa # FL 673 1a 99 97 98 96 11.43 8.992 9.708 16.65 20.09 24.38 25.93 17.92 19.27 1.68 1.02 89 86 85 95 97 71% 37% 86% 68% 43% 89 88 1 85 88 -2 86 80 6 95 94 2 97 96 1
8 VAMC West Palm Beach # FL 548 1c 98 96 100 99 11.3 8.21 8.61 15.38 19.28 22.75 24.31 16.32 17.97 1.14 0.87 91 89 86 99 98 46% 19% 92% 82% 44% 91 93 -2 88 90 -3 86 85 1 99 99 0 98 99 -1
8 VA Caribbean HCS San Juan # PR 672 1a 99 99 97 98 11.5 10.73 14.579 20.72 N/A 25.86 N/A 20.3 N/A 0.87 1.29 89 87 87 95 96 83% 24% 94% 72% 48% 89 88 1 87 88 -2 87 84 4 NA NA NA 96 98 -2
Page 11 of 35
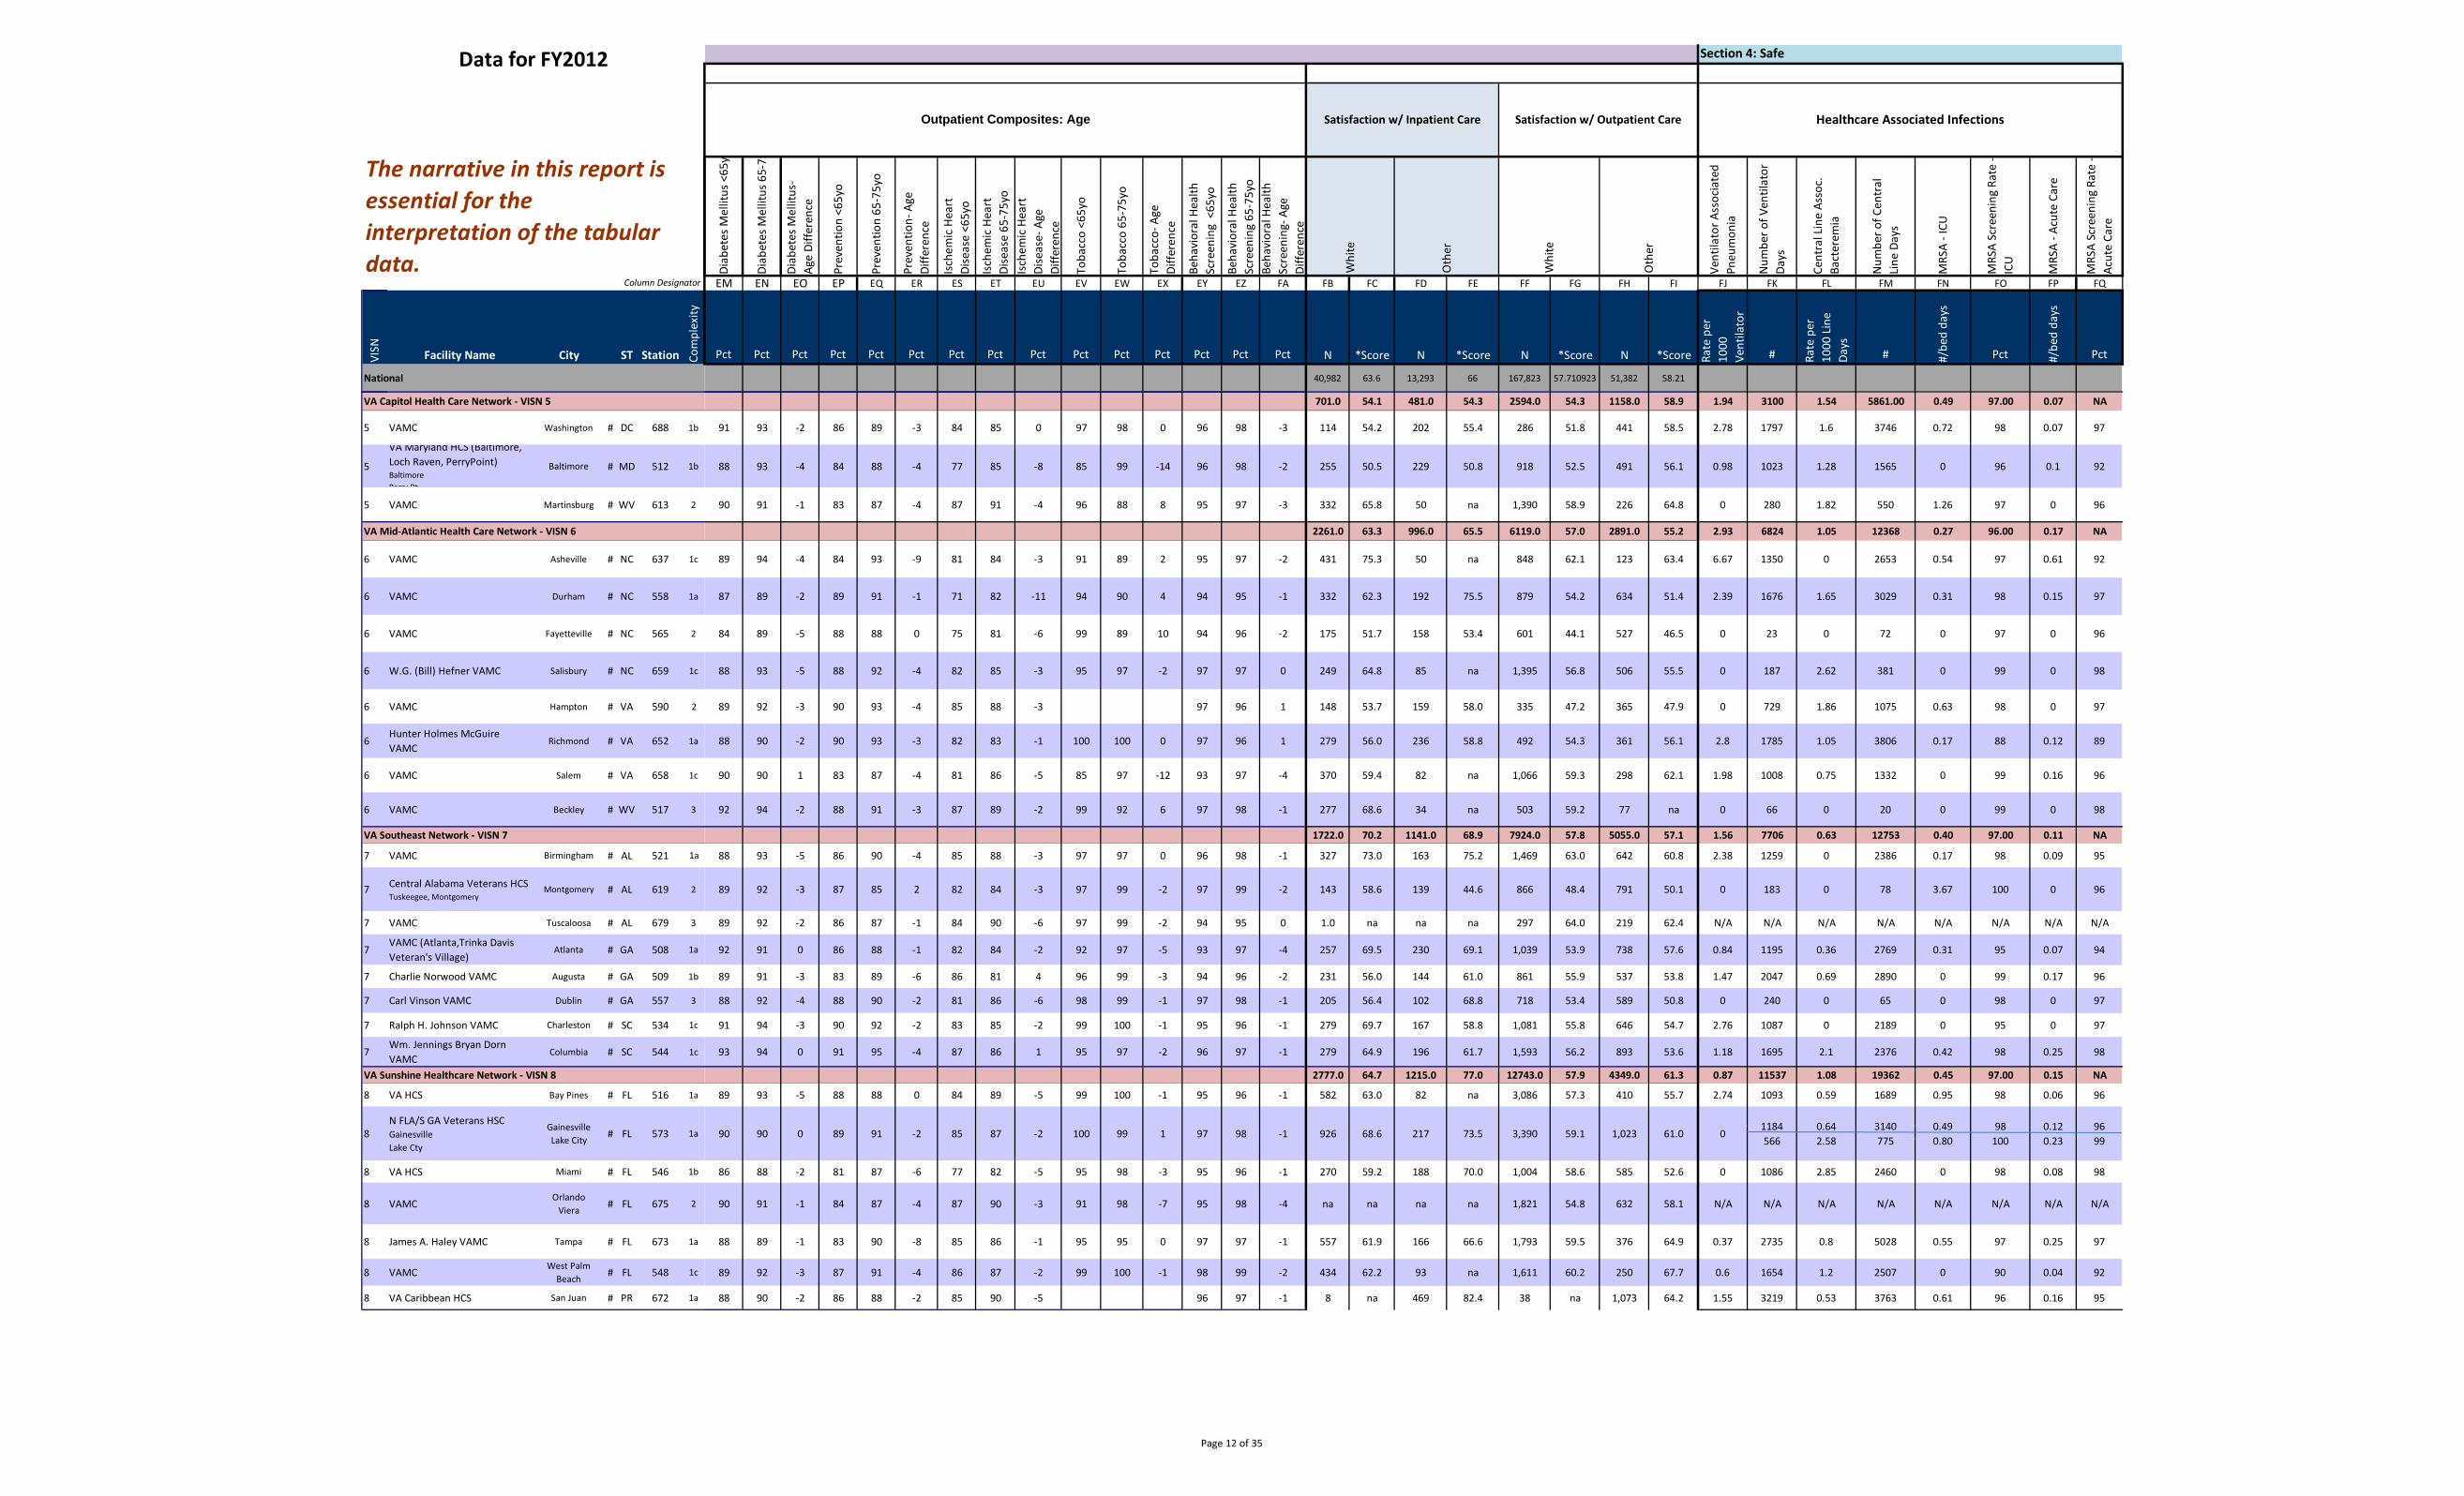
Data for FY2012
Column Designator
The narrative in this report is essential for the interpretation of the tabular data.
Section 4: Safe
Outpatient Composites: Age Satisfaction w/ Inpatient Care Satisfaction w/ Outpatient Care Healthcare Associated Infections
Diab
etes
Mel
litus
<65
y
Diab
etes
Mel
litus
65-
75
Diab
etes
Mel
litus
-Ag
e Di
ffere
nce
Prev
entio
n <6
5yo
Prev
entio
n 65
-75y
o
Prev
entio
n- A
geDi
ffere
nce
Isch
emic
Hea
rt
Dise
ase
<65y
o
Isch
emic
Hea
rt
Dise
ase
65-7
5yo
Isch
emic
Hea
rt
Dise
ase-
Age
Diffe
renc
e
Toba
cco
<65y
o
Toba
cco
65-7
5yo
Toba
cco-
Age
Diffe
renc
e
Beha
vior
al H
ealth
Scre
enin
g <
65yo
Beha
vior
al H
ealth
Scre
enin
g 65
-75y
oBe
havi
oral
Hea
lthSc
reen
ing-
Age
Diffe
renc
e
Whi
te
Oth
er
Whi
te
Oth
er
Vent
ilato
r Ass
ocia
ted
Pneu
mon
ia
Num
ber o
f Ven
tilat
orDa
ys
Cent
ral L
ine
Asso
c.Ba
cter
emia
Num
ber o
f Cen
tral
Line
Day
s
MRS
A -I
CU
MRS
A Sc
reen
ing
Rate
-IC
U
MRS
A -A
cute
Car
e
MRS
A Sc
reen
ing
Rate
-Ac
ute
Care
EM EN EO EP EQ ER ES ET EU EV EW EX EY EZ FA FB FC FD FE FF FG FH FI FJ FK FL FM FN FO FP FQ
VISN Facility Name City ST Station Com
plex
ity
Pct Pct Pct Pct Pct Pct Pct Pct Pct Pct Pct Pct Pct Pct Pct N *Score N *Score N *Score N *Score Rate
per
1000
Vent
ilato
r
# Rate
per
1000
Lin
eDa
ys
# #/be
d da
ys
Pct #/be
d da
ys
Pct
National 40,982 63.6 13,293 66 167,823 57.710923 51,382 58.21
VA Capitol Health Care Network - VISN 5 701.0 54.1 481.0 54.3 2594.0 54.3 1158.0 58.9 1.94 3100 1.54 5861.00 0.49 97.00 0.07 NA
5 VAMC Washington # DC 688 1b 91 93 -2 86 89 -3 84 85 0 97 98 0 96 98 -3 114 54.2 202 55.4 286 51.8 441 58.5 2.78 1797 1.6 3746 0.72 98 0.07 97
5
VA Maryland HCS (Baltimore, Loch Raven, PerryPoint) Baltimore Perry Pt
Baltimore # MD 512 1b 88 93 -4 84 88 -4 77 85 -8 85 99 -14 96 98 -2 255 50.5 229 50.8 918 52.5 491 56.1 0.98 1023 1.28 1565 0 96 0.1 92
5 VAMC Martinsburg # WV 613 2 90 91 -1 83 87 -4 87 91 -4 96 88 8 95 97 -3 332 65.8 50 na 1,390 58.9 226 64.8 0 280 1.82 550 1.26 97 0 96
VA Mid-Atlantic Health Care Network - VISN 6 2261.0 63.3 996.0 65.5 6119.0 57.0 2891.0 55.2 2.93 6824 1.05 12368 0.27 96.00 0.17 NA
6 VAMC Asheville # NC 637 1c 89 94 -4 84 93 -9 81 84 -3 91 89 2 95 97 -2 431 75.3 50 na 848 62.1 123 63.4 6.67 1350 0 2653 0.54 97 0.61 92
6 VAMC Durham # NC 558 1a 87 89 -2 89 91 -1 71 82 -11 94 90 4 94 95 -1 332 62.3 192 75.5 879 54.2 634 51.4 2.39 1676 1.65 3029 0.31 98 0.15 97
6 VAMC Fayetteville # NC 565 2 84 89 -5 88 88 0 75 81 -6 99 89 10 94 96 -2 175 51.7 158 53.4 601 44.1 527 46.5 0 23 0 72 0 97 0 96
6 W.G. (Bill) Hefner VAMC Salisbury # NC 659 1c 88 93 -5 88 92 -4 82 85 -3 95 97 -2 97 97 0 249 64.8 85 na 1,395 56.8 506 55.5 0 187 2.62 381 0 99 0 98
6 VAMC Hampton # VA 590 2 89 92 -3 90 93 -4 85 88 -3 97 96 1 148 53.7 159 58.0 335 47.2 365 47.9 0 729 1.86 1075 0.63 98 0 97
6 Hunter Holmes McGuire VAMC
Richmond # VA 652 1a 88 90 -2 90 93 -3 82 83 -1 100 100 0 97 96 1 279 56.0 236 58.8 492 54.3 361 56.1 2.8 1785 1.05 3806 0.17 88 0.12 89
6 VAMC Salem # VA 658 1c 90 90 1 83 87 -4 81 86 -5 85 97 -12 93 97 -4 370 59.4 82 na 1,066 59.3 298 62.1 1.98 1008 0.75 1332 0 99 0.16 96
6 VAMC Beckley # WV 517 3 92 94 -2 88 91 -3 87 89 -2 99 92 6 97 98 -1 277 68.6 34 na 503 59.2 77 na 0 66 0 20 0 99 0 98
VA Southeast Network - VISN 7 1722.0 70.2 1141.0 68.9 7924.0 57.8 5055.0 57.1 1.56 7706 0.63 12753 0.40 97.00 0.11 NA
7 VAMC Birmingham # AL 521 1a 88 93 -5 86 90 -4 85 88 -3 97 97 0 96 98 -1 327 73.0 163 75.2 1,469 63.0 642 60.8 2.38 1259 0 2386 0.17 98 0.09 95
7 Central Alabama Veterans HCS Tuskeegee, Montgomery
Montgomery # AL 619 2 89 92 -3 87 85 2 82 84 -3 97 99 -2 97 99 -2 143 58.6 139 44.6 866 48.4 791 50.1 0 183 0 78 3.67 100 0 96
7 VAMC Tuscaloosa # AL 679 3 89 92 -2 86 87 -1 84 90 -6 97 99 -2 94 95 0 1.0 na na na 297 64.0 219 62.4 N/A N/A N/A N/A N/A N/A N/A N/A
7 VAMC (Atlanta,Trinka Davis Veteran's Village)
Atlanta # GA 508 1a 92 91 0 86 88 -1 82 84 -2 92 97 -5 93 97 -4 257 69.5 230 69.1 1,039 53.9 738 57.6 0.84 1195 0.36 2769 0.31 95 0.07 94
7 Charlie Norwood VAMC Augusta # GA 509 1b 89 91 -3 83 89 -6 86 81 4 96 99 -3 94 96 -2 231 56.0 144 61.0 861 55.9 537 53.8 1.47 2047 0.69 2890 0 99 0.17 96
7 Carl Vinson VAMC Dublin # GA 557 3 88 92 -4 88 90 -2 81 86 -6 98 99 -1 97 98 -1 205 56.4 102 68.8 718 53.4 589 50.8 0 240 0 65 0 98 0 97
7 Ralph H. Johnson VAMC Charleston # SC 534 1c 91 94 -3 90 92 -2 83 85 -2 99 100 -1 95 96 -1 279 69.7 167 58.8 1,081 55.8 646 54.7 2.76 1087 0 2189 0 95 0 97
7 Wm. Jennings Bryan Dorn VAMC
Columbia # SC 544 1c 93 94 0 91 95 -4 87 86 1 95 97 -2 96 97 -1 279 64.9 196 61.7 1,593 56.2 893 53.6 1.18 1695 2.1 2376 0.42 98 0.25 98
VA Sunshine Healthcare Network - VISN 8 2777.0 64.7 1215.0 77.0 12743.0 57.9 4349.0 61.3 0.87 11537 1.08 19362 0.45 97.00 0.15 NA
8 VA HCS Bay Pines # FL 516 1a 89 93 -5 88 88 0 84 89 -5 99 100 -1 95 96 -1 582 63.0 82 na 3,086 57.3 410 55.7 2.74 1093 0.59 1689 0.95 98 0.06 96
8 N FLA/S GA Veterans HSC Gainesville Lake Cty
Gainesville Lake City # FL 573 1a 90 90 0 89 91 -2 85 87 -2 100 99 1 97 98 -1 926 68.6 217 73.5 3,390 59.1 1,023 61.0 0
1184 0.64 3140 0.49 98 0.12 96 566 2.58 775 0.80 100 0.23 99
8 VA HCS Miami # FL 546 1b 86 88 -2 81 87 -6 77 82 -5 95 98 -3 95 96 -1 270 59.2 188 70.0 1,004 58.6 585 52.6 0 1086 2.85 2460 0 98 0.08 98
8 VAMC Orlando Viera # FL 675 2 90 91 -1 84 87 -4 87 90 -3 91 98 -7 95 98 -4 na na na na 1,821 54.8 632 58.1 N/A N/A N/A N/A N/A N/A N/A N/A
8 James A. Haley VAMC Tampa # FL 673 1a 88 89 -1 83 90 -8 85 86 -1 95 95 0 97 97 -1 557 61.9 166 66.6 1,793 59.5 376 64.9 0.37 2735 0.8 5028 0.55 97 0.25 97
8 VAMC West Palm Beach # FL 548 1c 89 92 -3 87 91 -4 86 87 -2 99 100 -1 98 99 -2 434 62.2 93 na 1,611 60.2 250 67.7 0.6 1654 1.2 2507 0 90 0.04 92
8 VA Caribbean HCS San Juan # PR 672 1a 88 90 -2 86 88 -2 85 90 -5 96 97 -1 8 na 469 82.4 38 na 1,073 64.2 1.55 3219 0.53 3763 0.61 96 0.16 95
Page 12 of 35
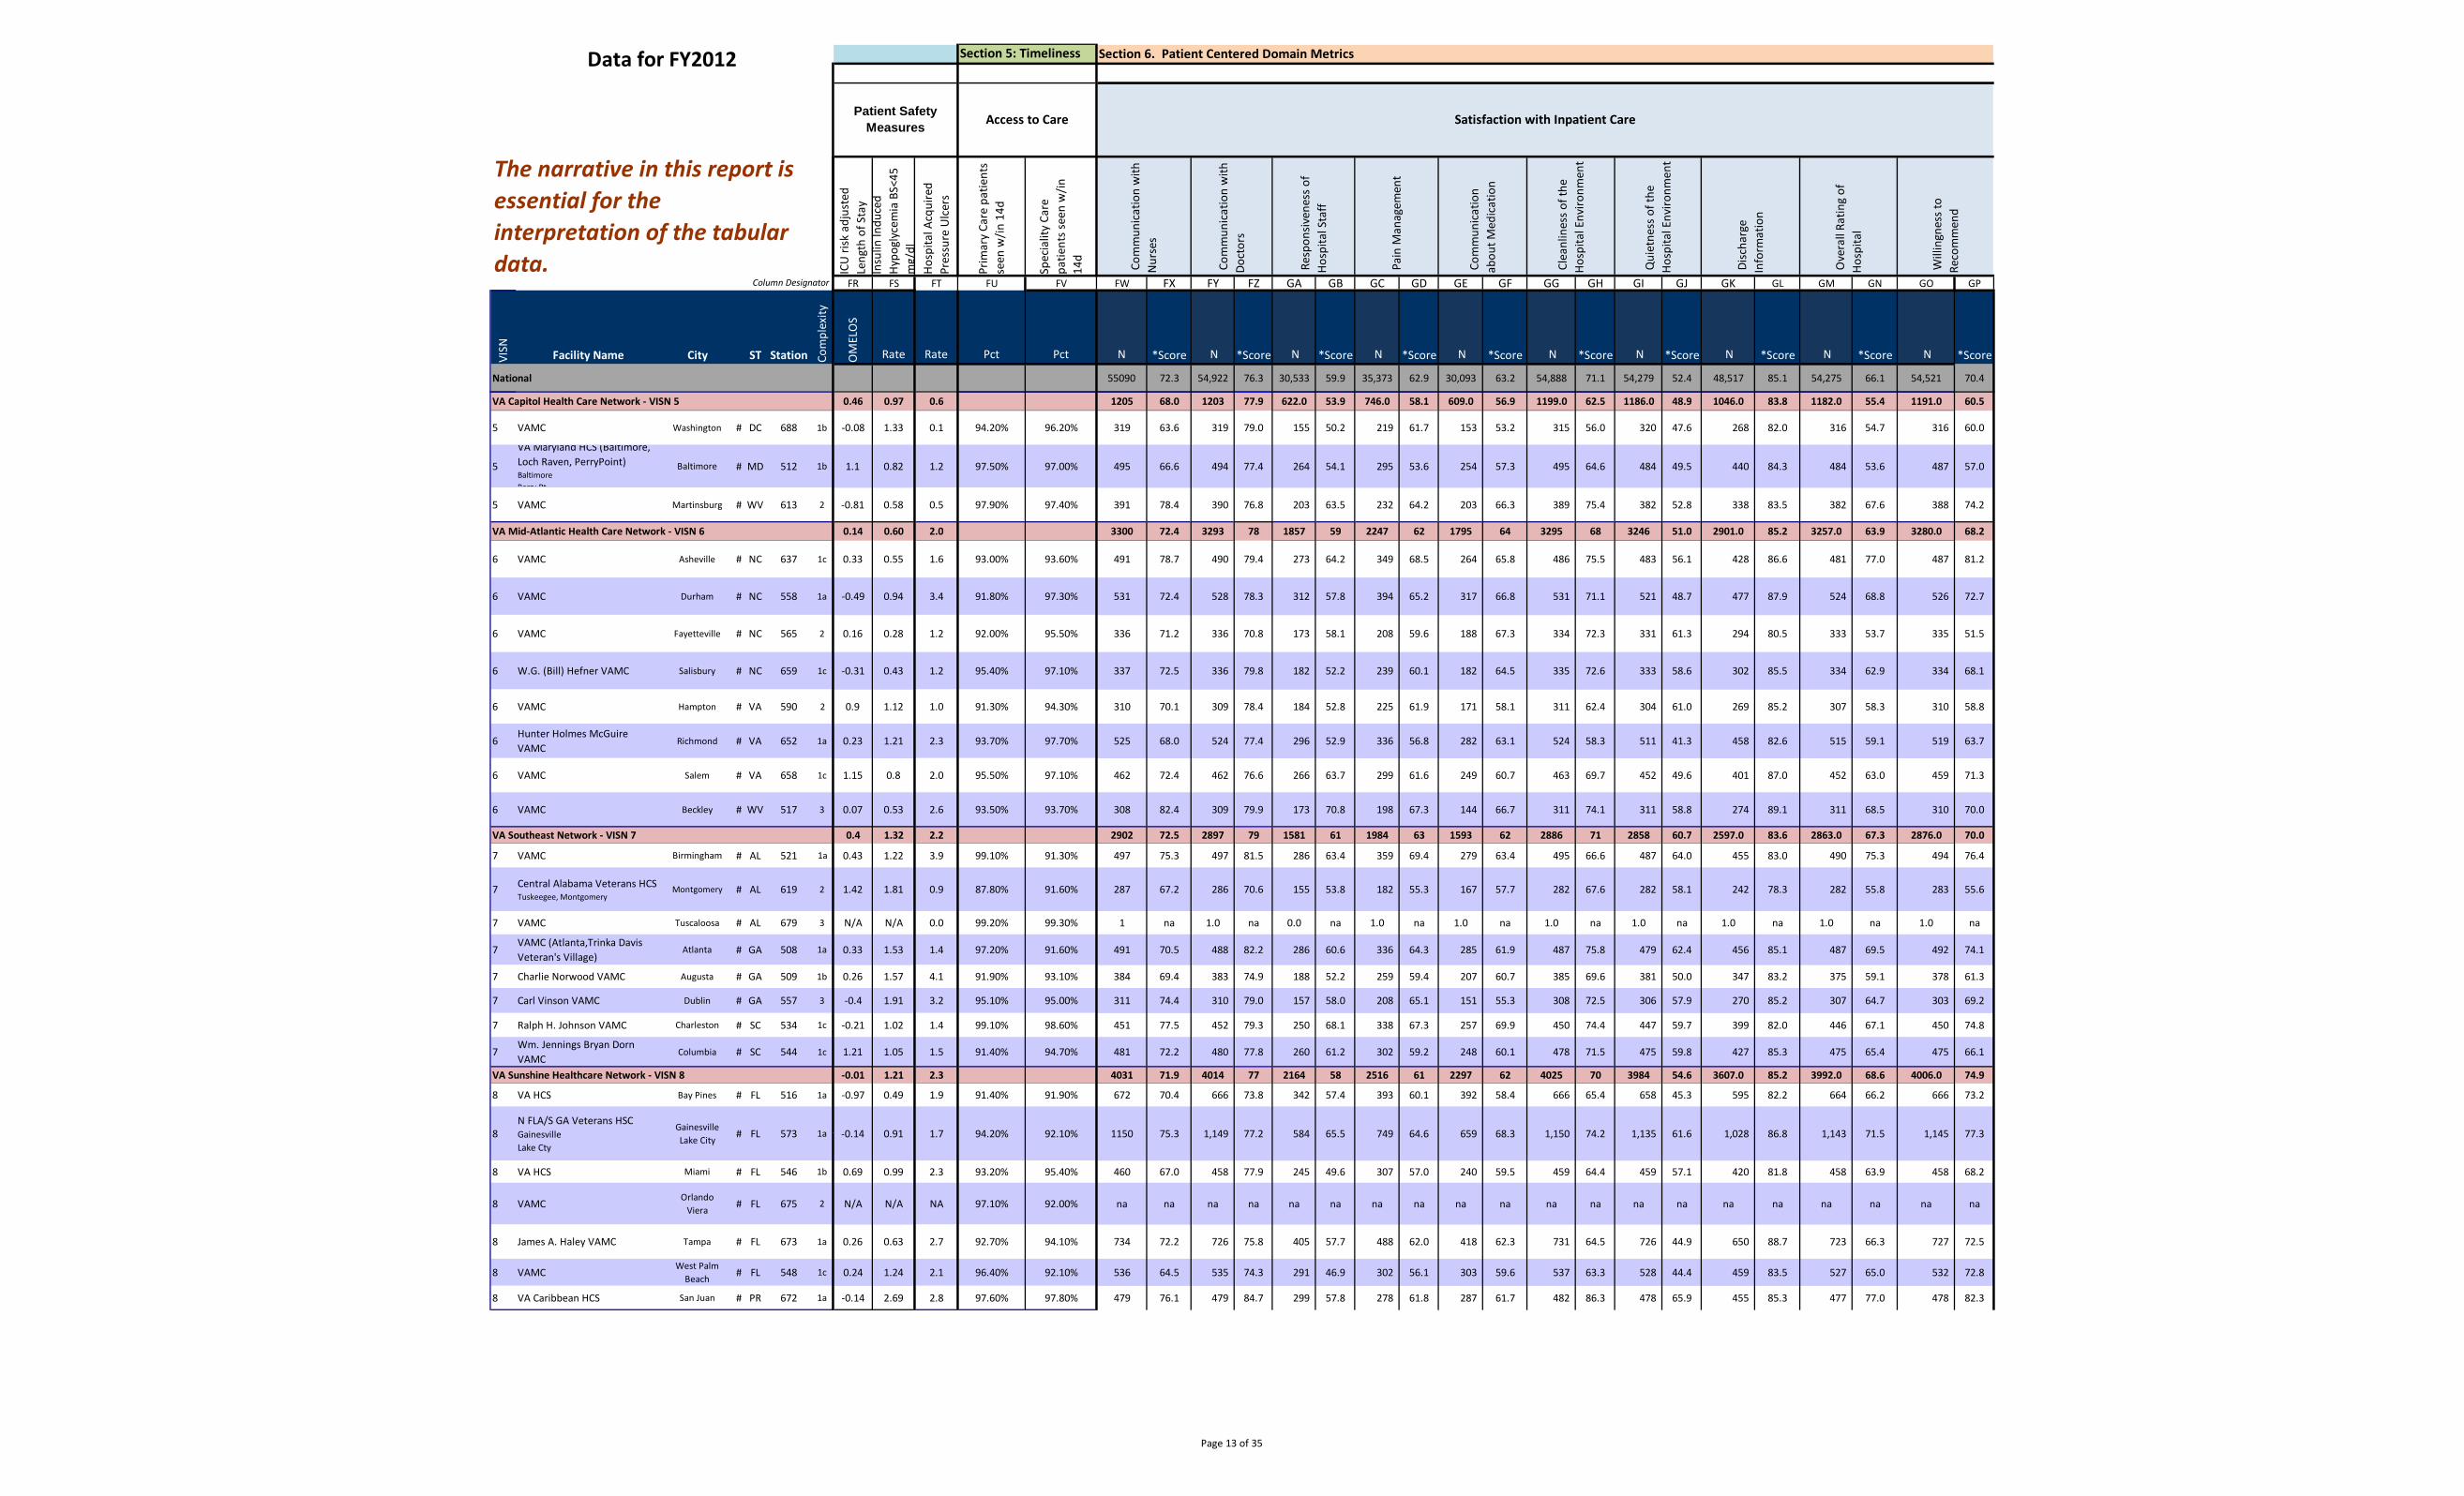
Data for FY2012
Column Designator
The narrative in this report is essential for the interpretation of the tabular data.
Section 5: Timeliness Section 6. Patient Centered Domain Metrics
Patient Safety Measures Access to Care Satisfaction with Inpatient Care
ICU
risk
adj
uste
d Le
ngth
of S
tay
Insu
lin In
duce
d Hy
pogl
ycem
ia B
S<45
m
g/dl
Hosp
ital A
cqui
red
Pres
sure
Ulc
ers
Prim
ary
Care
pat
ient
sse
en w
/in 1
4d
Spec
ialit
y Ca
repa
tient
s see
n w
/in14
d
Com
mun
icat
ion
with
N
urse
s
Com
mun
icat
ion
with
Do
ctor
s
Res
pons
iven
ess o
fHo
spita
l Sta
ff
Pai
n M
anag
emen
t
Com
mun
icat
ion
abou
t Med
icat
ion
Cle
anlin
ess o
f the
Hosp
ital E
nviro
nmen
t
Qui
etne
ss o
f the
Hosp
ital E
nviro
nmen
t
Disc
harg
eIn
form
atio
n
Ove
rall
Ratin
g of
Hosp
ital
Will
ingn
ess t
oRe
com
men
d
FR FS FT FU FV FW FX FY FZ GA GB GC GD GE GF GG GH GI GJ GK GL GM GN GO GP
VISN Facility Name City ST Station Com
plex
ity
OM
ELO
S
Rate Rate Pct Pct N *Score N *Score N *Score N *Score N *Score N *Score N *Score N *Score N *Score N *Score
National 55090 72.3 54,922 76.3 30,533 59.9 35,373 62.9 30,093 63.2 54,888 71.1 54,279 52.4 48,517 85.1 54,275 66.1 54,521 70.4
VA Capitol Health Care Network - VISN 5 0.46 0.97 0.6 1205 68.0 1203 77.9 622.0 53.9 746.0 58.1 609.0 56.9 1199.0 62.5 1186.0 48.9 1046.0 83.8 1182.0 55.4 1191.0 60.5
5 VAMC Washington # DC 688 1b -0.08 1.33 0.1 94.20% 96.20% 319 63.6 319 79.0 155 50.2 219 61.7 153 53.2 315 56.0 320 47.6 268 82.0 316 54.7 316 60.0
5
VA Maryland HCS (Baltimore, Loch Raven, PerryPoint) Baltimore Perry Pt
Baltimore # MD 512 1b 1.1 0.82 1.2 97.50% 97.00% 495 66.6 494 77.4 264 54.1 295 53.6 254 57.3 495 64.6 484 49.5 440 84.3 484 53.6 487 57.0
5 VAMC Martinsburg # WV 613 2 -0.81 0.58 0.5 97.90% 97.40% 391 78.4 390 76.8 203 63.5 232 64.2 203 66.3 389 75.4 382 52.8 338 83.5 382 67.6 388 74.2
VA Mid-Atlantic Health Care Network - VISN 6 0.14 0.60 2.0 3300 72.4 3293 78 1857 59 2247 62 1795 64 3295 68 3246 51.0 2901.0 85.2 3257.0 63.9 3280.0 68.2
6 VAMC Asheville # NC 637 1c 0.33 0.55 1.6 93.00% 93.60% 491 78.7 490 79.4 273 64.2 349 68.5 264 65.8 486 75.5 483 56.1 428 86.6 481 77.0 487 81.2
6 VAMC Durham # NC 558 1a -0.49 0.94 3.4 91.80% 97.30% 531 72.4 528 78.3 312 57.8 394 65.2 317 66.8 531 71.1 521 48.7 477 87.9 524 68.8 526 72.7
6 VAMC Fayetteville # NC 565 2 0.16 0.28 1.2 92.00% 95.50% 336 71.2 336 70.8 173 58.1 208 59.6 188 67.3 334 72.3 331 61.3 294 80.5 333 53.7 335 51.5
6 W.G. (Bill) Hefner VAMC Salisbury # NC 659 1c -0.31 0.43 1.2 95.40% 97.10% 337 72.5 336 79.8 182 52.2 239 60.1 182 64.5 335 72.6 333 58.6 302 85.5 334 62.9 334 68.1
6 VAMC Hampton # VA 590 2 0.9 1.12 1.0 91.30% 94.30% 310 70.1 309 78.4 184 52.8 225 61.9 171 58.1 311 62.4 304 61.0 269 85.2 307 58.3 310 58.8
6 Hunter Holmes McGuire VAMC
Richmond # VA 652 1a 0.23 1.21 2.3 93.70% 97.70% 525 68.0 524 77.4 296 52.9 336 56.8 282 63.1 524 58.3 511 41.3 458 82.6 515 59.1 519 63.7
6 VAMC Salem # VA 658 1c 1.15 0.8 2.0 95.50% 97.10% 462 72.4 462 76.6 266 63.7 299 61.6 249 60.7 463 69.7 452 49.6 401 87.0 452 63.0 459 71.3
6 VAMC Beckley # WV 517 3 0.07 0.53 2.6 93.50% 93.70% 308 82.4 309 79.9 173 70.8 198 67.3 144 66.7 311 74.1 311 58.8 274 89.1 311 68.5 310 70.0
VA Southeast Network - VISN 7 0.4 1.32 2.2 2902 72.5 2897 79 1581 61 1984 63 1593 62 2886 71 2858 60.7 2597.0 83.6 2863.0 67.3 2876.0 70.0
7 VAMC Birmingham # AL 521 1a 0.43 1.22 3.9 99.10% 91.30% 497 75.3 497 81.5 286 63.4 359 69.4 279 63.4 495 66.6 487 64.0 455 83.0 490 75.3 494 76.4
7 Central Alabama Veterans HCS Tuskeegee, Montgomery
Montgomery # AL 619 2 1.42 1.81 0.9 87.80% 91.60% 287 67.2 286 70.6 155 53.8 182 55.3 167 57.7 282 67.6 282 58.1 242 78.3 282 55.8 283 55.6
7 VAMC Tuscaloosa # AL 679 3 N/A N/A 0.0 99.20% 99.30% 1 na 1.0 na 0.0 na 1.0 na 1.0 na 1.0 na 1.0 na 1.0 na 1.0 na 1.0 na
7 VAMC (Atlanta,Trinka Davis Veteran's Village)
Atlanta # GA 508 1a 0.33 1.53 1.4 97.20% 91.60% 491 70.5 488 82.2 286 60.6 336 64.3 285 61.9 487 75.8 479 62.4 456 85.1 487 69.5 492 74.1
7 Charlie Norwood VAMC Augusta # GA 509 1b 0.26 1.57 4.1 91.90% 93.10% 384 69.4 383 74.9 188 52.2 259 59.4 207 60.7 385 69.6 381 50.0 347 83.2 375 59.1 378 61.3
7 Carl Vinson VAMC Dublin # GA 557 3 -0.4 1.91 3.2 95.10% 95.00% 311 74.4 310 79.0 157 58.0 208 65.1 151 55.3 308 72.5 306 57.9 270 85.2 307 64.7 303 69.2
7 Ralph H. Johnson VAMC Charleston # SC 534 1c -0.21 1.02 1.4 99.10% 98.60% 451 77.5 452 79.3 250 68.1 338 67.3 257 69.9 450 74.4 447 59.7 399 82.0 446 67.1 450 74.8
7 Wm. Jennings Bryan Dorn VAMC
Columbia # SC 544 1c 1.21 1.05 1.5 91.40% 94.70% 481 72.2 480 77.8 260 61.2 302 59.2 248 60.1 478 71.5 475 59.8 427 85.3 475 65.4 475 66.1
VA Sunshine Healthcare Network - VISN 8 -0.01 1.21 2.3 4031 71.9 4014 77 2164 58 2516 61 2297 62 4025 70 3984 54.6 3607.0 85.2 3992.0 68.6 4006.0 74.9
8 VA HCS Bay Pines # FL 516 1a -0.97 0.49 1.9 91.40% 91.90% 672 70.4 666 73.8 342 57.4 393 60.1 392 58.4 666 65.4 658 45.3 595 82.2 664 66.2 666 73.2
8 N FLA/S GA Veterans HSC Gainesville Lake Cty
Gainesville Lake City # FL 573 1a -0.14 0.91 1.7 94.20% 92.10% 1150 75.3 1,149 77.2 584 65.5 749 64.6 659 68.3 1,150 74.2 1,135 61.6 1,028 86.8 1,143 71.5 1,145 77.3
8 VA HCS Miami # FL 546 1b 0.69 0.99 2.3 93.20% 95.40% 460 67.0 458 77.9 245 49.6 307 57.0 240 59.5 459 64.4 459 57.1 420 81.8 458 63.9 458 68.2
8 VAMC Orlando Viera # FL 675 2 N/A N/A NA 97.10% 92.00% na na na na na na na na na na na na na na na na na na na na
8 James A. Haley VAMC Tampa # FL 673 1a 0.26 0.63 2.7 92.70% 94.10% 734 72.2 726 75.8 405 57.7 488 62.0 418 62.3 731 64.5 726 44.9 650 88.7 723 66.3 727 72.5
8 VAMC West Palm Beach # FL 548 1c 0.24 1.24 2.1 96.40% 92.10% 536 64.5 535 74.3 291 46.9 302 56.1 303 59.6 537 63.3 528 44.4 459 83.5 527 65.0 532 72.8
8 VA Caribbean HCS San Juan # PR 672 1a -0.14 2.69 2.8 97.60% 97.80% 479 76.1 479 84.7 299 57.8 278 61.8 287 61.7 482 86.3 478 65.9 455 85.3 477 77.0 478 82.3
Page 13 of 35
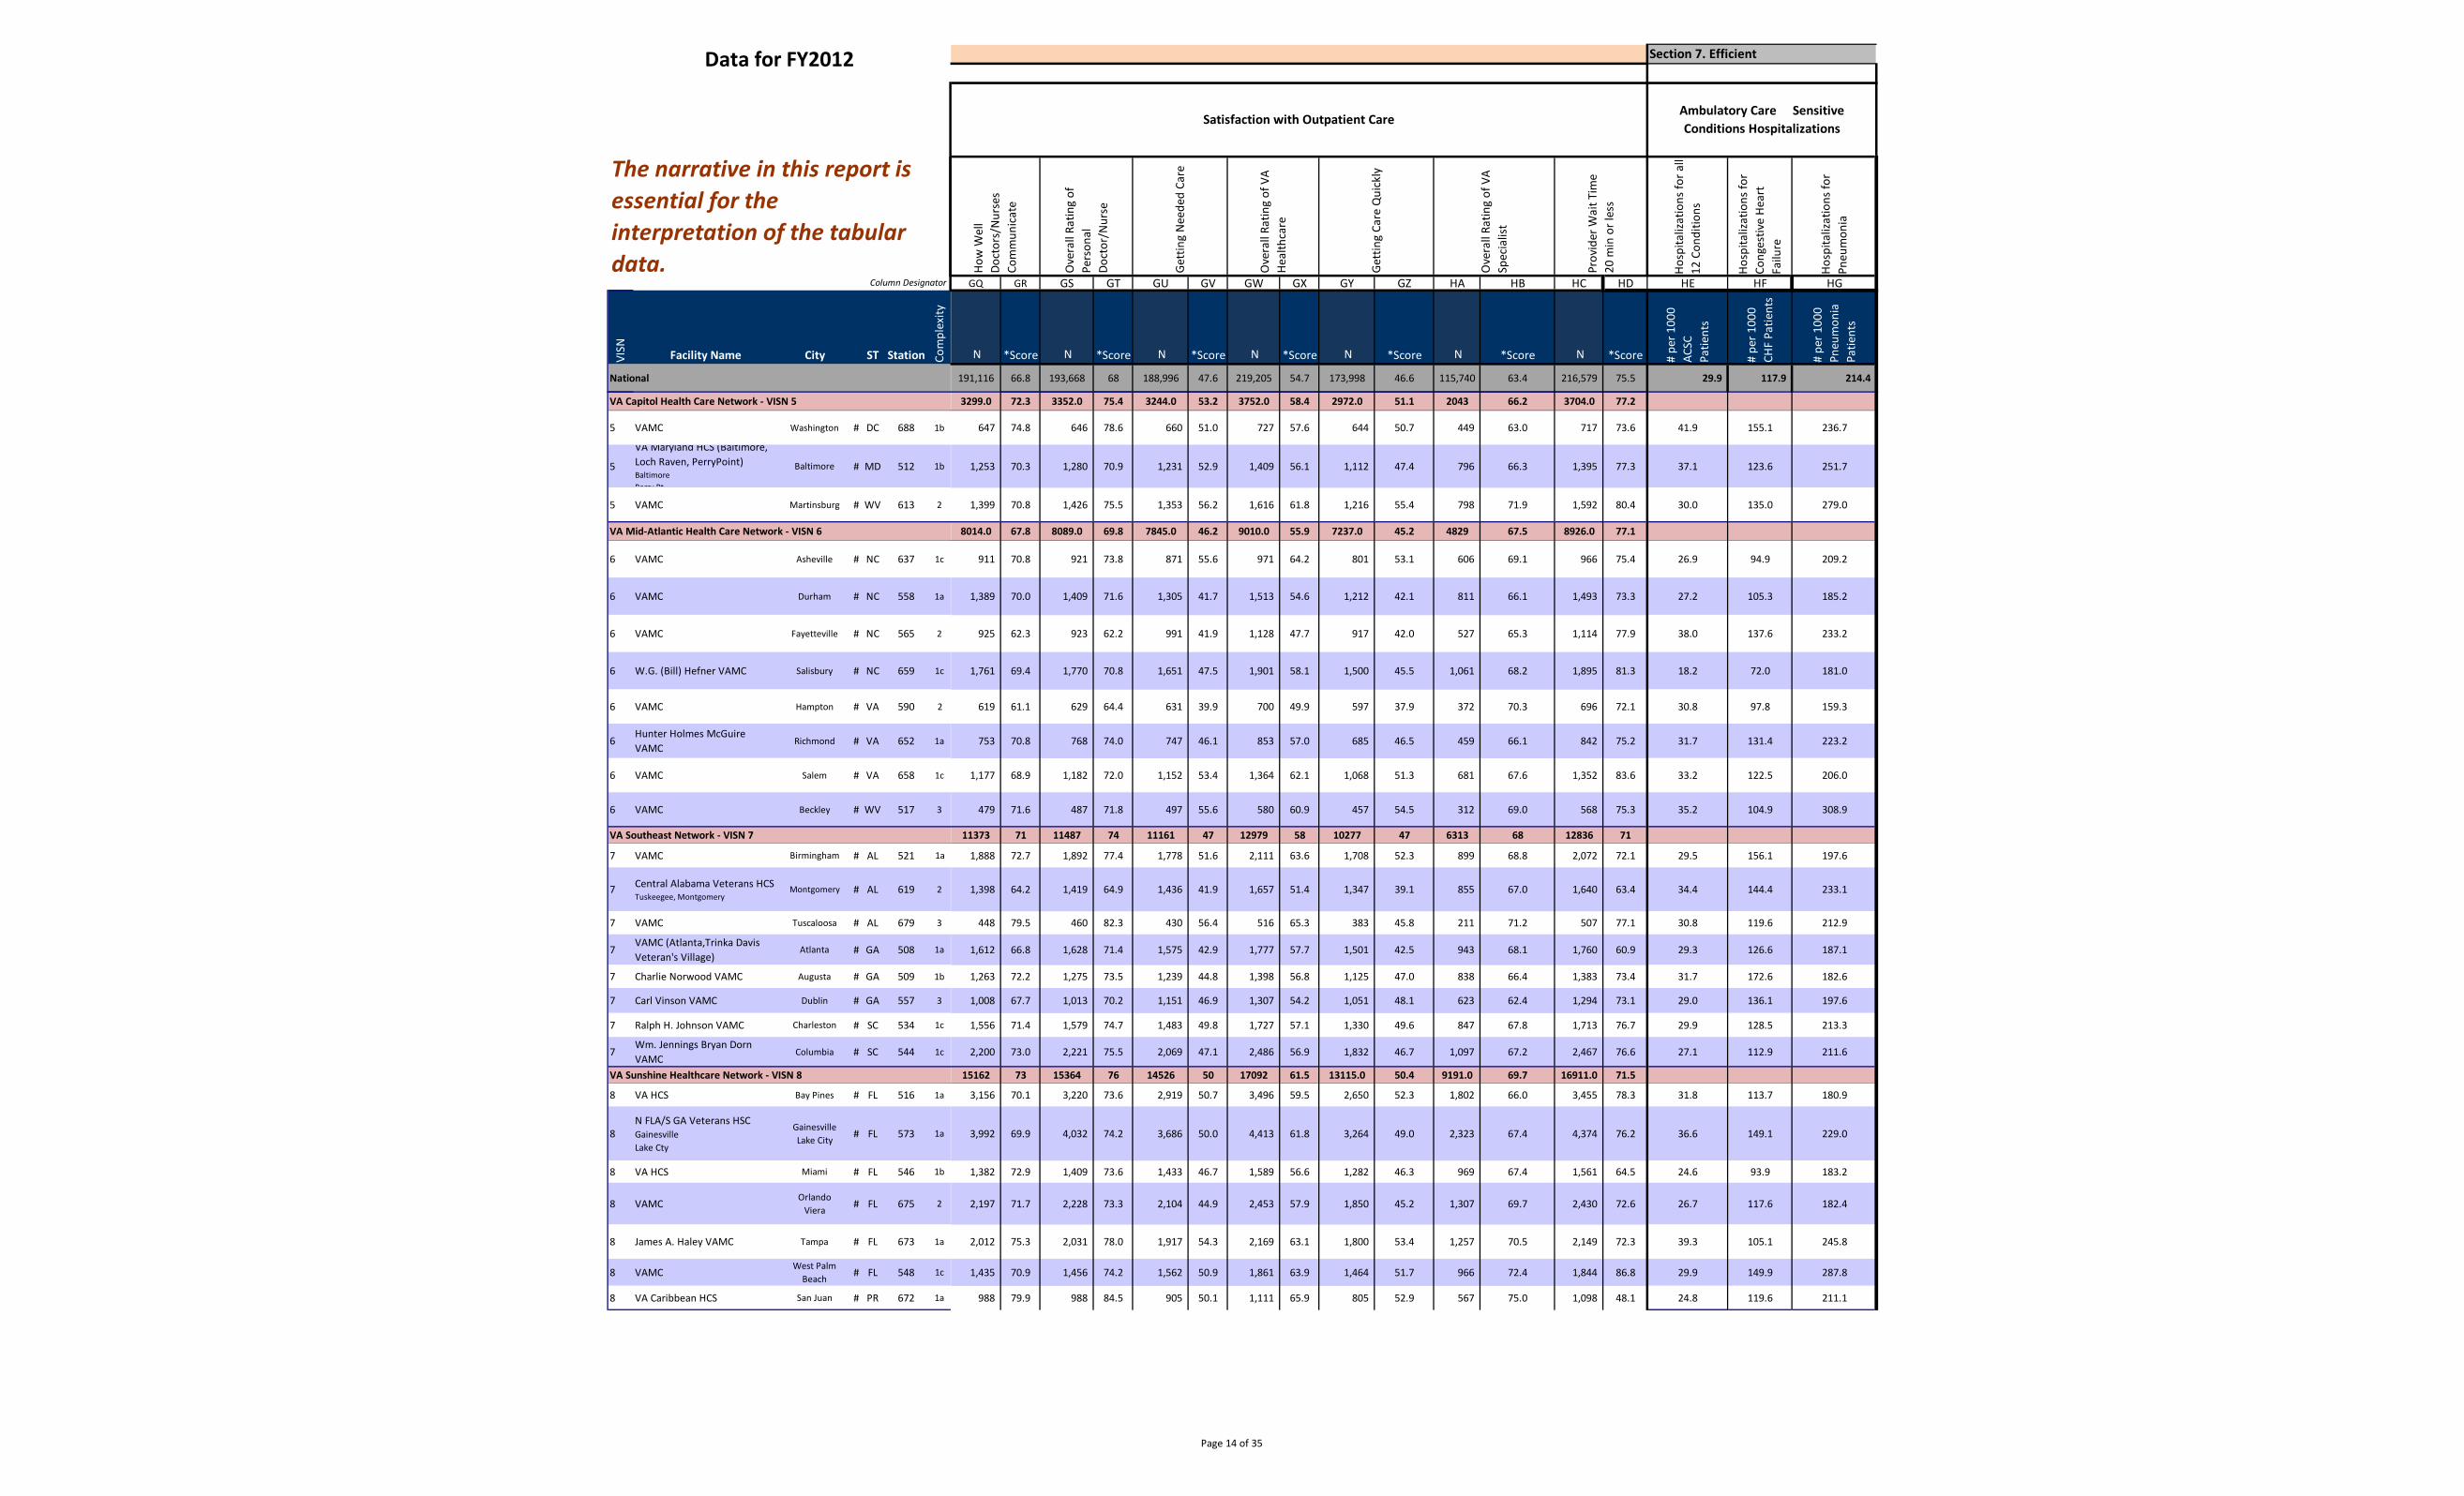
VISN Facility Name City ST Station Com
plex
ity
National
Data for FY2012
Column Designator
The narrative in this report is essential for the interpretation of the tabular data.
VA Capitol Health Care Network - VISN 5
5 VAMC Washington # DC 688 1b
5
VA Maryland HCS (Baltimore, Loch Raven, PerryPoint) Baltimore Perry Pt
Baltimore # MD 512 1b
5 VAMC Martinsburg # WV 613 2
VA Mid-Atlantic Health Care Network - VISN 6
6 VAMC Asheville # NC 637 1c
6 VAMC Durham # NC 558 1a
6 VAMC Fayetteville # NC 565 2
6 W.G. (Bill) Hefner VAMC Salisbury # NC 659 1c
6 VAMC Hampton # VA 590 2
6 Hunter Holmes McGuire VAMC
Richmond # VA 652 1a
6 VAMC Salem # VA 658 1c
6 VAMC Beckley # WV 517 3
VA Southeast Network - VISN 7
7 VAMC Birmingham # AL 521 1a
7 Central Alabama Veterans HCS Tuskeegee, Montgomery
Montgomery # AL 619 2
7 VAMC Tuscaloosa # AL 679 3
7 VAMC (Atlanta,Trinka Davis Veteran's Village)
Atlanta # GA 508 1a
7 Charlie Norwood VAMC Augusta # GA 509 1b
7 Carl Vinson VAMC Dublin # GA 557 3
7 Ralph H. Johnson VAMC Charleston # SC 534 1c
7 Wm. Jennings Bryan Dorn VAMC
Columbia # SC 544 1c
VA Sunshine Healthcare Network - VISN 8
8 VA HCS Bay Pines # FL 516 1a
8 N FLA/S GA Veterans HSC Gainesville Lake Cty
Gainesville Lake City # FL 573 1a
8 VA HCS Miami # FL 546 1b
8 VAMC Orlando Viera # FL 675 2
8 James A. Haley VAMC Tampa # FL 673 1a
8 VAMC West Palm Beach # FL 548 1c
8 VA Caribbean HCS San Juan # PR 672 1a
Hosp
italiz
atio
ns fo
r all
12 C
ondi
tions
Hosp
italiz
atio
ns fo
rCo
nges
tive
Hear
t Fa
ilure
Hosp
italiz
atio
ns fo
rPn
eum
onia
GQ GR GS GT GU GV GW GX GY GZ HA HB HC HD HE HF HG
N *Score N *Score N *Score N *Score N *Score N *Score N *Score # pe
r 100
0 AC
SC
Patie
nts
# pe
r 100
0 CH
F Pa
tient
s
# pe
r 100
0 Pn
eum
onia
Patie
nts
191,116 66.8 193,668 68 188,996 47.6 219,205 54.7 173,998 46.6 115,740 63.4 216,579 75.5 29.9 117.9 214.4
Ambulatory Care Sensitive Conditions Hospitalizations
Prov
ider
Wai
t Tim
e20
min
or l
ess
How
Wel
l Do
ctor
s/N
urse
s Co
mm
unic
ate
Ove
rall
Ratin
g of
Pers
onal
Doct
or/N
urse
Gett
ing
Nee
ded
Care
Ove
rall
Ratin
g of
VA
Heal
thca
re
Gett
ing
Care
Qui
ckly
Satisfaction with Outpatient Care
Section 7. Efficient
Ove
rall
Ratin
g of
VA
Spec
ialis
t
3299.0 72.3 3352.0 75.4 3244.0 53.2 3752.0 58.4 2972.0 51.1 2043 66.2 3704.0 77.2
647 74.8 646 78.6 660 51.0 727 57.6 644 50.7 449 63.0 717 73.6 41.9 155.1 236.7
1,253 70.3 1,280 70.9 1,231 52.9 1,409 56.1 1,112 47.4 796 66.3 1,395 77.3 37.1 123.6 251.7
1,399 70.8 1,426 75.5 1,353 56.2 1,616 61.8 1,216 55.4 798 71.9 1,592 80.4 30.0 135.0 279.0
8014.0 67.8 8089.0 69.8 7845.0 46.2 9010.0 55.9 7237.0 45.2 4829 67.5 8926.0 77.1
911 70.8 921 73.8 871 55.6 971 64.2 801 53.1 606 69.1 966 75.4 26.9 94.9 209.2
1,389 70.0 1,409 71.6 1,305 41.7 1,513 54.6 1,212 42.1 811 66.1 1,493 73.3 27.2 105.3 185.2
925 62.3 923 62.2 991 41.9 1,128 47.7 917 42.0 527 65.3 1,114 77.9 38.0 137.6 233.2
1,761 69.4 1,770 70.8 1,651 47.5 1,901 58.1 1,500 45.5 1,061 68.2 1,895 81.3 18.2 72.0 181.0
619 61.1 629 64.4 631 39.9 700 49.9 597 37.9 372 70.3 696 72.1 30.8 97.8 159.3
753 70.8 768 74.0 747 46.1 853 57.0 685 46.5 459 66.1 842 75.2 31.7 131.4 223.2
1,177 68.9 1,182 72.0 1,152 53.4 1,364 62.1 1,068 51.3 681 67.6 1,352 83.6 33.2 122.5 206.0
479 71.6 487 71.8 497 55.6 580 60.9 457 54.5 312 69.0 568 75.3 35.2 104.9 308.9
11373 71 11487 74 11161 47 12979 58 10277 47 6313 68 12836 71
1,888 72.7 1,892 77.4 1,778 51.6 2,111 63.6 1,708 52.3 899 68.8 2,072 72.1 29.5 156.1 197.6
1,398 64.2 1,419 64.9 1,436 41.9 1,657 51.4 1,347 39.1 855 67.0 1,640 63.4 34.4 144.4 233.1
448 79.5 460 82.3 430 56.4 516 65.3 383 45.8 211 71.2 507 77.1 30.8 119.6 212.9
1,612 66.8 1,628 71.4 1,575 42.9 1,777 57.7 1,501 42.5 943 68.1 1,760 60.9 29.3 126.6 187.1
1,263 72.2 1,275 73.5 1,239 44.8 1,398 56.8 1,125 47.0 838 66.4 1,383 73.4 31.7 172.6 182.6
1,008 67.7 1,013 70.2 1,151 46.9 1,307 54.2 1,051 48.1 623 62.4 1,294 73.1 29.0 136.1 197.6
1,556 71.4 1,579 74.7 1,483 49.8 1,727 57.1 1,330 49.6 847 67.8 1,713 76.7 29.9 128.5 213.3
2,200 73.0 2,221 75.5 2,069 47.1 2,486 56.9 1,832 46.7 1,097 67.2 2,467 76.6 27.1 112.9 211.6
15162 73 15364 76 14526 50 17092 61.5 13115.0 50.4 9191.0 69.7 16911.0 71.5
3,156 70.1 3,220 73.6 2,919 50.7 3,496 59.5 2,650 52.3 1,802 66.0 3,455 78.3 31.8 113.7 180.9
3,992 69.9 4,032 74.2 3,686 50.0 4,413 61.8 3,264 49.0 2,323 67.4 4,374 76.2 36.6 149.1 229.0
1,382 72.9 1,409 73.6 1,433 46.7 1,589 56.6 1,282 46.3 969 67.4 1,561 64.5 24.6 93.9 183.2
2,197 71.7 2,228 73.3 2,104 44.9 2,453 57.9 1,850 45.2 1,307 69.7 2,430 72.6 26.7 117.6 182.4
2,012 75.3 2,031 78.0 1,917 54.3 2,169 63.1 1,800 53.4 1,257 70.5 2,149 72.3 39.3 105.1 245.8
1,435 70.9 1,456 74.2 1,562 50.9 1,861 63.9 1,464 51.7 966 72.4 1,844 86.8 29.9 149.9 287.8
988 79.9 988 84.5 905 50.1 1,111 65.9 805 52.9 567 75.0 1,098 48.1 24.8 119.6 211.1
Page 14 of 35

Data for FY2012
Column Designator
The narrative in this report is essential for the interpretation of the tabular data.
Section l: Services, Staffing, Treatment Volumes and Accreditation Utilization Outpatient Medical Procedures
Available In-House Services Acute Inpatient: Medical/Surgical
Acute Inpatient: Mental Health
Visits Inpatient and Outpatient Medical Procedures
Acut
eM
edic
al/S
urgi
cal
Acut
e M
enta
l Hea
lth
Inte
nsiv
e Ca
re U
nit
Emer
genc
y De
pt
Urg
ent C
are
Clin
ics
Com
mun
ity L
ivin
gCe
nter
Spin
al C
ord
Inju
ry &
Diso
rder
s Uni
t
Poly
trau
ma
syst
em
Dom
icila
ry C
are
Med
ical
/Sur
gica
l Ho
spita
l Disc
harg
es
Med
ical
/Sur
gica
lHo
spita
l Disc
harg
es
Med
ical
/Sur
gica
l LO
S
Bed
Day
s of C
are
Faci
lity
Uni
que
Patie
nts
Men
tal H
ealth
Hosp
ital D
ischa
rges
Uni
que
Men
tal H
ealth
Ho
spita
l Disc
harg
es
Men
tal H
ealth
LO
S
Men
tal H
ealth
Bed
Days
of C
are
Prim
ary
Care
Out
patie
nt V
isits
Spe
cial
ty C
are
Out
patie
nt V
isits
Upp
er G
I
Col
onos
copy
Sig
moi
dosc
opy
Bro
ncho
scop
y
EN
T En
dosc
opy
Coro
nary
Angi
ogra
phy
Perc
utan
eous
Coro
nary
Inte
rven
tion
A B C D E F G H I J K L M N O P Q R S T U V W X Y Z AA
VISN Facility Name City ST Station Com
plex
ity
yes/
no
yes/
no
yes/
no
yes/
no
yes/
no
yes/
no
yes/
no
Type
yes/
no
# #/1
000
Uni
que
Patie
nts
Avg
# Da
ys
#/1
000
Uni
que
Patie
nts
# U
niqu
ePa
tient
s
# #/10
00
Uni
que
Patie
nts
# Da
ys
#/1
000
Uni
que
Patie
nts
# # # # # # # # #
National 492,506 83.3 5.2 433.7 5,911,885 87,124 14.7 8.5 124.7 12,680,472 37,926,203 113,853 234,265 12,587 11,744 79,383 40,031 13,207
VA Mid South Healthcare Network - VISN 9
9 VAMC Lexington # KY 596 1c Yes Yes Yes Yes No Yes No PNS Yes 4,171 112.4 4.2 475 37,124 940 25.3 5.7 145 68,391 215,520 572 1,495 45 94 155 420 253
9 VAMC Louisville # KY 603 1c Yes Yes Yes Yes No No No PSCT Yes 4,488 98.5 4.7 464 45,586 841 18.4 6.5 120 97,797 232,702 1,366 2,304 42 130 404 518 114
9 VAMC Memphis # TN 614 1a Yes Yes Yes Yes No No Yes PSCT Yes 4,810 73.1 6.4 468 65,778 799 12.1 11.3 138 99,454 358,298 912 1,452 59 194 377 807 166
9 VAMC Mountain Home # TN 621 1c Yes Yes Yes Yes No Yes No PSCT Yes 4,653 86.2 4.6 395 53,984 922 17.1 7.6 130 116,451 290,336 949 2,022 38 58 150 318 -
9 Tennessee Valley HCS Nashville Murfreesboro
Nashville # TN 626 1a Yes Yes Yes Yes Yes Yes No PSCT No 7,966 93.1 5.9 550 85,532 2,158 25.2 10.2 258 142,495 467,146 1,454 3,604 160 233 975 1,061 391
9 VAMC Huntington # WV 581 2 Yes No Yes Yes No No No PSCT No 3,983 135.6 4.3 580 29,380 - - - - 68,705 173,913 558 1,389 56 102 112 244 -
VA Health Care System of Ohio - VISN 10
10 VAMC Chillicothe # OH 538 2 No Yes No No Yes Yes No PPOC Yes 1,920 87.7 4.0 352 21,899 1,238 56.5 6.4 363 45,831 153,222 270 642 10 11 - - -
10 VAMC Cincinnati # OH 539 1b Yes Yes Yes Yes Yes Yes No PSCT Yes 5,365 128.7 4.5 577 41,685 887 21.3 7.5 159 73,442 361,479 785 1,696 46 137 581 358 129
10 Louis Stokes VAMC Cleveland, Brecksville
Cleveland # OH 541 1a Yes Yes Yes Yes No Yes Yes PNS Yes 8,172 76.7 5.4 416 106,563 680 6.4 13.9 89 270,654 601,539 1,455 1,974 149 265 1,832 914 270
10 Chalmers P. Wylie Outpt Clinic
Columbus # OH 757 3 No No No No Yes No No PPOC No - - - - 39,317 - - - - 79,769 237,712 634 1,587 29 13 148 - -
10 VAMC Dayton # OH 552 1c Yes Yes Yes Yes Yes Yes No PSCT Yes 4,193 108.9 4.1 449 38,498 1,115 29.0 6.2 178 72,032 280,833 860 1,540 57 55 448 525 165
Veterans In Partnership - VISN 11
11 VA Illiana HCS Danville # IL 550 2 Yes Yes Yes Yes No Yes No PSCT Yes 1,143 33.1 3.8 127 34,536 50 1.4 4.9 7 73,534 139,659 414 607 37 13 - - -
11 VA Northern Indiana HCS‡ Marion, Ft Wayne
Marion # IN 610 2 Yes Yes Yes Yes Yes Yes No PPOC Yes 1,694 37.9 24.8 942 44,654 441 9.9 6.4 63 86,894 150,830 748 1,444 64 45 88 - -
11 Richard L. Roudebush VAMC Indianapolis # IN 583 1a Yes Yes Yes Yes No No No PNS Yes 6,936 112.7 4.9 551 61,518 592 9.6 6.3 60 103,149 350,740 1,725 3,043 55 228 1,531 725 371
11 VA Ann Arbor HCS Ann Arbor # MI 506 1b Yes Yes Yes Yes No Yes No PSCT No 4,978 87.2 5.1 441 57,091 556 9.7 11.3 110 86,708 292,765 1,607 3,390 147 257 1,543 684 221
11 VAMC Battle Creek # MI 515 3 No Yes No No Yes Yes No PPOC Yes 632 15.6 6.1 95 40,561 420 10.4 4.6 48 79,232 197,860 - - - - - - -
11 John D. Dingell VAMC Detroit # MI 553 1b Yes Yes Yes Yes Yes Yes No PSCT Yes 3,965 82.6 4.9 406 48,024 942 19.6 5.8 113 62,214 302,162 531 1,736 62 85 467 324 -
11 Aleda E. Lutz VAMC Saginaw # MI 655 3 No No No No Yes Yes No PPOC No 770 23.8 3.0 72 32,396 - - - - 65,706 150,499 464 919 9 - - - -
The Great Lakes Health Care System - VISN 12
12 Jessie Brown VAMC Chicago # IL 537 1b Yes Yes Yes Yes Yes Yes No PSCT Yes 5,753 127.7 4.9 623 45,037 1,102 24.5 9.6 235 77,658 417,059 826 2,165 110 57 195 404 154
12 Edward Hines Jr. VA Hospital Hines # IL 578 1a Yes Yes Yes Yes No Yes Yes PNS Yes 6,199 109.2 5.5 604 56,746 1,061 18.7 7.5 141 112,708 395,843 957 1,759 74 95 1,190 516 269
12 Captain James A Lovell FHCC North Chicago # IL 556 Excl Yes Yes Yes Yes No Yes No PSCT Yes 2,155 44.3 4.5 201 48,654 693 14.2 4.8 69 48,573 232,984 386 902 35 29 360 - -
12 VAMC Iron Mountain # MI 585 3 No No Yes Yes Yes Yes No PPOC No 825 41.2 4.0 167 20,024 - - - - 43,053 73,788 226 565 84 - 97 - -
12 William S. Middleton Memorial Veterans Hospital
Madison # WI 607 1b Yes Yes Yes Yes No Yes No PSCT Yes 3,949 98.0 5.5 536 40,315 670 16.6 5.3 88 49,217 207,774 841 1,133 160 163 153 317 104
12 Clement J. Zablocki VAMC Milwaukee # WI 695 1a Yes Yes Yes Yes No Yes Yes PSCT Yes 5,359 85.8 4.9 424 62,479 1,139 18.2 7.3 133 121,579 445,130 1,064 2,189 105 176 1,201 569 121
12 VAMC Tomah # WI 676 3 No Yes No No Yes Yes No PSCT Yes 529 20.1 3.2 65 26,265 469 17.9 5.0 90 44,654 123,181 - - - - - - -
Page 15 of 35
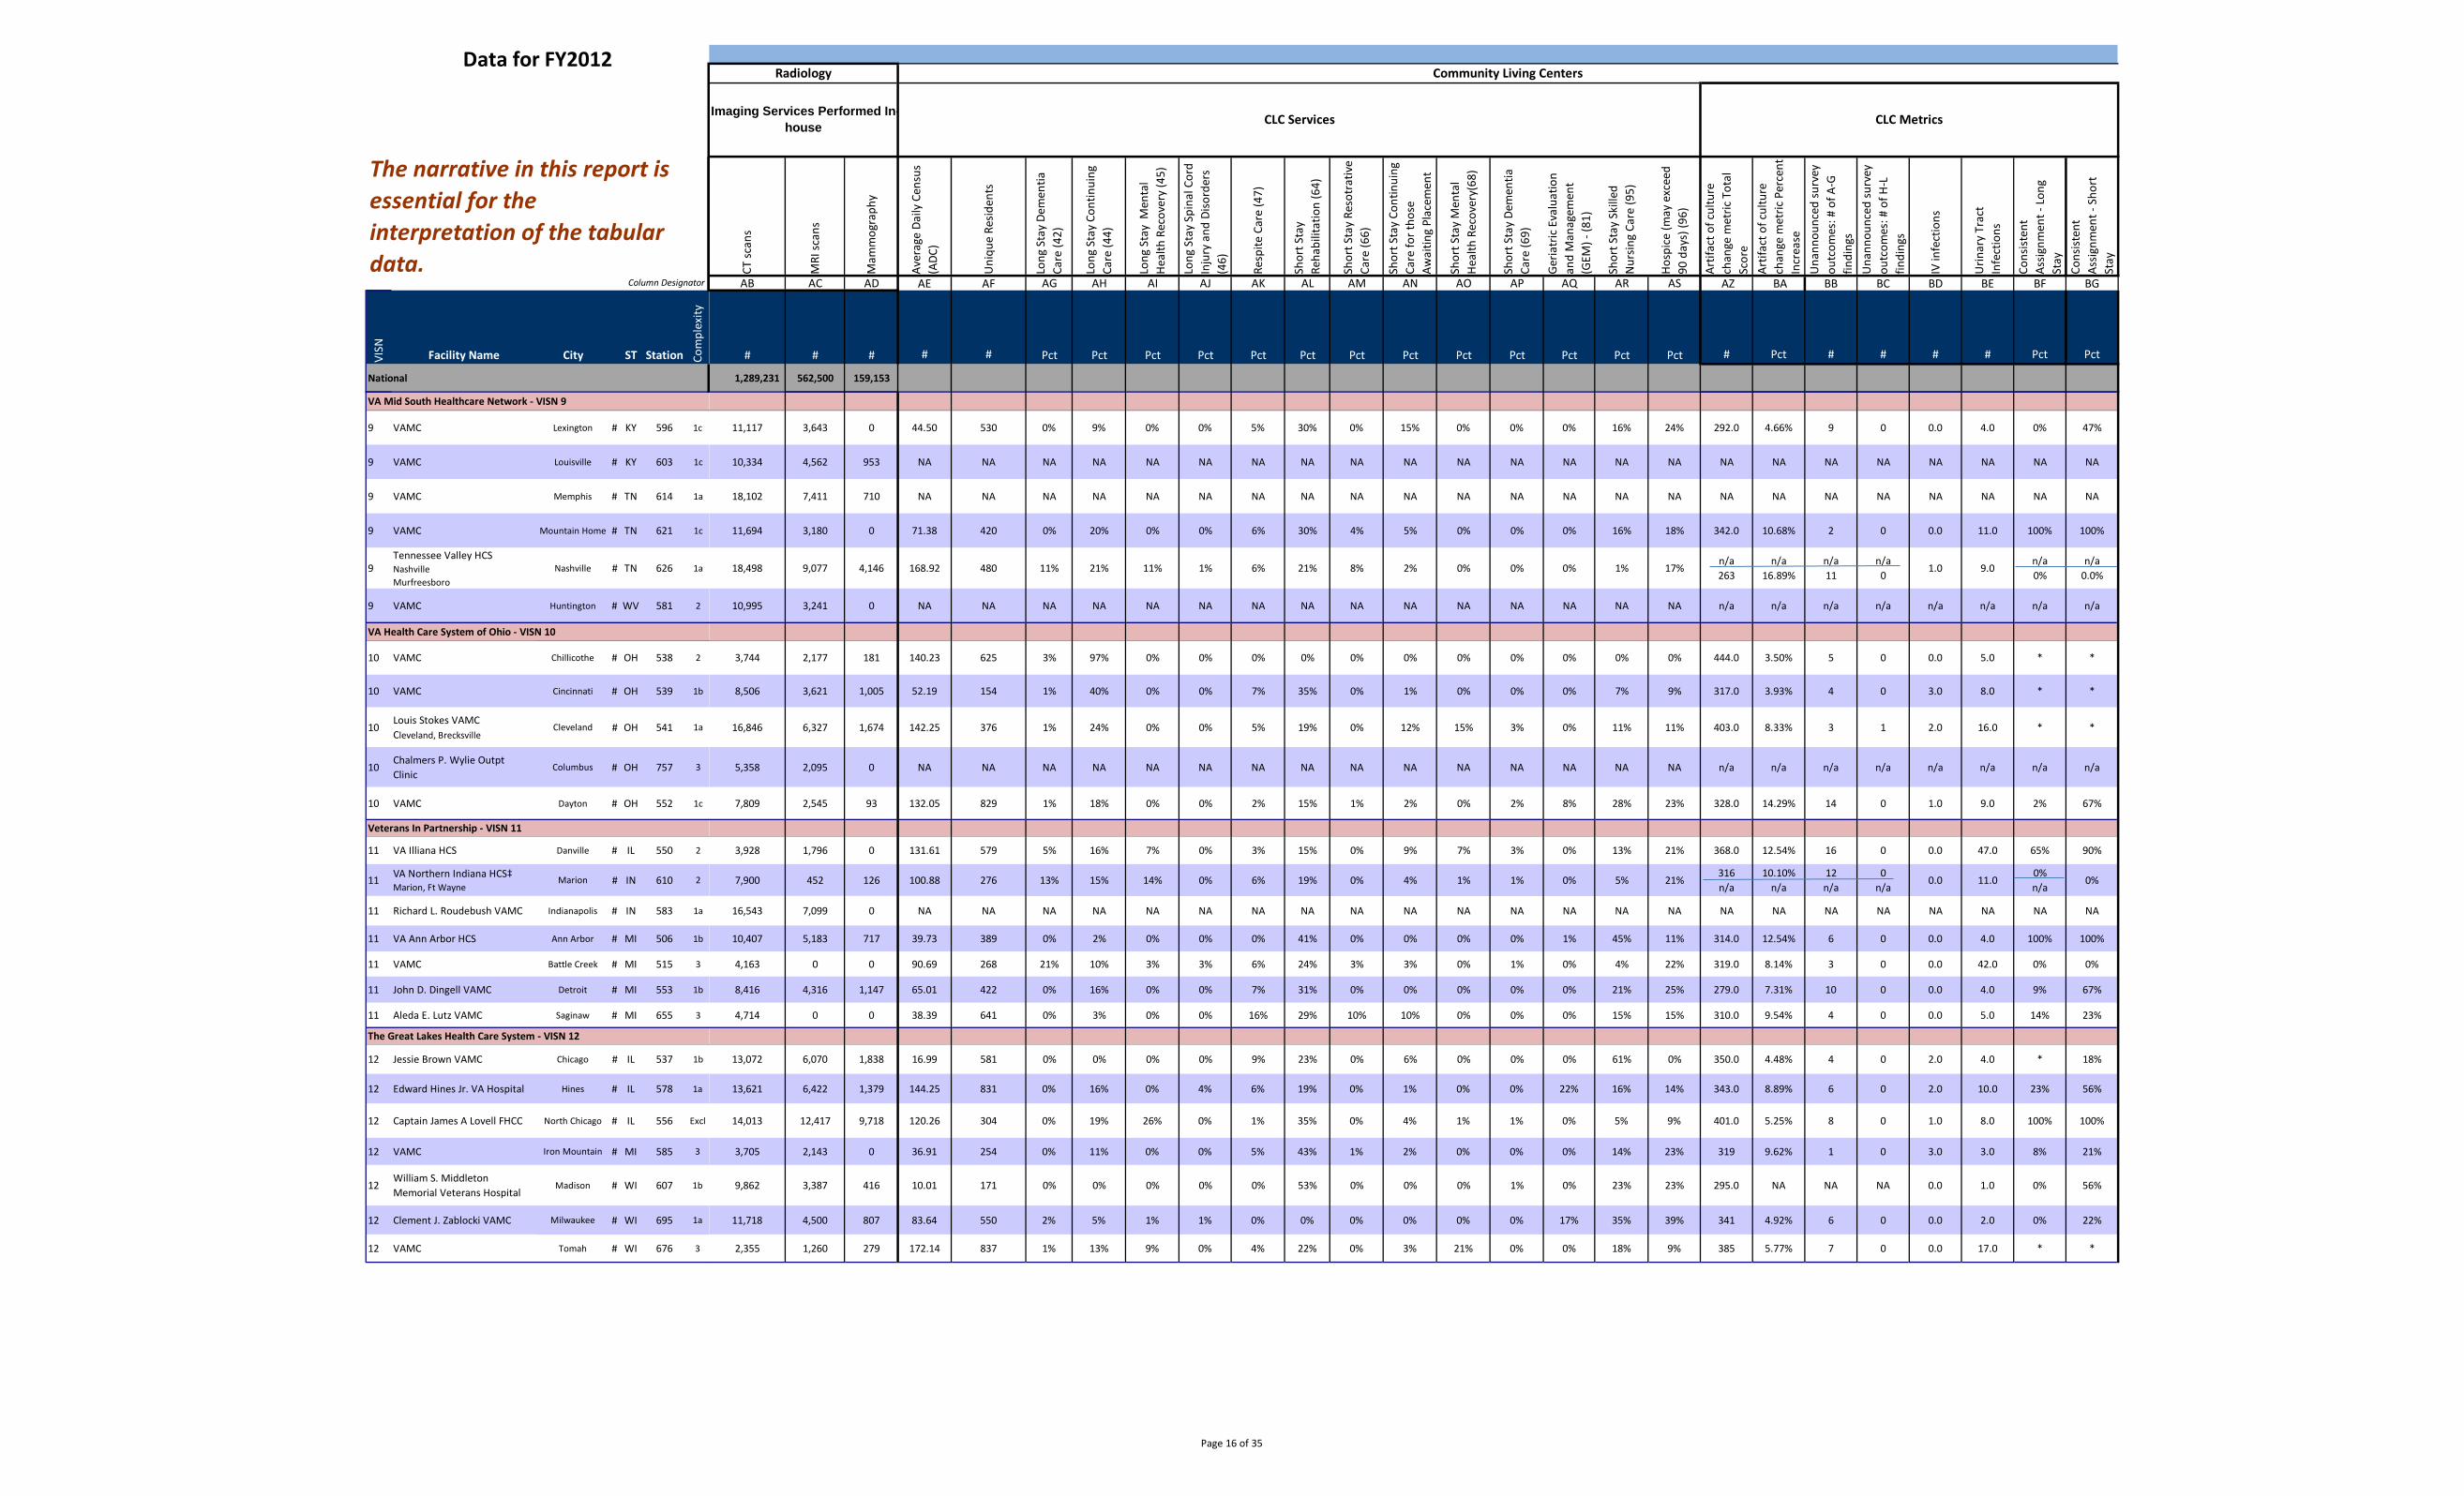
VISN Facility Name City ST Station Com
plex
ity
National
Data for FY2012
Column Designator
The narrative in this report is essential for the interpretation of the tabular data.
VA Mid South Healthcare Network - VISN 9
9 VAMC Lexington # KY 596 1c
9 VAMC Louisville # KY 603 1c
9 VAMC Memphis # TN 614 1a
9 VAMC Mountain Home # TN 621 1c
9 Tennessee Valley HCS Nashville Murfreesboro
Nashville # TN 626 1a
9 VAMC Huntington # WV 581 2
VA Health Care System of Ohio - VISN 10
10 VAMC Chillicothe # OH 538 2
10 VAMC Cincinnati # OH 539 1b
10 Louis Stokes VAMC Cleveland, Brecksville
Cleveland # OH 541 1a
10 Chalmers P. Wylie Outpt Clinic
Columbus # OH 757 3
10 VAMC Dayton # OH 552 1c
Veterans In Partnership - VISN 11
11 VA Illiana HCS Danville # IL 550 2
11 VA Northern Indiana HCS‡ Marion, Ft Wayne
Marion # IN 610 2
11 Richard L. Roudebush VAMC Indianapolis # IN 583 1a
11 VA Ann Arbor HCS Ann Arbor # MI 506 1b
11 VAMC Battle Creek # MI 515 3
11 John D. Dingell VAMC Detroit # MI 553 1b
11 Aleda E. Lutz VAMC Saginaw # MI 655 3
The Great Lakes Health Care System - VISN 12
12 Jessie Brown VAMC Chicago # IL 537 1b
12 Edward Hines Jr. VA Hospital Hines # IL 578 1a
12 Captain James A Lovell FHCC North Chicago # IL 556 Excl
12 VAMC Iron Mountain # MI 585 3
12 William S. Middleton Memorial Veterans Hospital
Madison # WI 607 1b
12 Clement J. Zablocki VAMC Milwaukee # WI 695 1a
12 VAMC Tomah # WI 676 3
CT s
cans
MRI
scan
s
Mam
mog
raph
y
Aver
age
Daily
Cen
sus
(ADC
)
Uni
que
Resid
ents
Long
Sta
y De
men
tiaCa
re (4
2)
Long
Sta
y Co
ntin
uing
Care
(44)
Long
Sta
y M
enta
lHe
alth
Rec
over
y (4
5)
Long
Sta
y Sp
inal
Cor
d In
jury
and
Diso
rder
s(4
6)
Resp
ite C
are
(47)
Shor
t Sta
yRe
habi
litat
ion
(64)
Shor
t Sta
y Re
sotr
ativ
eCa
re (6
6)
Shor
t Sta
y Co
ntin
uing
Care
for t
hose
Awai
ting
Plac
emen
t
Shor
t Sta
y M
enta
lHe
alth
Rec
over
y(68
)
Shor
t Sta
y De
men
tiaCa
re (6
9)
Geria
tric
Eva
luat
ion
and
Man
agem
ent
(GEM
) - (8
1)
Shor
t Sta
y Sk
illed
Nur
sing
Care
(95)
Hosp
ice
(may
exc
eed
90 d
ays)
(96)
Artif
act o
f cul
ture
chan
ge m
etric
Tot
alSc
ore
Artif
act o
f cul
ture
chan
ge m
etric
Per
cent
In
crea
seU
nann
ounc
ed su
rvey
outc
omes
: # o
f A-G
findi
ngs
Una
nnou
nced
surv
eyou
tcom
es: #
of H
-Lfin
ding
s
IV in
fect
ions
Urin
ary
Trac
tIn
fect
ions
Cons
isten
t As
signm
ent -
Lon
gSt
ayCo
nsist
ent
Assig
nmen
t -Sh
ort
Stay
AB AC AD AE AF AG AH AI AJ AK AL AM AN AO AP AQ AR AS AZ BA BB BC BD BE BF BG
# # # # # Pct Pct Pct Pct Pct Pct Pct Pct Pct Pct Pct Pct Pct # Pct # # # # Pct Pct
1,289,231 562,500 159,153
CLC Services
Radiology Community Living Centers
CLC Metrics Imaging Services Performed In-house
11,117 3,643 0 44.50 530 0% 9% 0% 0% 5% 30% 0% 15% 0% 0% 0% 16% 24% 292.0 4.66% 9 0 0.0 4.0 0% 47%
10,334 4,562 953 NA NA NA NA NA NA NA NA NA NA NA NA NA NA NA NA NA NA NA NA NA NA NA
18,102 7,411 710 NA NA NA NA NA NA NA NA NA NA NA NA NA NA NA NA NA NA NA NA NA NA NA
11,694 3,180 0 71.38 420 0% 20% 0% 0% 6% 30% 4% 5% 0% 0% 0% 16% 18% 342.0 10.68% 2 0 0.0 11.0 100% 100%
18,498 9,077 4,146 168.92 480 11% 21% 11% 1% 6% 21% 8% 2% 0% 0% 0% 1% 17% n/a 263
n/a 16.89%
n/a 11
n/a 0
1.0 9.0 n/a 0%
n/a 0.0%
10,995 3,241 0 NA NA NA NA NA NA NA NA NA NA NA NA NA NA NA n/a n/a n/a n/a n/a n/a n/a n/a
3,744 2,177 181 140.23 625 3% 97% 0% 0% 0% 0% 0% 0% 0% 0% 0% 0% 0% 444.0 3.50% 5 0 0.0 5.0 * *
8,506 3,621 1,005 52.19 154 1% 40% 0% 0% 7% 35% 0% 1% 0% 0% 0% 7% 9% 317.0 3.93% 4 0 3.0 8.0 * *
16,846 6,327 1,674 142.25 376 1% 24% 0% 0% 5% 19% 0% 12% 15% 3% 0% 11% 11% 403.0 8.33% 3 1 2.0 16.0 * *
5,358 2,095 0 NA NA NA NA NA NA NA NA NA NA NA NA NA NA NA n/a n/a n/a n/a n/a n/a n/a n/a
7,809 2,545 93 132.05 829 1% 18% 0% 0% 2% 15% 1% 2% 0% 2% 8% 28% 23% 328.0 14.29% 14 0 1.0 9.0 2% 67%
3,928 1,796 0 131.61 579 5% 16% 7% 0% 3% 15% 0% 9% 7% 3% 0% 13% 21% 368.0 12.54% 16 0 0.0 47.0 65% 90%
7,900 452 126 100.88 276 13% 15% 14% 0% 6% 19% 0% 4% 1% 1% 0% 5% 21% 316 n/a
10.10% n/a
12 n/a
0 n/a
0.0 11.0 0% n/a
0%
16,543 7,099 0 NA NA NA NA NA NA NA NA NA NA NA NA NA NA NA NA NA NA NA NA NA NA NA
10,407 5,183 717 39.73 389 0% 2% 0% 0% 0% 41% 0% 0% 0% 0% 1% 45% 11% 314.0 12.54% 6 0 0.0 4.0 100% 100%
4,163 0 0 90.69 268 21% 10% 3% 3% 6% 24% 3% 3% 0% 1% 0% 4% 22% 319.0 8.14% 3 0 0.0 42.0 0% 0%
8,416 4,316 1,147 65.01 422 0% 16% 0% 0% 7% 31% 0% 0% 0% 0% 0% 21% 25% 279.0 7.31% 10 0 0.0 4.0 9% 67%
4,714 0 0 38.39 641 0% 3% 0% 0% 16% 29% 10% 10% 0% 0% 0% 15% 15% 310.0 9.54% 4 0 0.0 5.0 14% 23%
13,072 6,070 1,838 16.99 581 0% 0% 0% 0% 9% 23% 0% 6% 0% 0% 0% 61% 0% 350.0 4.48% 4 0 2.0 4.0 * 18%
13,621 6,422 1,379 144.25 831 0% 16% 0% 4% 6% 19% 0% 1% 0% 0% 22% 16% 14% 343.0 8.89% 6 0 2.0 10.0 23% 56%
14,013 12,417 9,718 120.26 304 0% 19% 26% 0% 1% 35% 0% 4% 1% 1% 0% 5% 9% 401.0 5.25% 8 0 1.0 8.0 100% 100%
3,705 2,143 0 36.91 254 0% 11% 0% 0% 5% 43% 1% 2% 0% 0% 0% 14% 23% 319 9.62% 1 0 3.0 3.0 8% 21%
9,862 3,387 416 10.01 171 0% 0% 0% 0% 0% 53% 0% 0% 0% 1% 0% 23% 23% 295.0 NA NA NA 0.0 1.0 0% 56%
11,718 4,500 807 83.64 550 2% 5% 1% 1% 0% 0% 0% 0% 0% 0% 17% 35% 39% 341 4.92% 6 0 0.0 2.0 0% 22%
2,355 1,260 279 172.14 837 1% 13% 9% 0% 4% 22% 0% 3% 21% 0% 0% 18% 9% 385 5.77% 7 0 0.0 17.0 * *
Page 16 of 35
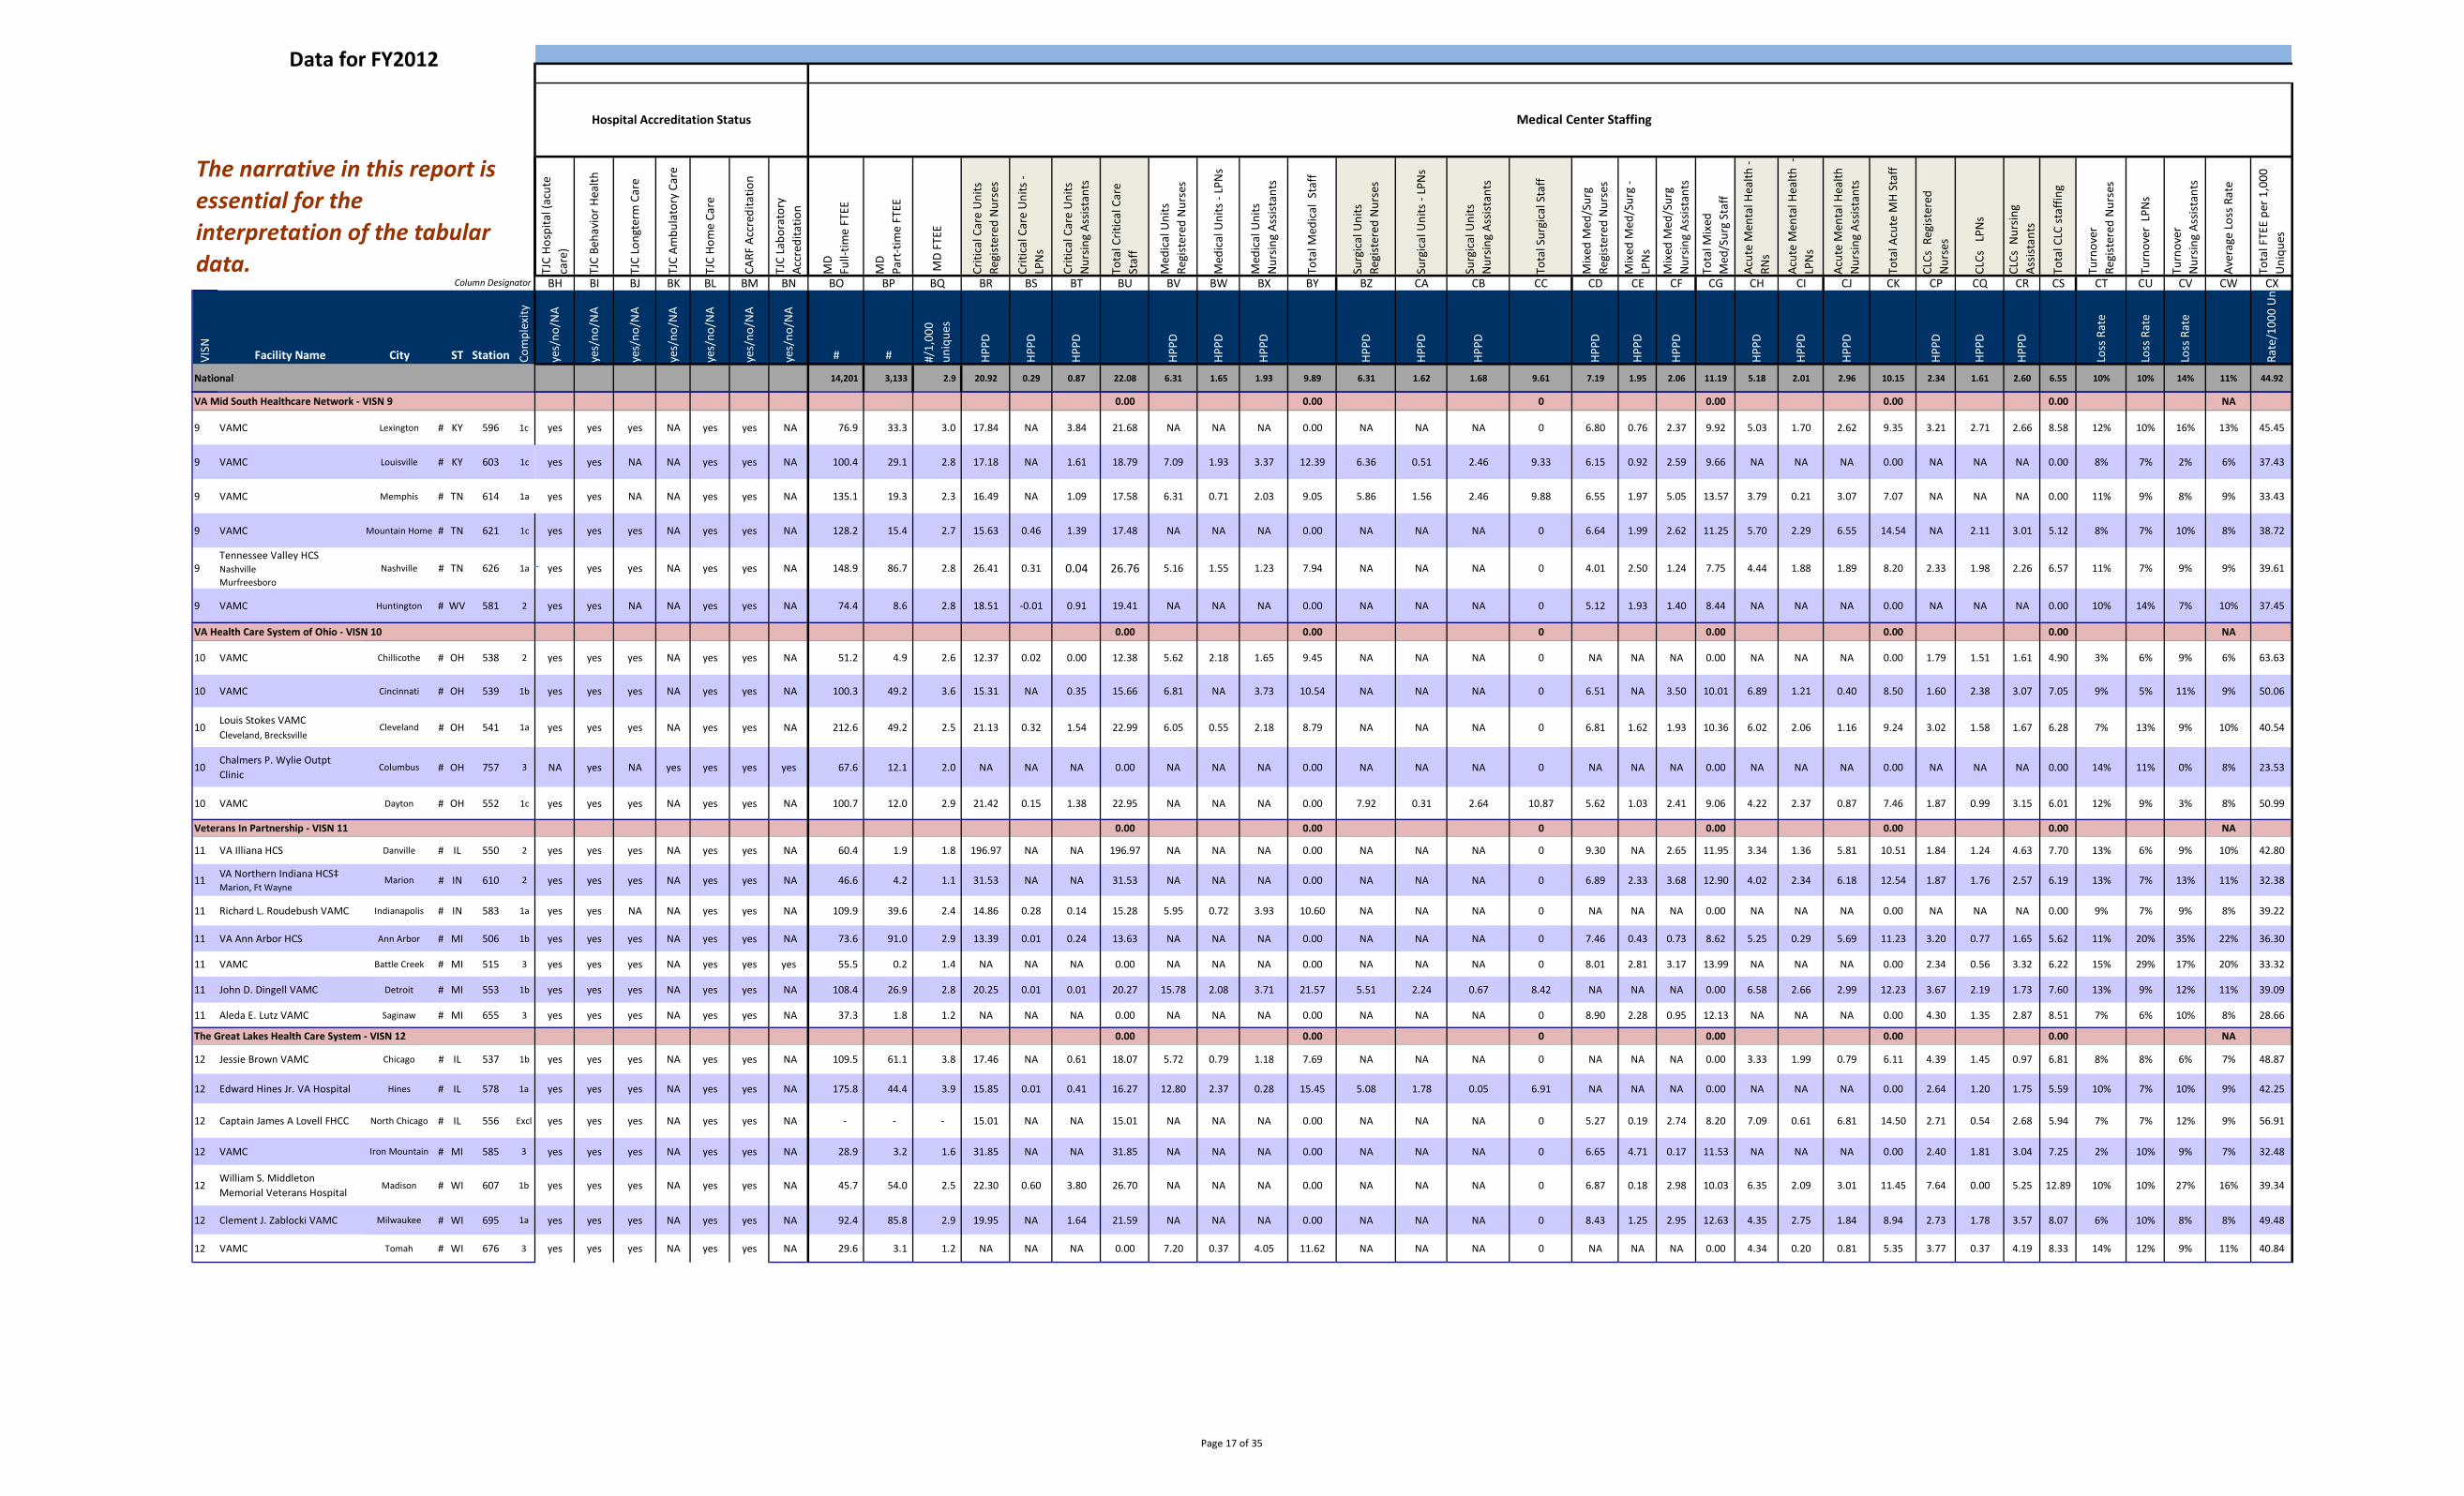
Data for FY2012
Column Designator
The narrative in this report is essential for the interpretation of the tabular data.
Hospital Accreditation Status Medical Center Staffing
TJC
Hosp
ital (
acut
eca
re)
TJC
Beha
vior
Hea
lth
TJC
Long
term
Car
e
TJC
Ambu
lato
ry C
are
TJC
Hom
e Ca
re
CARF
Acc
redi
tatio
n
TJC
Labo
rato
ryAc
cred
itatio
n
MD
Full-
time
FTEE
MD
Part
-tim
e FT
EE
MD
FTEE
Criti
cal C
are
Uni
tsRe
gist
ered
Nur
ses
Criti
cal C
are
Uni
ts -
LPN
s
Criti
cal C
are
Uni
tsN
ursin
g As
sista
nts
Tota
l Crit
ical
Car
eSt
aff
Med
ical
Uni
tsRe
gist
ered
Nur
ses
Med
ical
Uni
ts -
LPN
s
Med
ical
Uni
tsN
ursin
g As
sista
nts
Tota
l Med
ical
Sta
ff
Surg
ical
Uni
tsRe
gist
ered
Nur
ses
Surg
ical
Uni
ts -
LPN
s
Surg
ical
Uni
tsN
ursin
g As
sista
nts
Tota
l Sur
gica
l Sta
ff
Mix
ed M
ed/S
urg
Regi
ster
ed N
urse
s
Mix
ed M
ed/S
urg
-LP
Ns
Mix
ed M
ed/S
urg
Nur
sing
Assis
tant
s
Tota
l Mix
edM
ed/S
urg
Staf
f
Acut
e M
enta
l Hea
lth -
RNs
Acut
e M
enta
l Hea
lth -
LPN
s
Acut
e M
enta
l Hea
lthN
ursin
g As
sista
nts
Tota
l Acu
te M
H St
aff
CLCs
Reg
ister
edN
urse
s
CLCs
LPN
s
CLCs
Nur
sing
Assis
tant
s
Tota
l CLC
staf
fing
Turn
over
Re
gist
ered
Nur
ses
Turn
over
LPN
s
Turn
over
N
ursin
g As
sista
nts
Aver
age
Loss
Rat
e
Tota
l FTE
E pe
r 1,0
00
Uni
ques
BH BI BJ BK BL BM BN BO BP BQ BR BS BT BU BV BW BX BY BZ CA CB CC CD CE CF CG CH CI CJ CK CP CQ CR CS CT CU CV CW CX
VISN Facility Name City ST Station Com
plex
ity
yes/
no/N
A
yes/
no/N
A
yes/
no/N
A
yes/
no/N
A
yes/
no/N
A
yes/
no/N
A
yes/
no/N
A
# # #/1,
000
uniq
ues
HPPD
HPPD
HPPD
HPPD
HPPD
HPPD
HPPD
HPPD
HPPD
HPPD
HPPD
HPPD
HPPD
HPPD
HPPD
HPPD
HPPD
HPPD
Loss
Rat
e
Loss
Rat
e
Loss
Rat
e
Rate
/100
0 U
n
National 14,201 3,133 2.9 20.92 0.29 0.87 22.08 6.31 1.65 1.93 9.89 6.31 1.62 1.68 9.61 7.19 1.95 2.06 11.19 5.18 2.01 2.96 10.15 2.34 1.61 2.60 6.55 10% 10% 14% 11% 44.92
VA Mid South Healthcare Network - VISN 9 0.00 0.00 0 0.00 0.00 0.00 NA
9 VAMC Lexington # KY 596 1c yes yes yes NA yes yes NA 76.9 33.3 3.0 17.84 NA 3.84 21.68 NA NA NA 0.00 NA NA NA 0 6.80 0.76 2.37 9.92 5.03 1.70 2.62 9.35 3.21 2.71 2.66 8.58 12% 10% 16% 13% 45.45
9 VAMC Louisville # KY 603 1c yes yes NA NA yes yes NA 100.4 29.1 2.8 17.18 NA 1.61 18.79 7.09 1.93 3.37 12.39 6.36 0.51 2.46 9.33 6.15 0.92 2.59 9.66 NA NA NA 0.00 NA NA NA 0.00 8% 7% 2% 6% 37.43
9 VAMC Memphis # TN 614 1a yes yes NA NA yes yes NA 135.1 19.3 2.3 16.49 NA 1.09 17.58 6.31 0.71 2.03 9.05 5.86 1.56 2.46 9.88 6.55 1.97 5.05 13.57 3.79 0.21 3.07 7.07 NA NA NA 0.00 11% 9% 8% 9% 33.43
9 VAMC Mountain Home # TN 621 1c yes yes yes NA yes yes NA 128.2 15.4 2.7 15.63 0.46 1.39 17.48 NA NA NA 0.00 NA NA NA 0 6.64 1.99 2.62 11.25 5.70 2.29 6.55 14.54 NA 2.11 3.01 5.12 8% 7% 10% 8% 38.72
9 Tennessee Valley HCS Nashville Murfreesboro
Nashville # TN 626 1a yes yes yes NA yes yes NA 148.9 86.7 2.8 26.41 0.31 0.04 26.76 5.16 1.55 1.23 7.94 NA NA NA 0 4.01 2.50 1.24 7.75 4.44 1.88 1.89 8.20 2.33 1.98 2.26 6.57 11% 7% 9% 9% 39.61
9 VAMC Huntington # WV 581 2 yes yes NA NA yes yes NA 74.4 8.6 2.8 18.51 -0.01 0.91 19.41 NA NA NA 0.00 NA NA NA 0 5.12 1.93 1.40 8.44 NA NA NA 0.00 NA NA NA 0.00 10% 14% 7% 10% 37.45
VA Health Care System of Ohio - VISN 10 0.00 0.00 0 0.00 0.00 0.00 NA
10 VAMC Chillicothe # OH 538 2 yes yes yes NA yes yes NA 51.2 4.9 2.6 12.37 0.02 0.00 12.38 5.62 2.18 1.65 9.45 NA NA NA 0 NA NA NA 0.00 NA NA NA 0.00 1.79 1.51 1.61 4.90 3% 6% 9% 6% 63.63
10 VAMC Cincinnati # OH 539 1b yes yes yes NA yes yes NA 100.3 49.2 3.6 15.31 NA 0.35 15.66 6.81 NA 3.73 10.54 NA NA NA 0 6.51 NA 3.50 10.01 6.89 1.21 0.40 8.50 1.60 2.38 3.07 7.05 9% 5% 11% 9% 50.06
10 Louis Stokes VAMC Cleveland, Brecksville
Cleveland # OH 541 1a yes yes yes NA yes yes NA 212.6 49.2 2.5 21.13 0.32 1.54 22.99 6.05 0.55 2.18 8.79 NA NA NA 0 6.81 1.62 1.93 10.36 6.02 2.06 1.16 9.24 3.02 1.58 1.67 6.28 7% 13% 9% 10% 40.54
10 Chalmers P. Wylie Outpt Clinic
Columbus # OH 757 3 NA yes NA yes yes yes yes 67.6 12.1 2.0 NA NA NA 0.00 NA NA NA 0.00 NA NA NA 0 NA NA NA 0.00 NA NA NA 0.00 NA NA NA 0.00 14% 11% 0% 8% 23.53
10 VAMC Dayton # OH 552 1c yes yes yes NA yes yes NA 100.7 12.0 2.9 21.42 0.15 1.38 22.95 NA NA NA 0.00 7.92 0.31 2.64 10.87 5.62 1.03 2.41 9.06 4.22 2.37 0.87 7.46 1.87 0.99 3.15 6.01 12% 9% 3% 8% 50.99
Veterans In Partnership - VISN 11 0.00 0.00 0 0.00 0.00 0.00 NA
11 VA Illiana HCS Danville # IL 550 2 yes yes yes NA yes yes NA 60.4 1.9 1.8 196.97 NA NA 196.97 NA NA NA 0.00 NA NA NA 0 9.30 NA 2.65 11.95 3.34 1.36 5.81 10.51 1.84 1.24 4.63 7.70 13% 6% 9% 10% 42.80
11 VA Northern Indiana HCS‡ Marion, Ft Wayne
Marion # IN 610 2 yes yes yes NA yes yes NA 46.6 4.2 1.1 31.53 NA NA 31.53 NA NA NA 0.00 NA NA NA 0 6.89 2.33 3.68 12.90 4.02 2.34 6.18 12.54 1.87 1.76 2.57 6.19 13% 7% 13% 11% 32.38
11 Richard L. Roudebush VAMC Indianapolis # IN 583 1a yes yes NA NA yes yes NA 109.9 39.6 2.4 14.86 0.28 0.14 15.28 5.95 0.72 3.93 10.60 NA NA NA 0 NA NA NA 0.00 NA NA NA 0.00 NA NA NA 0.00 9% 7% 9% 8% 39.22
11 VA Ann Arbor HCS Ann Arbor # MI 506 1b yes yes yes NA yes yes NA 73.6 91.0 2.9 13.39 0.01 0.24 13.63 NA NA NA 0.00 NA NA NA 0 7.46 0.43 0.73 8.62 5.25 0.29 5.69 11.23 3.20 0.77 1.65 5.62 11% 20% 35% 22% 36.30
11 VAMC Battle Creek # MI 515 3 yes yes yes NA yes yes yes 55.5 0.2 1.4 NA NA NA 0.00 NA NA NA 0.00 NA NA NA 0 8.01 2.81 3.17 13.99 NA NA NA 0.00 2.34 0.56 3.32 6.22 15% 29% 17% 20% 33.32
11 John D. Dingell VAMC Detroit # MI 553 1b yes yes yes NA yes yes NA 108.4 26.9 2.8 20.25 0.01 0.01 20.27 15.78 2.08 3.71 21.57 5.51 2.24 0.67 8.42 NA NA NA 0.00 6.58 2.66 2.99 12.23 3.67 2.19 1.73 7.60 13% 9% 12% 11% 39.09
11 Aleda E. Lutz VAMC Saginaw # MI 655 3 yes yes yes NA yes yes NA 37.3 1.8 1.2 NA NA NA 0.00 NA NA NA 0.00 NA NA NA 0 8.90 2.28 0.95 12.13 NA NA NA 0.00 4.30 1.35 2.87 8.51 7% 6% 10% 8% 28.66
The Great Lakes Health Care System - VISN 12 0.00 0.00 0 0.00 0.00 0.00 NA
12 Jessie Brown VAMC Chicago # IL 537 1b yes yes yes NA yes yes NA 109.5 61.1 3.8 17.46 NA 0.61 18.07 5.72 0.79 1.18 7.69 NA NA NA 0 NA NA NA 0.00 3.33 1.99 0.79 6.11 4.39 1.45 0.97 6.81 8% 8% 6% 7% 48.87
12 Edward Hines Jr. VA Hospital Hines # IL 578 1a yes yes yes NA yes yes NA 175.8 44.4 3.9 15.85 0.01 0.41 16.27 12.80 2.37 0.28 15.45 5.08 1.78 0.05 6.91 NA NA NA 0.00 NA NA NA 0.00 2.64 1.20 1.75 5.59 10% 7% 10% 9% 42.25
12 Captain James A Lovell FHCC North Chicago # IL 556 Excl yes yes yes NA yes yes NA - - - 15.01 NA NA 15.01 NA NA NA 0.00 NA NA NA 0 5.27 0.19 2.74 8.20 7.09 0.61 6.81 14.50 2.71 0.54 2.68 5.94 7% 7% 12% 9% 56.91
12 VAMC Iron Mountain # MI 585 3 yes yes yes NA yes yes NA 28.9 3.2 1.6 31.85 NA NA 31.85 NA NA NA 0.00 NA NA NA 0 6.65 4.71 0.17 11.53 NA NA NA 0.00 2.40 1.81 3.04 7.25 2% 10% 9% 7% 32.48
12 William S. Middleton Memorial Veterans Hospital
Madison # WI 607 1b yes yes yes NA yes yes NA 45.7 54.0 2.5 22.30 0.60 3.80 26.70 NA NA NA 0.00 NA NA NA 0 6.87 0.18 2.98 10.03 6.35 2.09 3.01 11.45 7.64 0.00 5.25 12.89 10% 10% 27% 16% 39.34
12 Clement J. Zablocki VAMC Milwaukee # WI 695 1a yes yes yes NA yes yes NA 92.4 85.8 2.9 19.95 NA 1.64 21.59 NA NA NA 0.00 NA NA NA 0 8.43 1.25 2.95 12.63 4.35 2.75 1.84 8.94 2.73 1.78 3.57 8.07 6% 10% 8% 8% 49.48
12 VAMC Tomah # WI 676 3 yes yes yes NA yes yes NA 29.6 3.1 1.2 NA NA NA 0.00 7.20 0.37 4.05 11.62 NA NA NA 0 NA NA NA 0.00 4.34 0.20 0.81 5.35 3.77 0.37 4.19 8.33 14% 12% 9% 11% 40.84
Page 17 of 35
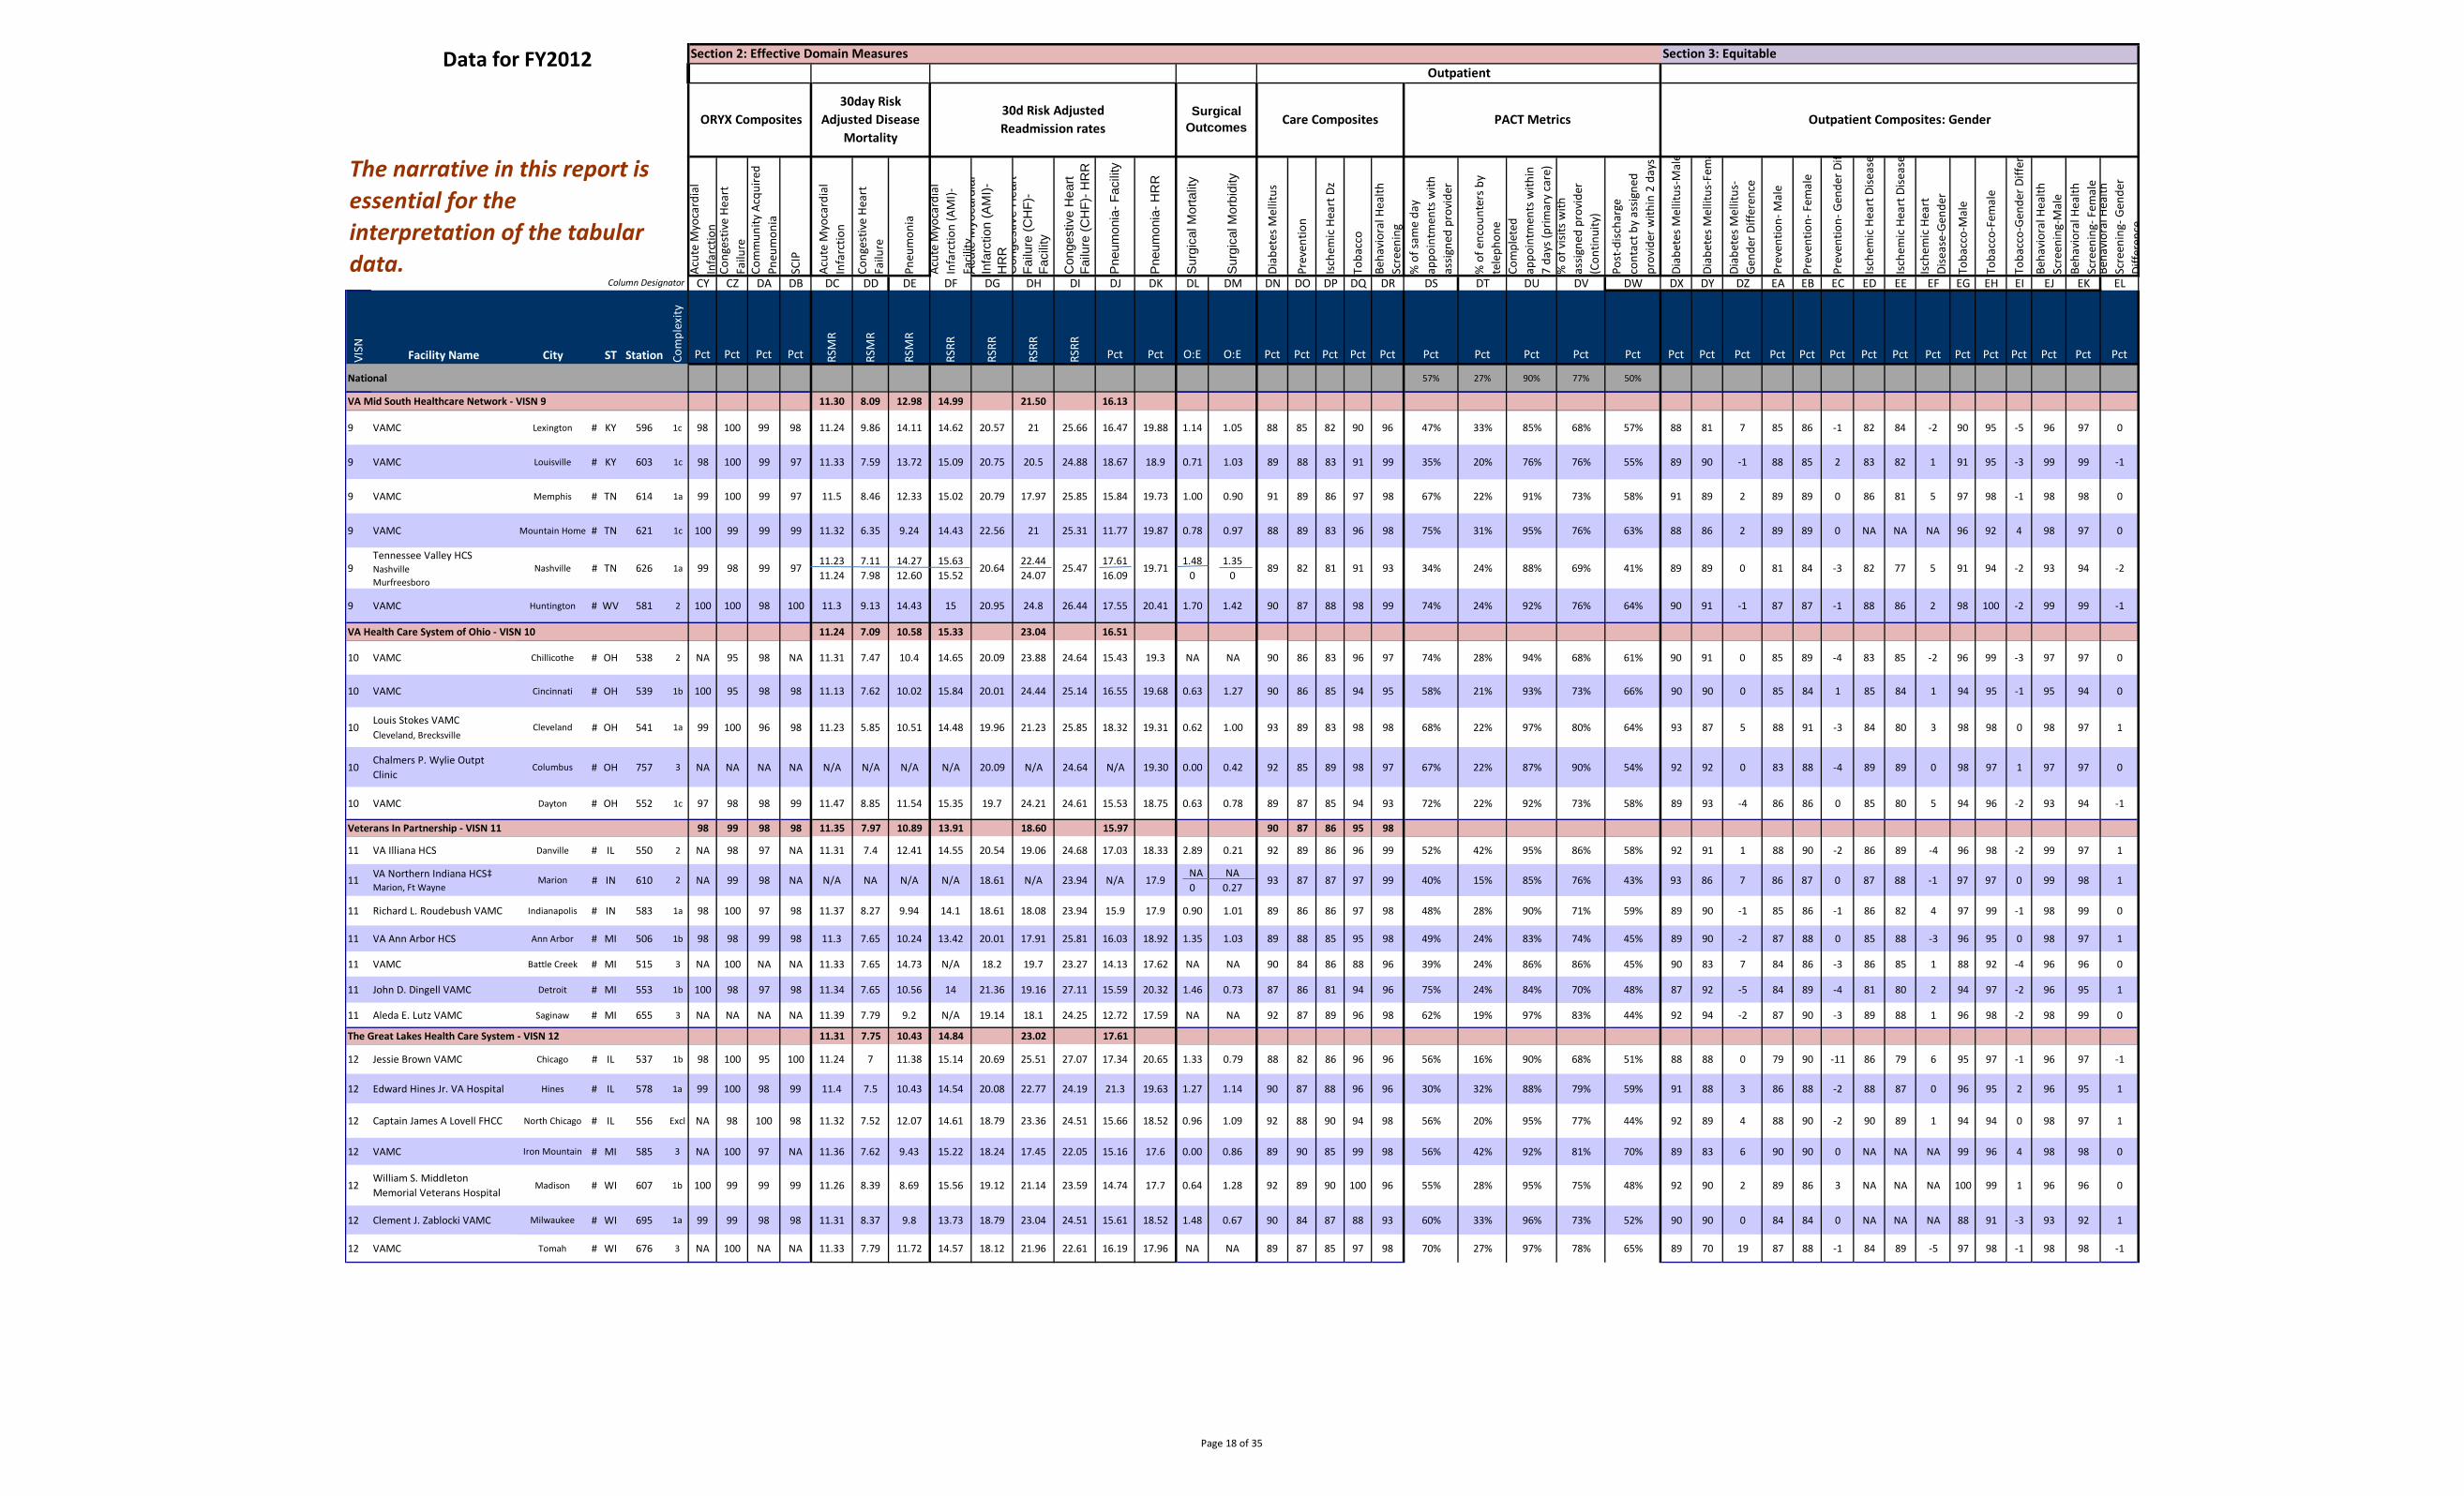
Data for FY2012
Column Designator
The narrative in this report is essential for the interpretation of the tabular data.
Section 2: Effective Domain Measures Section 3: Equitable Outpatient
ORYX Composites 30day Risk
Adjusted Disease Mortality
30d Risk Adjusted Readmission rates
Surgical Outcomes Care Composites PACT Metrics Outpatient Composites: Gender
Acut
e M
yoca
rdia
l In
farc
tion
Cong
estiv
e He
art
Failu
reCo
mm
unity
Acq
uire
d Pn
eum
onia
SCIP
Acut
e M
yoca
rdia
l In
farc
tion
Cong
estiv
e He
art
Failu
re
Pneu
mon
ia
Acut
e M
yoca
rdia
l In
farc
tion
(AM
I)-
Faci
lity
DF
Acu
te M
yoca
rdia
lIn
farc
tion
(AM
I)-
HR
RC
onge
stiv
e H
eart
Failu
re (C
HF)
- Fa
cilit
y
Con
gest
ive
Hea
rtFa
ilure
(CH
F)- H
RR
Pne
umon
ia- F
acili
ty
Pne
umon
ia- H
RR
Sur
gica
l Mor
talit
y
Sur
gica
l Mor
bidi
ty
Diab
etes
Mel
litus
Prev
entio
n
Isch
emic
Hea
rt D
z
Toba
cco
Beha
vior
al H
ealth
Scre
enin
g%
of s
ame
day
appo
intm
ents
with
as
signe
d pr
ovid
er
% o
f enc
ount
ers b
yte
leph
one
Com
plet
edap
poin
tmen
ts w
ithin
7
days
(prim
ary
care
)%
of v
isits
with
assig
ned
prov
ider
(Con
tinui
ty)
Post
-disc
harg
eco
ntac
t by
assig
ned
prov
ider
with
in 2
day
s
Diab
etes
Mel
litus
-Mal
e
Diab
etes
Mel
litus
-Fem
a
Diab
etes
Mel
litus
-Ge
nder
Diff
eren
ce
Prev
entio
n- M
ale
Prev
entio
n- F
emal
e
Prev
entio
n- G
ende
r Dif
Isch
emic
Hea
rt D
iseas
e
Isch
emic
Hea
rt D
iseas
e
Isch
emic
Hea
rt
Dise
ase-
Gend
er
Toba
cco-
Mal
e
Toba
cco-
Fem
ale
Toba
cco-
Gend
er D
iffer
e
Beha
vior
al H
ealth
Scre
enin
g-M
ale
Beha
vior
al H
ealth
Scre
enin
g- F
emal
eBe
havi
oral
Hea
lthSc
reen
ing-
Gen
der
Diffe
renc
e
CY CZ DA DB DC DD DE DG DH DI DJ DK DL DM DN DO DP DQ DR DS DT DU DV DW DX DY DZ EA EB EC ED EE EF EG EH EI EJ EK EL
VISN Facility Name City ST Station Com
plex
ity
Pct Pct Pct Pct RSM
R
RSM
R
RSM
R
RSRR
RSRR
RSRR
RSRR
Pct Pct O:E O:E Pct Pct Pct Pct Pct Pct Pct Pct Pct Pct Pct Pct Pct Pct Pct Pct Pct Pct Pct Pct Pct Pct Pct Pct Pct
National 57% 27% 90% 77% 50%
VA Mid South Healthcare Network - VISN 9 11.30 8.09 12.98 14.99 21.50 16.13
9 VAMC Lexington # KY 596 1c 98 100 99 98 11.24 9.86 14.11 14.62 20.57 21 25.66 16.47 19.88 1.14 1.05 88 85 82 90 96 47% 33% 85% 68% 57% 88 81 7 85 86 -1 82 84 -2 90 95 -5 96 97 0
9 VAMC Louisville # KY 603 1c 98 100 99 97 11.33 7.59 13.72 15.09 20.75 20.5 24.88 18.67 18.9 0.71 1.03 89 88 83 91 99 35% 20% 76% 76% 55% 89 90 -1 88 85 2 83 82 1 91 95 -3 99 99 -1
9 VAMC Memphis # TN 614 1a 99 100 99 97 11.5 8.46 12.33 15.02 20.79 17.97 25.85 15.84 19.73 1.00 0.90 91 89 86 97 98 67% 22% 91% 73% 58% 91 89 2 89 89 0 86 81 5 97 98 -1 98 98 0
9 VAMC Mountain Home # TN 621 1c 100 99 99 99 11.32 6.35 9.24 14.43 22.56 21 25.31 11.77 19.87 0.78 0.97 88 89 83 96 98 75% 31% 95% 76% 63% 88 86 2 89 89 0 NA NA NA 96 92 4 98 97 0
9 Tennessee Valley HCS Nashville Murfreesboro
Nashville # TN 626 1a 99 98 99 97 11.23 7.11 14.27 15.63
20.64 22.44 24.07
25.47 17.61 16.09
19.71 1.48
0 1.35
0 89 82 81 91 93 34% 24% 88% 69% 41% 89 89 0 81 84 -3 82 77 5 91 94 -2 93 94 -2
11.24 7.98 12.60 15.52
9 VAMC Huntington # WV 581 2 100 100 98 100 11.3 9.13 14.43 15 20.95 24.8 26.44 17.55 20.41 1.70 1.42 90 87 88 98 99 74% 24% 92% 76% 64% 90 91 -1 87 87 -1 88 86 2 98 100 -2 99 99 -1
VA Health Care System of Ohio - VISN 10 11.24 7.09 10.58 15.33 23.04 16.51
10 VAMC Chillicothe # OH 538 2 NA 95 98 NA 11.31 7.47 10.4 14.65 20.09 23.88 24.64 15.43 19.3 NA NA 90 86 83 96 97 74% 28% 94% 68% 61% 90 91 0 85 89 -4 83 85 -2 96 99 -3 97 97 0
10 VAMC Cincinnati # OH 539 1b 100 95 98 98 11.13 7.62 10.02 15.84 20.01 24.44 25.14 16.55 19.68 0.63 1.27 90 86 85 94 95 58% 21% 93% 73% 66% 90 90 0 85 84 1 85 84 1 94 95 -1 95 94 0
10 Louis Stokes VAMC Cleveland, Brecksville
Cleveland # OH 541 1a 99 100 96 98 11.23 5.85 10.51 14.48 19.96 21.23 25.85 18.32 19.31 0.62 1.00 93 89 83 98 98 68% 22% 97% 80% 64% 93 87 5 88 91 -3 84 80 3 98 98 0 98 97 1
10 Chalmers P. Wylie Outpt Clinic
Columbus # OH 757 3 NA NA NA NA N/A N/A N/A N/A 20.09 N/A 24.64 N/A 19.30 0.00 0.42 92 85 89 98 97 67% 22% 87% 90% 54% 92 92 0 83 88 -4 89 89 0 98 97 1 97 97 0
10 VAMC Dayton # OH 552 1c 97 98 98 99 11.47 8.85 11.54 15.35 19.7 24.21 24.61 15.53 18.75 0.63 0.78 89 87 85 94 93 72% 22% 92% 73% 58% 89 93 -4 86 86 0 85 80 5 94 96 -2 93 94 -1
Veterans In Partnership - VISN 11 98 99 98 98 11.35 7.97 10.89 13.91 18.60 15.97 90 87 86 95 98
11 VA Illiana HCS Danville # IL 550 2 NA 98 97 NA 11.31 7.4 12.41 14.55 20.54 19.06 24.68 17.03 18.33 2.89 0.21 92 89 86 96 99 52% 42% 95% 86% 58% 92 91 1 88 90 -2 86 89 -4 96 98 -2 99 97 1
11 VA Northern Indiana HCS‡ Marion, Ft Wayne
Marion # IN 610 2 NA 99 98 NA N/A NA N/A N/A 18.61 N/A 23.94 N/A 17.9 NA
0 NA
0.27 93 87 87 97 99 40% 15% 85% 76% 43% 93 86 7 86 87 0 87 88 -1 97 97 0 99 98 1
11 Richard L. Roudebush VAMC Indianapolis # IN 583 1a 98 100 97 98 11.37 8.27 9.94 14.1 18.61 18.08 23.94 15.9 17.9 0.90 1.01 89 86 86 97 98 48% 28% 90% 71% 59% 89 90 -1 85 86 -1 86 82 4 97 99 -1 98 99 0
11 VA Ann Arbor HCS Ann Arbor # MI 506 1b 98 98 99 98 11.3 7.65 10.24 13.42 20.01 17.91 25.81 16.03 18.92 1.35 1.03 89 88 85 95 98 49% 24% 83% 74% 45% 89 90 -2 87 88 0 85 88 -3 96 95 0 98 97 1
11 VAMC Battle Creek # MI 515 3 NA 100 NA NA 11.33 7.65 14.73 N/A 18.2 19.7 23.27 14.13 17.62 NA NA 90 84 86 88 96 39% 24% 86% 86% 45% 90 83 7 84 86 -3 86 85 1 88 92 -4 96 96 0
11 John D. Dingell VAMC Detroit # MI 553 1b 100 98 97 98 11.34 7.65 10.56 14 21.36 19.16 27.11 15.59 20.32 1.46 0.73 87 86 81 94 96 75% 24% 84% 70% 48% 87 92 -5 84 89 -4 81 80 2 94 97 -2 96 95 1
11 Aleda E. Lutz VAMC Saginaw # MI 655 3 NA NA NA NA 11.39 7.79 9.2 N/A 19.14 18.1 24.25 12.72 17.59 NA NA 92 87 89 96 98 62% 19% 97% 83% 44% 92 94 -2 87 90 -3 89 88 1 96 98 -2 98 99 0
The Great Lakes Health Care System - VISN 12 11.31 7.75 10.43 14.84 23.02 17.61
12 Jessie Brown VAMC Chicago # IL 537 1b 98 100 95 100 11.24 7 11.38 15.14 20.69 25.51 27.07 17.34 20.65 1.33 0.79 88 82 86 96 96 56% 16% 90% 68% 51% 88 88 0 79 90 -11 86 79 6 95 97 -1 96 97 -1
12 Edward Hines Jr. VA Hospital Hines # IL 578 1a 99 100 98 99 11.4 7.5 10.43 14.54 20.08 22.77 24.19 21.3 19.63 1.27 1.14 90 87 88 96 96 30% 32% 88% 79% 59% 91 88 3 86 88 -2 88 87 0 96 95 2 96 95 1
12 Captain James A Lovell FHCC North Chicago # IL 556 Excl NA 98 100 98 11.32 7.52 12.07 14.61 18.79 23.36 24.51 15.66 18.52 0.96 1.09 92 88 90 94 98 56% 20% 95% 77% 44% 92 89 4 88 90 -2 90 89 1 94 94 0 98 97 1
12 VAMC Iron Mountain # MI 585 3 NA 100 97 NA 11.36 7.62 9.43 15.22 18.24 17.45 22.05 15.16 17.6 0.00 0.86 89 90 85 99 98 56% 42% 92% 81% 70% 89 83 6 90 90 0 NA NA NA 99 96 4 98 98 0
12 William S. Middleton Memorial Veterans Hospital
Madison # WI 607 1b 100 99 99 99 11.26 8.39 8.69 15.56 19.12 21.14 23.59 14.74 17.7 0.64 1.28 92 89 90 100 96 55% 28% 95% 75% 48% 92 90 2 89 86 3 NA NA NA 100 99 1 96 96 0
12 Clement J. Zablocki VAMC Milwaukee # WI 695 1a 99 99 98 98 11.31 8.37 9.8 13.73 18.79 23.04 24.51 15.61 18.52 1.48 0.67 90 84 87 88 93 60% 33% 96% 73% 52% 90 90 0 84 84 0 NA NA NA 88 91 -3 93 92 1
12 VAMC Tomah # WI 676 3 NA 100 NA NA 11.33 7.79 11.72 14.57 18.12 21.96 22.61 16.19 17.96 NA NA 89 87 85 97 98 70% 27% 97% 78% 65% 89 70 19 87 88 -1 84 89 -5 97 98 -1 98 98 -1
Page 18 of 35
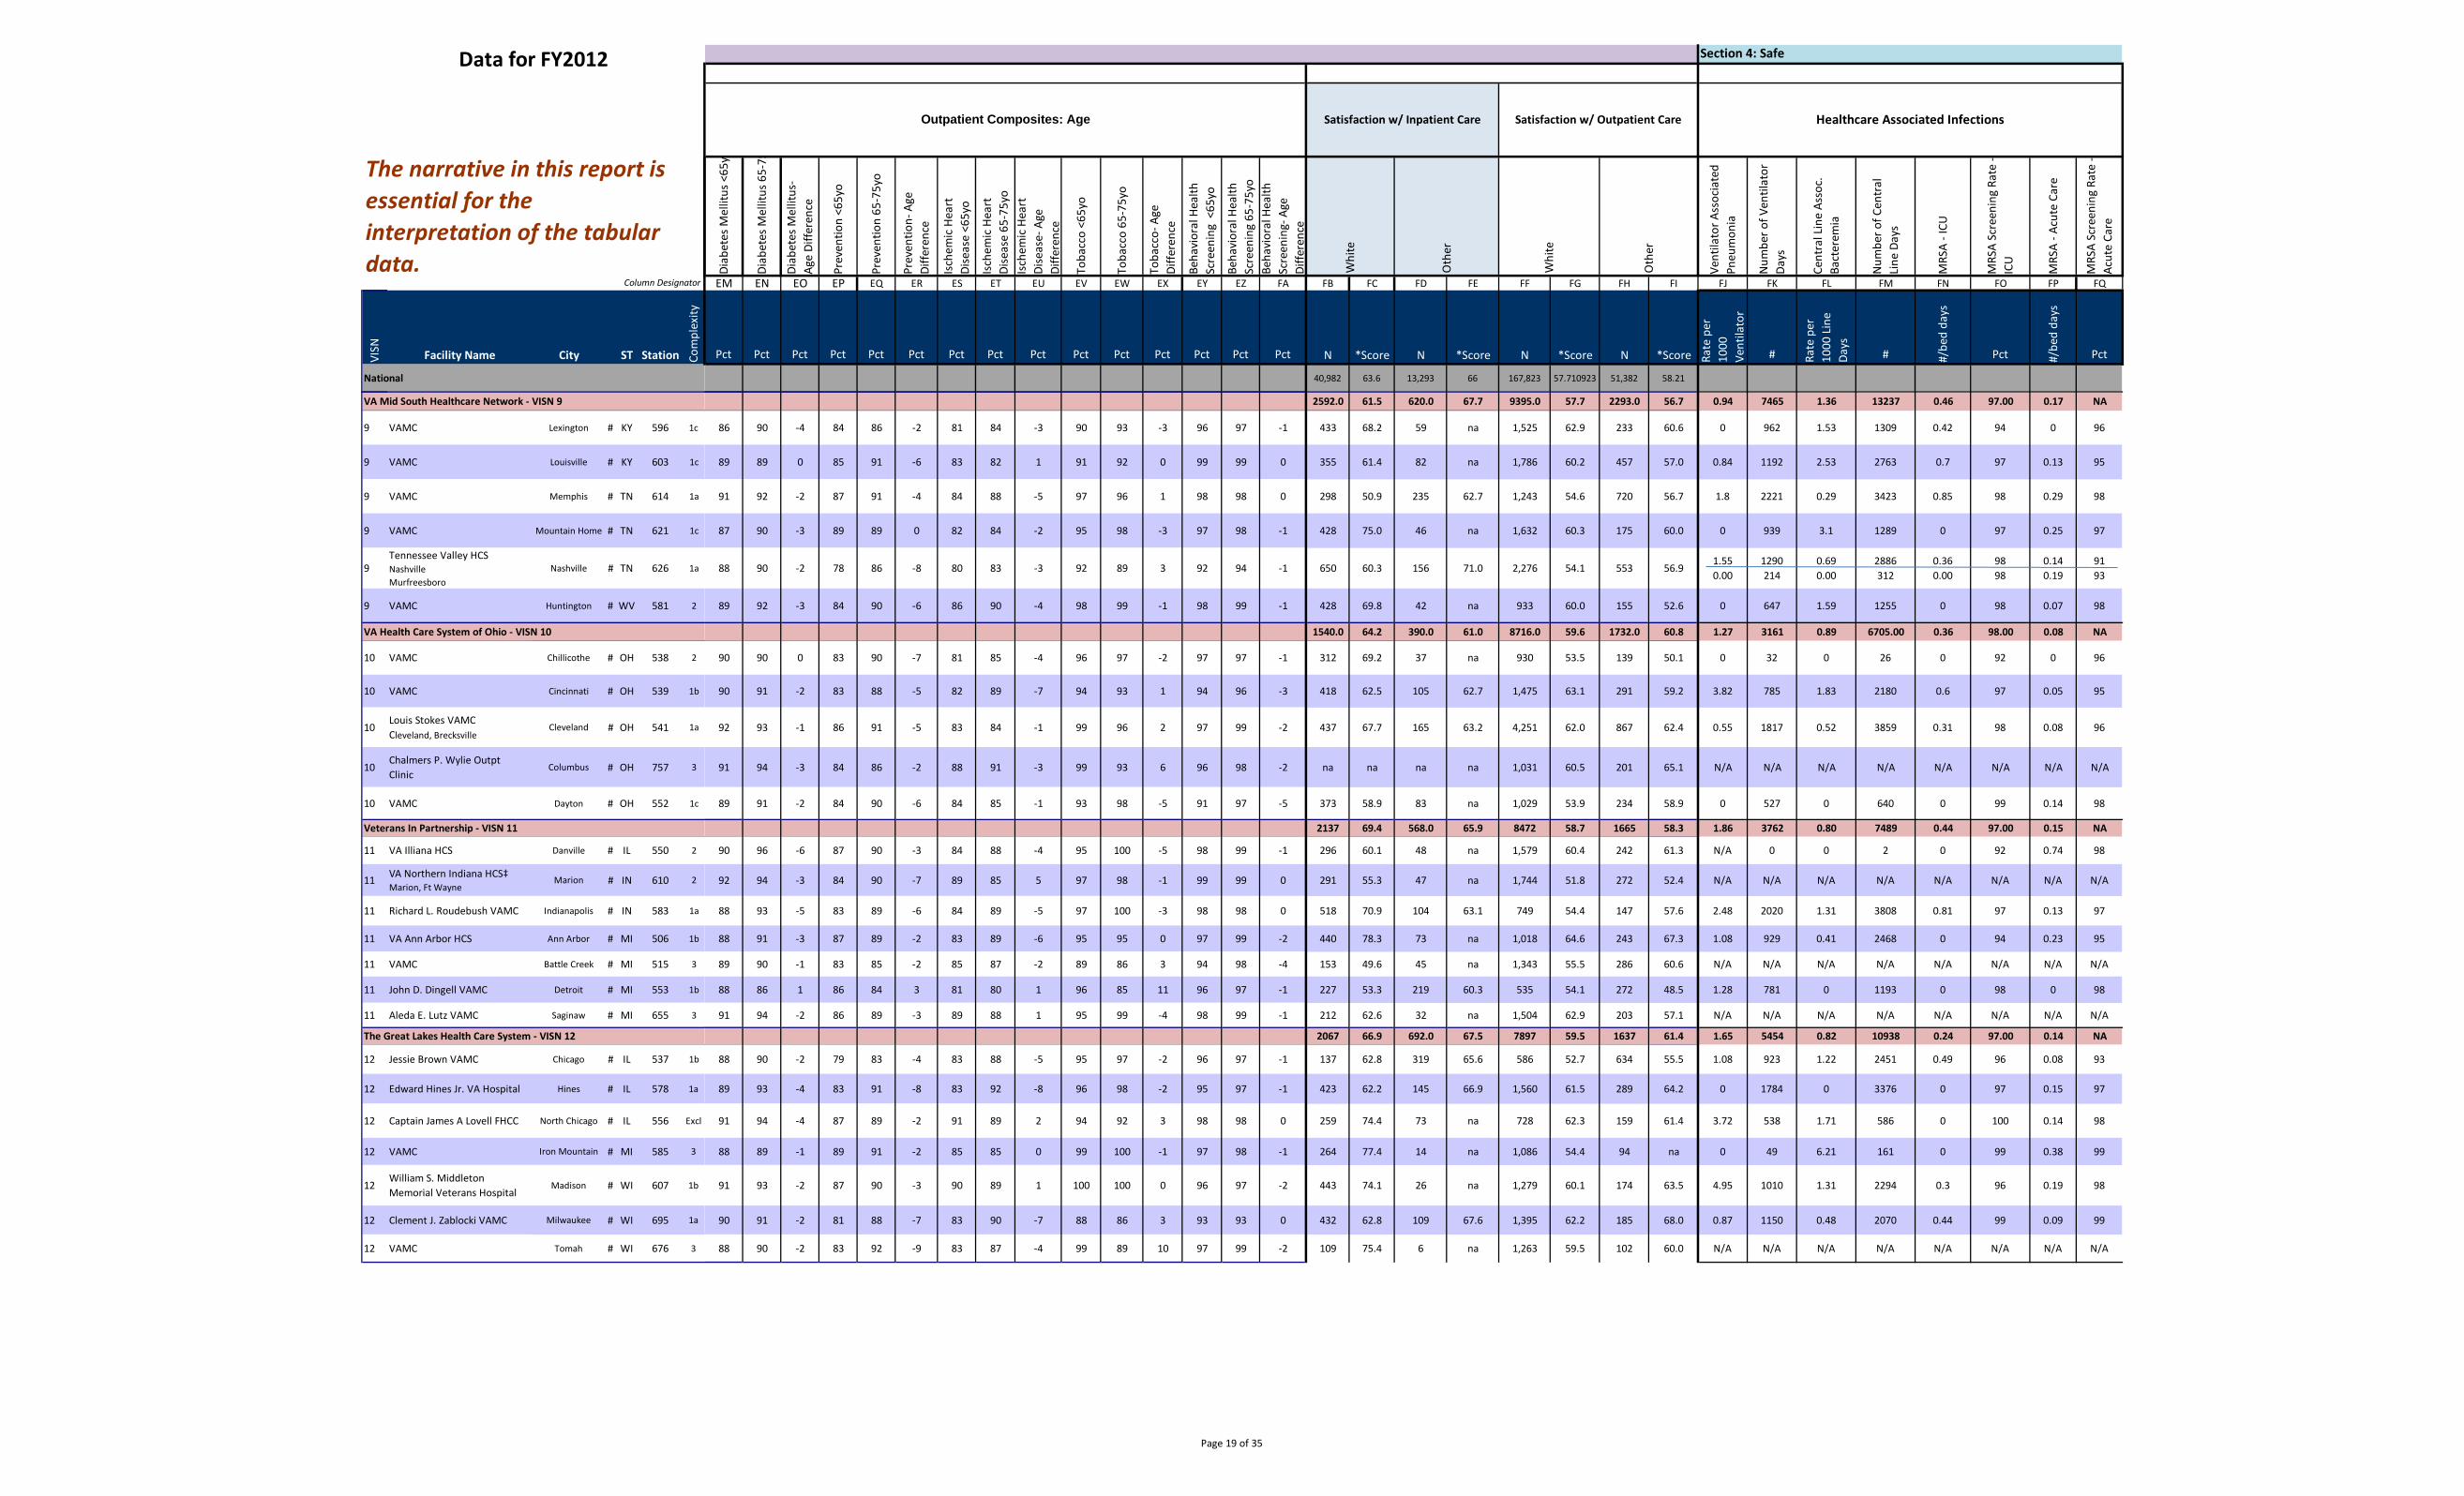
VISN Facility Name City ST Station Com
plex
ity
National
Data for FY2012
Column Designator
The narrative in this report is essential for the interpretation of the tabular data.
VA Mid South Healthcare Network - VISN 9
9 VAMC Lexington # KY 596 1c
9 VAMC Louisville # KY 603 1c
9 VAMC Memphis # TN 614 1a
9 VAMC Mountain Home # TN 621 1c
9 Tennessee Valley HCS Nashville Murfreesboro
Nashville # TN 626 1a
9 VAMC Huntington # WV 581 2
VA Health Care System of Ohio - VISN 10
10 VAMC Chillicothe # OH 538 2
10 VAMC Cincinnati # OH 539 1b
10 Louis Stokes VAMC Cleveland, Brecksville
Cleveland # OH 541 1a
10 Chalmers P. Wylie Outpt Clinic
Columbus # OH 757 3
10 VAMC Dayton # OH 552 1c
Veterans In Partnership - VISN 11
11 VA Illiana HCS Danville # IL 550 2
11 VA Northern Indiana HCS‡ Marion, Ft Wayne
Marion # IN 610 2
11 Richard L. Roudebush VAMC Indianapolis # IN 583 1a
11 VA Ann Arbor HCS Ann Arbor # MI 506 1b
11 VAMC Battle Creek # MI 515 3
11 John D. Dingell VAMC Detroit # MI 553 1b
11 Aleda E. Lutz VAMC Saginaw # MI 655 3
The Great Lakes Health Care System - VISN 12
12 Jessie Brown VAMC Chicago # IL 537 1b
12 Edward Hines Jr. VA Hospital Hines # IL 578 1a
12 Captain James A Lovell FHCC North Chicago # IL 556 Excl
12 VAMC Iron Mountain # MI 585 3
12 William S. Middleton Memorial Veterans Hospital
Madison # WI 607 1b
12 Clement J. Zablocki VAMC Milwaukee # WI 695 1a
12 VAMC Tomah # WI 676 3
Diab
etes
Mel
litus
<65
y
Diab
etes
Mel
litus
65-
75
Diab
etes
Mel
litus
-Ag
e Di
ffere
nce
Prev
entio
n <6
5yo
Prev
entio
n 65
-75y
o
Prev
entio
n- A
geDi
ffere
nce
Isch
emic
Hea
rt
Dise
ase
<65y
o
Isch
emic
Hea
rt
Dise
ase
65-7
5yo
Isch
emic
Hea
rt
Dise
ase-
Age
Diffe
renc
e
Toba
cco
<65y
o
Toba
cco
65-7
5yo
Toba
cco-
Age
Diffe
renc
e
Beha
vior
al H
ealth
Scre
enin
g <
65yo
Beha
vior
al H
ealth
Scre
enin
g 65
-75y
oBe
havi
oral
Hea
lthSc
reen
ing-
Age
Diffe
renc
e
Vent
ilato
r Ass
ocia
ted
Pneu
mon
ia
Num
ber o
f Ven
tilat
orDa
ys
Cent
ral L
ine
Asso
c.Ba
cter
emia
Num
ber o
f Cen
tral
Line
Day
s
MRS
A -I
CU
MRS
A Sc
reen
ing
Rate
-IC
U
MRS
A -A
cute
Car
e
MRS
A Sc
reen
ing
Rate
-Ac
ute
Care
EM EN EO EP EQ ER ES ET EU EV EW EX EY EZ FA FB FC FD FE FF FG FH FI FJ FK FL FM FN FO FP FQ
Pct Pct Pct Pct Pct Pct Pct Pct Pct Pct Pct Pct Pct Pct Pct N *Score N *Score N *Score N *Score Rate
per
1000
Vent
ilato
r
# Rate
per
1000
Lin
eDa
ys
# #/be
d da
ys
Pct #/be
d da
ys
Pct
40,982 63.6 13,293 66 167,823 57.710923 51,382 58.21
Healthcare Associated Infections
Whi
te
Oth
er
Section 4: Safe
Satisfaction w/ Inpatient Care Outpatient Composites: Age
Whi
te
Satisfaction w/ Outpatient Care
Oth
er
2592.0 61.5 620.0 67.7 9395.0 57.7 2293.0 56.7 0.94 7465 1.36 13237 0.46 97.00 0.17 NA
86 90 -4 84 86 -2 81 84 -3 90 93 -3 96 97 -1 433 68.2 59 na 1,525 62.9 233 60.6 0 962 1.53 1309 0.42 94 0 96
89 89 0 85 91 -6 83 82 1 91 92 0 99 99 0 355 61.4 82 na 1,786 60.2 457 57.0 0.84 1192 2.53 2763 0.7 97 0.13 95
91 92 -2 87 91 -4 84 88 -5 97 96 1 98 98 0 298 50.9 235 62.7 1,243 54.6 720 56.7 1.8 2221 0.29 3423 0.85 98 0.29 98
87 90 -3 89 89 0 82 84 -2 95 98 -3 97 98 -1 428 75.0 46 na 1,632 60.3 175 60.0 0 939 3.1 1289 0 97 0.25 97
88 90 -2 78 86 -8 80 83 -3 92 89 3 92 94 -1 650 60.3 156 71.0 2,276 54.1 553 56.9 1.55 0.00
1290 214
0.69 0.00
2886 312
0.36 0.00
98 98
0.14 0.19
91 93
89 92 -3 84 90 -6 86 90 -4 98 99 -1 98 99 -1 428 69.8 42 na 933 60.0 155 52.6 0 647 1.59 1255 0 98 0.07 98
1540.0 64.2 390.0 61.0 8716.0 59.6 1732.0 60.8 1.27 3161 0.89 6705.00 0.36 98.00 0.08 NA
90 90 0 83 90 -7 81 85 -4 96 97 -2 97 97 -1 312 69.2 37 na 930 53.5 139 50.1 0 32 0 26 0 92 0 96
90 91 -2 83 88 -5 82 89 -7 94 93 1 94 96 -3 418 62.5 105 62.7 1,475 63.1 291 59.2 3.82 785 1.83 2180 0.6 97 0.05 95
92 93 -1 86 91 -5 83 84 -1 99 96 2 97 99 -2 437 67.7 165 63.2 4,251 62.0 867 62.4 0.55 1817 0.52 3859 0.31 98 0.08 96
91 94 -3 84 86 -2 88 91 -3 99 93 6 96 98 -2 na na na na 1,031 60.5 201 65.1 N/A N/A N/A N/A N/A N/A N/A N/A
89 91 -2 84 90 -6 84 85 -1 93 98 -5 91 97 -5 373 58.9 83 na 1,029 53.9 234 58.9 0 527 0 640 0 99 0.14 98
2137 69.4 568.0 65.9 8472 58.7 1665 58.3 1.86 3762 0.80 7489 0.44 97.00 0.15 NA
90 96 -6 87 90 -3 84 88 -4 95 100 -5 98 99 -1 296 60.1 48 na 1,579 60.4 242 61.3 N/A 0 0 2 0 92 0.74 98
92 94 -3 84 90 -7 89 85 5 97 98 -1 99 99 0 291 55.3 47 na 1,744 51.8 272 52.4 N/A N/A N/A N/A N/A N/A N/A N/A
88 93 -5 83 89 -6 84 89 -5 97 100 -3 98 98 0 518 70.9 104 63.1 749 54.4 147 57.6 2.48 2020 1.31 3808 0.81 97 0.13 97
88 91 -3 87 89 -2 83 89 -6 95 95 0 97 99 -2 440 78.3 73 na 1,018 64.6 243 67.3 1.08 929 0.41 2468 0 94 0.23 95
89 90 -1 83 85 -2 85 87 -2 89 86 3 94 98 -4 153 49.6 45 na 1,343 55.5 286 60.6 N/A N/A N/A N/A N/A N/A N/A N/A
88 86 1 86 84 3 81 80 1 96 85 11 96 97 -1 227 53.3 219 60.3 535 54.1 272 48.5 1.28 781 0 1193 0 98 0 98
91 94 -2 86 89 -3 89 88 1 95 99 -4 98 99 -1 212 62.6 32 na 1,504 62.9 203 57.1 N/A N/A N/A N/A N/A N/A N/A N/A
2067 66.9 692.0 67.5 7897 59.5 1637 61.4 1.65 5454 0.82 10938 0.24 97.00 0.14 NA
88 90 -2 79 83 -4 83 88 -5 95 97 -2 96 97 -1 137 62.8 319 65.6 586 52.7 634 55.5 1.08 923 1.22 2451 0.49 96 0.08 93
89 93 -4 83 91 -8 83 92 -8 96 98 -2 95 97 -1 423 62.2 145 66.9 1,560 61.5 289 64.2 0 1784 0 3376 0 97 0.15 97
91 94 -4 87 89 -2 91 89 2 94 92 3 98 98 0 259 74.4 73 na 728 62.3 159 61.4 3.72 538 1.71 586 0 100 0.14 98
88 89 -1 89 91 -2 85 85 0 99 100 -1 97 98 -1 264 77.4 14 na 1,086 54.4 94 na 0 49 6.21 161 0 99 0.38 99
91 93 -2 87 90 -3 90 89 1 100 100 0 96 97 -2 443 74.1 26 na 1,279 60.1 174 63.5 4.95 1010 1.31 2294 0.3 96 0.19 98
90 91 -2 81 88 -7 83 90 -7 88 86 3 93 93 0 432 62.8 109 67.6 1,395 62.2 185 68.0 0.87 1150 0.48 2070 0.44 99 0.09 99
88 90 -2 83 92 -9 83 87 -4 99 89 10 97 99 -2 109 75.4 6 na 1,263 59.5 102 60.0 N/A N/A N/A N/A N/A N/A N/A N/A
Page 19 of 35
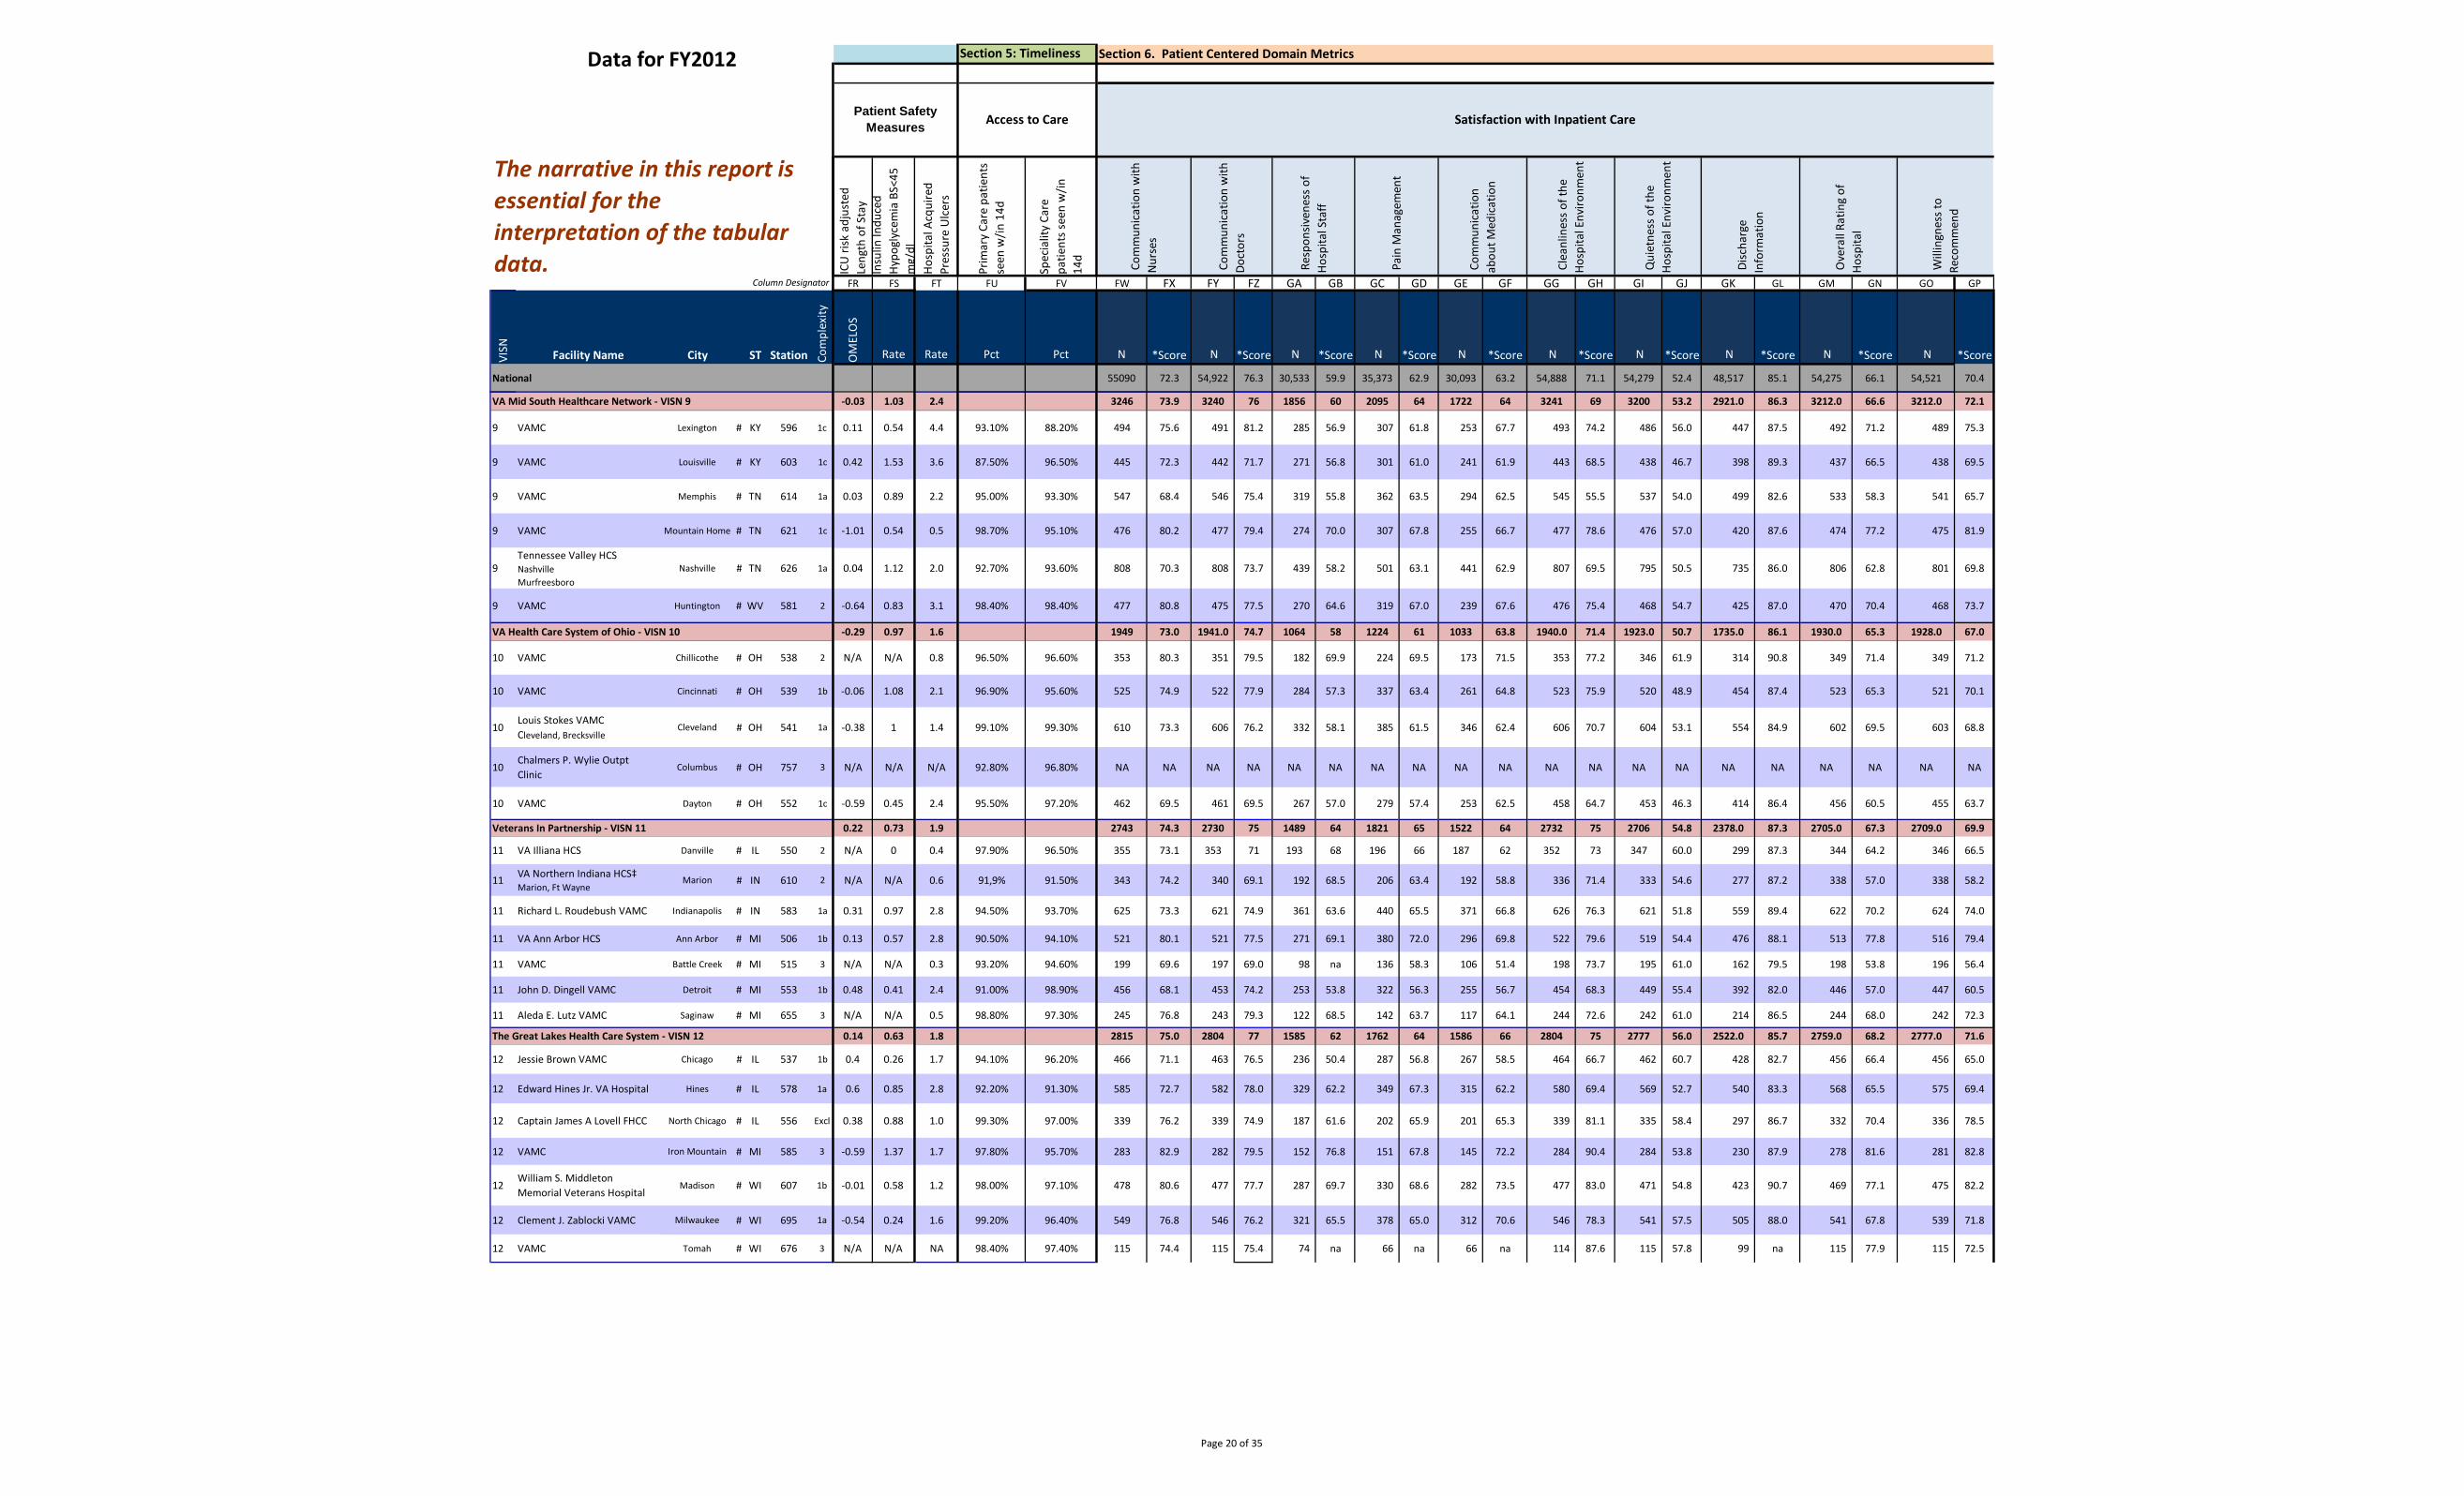
Data for FY2012
Column Designator
The narrative in this report is essential for the interpretation of the tabular data.
Section 5: Timeliness Section 6. Patient Centered Domain Metrics
Patient Safety Measures Access to Care Satisfaction with Inpatient Care
ICU
risk
adj
uste
d Le
ngth
of S
tay
Insu
lin In
duce
d Hy
pogl
ycem
ia B
S<45
m
g/dl
Hosp
ital A
cqui
red
Pres
sure
Ulc
ers
Prim
ary
Care
pat
ient
sse
en w
/in 1
4d
Spec
ialit
y Ca
repa
tient
s see
n w
/in14
d
Com
mun
icat
ion
with
N
urse
s
Com
mun
icat
ion
with
Do
ctor
s
Res
pons
iven
ess o
fHo
spita
l Sta
ff
Pai
n M
anag
emen
t
Com
mun
icat
ion
abou
t Med
icat
ion
Cle
anlin
ess o
f the
Hosp
ital E
nviro
nmen
t
Qui
etne
ss o
f the
Hosp
ital E
nviro
nmen
t
Disc
harg
eIn
form
atio
n
Ove
rall
Ratin
g of
Hosp
ital
Will
ingn
ess t
oRe
com
men
d
FR FS FT FU FV FW FX FY FZ GA GB GC GD GE GF GG GH GI GJ GK GL GM GN GO GP
VISN Facility Name City ST Station Com
plex
ity
OM
ELO
S
Rate Rate Pct Pct N *Score N *Score N *Score N *Score N *Score N *Score N *Score N *Score N *Score N *Score
National 55090 72.3 54,922 76.3 30,533 59.9 35,373 62.9 30,093 63.2 54,888 71.1 54,279 52.4 48,517 85.1 54,275 66.1 54,521 70.4
VA Mid South Healthcare Network - VISN 9 -0.03 1.03 2.4 3246 73.9 3240 76 1856 60 2095 64 1722 64 3241 69 3200 53.2 2921.0 86.3 3212.0 66.6 3212.0 72.1
9 VAMC Lexington # KY 596 1c 0.11 0.54 4.4 93.10% 88.20% 494 75.6 491 81.2 285 56.9 307 61.8 253 67.7 493 74.2 486 56.0 447 87.5 492 71.2 489 75.3
9 VAMC Louisville # KY 603 1c 0.42 1.53 3.6 87.50% 96.50% 445 72.3 442 71.7 271 56.8 301 61.0 241 61.9 443 68.5 438 46.7 398 89.3 437 66.5 438 69.5
9 VAMC Memphis # TN 614 1a 0.03 0.89 2.2 95.00% 93.30% 547 68.4 546 75.4 319 55.8 362 63.5 294 62.5 545 55.5 537 54.0 499 82.6 533 58.3 541 65.7
9 VAMC Mountain Home # TN 621 1c -1.01 0.54 0.5 98.70% 95.10% 476 80.2 477 79.4 274 70.0 307 67.8 255 66.7 477 78.6 476 57.0 420 87.6 474 77.2 475 81.9
9 Tennessee Valley HCS Nashville Murfreesboro
Nashville # TN 626 1a 0.04 1.12 2.0 92.70% 93.60% 808 70.3 808 73.7 439 58.2 501 63.1 441 62.9 807 69.5 795 50.5 735 86.0 806 62.8 801 69.8
9 VAMC Huntington # WV 581 2 -0.64 0.83 3.1 98.40% 98.40% 477 80.8 475 77.5 270 64.6 319 67.0 239 67.6 476 75.4 468 54.7 425 87.0 470 70.4 468 73.7
VA Health Care System of Ohio - VISN 10 -0.29 0.97 1.6 1949 73.0 1941.0 74.7 1064 58 1224 61 1033 63.8 1940.0 71.4 1923.0 50.7 1735.0 86.1 1930.0 65.3 1928.0 67.0
10 VAMC Chillicothe # OH 538 2 N/A N/A 0.8 96.50% 96.60% 353 80.3 351 79.5 182 69.9 224 69.5 173 71.5 353 77.2 346 61.9 314 90.8 349 71.4 349 71.2
10 VAMC Cincinnati # OH 539 1b -0.06 1.08 2.1 96.90% 95.60% 525 74.9 522 77.9 284 57.3 337 63.4 261 64.8 523 75.9 520 48.9 454 87.4 523 65.3 521 70.1
10 Louis Stokes VAMC Cleveland, Brecksville
Cleveland # OH 541 1a -0.38 1 1.4 99.10% 99.30% 610 73.3 606 76.2 332 58.1 385 61.5 346 62.4 606 70.7 604 53.1 554 84.9 602 69.5 603 68.8
10 Chalmers P. Wylie Outpt Clinic
Columbus # OH 757 3 N/A N/A N/A 92.80% 96.80% NA NA NA NA NA NA NA NA NA NA NA NA NA NA NA NA NA NA NA NA
10 VAMC Dayton # OH 552 1c -0.59 0.45 2.4 95.50% 97.20% 462 69.5 461 69.5 267 57.0 279 57.4 253 62.5 458 64.7 453 46.3 414 86.4 456 60.5 455 63.7
Veterans In Partnership - VISN 11 0.22 0.73 1.9 2743 74.3 2730 75 1489 64 1821 65 1522 64 2732 75 2706 54.8 2378.0 87.3 2705.0 67.3 2709.0 69.9
11 VA Illiana HCS Danville # IL 550 2 N/A 0 0.4 97.90% 96.50% 355 73.1 353 71 193 68 196 66 187 62 352 73 347 60.0 299 87.3 344 64.2 346 66.5
11 VA Northern Indiana HCS‡ Marion, Ft Wayne
Marion # IN 610 2 N/A N/A 0.6 91,9% 91.50% 343 74.2 340 69.1 192 68.5 206 63.4 192 58.8 336 71.4 333 54.6 277 87.2 338 57.0 338 58.2
11 Richard L. Roudebush VAMC Indianapolis # IN 583 1a 0.31 0.97 2.8 94.50% 93.70% 625 73.3 621 74.9 361 63.6 440 65.5 371 66.8 626 76.3 621 51.8 559 89.4 622 70.2 624 74.0
11 VA Ann Arbor HCS Ann Arbor # MI 506 1b 0.13 0.57 2.8 90.50% 94.10% 521 80.1 521 77.5 271 69.1 380 72.0 296 69.8 522 79.6 519 54.4 476 88.1 513 77.8 516 79.4
11 VAMC Battle Creek # MI 515 3 N/A N/A 0.3 93.20% 94.60% 199 69.6 197 69.0 98 na 136 58.3 106 51.4 198 73.7 195 61.0 162 79.5 198 53.8 196 56.4
11 John D. Dingell VAMC Detroit # MI 553 1b 0.48 0.41 2.4 91.00% 98.90% 456 68.1 453 74.2 253 53.8 322 56.3 255 56.7 454 68.3 449 55.4 392 82.0 446 57.0 447 60.5
11 Aleda E. Lutz VAMC Saginaw # MI 655 3 N/A N/A 0.5 98.80% 97.30% 245 76.8 243 79.3 122 68.5 142 63.7 117 64.1 244 72.6 242 61.0 214 86.5 244 68.0 242 72.3
The Great Lakes Health Care System - VISN 12 0.14 0.63 1.8 2815 75.0 2804 77 1585 62 1762 64 1586 66 2804 75 2777 56.0 2522.0 85.7 2759.0 68.2 2777.0 71.6
12 Jessie Brown VAMC Chicago # IL 537 1b 0.4 0.26 1.7 94.10% 96.20% 466 71.1 463 76.5 236 50.4 287 56.8 267 58.5 464 66.7 462 60.7 428 82.7 456 66.4 456 65.0
12 Edward Hines Jr. VA Hospital Hines # IL 578 1a 0.6 0.85 2.8 92.20% 91.30% 585 72.7 582 78.0 329 62.2 349 67.3 315 62.2 580 69.4 569 52.7 540 83.3 568 65.5 575 69.4
12 Captain James A Lovell FHCC North Chicago # IL 556 Excl 0.38 0.88 1.0 99.30% 97.00% 339 76.2 339 74.9 187 61.6 202 65.9 201 65.3 339 81.1 335 58.4 297 86.7 332 70.4 336 78.5
12 VAMC Iron Mountain # MI 585 3 -0.59 1.37 1.7 97.80% 95.70% 283 82.9 282 79.5 152 76.8 151 67.8 145 72.2 284 90.4 284 53.8 230 87.9 278 81.6 281 82.8
12 William S. Middleton Memorial Veterans Hospital
Madison # WI 607 1b -0.01 0.58 1.2 98.00% 97.10% 478 80.6 477 77.7 287 69.7 330 68.6 282 73.5 477 83.0 471 54.8 423 90.7 469 77.1 475 82.2
12 Clement J. Zablocki VAMC Milwaukee # WI 695 1a -0.54 0.24 1.6 99.20% 96.40% 549 76.8 546 76.2 321 65.5 378 65.0 312 70.6 546 78.3 541 57.5 505 88.0 541 67.8 539 71.8
12 VAMC Tomah # WI 676 3 N/A N/A NA 98.40% 97.40% 115 74.4 115 75.4 74 na 66 na 66 na 114 87.6 115 57.8 99 na 115 77.9 115 72.5
Page 20 of 35
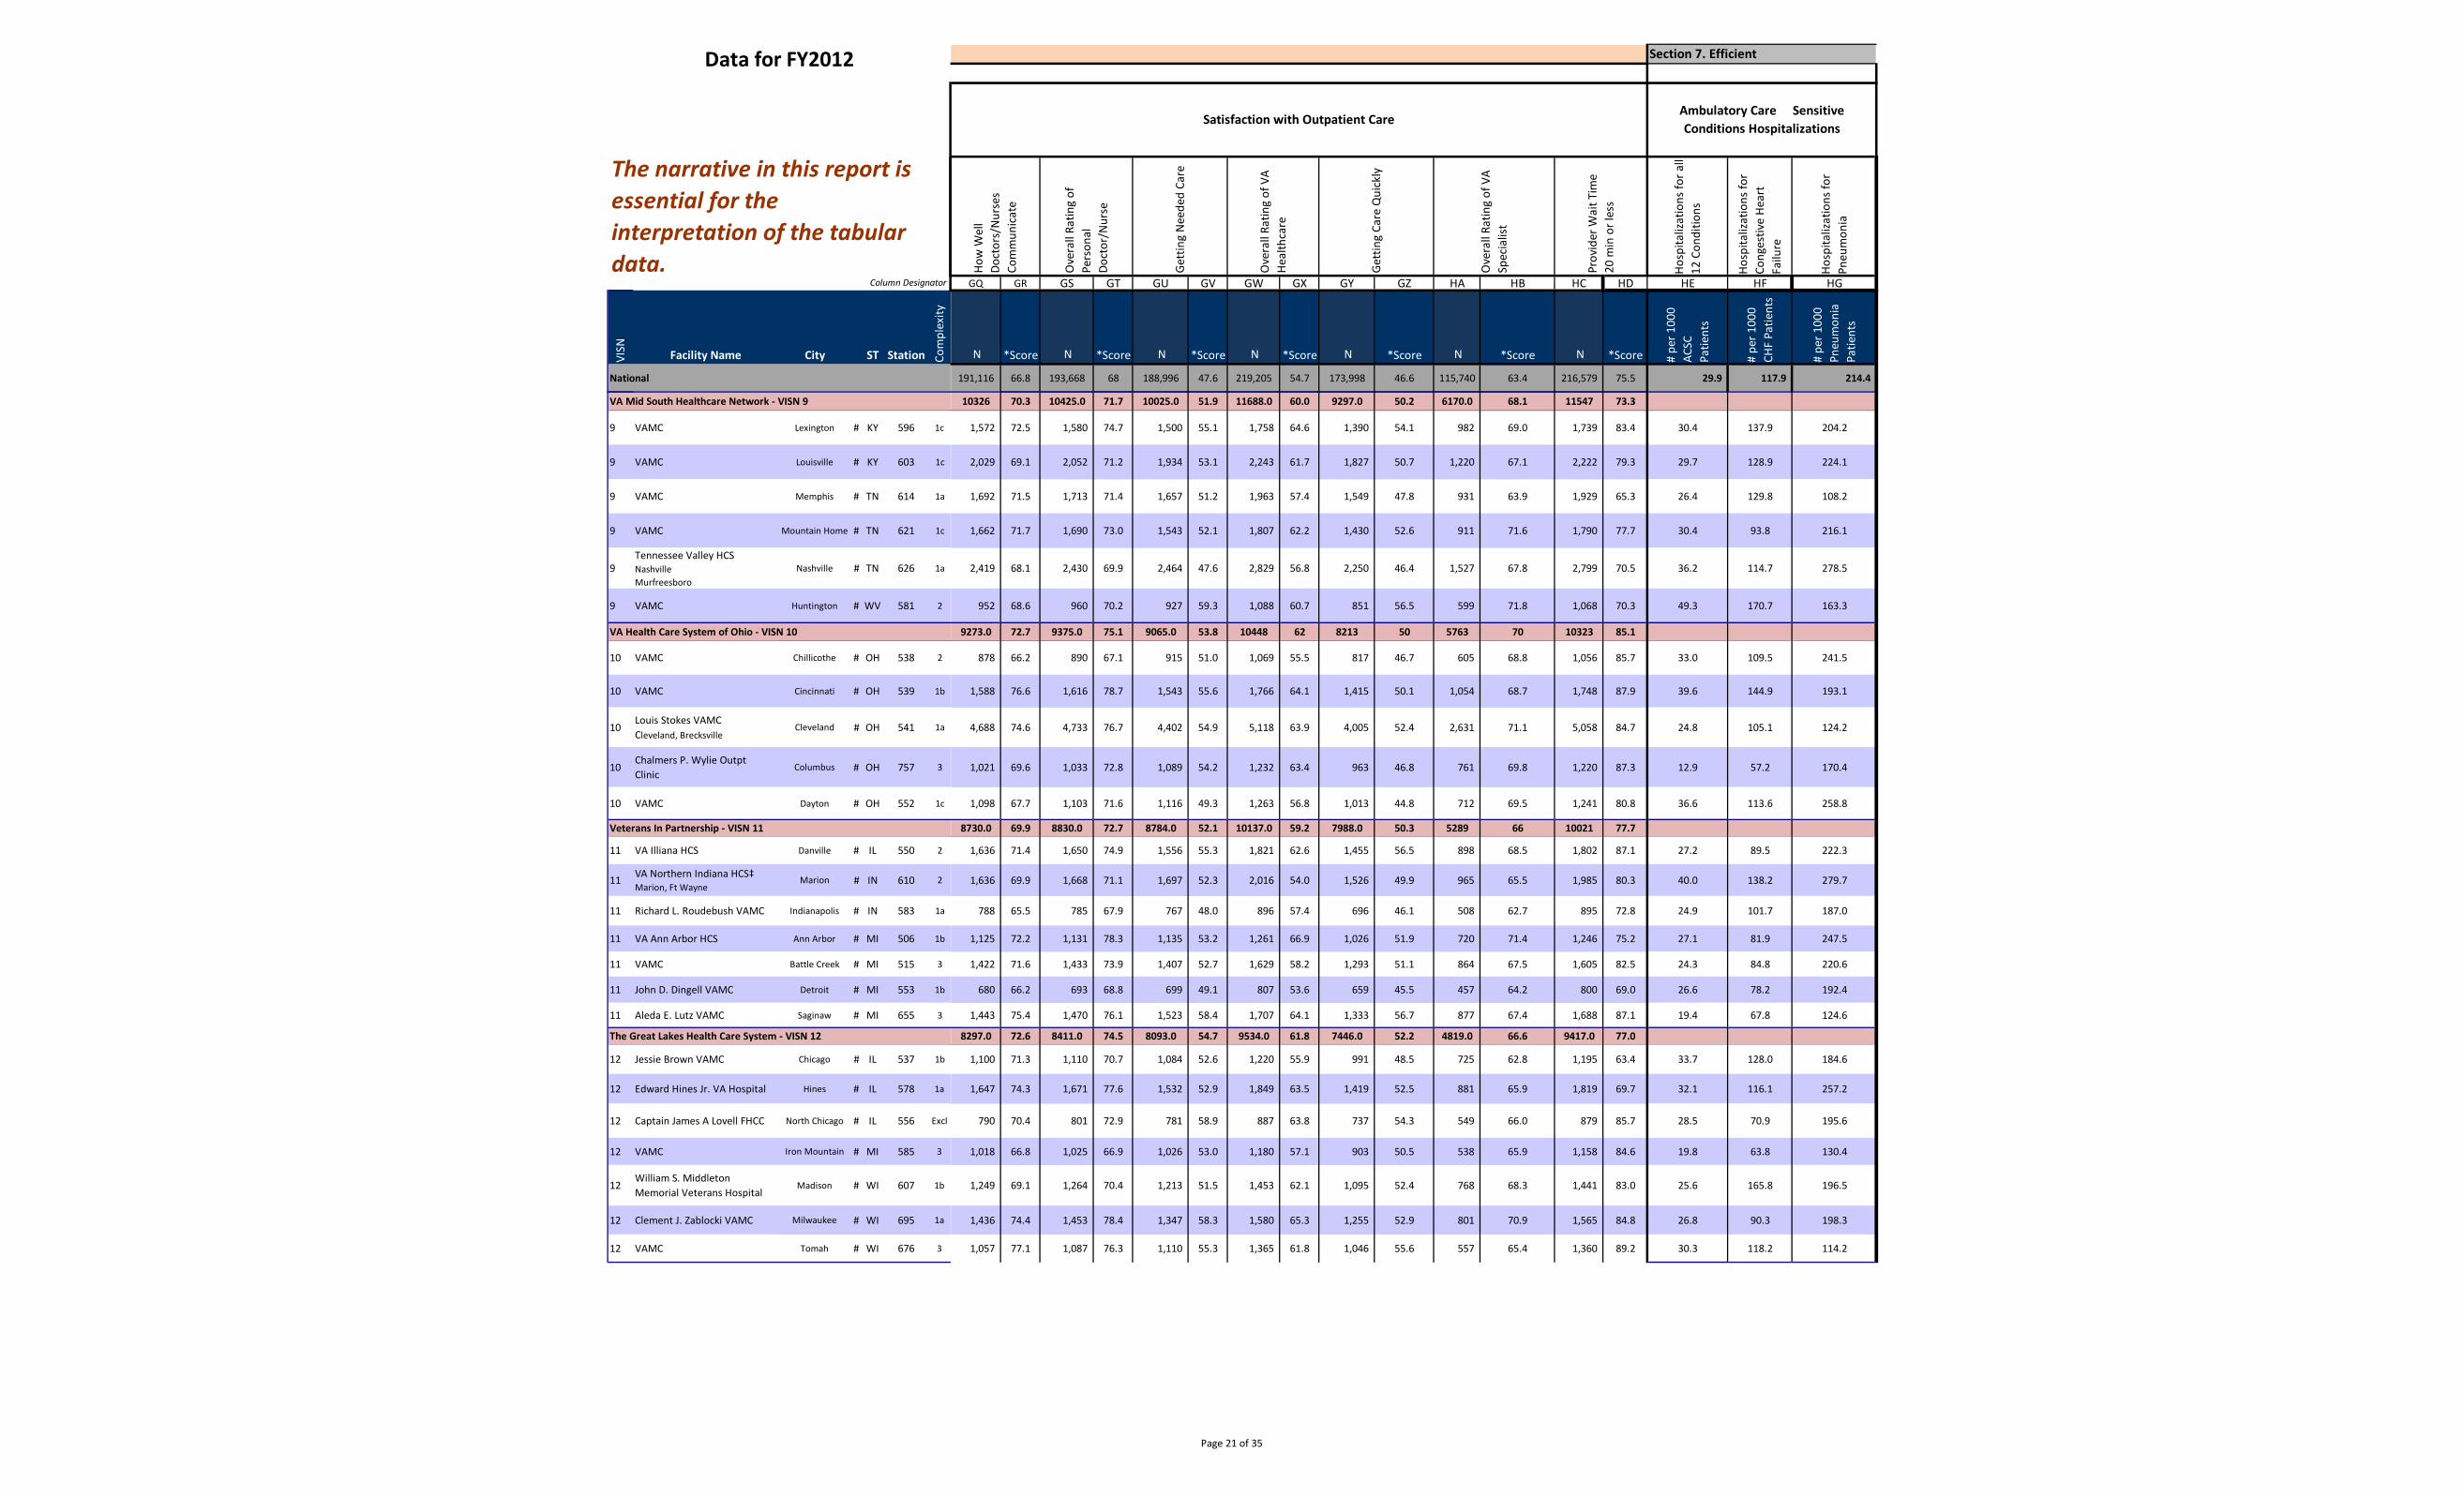
VISN Facility Name City ST Station Com
plex
ity
National
Data for FY2012
Column Designator
The narrative in this report is essential for the interpretation of the tabular data.
VA Mid South Healthcare Network - VISN 9
9 VAMC Lexington # KY 596 1c
9 VAMC Louisville # KY 603 1c
9 VAMC Memphis # TN 614 1a
9 VAMC Mountain Home # TN 621 1c
9 Tennessee Valley HCS Nashville Murfreesboro
Nashville # TN 626 1a
9 VAMC Huntington # WV 581 2
VA Health Care System of Ohio - VISN 10
10 VAMC Chillicothe # OH 538 2
10 VAMC Cincinnati # OH 539 1b
10 Louis Stokes VAMC Cleveland, Brecksville
Cleveland # OH 541 1a
10 Chalmers P. Wylie Outpt Clinic
Columbus # OH 757 3
10 VAMC Dayton # OH 552 1c
Veterans In Partnership - VISN 11
11 VA Illiana HCS Danville # IL 550 2
11 VA Northern Indiana HCS‡ Marion, Ft Wayne
Marion # IN 610 2
11 Richard L. Roudebush VAMC Indianapolis # IN 583 1a
11 VA Ann Arbor HCS Ann Arbor # MI 506 1b
11 VAMC Battle Creek # MI 515 3
11 John D. Dingell VAMC Detroit # MI 553 1b
11 Aleda E. Lutz VAMC Saginaw # MI 655 3
The Great Lakes Health Care System - VISN 12
12 Jessie Brown VAMC Chicago # IL 537 1b
12 Edward Hines Jr. VA Hospital Hines # IL 578 1a
12 Captain James A Lovell FHCC North Chicago # IL 556 Excl
12 VAMC Iron Mountain # MI 585 3
12 William S. Middleton Memorial Veterans Hospital
Madison # WI 607 1b
12 Clement J. Zablocki VAMC Milwaukee # WI 695 1a
12 VAMC Tomah # WI 676 3
Hosp
italiz
atio
ns fo
r all
12 C
ondi
tions
Hosp
italiz
atio
ns fo
rCo
nges
tive
Hear
t Fa
ilure
Hosp
italiz
atio
ns fo
rPn
eum
onia
GQ GR GS GT GU GV GW GX GY GZ HA HB HC HD HE HF HG
N *Score N *Score N *Score N *Score N *Score N *Score N *Score # pe
r 100
0 AC
SC
Patie
nts
# pe
r 100
0 CH
F Pa
tient
s
# pe
r 100
0 Pn
eum
onia
Patie
nts
191,116 66.8 193,668 68 188,996 47.6 219,205 54.7 173,998 46.6 115,740 63.4 216,579 75.5 29.9 117.9 214.4
Ambulatory Care Sensitive Conditions Hospitalizations
Prov
ider
Wai
t Tim
e20
min
or l
ess
How
Wel
l Do
ctor
s/N
urse
s Co
mm
unic
ate
Ove
rall
Ratin
g of
Pers
onal
Doct
or/N
urse
Gett
ing
Nee
ded
Care
Ove
rall
Ratin
g of
VA
Heal
thca
re
Gett
ing
Care
Qui
ckly
Satisfaction with Outpatient Care
Section 7. Efficient
Ove
rall
Ratin
g of
VA
Spec
ialis
t
10326 70.3 10425.0 71.7 10025.0 51.9 11688.0 60.0 9297.0 50.2 6170.0 68.1 11547 73.3
1,572 72.5 1,580 74.7 1,500 55.1 1,758 64.6 1,390 54.1 982 69.0 1,739 83.4 30.4 137.9 204.2
2,029 69.1 2,052 71.2 1,934 53.1 2,243 61.7 1,827 50.7 1,220 67.1 2,222 79.3 29.7 128.9 224.1
1,692 71.5 1,713 71.4 1,657 51.2 1,963 57.4 1,549 47.8 931 63.9 1,929 65.3 26.4 129.8 108.2
1,662 71.7 1,690 73.0 1,543 52.1 1,807 62.2 1,430 52.6 911 71.6 1,790 77.7 30.4 93.8 216.1
2,419 68.1 2,430 69.9 2,464 47.6 2,829 56.8 2,250 46.4 1,527 67.8 2,799 70.5 36.2 114.7 278.5
952 68.6 960 70.2 927 59.3 1,088 60.7 851 56.5 599 71.8 1,068 70.3 49.3 170.7 163.3
9273.0 72.7 9375.0 75.1 9065.0 53.8 10448 62 8213 50 5763 70 10323 85.1
878 66.2 890 67.1 915 51.0 1,069 55.5 817 46.7 605 68.8 1,056 85.7 33.0 109.5 241.5
1,588 76.6 1,616 78.7 1,543 55.6 1,766 64.1 1,415 50.1 1,054 68.7 1,748 87.9 39.6 144.9 193.1
4,688 74.6 4,733 76.7 4,402 54.9 5,118 63.9 4,005 52.4 2,631 71.1 5,058 84.7 24.8 105.1 124.2
1,021 69.6 1,033 72.8 1,089 54.2 1,232 63.4 963 46.8 761 69.8 1,220 87.3 12.9 57.2 170.4
1,098 67.7 1,103 71.6 1,116 49.3 1,263 56.8 1,013 44.8 712 69.5 1,241 80.8 36.6 113.6 258.8
8730.0 69.9 8830.0 72.7 8784.0 52.1 10137.0 59.2 7988.0 50.3 5289 66 10021 77.7
1,636 71.4 1,650 74.9 1,556 55.3 1,821 62.6 1,455 56.5 898 68.5 1,802 87.1 27.2 89.5 222.3
1,636 69.9 1,668 71.1 1,697 52.3 2,016 54.0 1,526 49.9 965 65.5 1,985 80.3 40.0 138.2 279.7
788 65.5 785 67.9 767 48.0 896 57.4 696 46.1 508 62.7 895 72.8 24.9 101.7 187.0
1,125 72.2 1,131 78.3 1,135 53.2 1,261 66.9 1,026 51.9 720 71.4 1,246 75.2 27.1 81.9 247.5
1,422 71.6 1,433 73.9 1,407 52.7 1,629 58.2 1,293 51.1 864 67.5 1,605 82.5 24.3 84.8 220.6
680 66.2 693 68.8 699 49.1 807 53.6 659 45.5 457 64.2 800 69.0 26.6 78.2 192.4
1,443 75.4 1,470 76.1 1,523 58.4 1,707 64.1 1,333 56.7 877 67.4 1,688 87.1 19.4 67.8 124.6
8297.0 72.6 8411.0 74.5 8093.0 54.7 9534.0 61.8 7446.0 52.2 4819.0 66.6 9417.0 77.0
1,100 71.3 1,110 70.7 1,084 52.6 1,220 55.9 991 48.5 725 62.8 1,195 63.4 33.7 128.0 184.6
1,647 74.3 1,671 77.6 1,532 52.9 1,849 63.5 1,419 52.5 881 65.9 1,819 69.7 32.1 116.1 257.2
790 70.4 801 72.9 781 58.9 887 63.8 737 54.3 549 66.0 879 85.7 28.5 70.9 195.6
1,018 66.8 1,025 66.9 1,026 53.0 1,180 57.1 903 50.5 538 65.9 1,158 84.6 19.8 63.8 130.4
1,249 69.1 1,264 70.4 1,213 51.5 1,453 62.1 1,095 52.4 768 68.3 1,441 83.0 25.6 165.8 196.5
1,436 74.4 1,453 78.4 1,347 58.3 1,580 65.3 1,255 52.9 801 70.9 1,565 84.8 26.8 90.3 198.3
1,057 77.1 1,087 76.3 1,110 55.3 1,365 61.8 1,046 55.6 557 65.4 1,360 89.2 30.3 118.2 114.2
Page 21 of 35
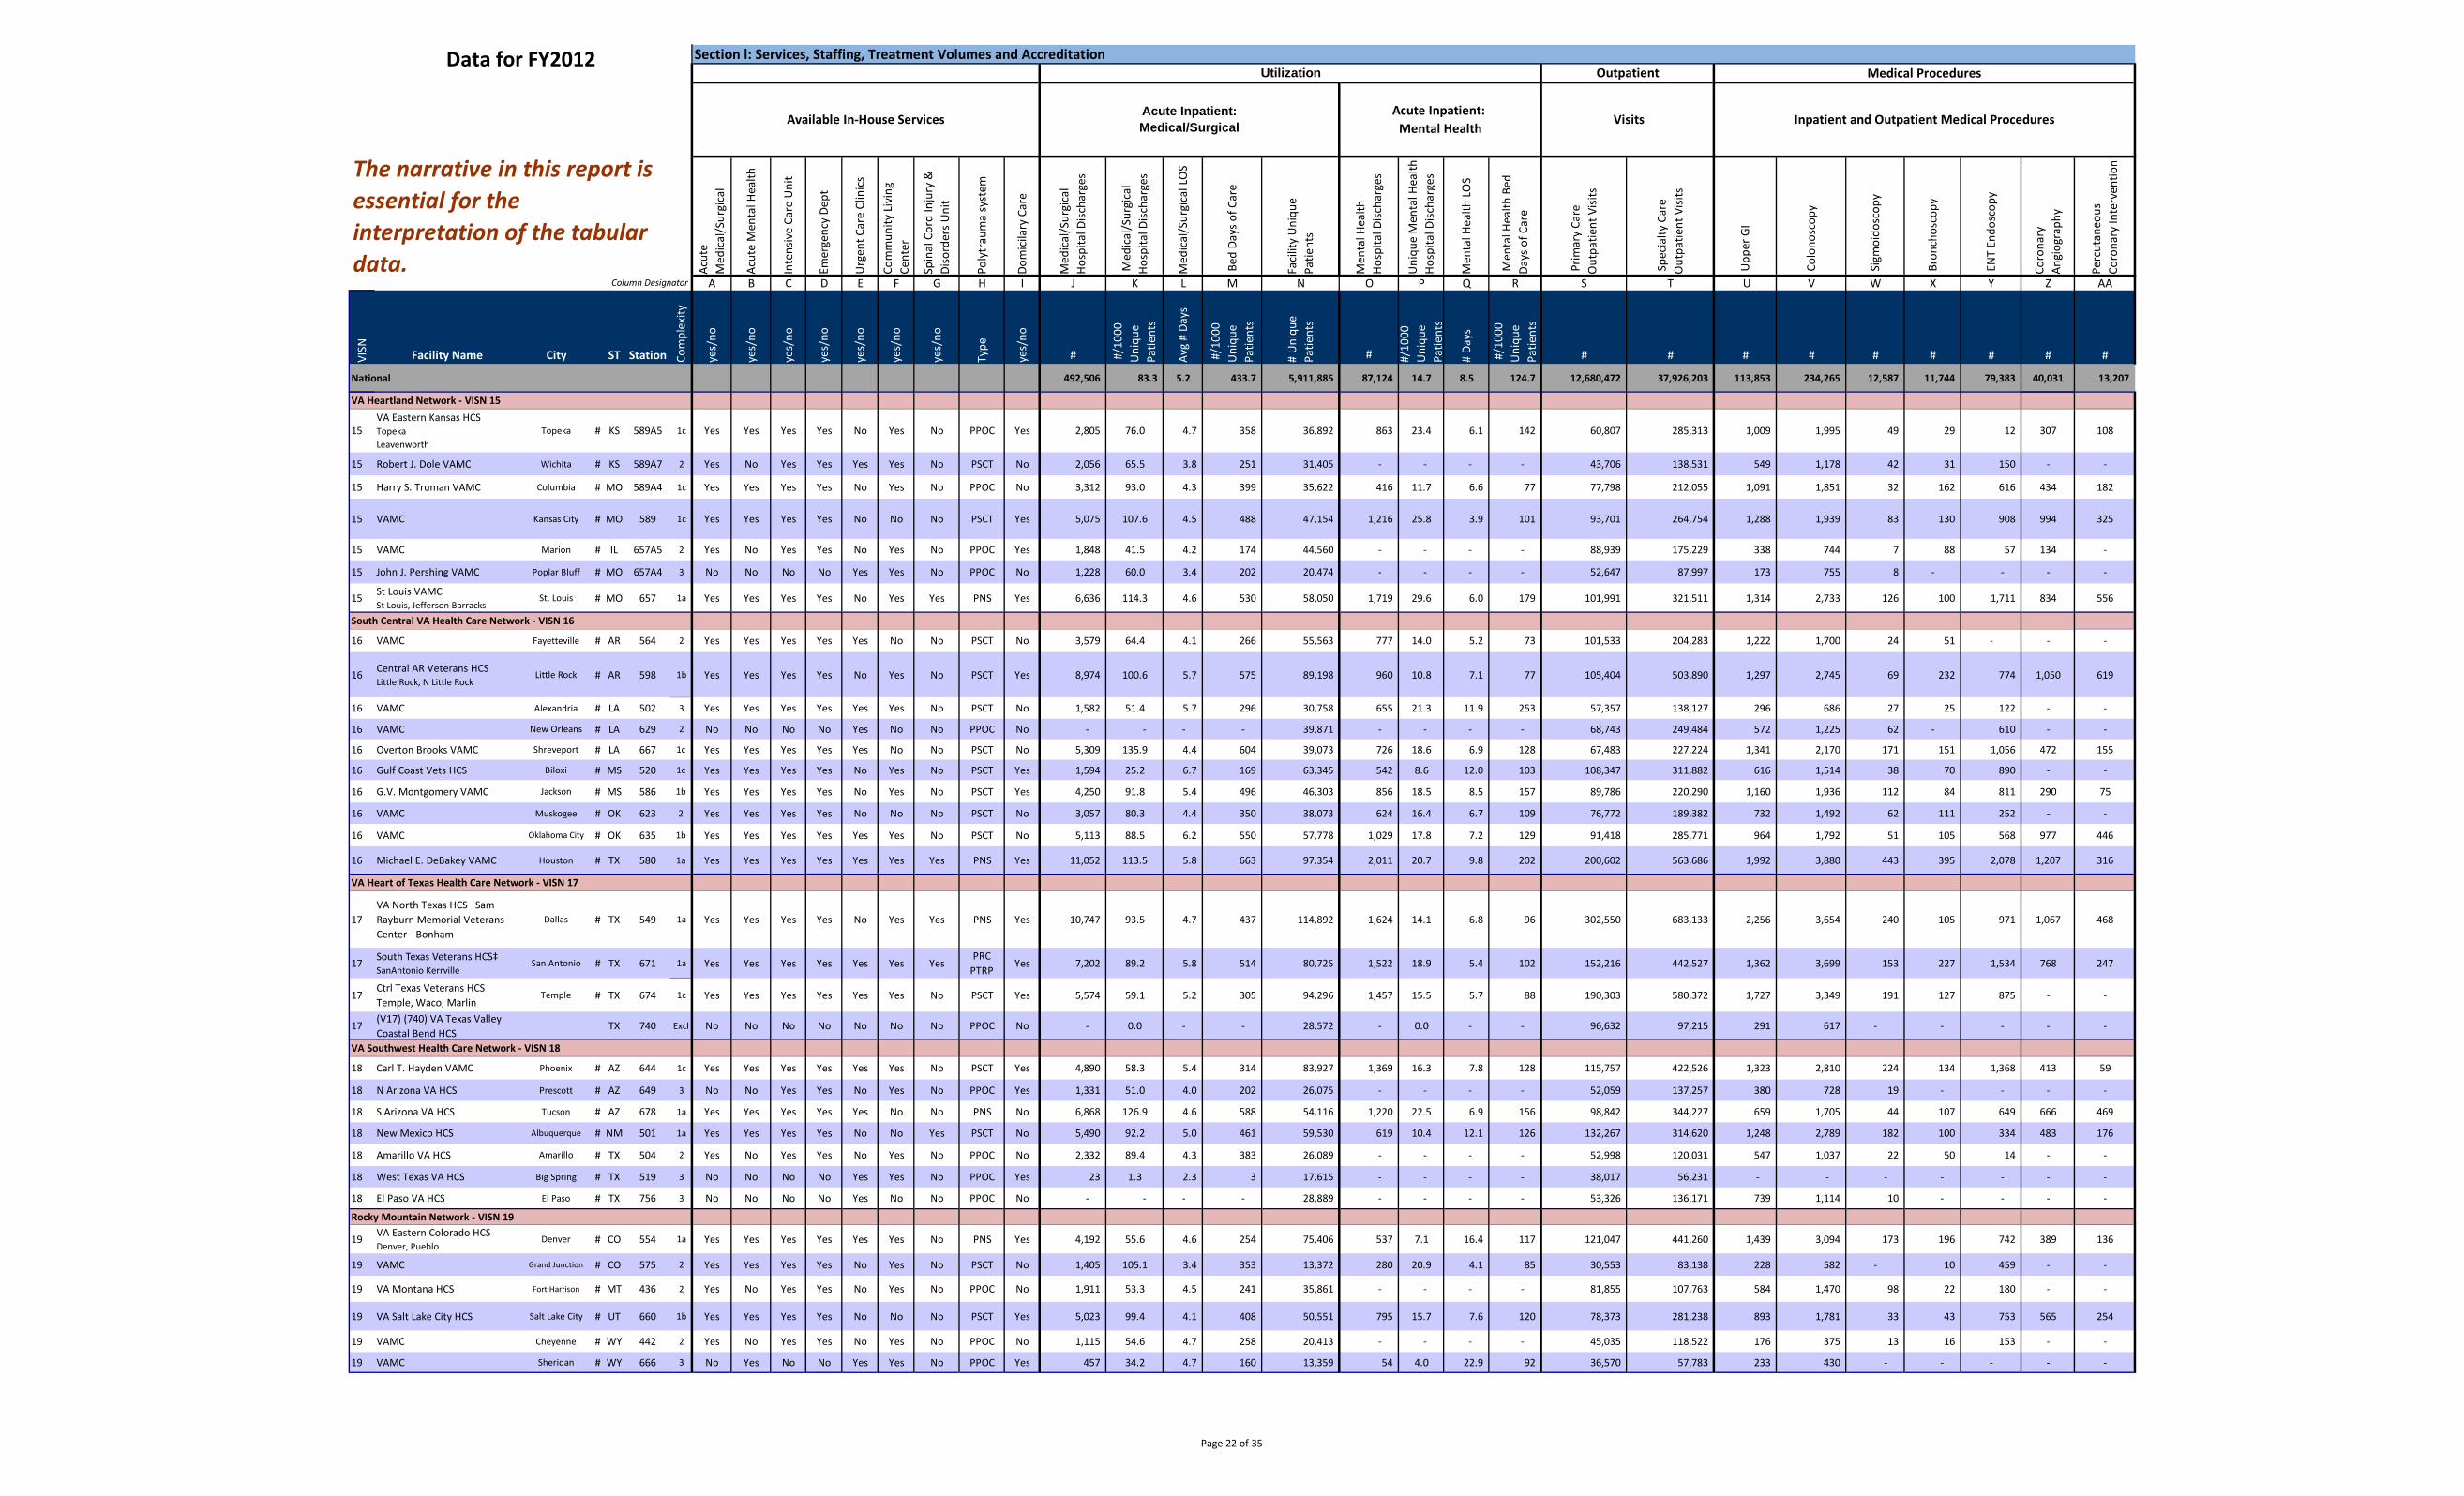
Data for FY2012
Column Designator
The narrative in this report is essential for the interpretation of the tabular data.
Section l: Services, Staffing, Treatment Volumes and Accreditation Utilization Outpatient Medical Procedures
Available In-House Services Acute Inpatient: Medical/Surgical
Acute Inpatient: Mental Health
Visits Inpatient and Outpatient Medical Procedures
Acut
eM
edic
al/S
urgi
cal
Acut
e M
enta
l Hea
lth
Inte
nsiv
e Ca
re U
nit
Emer
genc
y De
pt
Urg
ent C
are
Clin
ics
Com
mun
ity L
ivin
gCe
nter
Spin
al C
ord
Inju
ry &
Diso
rder
s Uni
t
Poly
trau
ma
syst
em
Dom
icila
ry C
are
Med
ical
/Sur
gica
l Ho
spita
l Disc
harg
es
Med
ical
/Sur
gica
lHo
spita
l Disc
harg
es
Med
ical
/Sur
gica
l LO
S
Bed
Day
s of C
are
Faci
lity
Uni
que
Patie
nts
Men
tal H
ealth
Hosp
ital D
ischa
rges
Uni
que
Men
tal H
ealth
Ho
spita
l Disc
harg
es
Men
tal H
ealth
LO
S
Men
tal H
ealth
Bed
Days
of C
are
Prim
ary
Care
Out
patie
nt V
isits
Spe
cial
ty C
are
Out
patie
nt V
isits
Upp
er G
I
Col
onos
copy
Sig
moi
dosc
opy
Bro
ncho
scop
y
EN
T En
dosc
opy
Coro
nary
Angi
ogra
phy
Perc
utan
eous
Coro
nary
Inte
rven
tion
A B C D E F G H I J K L M N O P Q R S T U V W X Y Z AA
VISN Facility Name City ST Station Com
plex
ity
yes/
no
yes/
no
yes/
no
yes/
no
yes/
no
yes/
no
yes/
no
Type
yes/
no
# #/1
000
Uni
que
Patie
nts
Avg
# Da
ys
#/1
000
Uni
que
Patie
nts
# U
niqu
ePa
tient
s
# #/10
00
Uni
que
Patie
nts
# Da
ys
#/1
000
Uni
que
Patie
nts
# # # # # # # # #
National 492,506 83.3 5.2 433.7 5,911,885 87,124 14.7 8.5 124.7 12,680,472 37,926,203 113,853 234,265 12,587 11,744 79,383 40,031 13,207
VA Heartland Network - VISN 15
15 VA Eastern Kansas HCS Topeka Leavenworth
Topeka # KS 589A5 1c Yes Yes Yes Yes No Yes No PPOC Yes 2,805 76.0 4.7 358 36,892 863 23.4 6.1 142 60,807 285,313 1,009 1,995 49 29 12 307 108
15 Robert J. Dole VAMC Wichita # KS 589A7 2 Yes No Yes Yes Yes Yes No PSCT No 2,056 65.5 3.8 251 31,405 - - - - 43,706 138,531 549 1,178 42 31 150 - -
15 Harry S. Truman VAMC Columbia # MO 589A4 1c Yes Yes Yes Yes No Yes No PPOC No 3,312 93.0 4.3 399 35,622 416 11.7 6.6 77 77,798 212,055 1,091 1,851 32 162 616 434 182
15 VAMC Kansas City # MO 589 1c Yes Yes Yes Yes No No No PSCT Yes 5,075 107.6 4.5 488 47,154 1,216 25.8 3.9 101 93,701 264,754 1,288 1,939 83 130 908 994 325
15 VAMC Marion # IL 657A5 2 Yes No Yes Yes No Yes No PPOC Yes 1,848 41.5 4.2 174 44,560 - - - - 88,939 175,229 338 744 7 88 57 134 -
15 John J. Pershing VAMC Poplar Bluff # MO 657A4 3 No No No No Yes Yes No PPOC No 1,228 60.0 3.4 202 20,474 - - - - 52,647 87,997 173 755 8 - - - -
15 St Louis VAMC St Louis, Jefferson Barracks
St. Louis # MO 657 1a Yes Yes Yes Yes No Yes Yes PNS Yes 6,636 114.3 4.6 530 58,050 1,719 29.6 6.0 179 101,991 321,511 1,314 2,733 126 100 1,711 834 556
South Central VA Health Care Network - VISN 16
16 VAMC Fayetteville # AR 564 2 Yes Yes Yes Yes Yes No No PSCT No 3,579 64.4 4.1 266 55,563 777 14.0 5.2 73 101,533 204,283 1,222 1,700 24 51 - - -
16 Central AR Veterans HCS Little Rock, N Little Rock
Little Rock # AR 598 1b Yes Yes Yes Yes No Yes No PSCT Yes 8,974 100.6 5.7 575 89,198 960 10.8 7.1 77 105,404 503,890 1,297 2,745 69 232 774 1,050 619
16 VAMC Alexandria # LA 502 3 Yes Yes Yes Yes Yes Yes No PSCT No 1,582 51.4 5.7 296 30,758 655 21.3 11.9 253 57,357 138,127 296 686 27 25 122 - -
16 VAMC New Orleans # LA 629 2 No No No No Yes No No PPOC No - - - - 39,871 - - - - 68,743 249,484 572 1,225 62 - 610 - -
16 Overton Brooks VAMC Shreveport # LA 667 1c Yes Yes Yes Yes Yes No No PSCT No 5,309 135.9 4.4 604 39,073 726 18.6 6.9 128 67,483 227,224 1,341 2,170 171 151 1,056 472 155
16 Gulf Coast Vets HCS Biloxi # MS 520 1c Yes Yes Yes Yes No Yes No PSCT Yes 1,594 25.2 6.7 169 63,345 542 8.6 12.0 103 108,347 311,882 616 1,514 38 70 890 - -
16 G.V. Montgomery VAMC Jackson # MS 586 1b Yes Yes Yes Yes No Yes No PSCT Yes 4,250 91.8 5.4 496 46,303 856 18.5 8.5 157 89,786 220,290 1,160 1,936 112 84 811 290 75
16 VAMC Muskogee # OK 623 2 Yes Yes Yes Yes No No No PSCT No 3,057 80.3 4.4 350 38,073 624 16.4 6.7 109 76,772 189,382 732 1,492 62 111 252 - -
16 VAMC Oklahoma City # OK 635 1b Yes Yes Yes Yes Yes Yes No PSCT No 5,113 88.5 6.2 550 57,778 1,029 17.8 7.2 129 91,418 285,771 964 1,792 51 105 568 977 446
16 Michael E. DeBakey VAMC Houston # TX 580 1a Yes Yes Yes Yes Yes Yes Yes PNS Yes 11,052 113.5 5.8 663 97,354 2,011 20.7 9.8 202 200,602 563,686 1,992 3,880 443 395 2,078 1,207 316
VA Heart of Texas Health Care Network - VISN 17
17 VA North Texas HCS Sam Rayburn Memorial Veterans Center - Bonham
Dallas # TX 549 1a Yes Yes Yes Yes No Yes Yes PNS Yes 10,747 93.5 4.7 437 114,892 1,624 14.1 6.8 96 302,550 683,133 2,256 3,654 240 105 971 1,067 468
17 South Texas Veterans HCS‡ SanAntonio Kerrville
San Antonio # TX 671 1a Yes Yes Yes Yes Yes Yes Yes PRC
PTRP Yes 7,202 89.2 5.8 514 80,725 1,522 18.9 5.4 102 152,216 442,527 1,362 3,699 153 227 1,534 768 247
17 Ctrl Texas Veterans HCS Temple, Waco, Marlin
Temple # TX 674 1c Yes Yes Yes Yes Yes Yes No PSCT Yes 5,574 59.1 5.2 305 94,296 1,457 15.5 5.7 88 190,303 580,372 1,727 3,349 191 127 875 - -
17 (V17) (740) VA Texas Valley Coastal Bend HCS
TX 740 Excl No No No No No No No PPOC No - 0.0 - - 28,572 - 0.0 - - 96,632 97,215 291 617 - - - - -
VA Southwest Health Care Network - VISN 18
18 Carl T. Hayden VAMC Phoenix # AZ 644 1c Yes Yes Yes Yes Yes Yes No PSCT Yes 4,890 58.3 5.4 314 83,927 1,369 16.3 7.8 128 115,757 422,526 1,323 2,810 224 134 1,368 413 59
18 N Arizona VA HCS Prescott # AZ 649 3 No No Yes Yes No Yes No PPOC Yes 1,331 51.0 4.0 202 26,075 - - - - 52,059 137,257 380 728 19 - - - -
18 S Arizona VA HCS Tucson # AZ 678 1a Yes Yes Yes Yes Yes No No PNS No 6,868 126.9 4.6 588 54,116 1,220 22.5 6.9 156 98,842 344,227 659 1,705 44 107 649 666 469
18 New Mexico HCS Albuquerque # NM 501 1a Yes Yes Yes Yes No No Yes PSCT No 5,490 92.2 5.0 461 59,530 619 10.4 12.1 126 132,267 314,620 1,248 2,789 182 100 334 483 176
18 Amarillo VA HCS Amarillo # TX 504 2 Yes No Yes Yes No Yes No PPOC No 2,332 89.4 4.3 383 26,089 - - - - 52,998 120,031 547 1,037 22 50 14 - -
18 West Texas VA HCS Big Spring # TX 519 3 No No No No Yes Yes No PPOC Yes 23 1.3 2.3 3 17,615 - - - - 38,017 56,231 - - - - - - -
18 El Paso VA HCS El Paso # TX 756 3 No No No No Yes No No PPOC No - - - - 28,889 - - - - 53,326 136,171 739 1,114 10 - - - -
Rocky Mountain Network - VISN 19
19 VA Eastern Colorado HCS Denver, Pueblo
Denver # CO 554 1a Yes Yes Yes Yes Yes Yes No PNS Yes 4,192 55.6 4.6 254 75,406 537 7.1 16.4 117 121,047 441,260 1,439 3,094 173 196 742 389 136
19 VAMC Grand Junction # CO 575 2 Yes Yes Yes Yes No Yes No PSCT No 1,405 105.1 3.4 353 13,372 280 20.9 4.1 85 30,553 83,138 228 582 - 10 459 - -
19 VA Montana HCS Fort Harrison # MT 436 2 Yes No Yes Yes No Yes No PPOC No 1,911 53.3 4.5 241 35,861 - - - - 81,855 107,763 584 1,470 98 22 180 - -
19 VA Salt Lake City HCS Salt Lake City # UT 660 1b Yes Yes Yes Yes No No No PSCT Yes 5,023 99.4 4.1 408 50,551 795 15.7 7.6 120 78,373 281,238 893 1,781 33 43 753 565 254
19 VAMC Cheyenne # WY 442 2 Yes No Yes Yes No Yes No PPOC No 1,115 54.6 4.7 258 20,413 - - - - 45,035 118,522 176 375 13 16 153 - -
19 VAMC Sheridan # WY 666 3 No Yes No No Yes Yes No PPOC Yes 457 34.2 4.7 160 13,359 54 4.0 22.9 92 36,570 57,783 233 430 - - - - -
Page 22 of 35
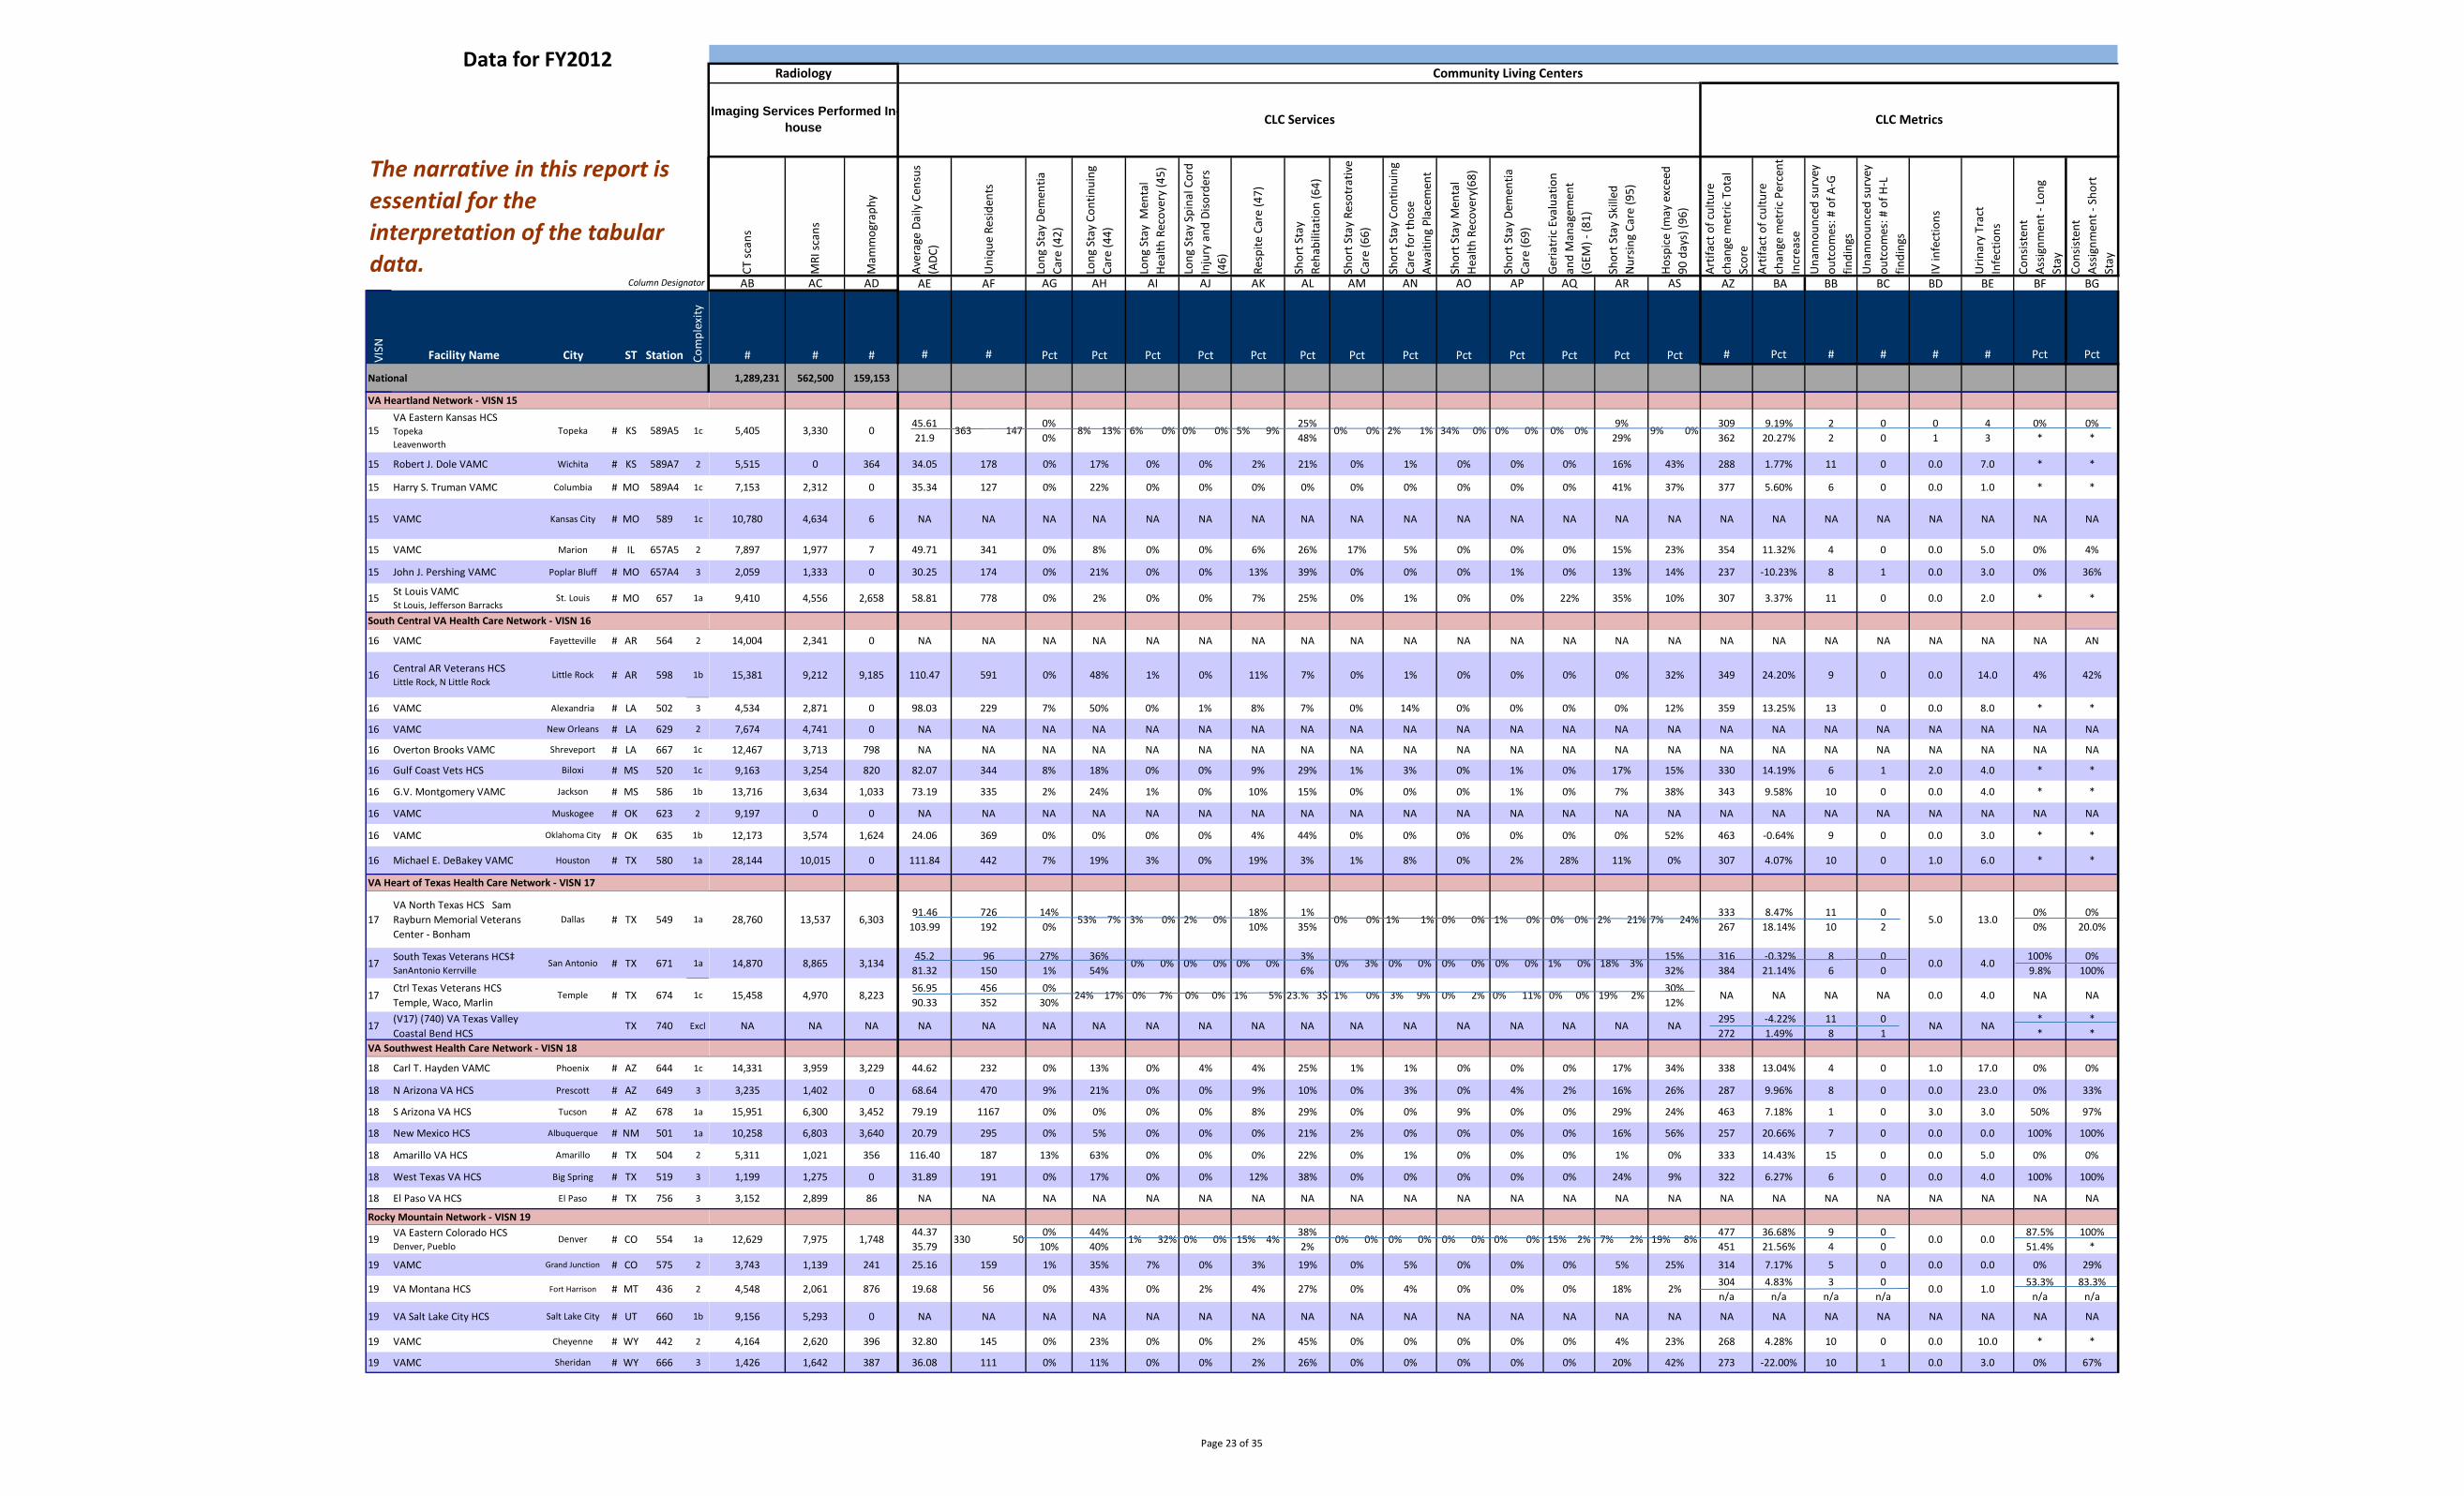
VISN Facility Name City ST Station Com
plex
ity
National
Data for FY2012
Column Designator
The narrative in this report is essential for the interpretation of the tabular data.
VA Heartland Network - VISN 15
15 VA Eastern Kansas HCS Topeka Leavenworth
Topeka # KS 589A5 1c
15 Robert J. Dole VAMC Wichita # KS 589A7 2
15 Harry S. Truman VAMC Columbia # MO 589A4 1c
15 VAMC Kansas City # MO 589 1c
15 VAMC Marion # IL 657A5 2
15 John J. Pershing VAMC Poplar Bluff # MO 657A4 3
15 St Louis VAMC St Louis, Jefferson Barracks
St. Louis # MO 657 1a
South Central VA Health Care Network - VISN 16
16 VAMC Fayetteville # AR 564 2
16 Central AR Veterans HCS Little Rock, N Little Rock
Little Rock # AR 598 1b
16 VAMC Alexandria # LA 502 3
16 VAMC New Orleans # LA 629 2
16 Overton Brooks VAMC Shreveport # LA 667 1c
16 Gulf Coast Vets HCS Biloxi # MS 520 1c
16 G.V. Montgomery VAMC Jackson # MS 586 1b
16 VAMC Muskogee # OK 623 2
16 VAMC Oklahoma City # OK 635 1b
16 Michael E. DeBakey VAMC Houston # TX 580 1a
VA Heart of Texas Health Care Network - VISN 17
17 VA North Texas HCS Sam Rayburn Memorial Veterans Center - Bonham
Dallas # TX 549 1a
17 South Texas Veterans HCS‡ SanAntonio Kerrville
San Antonio # TX 671 1a
17 Ctrl Texas Veterans HCS Temple, Waco, Marlin
Temple # TX 674 1c
17 (V17) (740) VA Texas Valley Coastal Bend HCS
TX 740 Excl
VA Southwest Health Care Network - VISN 18
18 Carl T. Hayden VAMC Phoenix # AZ 644 1c
18 N Arizona VA HCS Prescott # AZ 649 3
18 S Arizona VA HCS Tucson # AZ 678 1a
18 New Mexico HCS Albuquerque # NM 501 1a
18 Amarillo VA HCS Amarillo # TX 504 2
18 West Texas VA HCS Big Spring # TX 519 3
18 El Paso VA HCS El Paso # TX 756 3
Rocky Mountain Network - VISN 19
19 VA Eastern Colorado HCS Denver, Pueblo
Denver # CO 554 1a
19 VAMC Grand Junction # CO 575 2
19 VA Montana HCS Fort Harrison # MT 436 2
19 VA Salt Lake City HCS Salt Lake City # UT 660 1b
19 VAMC Cheyenne # WY 442 2
19 VAMC Sheridan # WY 666 3
CT s
cans
MRI
scan
s
Mam
mog
raph
y
Aver
age
Daily
Cen
sus
(ADC
)
Uni
que
Resid
ents
Long
Sta
y De
men
tiaCa
re (4
2)
Long
Sta
y Co
ntin
uing
Care
(44)
Long
Sta
y M
enta
lHe
alth
Rec
over
y (4
5)
Long
Sta
y Sp
inal
Cor
d In
jury
and
Diso
rder
s(4
6)
Resp
ite C
are
(47)
Shor
t Sta
yRe
habi
litat
ion
(64)
Shor
t Sta
y Re
sotr
ativ
eCa
re (6
6)
Shor
t Sta
y Co
ntin
uing
Care
for t
hose
Awai
ting
Plac
emen
t
Shor
t Sta
y M
enta
lHe
alth
Rec
over
y(68
)
Shor
t Sta
y De
men
tiaCa
re (6
9)
Geria
tric
Eva
luat
ion
and
Man
agem
ent
(GEM
) - (8
1)
Shor
t Sta
y Sk
illed
Nur
sing
Care
(95)
Hosp
ice
(may
exc
eed
90 d
ays)
(96)
Artif
act o
f cul
ture
chan
ge m
etric
Tot
alSc
ore
Artif
act o
f cul
ture
chan
ge m
etric
Per
cent
In
crea
seU
nann
ounc
ed su
rvey
outc
omes
: # o
f A-G
findi
ngs
Una
nnou
nced
surv
eyou
tcom
es: #
of H
-Lfin
ding
s
IV in
fect
ions
Urin
ary
Trac
tIn
fect
ions
Cons
isten
t As
signm
ent -
Lon
gSt
ayCo
nsist
ent
Assig
nmen
t -Sh
ort
Stay
AB AC AD AE AF AG AH AI AJ AK AL AM AN AO AP AQ AR AS AZ BA BB BC BD BE BF BG
# # # # # Pct Pct Pct Pct Pct Pct Pct Pct Pct Pct Pct Pct Pct # Pct # # # # Pct Pct
1,289,231 562,500 159,153
CLC Services
Radiology Community Living Centers
CLC Metrics Imaging Services Performed In-house
5,405 3,330 0 45.61 21.9
363 147 0% 0%
8% 13% 6% 0% 0% 0% 5% 9% 25% 48%
0% 0% 2% 1% 34% 0% 0% 0% 0% 0% 9%
29% 9% 0%
309 362
9.19% 20.27%
2 2
0 0
0 1
4 3
0% *
0% *
5,515 0 364 34.05 178 0% 17% 0% 0% 2% 21% 0% 1% 0% 0% 0% 16% 43% 288 1.77% 11 0 0.0 7.0 * *
7,153 2,312 0 35.34 127 0% 22% 0% 0% 0% 0% 0% 0% 0% 0% 0% 41% 37% 377 5.60% 6 0 0.0 1.0 * *
10,780 4,634 6 NA NA NA NA NA NA NA NA NA NA NA NA NA NA NA NA NA NA NA NA NA NA NA
7,897 1,977 7 49.71 341 0% 8% 0% 0% 6% 26% 17% 5% 0% 0% 0% 15% 23% 354 11.32% 4 0 0.0 5.0 0% 4%
2,059 1,333 0 30.25 174 0% 21% 0% 0% 13% 39% 0% 0% 0% 1% 0% 13% 14% 237 -10.23% 8 1 0.0 3.0 0% 36%
9,410 4,556 2,658 58.81 778 0% 2% 0% 0% 7% 25% 0% 1% 0% 0% 22% 35% 10% 307 3.37% 11 0 0.0 2.0 * *
14,004 2,341 0 NA NA NA NA NA NA NA NA NA NA NA NA NA NA NA NA NA NA NA NA NA NA AN
15,381 9,212 9,185 110.47 591 0% 48% 1% 0% 11% 7% 0% 1% 0% 0% 0% 0% 32% 349 24.20% 9 0 0.0 14.0 4% 42%
4,534 2,871 0 98.03 229 7% 50% 0% 1% 8% 7% 0% 14% 0% 0% 0% 0% 12% 359 13.25% 13 0 0.0 8.0 * *
7,674 4,741 0 NA NA NA NA NA NA NA NA NA NA NA NA NA NA NA NA NA NA NA NA NA NA NA
12,467 3,713 798 NA NA NA NA NA NA NA NA NA NA NA NA NA NA NA NA NA NA NA NA NA NA NA
9,163 3,254 820 82.07 344 8% 18% 0% 0% 9% 29% 1% 3% 0% 1% 0% 17% 15% 330 14.19% 6 1 2.0 4.0 * *
13,716 3,634 1,033 73.19 335 2% 24% 1% 0% 10% 15% 0% 0% 0% 1% 0% 7% 38% 343 9.58% 10 0 0.0 4.0 * *
9,197 0 0 NA NA NA NA NA NA NA NA NA NA NA NA NA NA NA NA NA NA NA NA NA NA NA
12,173 3,574 1,624 24.06 369 0% 0% 0% 0% 4% 44% 0% 0% 0% 0% 0% 0% 52% 463 -0.64% 9 0 0.0 3.0 * *
28,144 10,015 0 111.84 442 7% 19% 3% 0% 19% 3% 1% 8% 0% 2% 28% 11% 0% 307 4.07% 10 0 1.0 6.0 * *
28,760 13,537 6,303 91.46
103.99 726 192
14% 0%
53% 7% 3% 0% 2% 0% 18% 10%
1% 35%
0% 0% 1% 1% 0% 0% 1% 0% 0% 0% 2% 21% 7% 24% 333 267
8.47% 18.14%
11 10
0 2
5.0 13.0 0% 0%
0% 20.0%
14,870 8,865 3,134 45.2
81.32 96
150 27% 1%
36% 54%
0% 0% 0% 0% 0% 0% 3% 6%
0% 3% 0% 0% 0% 0% 0% 0% 1% 0% 18% 3% 15% 32%
316 384
-0.32% 21.14%
8 6
0 0
0.0 4.0 100% 9.8%
0% 100%
15,458 4,970 8,223 56.95 90.33
456 352
0% 30%
24% 17% 0% 7% 0% 0% 1% 5% 23.% 3$ 1% 0% 3% 9% 0% 2% 0% 11% 0% 0% 19% 2% 30% 12%
NA NA NA NA 0.0 4.0 NA NA
NA NA NA NA NA NA NA NA NA NA NA NA NA NA NA NA NA NA 295 272
-4.22% 1.49%
11 8
0 1
NA NA * *
* *
14,331 3,959 3,229 44.62 232 0% 13% 0% 4% 4% 25% 1% 1% 0% 0% 0% 17% 34% 338 13.04% 4 0 1.0 17.0 0% 0%
3,235 1,402 0 68.64 470 9% 21% 0% 0% 9% 10% 0% 3% 0% 4% 2% 16% 26% 287 9.96% 8 0 0.0 23.0 0% 33%
15,951 6,300 3,452 79.19 1167 0% 0% 0% 0% 8% 29% 0% 0% 9% 0% 0% 29% 24% 463 7.18% 1 0 3.0 3.0 50% 97%
10,258 6,803 3,640 20.79 295 0% 5% 0% 0% 0% 21% 2% 0% 0% 0% 0% 16% 56% 257 20.66% 7 0 0.0 0.0 100% 100%
5,311 1,021 356 116.40 187 13% 63% 0% 0% 0% 22% 0% 1% 0% 0% 0% 1% 0% 333 14.43% 15 0 0.0 5.0 0% 0%
1,199 1,275 0 31.89 191 0% 17% 0% 0% 12% 38% 0% 0% 0% 0% 0% 24% 9% 322 6.27% 6 0 0.0 4.0 100% 100%
3,152 2,899 86 NA NA NA NA NA NA NA NA NA NA NA NA NA NA NA NA NA NA NA NA NA NA NA
12,629 7,975 1,748 44.37 35.79
330 50 0%
10% 44% 40%
1% 32% 0% 0% 15% 4% 38% 2%
0% 0% 0% 0% 0% 0% 0% 0% 15% 2% 7% 2% 19% 8% 477 451
36.68% 21.56%
9 4
0 0
0.0 0.0 87.5% 51.4%
100% *
3,743 1,139 241 25.16 159 1% 35% 7% 0% 3% 19% 0% 5% 0% 0% 0% 5% 25% 314 7.17% 5 0 0.0 0.0 0% 29%
4,548 2,061 876 19.68 56 0% 43% 0% 2% 4% 27% 0% 4% 0% 0% 0% 18% 2% 304 n/a
4.83% n/a
3 n/a
0 n/a
0.0 1.0 53.3% n/a
83.3% n/a
9,156 5,293 0 NA NA NA NA NA NA NA NA NA NA NA NA NA NA NA NA NA NA NA NA NA NA NA
4,164 2,620 396 32.80 145 0% 23% 0% 0% 2% 45% 0% 0% 0% 0% 0% 4% 23% 268 4.28% 10 0 0.0 10.0 * *
1,426 1,642 387 36.08 111 0% 11% 0% 0% 2% 26% 0% 0% 0% 0% 0% 20% 42% 273 -22.00% 10 1 0.0 3.0 0% 67%
Page 23 of 35
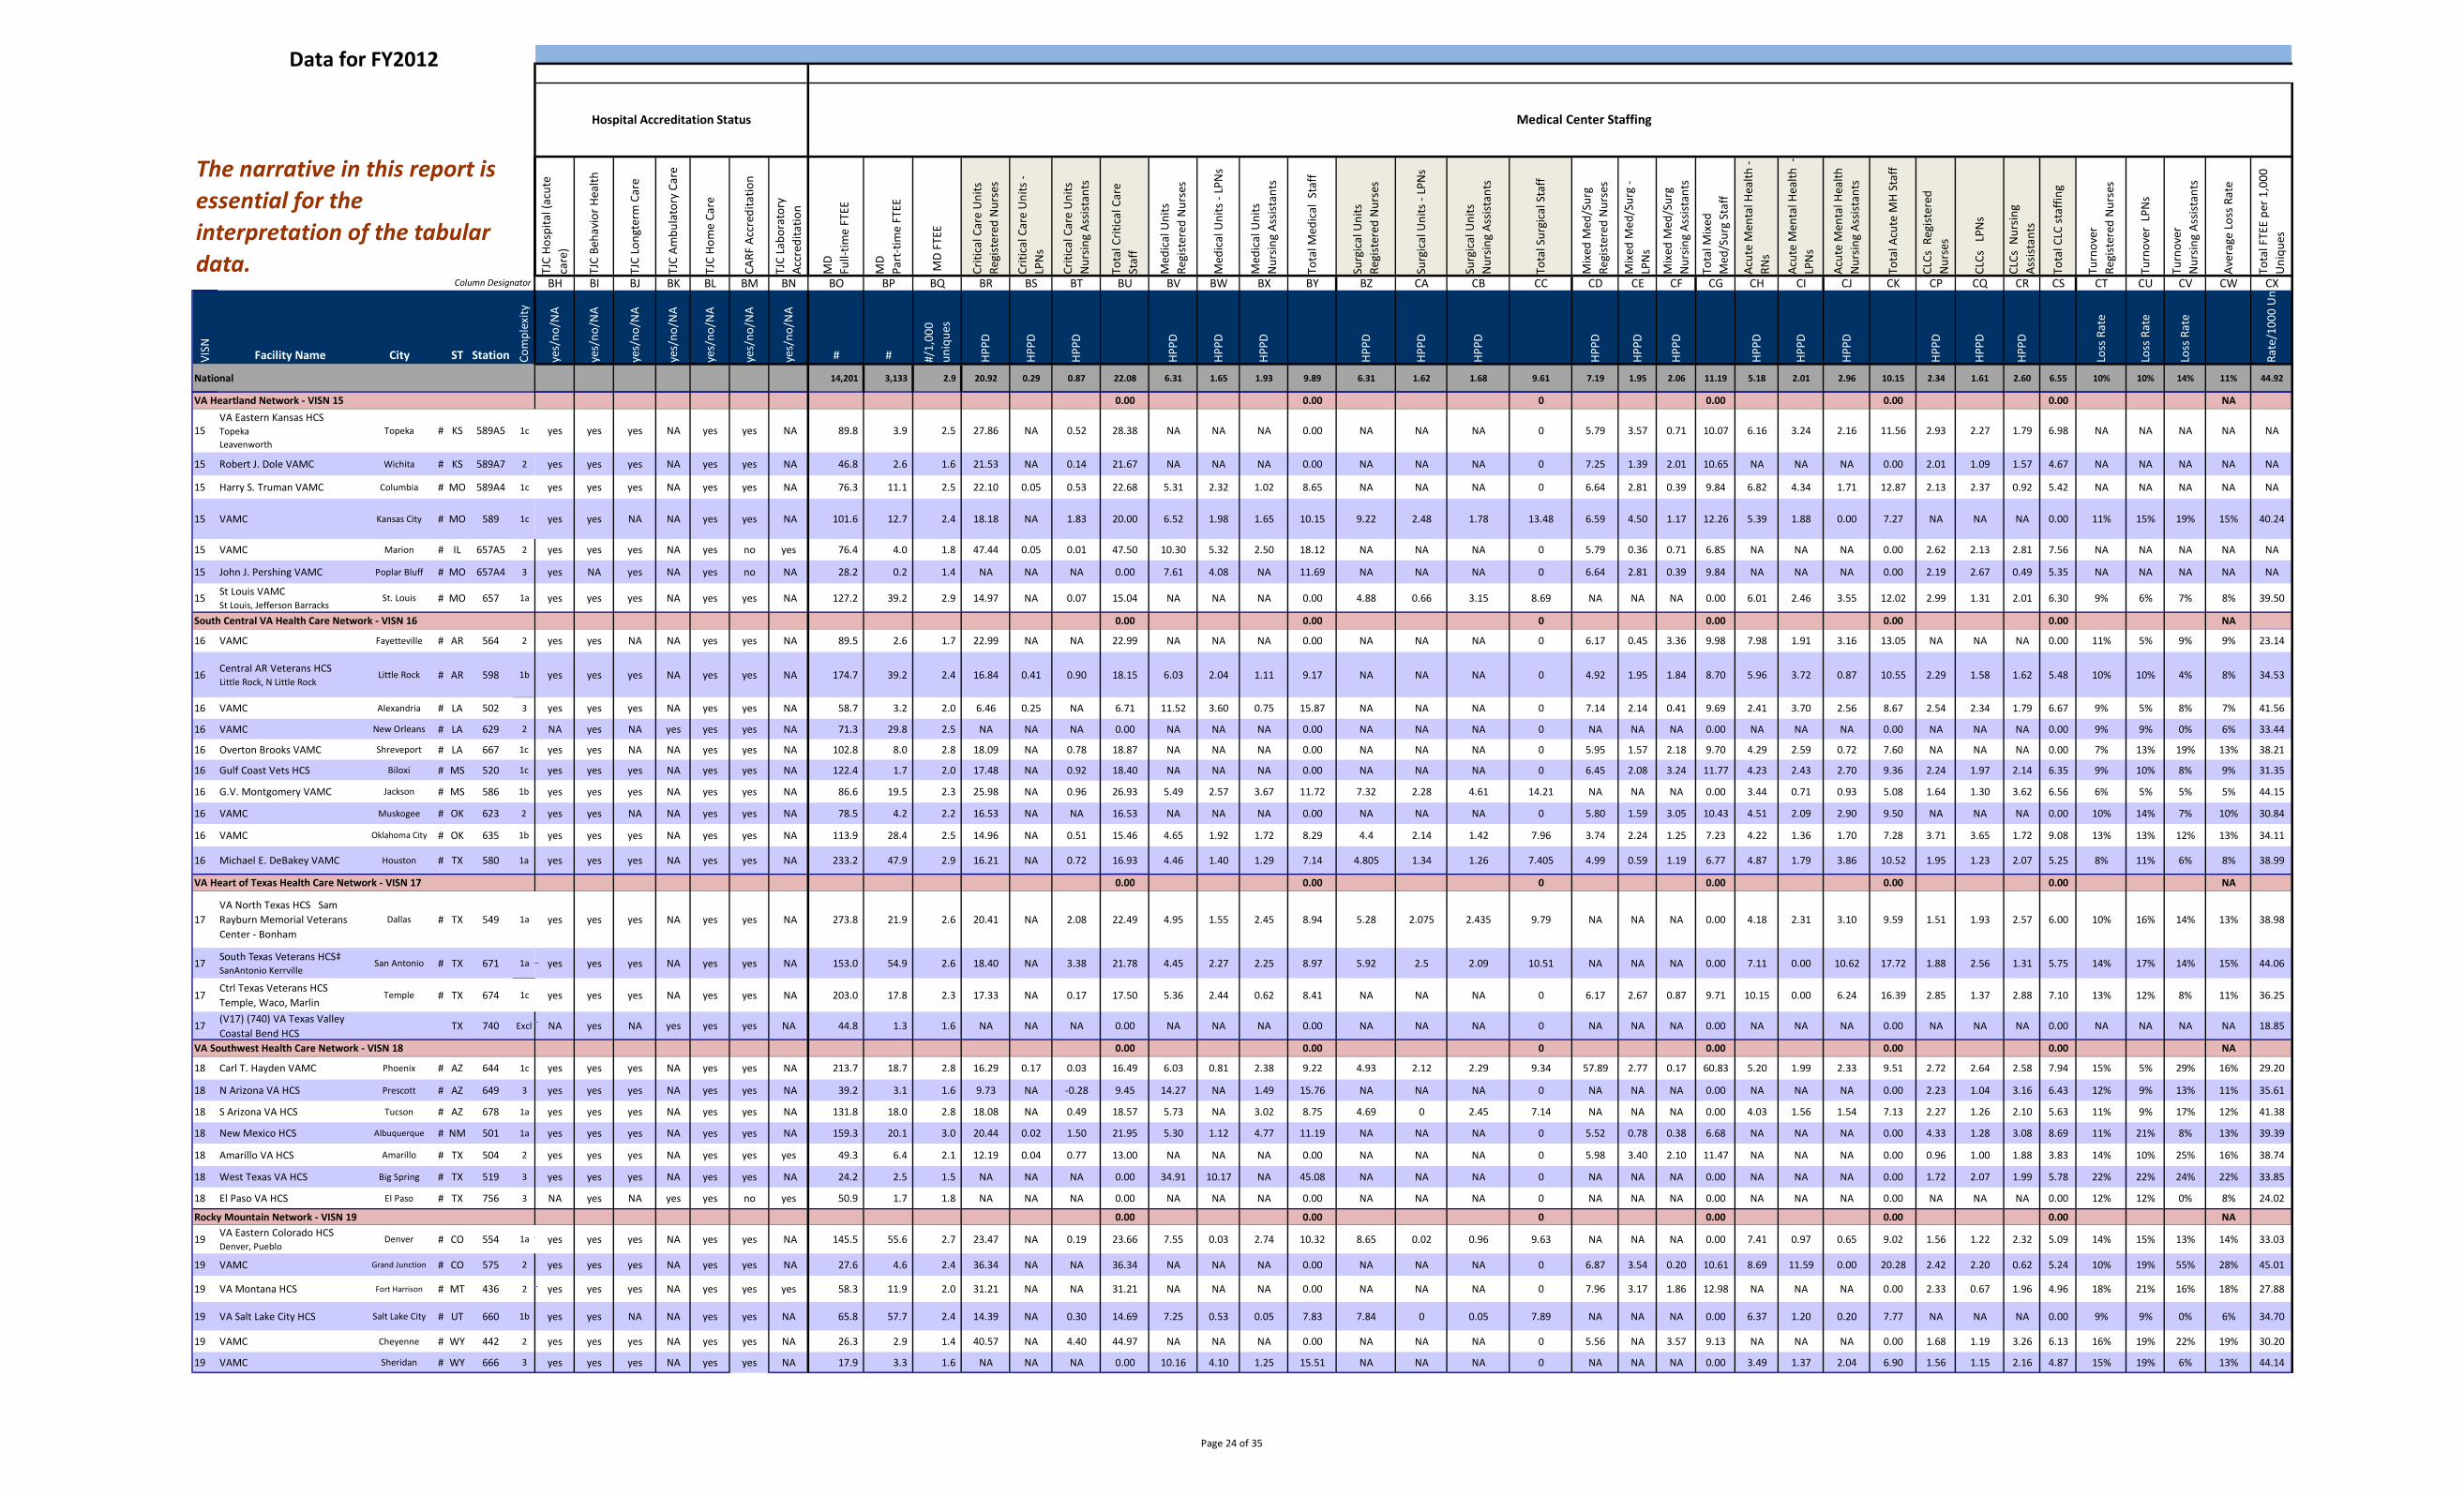
Data for FY2012
Column Designator
The narrative in this report is essential for the interpretation of the tabular data.
Hospital Accreditation Status Medical Center Staffing
TJC
Hosp
ital (
acut
eca
re)
TJC
Beha
vior
Hea
lth
TJC
Long
term
Car
e
TJC
Ambu
lato
ry C
are
TJC
Hom
e Ca
re
CARF
Acc
redi
tatio
n
TJC
Labo
rato
ryAc
cred
itatio
n
MD
Full-
time
FTEE
MD
Part
-tim
e FT
EE
MD
FTEE
Criti
cal C
are
Uni
tsRe
gist
ered
Nur
ses
Criti
cal C
are
Uni
ts -
LPN
s
Criti
cal C
are
Uni
tsN
ursin
g As
sista
nts
Tota
l Crit
ical
Car
eSt
aff
Med
ical
Uni
tsRe
gist
ered
Nur
ses
Med
ical
Uni
ts -
LPN
s
Med
ical
Uni
tsN
ursin
g As
sista
nts
Tota
l Med
ical
Sta
ff
Surg
ical
Uni
tsRe
gist
ered
Nur
ses
Surg
ical
Uni
ts -
LPN
s
Surg
ical
Uni
tsN
ursin
g As
sista
nts
Tota
l Sur
gica
l Sta
ff
Mix
ed M
ed/S
urg
Regi
ster
ed N
urse
s
Mix
ed M
ed/S
urg
-LP
Ns
Mix
ed M
ed/S
urg
Nur
sing
Assis
tant
s
Tota
l Mix
edM
ed/S
urg
Staf
f
Acut
e M
enta
l Hea
lth -
RNs
Acut
e M
enta
l Hea
lth -
LPN
s
Acut
e M
enta
l Hea
lthN
ursin
g As
sista
nts
Tota
l Acu
te M
H St
aff
CLCs
Reg
ister
edN
urse
s
CLCs
LPN
s
CLCs
Nur
sing
Assis
tant
s
Tota
l CLC
staf
fing
Turn
over
Re
gist
ered
Nur
ses
Turn
over
LPN
s
Turn
over
N
ursin
g As
sista
nts
Aver
age
Loss
Rat
e
Tota
l FTE
E pe
r 1,0
00
Uni
ques
BH BI BJ BK BL BM BN BO BP BQ BR BS BT BU BV BW BX BY BZ CA CB CC CD CE CF CG CH CI CJ CK CP CQ CR CS CT CU CV CW CX
VISN Facility Name City ST Station Com
plex
ity
yes/
no/N
A
yes/
no/N
A
yes/
no/N
A
yes/
no/N
A
yes/
no/N
A
yes/
no/N
A
yes/
no/N
A
# # #/1,
000
uniq
ues
HPPD
HPPD
HPPD
HPPD
HPPD
HPPD
HPPD
HPPD
HPPD
HPPD
HPPD
HPPD
HPPD
HPPD
HPPD
HPPD
HPPD
HPPD
Loss
Rat
e
Loss
Rat
e
Loss
Rat
e
Rate
/100
0 U
n
National 14,201 3,133 2.9 20.92 0.29 0.87 22.08 6.31 1.65 1.93 9.89 6.31 1.62 1.68 9.61 7.19 1.95 2.06 11.19 5.18 2.01 2.96 10.15 2.34 1.61 2.60 6.55 10% 10% 14% 11% 44.92
VA Heartland Network - VISN 15 0.00 0.00 0 0.00 0.00 0.00 NA
15 VA Eastern Kansas HCS Topeka Leavenworth
Topeka # KS 589A5 1c yes yes yes NA yes yes NA 89.8 3.9 2.5 27.86 NA 0.52 28.38 NA NA NA 0.00 NA NA NA 0 5.79 3.57 0.71 10.07 6.16 3.24 2.16 11.56 2.93 2.27 1.79 6.98 NA NA NA NA NA
15 Robert J. Dole VAMC Wichita # KS 589A7 2 yes yes yes NA yes yes NA 46.8 2.6 1.6 21.53 NA 0.14 21.67 NA NA NA 0.00 NA NA NA 0 7.25 1.39 2.01 10.65 NA NA NA 0.00 2.01 1.09 1.57 4.67 NA NA NA NA NA
15 Harry S. Truman VAMC Columbia # MO 589A4 1c yes yes yes NA yes yes NA 76.3 11.1 2.5 22.10 0.05 0.53 22.68 5.31 2.32 1.02 8.65 NA NA NA 0 6.64 2.81 0.39 9.84 6.82 4.34 1.71 12.87 2.13 2.37 0.92 5.42 NA NA NA NA NA
15 VAMC Kansas City # MO 589 1c yes yes NA NA yes yes NA 101.6 12.7 2.4 18.18 NA 1.83 20.00 6.52 1.98 1.65 10.15 9.22 2.48 1.78 13.48 6.59 4.50 1.17 12.26 5.39 1.88 0.00 7.27 NA NA NA 0.00 11% 15% 19% 15% 40.24
15 VAMC Marion # IL 657A5 2 yes yes yes NA yes no yes 76.4 4.0 1.8 47.44 0.05 0.01 47.50 10.30 5.32 2.50 18.12 NA NA NA 0 5.79 0.36 0.71 6.85 NA NA NA 0.00 2.62 2.13 2.81 7.56 NA NA NA NA NA
15 John J. Pershing VAMC Poplar Bluff # MO 657A4 3 yes NA yes NA yes no NA 28.2 0.2 1.4 NA NA NA 0.00 7.61 4.08 NA 11.69 NA NA NA 0 6.64 2.81 0.39 9.84 NA NA NA 0.00 2.19 2.67 0.49 5.35 NA NA NA NA NA
15 St Louis VAMC St Louis, Jefferson Barracks
St. Louis # MO 657 1a yes yes yes NA yes yes NA 127.2 39.2 2.9 14.97 NA 0.07 15.04 NA NA NA 0.00 4.88 0.66 3.15 8.69 NA NA NA 0.00 6.01 2.46 3.55 12.02 2.99 1.31 2.01 6.30 9% 6% 7% 8% 39.50
South Central VA Health Care Network - VISN 16 0.00 0.00 0 0.00 0.00 0.00 NA
16 VAMC Fayetteville # AR 564 2 yes yes NA NA yes yes NA 89.5 2.6 1.7 22.99 NA NA 22.99 NA NA NA 0.00 NA NA NA 0 6.17 0.45 3.36 9.98 7.98 1.91 3.16 13.05 NA NA NA 0.00 11% 5% 9% 9% 23.14
16 Central AR Veterans HCS Little Rock, N Little Rock
Little Rock # AR 598 1b yes yes yes NA yes yes NA 174.7 39.2 2.4 16.84 0.41 0.90 18.15 6.03 2.04 1.11 9.17 NA NA NA 0 4.92 1.95 1.84 8.70 5.96 3.72 0.87 10.55 2.29 1.58 1.62 5.48 10% 10% 4% 8% 34.53
16 VAMC Alexandria # LA 502 3 yes yes yes NA yes yes NA 58.7 3.2 2.0 6.46 0.25 NA 6.71 11.52 3.60 0.75 15.87 NA NA NA 0 7.14 2.14 0.41 9.69 2.41 3.70 2.56 8.67 2.54 2.34 1.79 6.67 9% 5% 8% 7% 41.56
16 VAMC New Orleans # LA 629 2 NA yes NA yes yes yes NA 71.3 29.8 2.5 NA NA NA 0.00 NA NA NA 0.00 NA NA NA 0 NA NA NA 0.00 NA NA NA 0.00 NA NA NA 0.00 9% 9% 0% 6% 33.44
16 Overton Brooks VAMC Shreveport # LA 667 1c yes yes NA NA yes yes NA 102.8 8.0 2.8 18.09 NA 0.78 18.87 NA NA NA 0.00 NA NA NA 0 5.95 1.57 2.18 9.70 4.29 2.59 0.72 7.60 NA NA NA 0.00 7% 13% 19% 13% 38.21
16 Gulf Coast Vets HCS Biloxi # MS 520 1c yes yes yes NA yes yes NA 122.4 1.7 2.0 17.48 NA 0.92 18.40 NA NA NA 0.00 NA NA NA 0 6.45 2.08 3.24 11.77 4.23 2.43 2.70 9.36 2.24 1.97 2.14 6.35 9% 10% 8% 9% 31.35
16 G.V. Montgomery VAMC Jackson # MS 586 1b yes yes yes NA yes yes NA 86.6 19.5 2.3 25.98 NA 0.96 26.93 5.49 2.57 3.67 11.72 7.32 2.28 4.61 14.21 NA NA NA 0.00 3.44 0.71 0.93 5.08 1.64 1.30 3.62 6.56 6% 5% 5% 5% 44.15
16 VAMC Muskogee # OK 623 2 yes yes NA NA yes yes NA 78.5 4.2 2.2 16.53 NA NA 16.53 NA NA NA 0.00 NA NA NA 0 5.80 1.59 3.05 10.43 4.51 2.09 2.90 9.50 NA NA NA 0.00 10% 14% 7% 10% 30.84
16 VAMC Oklahoma City # OK 635 1b yes yes yes NA yes yes NA 113.9 28.4 2.5 14.96 NA 0.51 15.46 4.65 1.92 1.72 8.29 4.4 2.14 1.42 7.96 3.74 2.24 1.25 7.23 4.22 1.36 1.70 7.28 3.71 3.65 1.72 9.08 13% 13% 12% 13% 34.11
16 Michael E. DeBakey VAMC Houston # TX 580 1a yes yes yes NA yes yes NA 233.2 47.9 2.9 16.21 NA 0.72 16.93 4.46 1.40 1.29 7.14 4.805 1.34 1.26 7.405 4.99 0.59 1.19 6.77 4.87 1.79 3.86 10.52 1.95 1.23 2.07 5.25 8% 11% 6% 8% 38.99
VA Heart of Texas Health Care Network - VISN 17 0.00 0.00 0 0.00 0.00 0.00 NA
17 VA North Texas HCS Sam Rayburn Memorial Veterans Center - Bonham
Dallas # TX 549 1a yes yes yes NA yes yes NA 273.8 21.9 2.6 20.41 NA 2.08 22.49 4.95 1.55 2.45 8.94 5.28 2.075 2.435 9.79 NA NA NA 0.00 4.18 2.31 3.10 9.59 1.51 1.93 2.57 6.00 10% 16% 14% 13% 38.98
17 South Texas Veterans HCS‡ SanAntonio Kerrville
San Antonio # TX 671 1a yes yes yes NA yes yes NA 153.0 54.9 2.6 18.40 NA 3.38 21.78 4.45 2.27 2.25 8.97 5.92 2.5 2.09 10.51 NA NA NA 0.00 7.11 0.00 10.62 17.72 1.88 2.56 1.31 5.75 14% 17% 14% 15% 44.06
17 Ctrl Texas Veterans HCS Temple, Waco, Marlin
Temple # TX 674 1c yes yes yes NA yes yes NA 203.0 17.8 2.3 17.33 NA 0.17 17.50 5.36 2.44 0.62 8.41 NA NA NA 0 6.17 2.67 0.87 9.71 10.15 0.00 6.24 16.39 2.85 1.37 2.88 7.10 13% 12% 8% 11% 36.25
17 (V17) (740) VA Texas Valley Coastal Bend HCS
TX 740 Excl NA yes NA yes yes yes NA 44.8 1.3 1.6 NA NA NA 0.00 NA NA NA 0.00 NA NA NA 0 NA NA NA 0.00 NA NA NA 0.00 NA NA NA 0.00 NA NA NA NA 18.85
VA Southwest Health Care Network - VISN 18 0.00 0.00 0 0.00 0.00 0.00 NA
18 Carl T. Hayden VAMC Phoenix # AZ 644 1c yes yes yes NA yes yes NA 213.7 18.7 2.8 16.29 0.17 0.03 16.49 6.03 0.81 2.38 9.22 4.93 2.12 2.29 9.34 57.89 2.77 0.17 60.83 5.20 1.99 2.33 9.51 2.72 2.64 2.58 7.94 15% 5% 29% 16% 29.20
18 N Arizona VA HCS Prescott # AZ 649 3 yes yes yes NA yes yes NA 39.2 3.1 1.6 9.73 NA -0.28 9.45 14.27 NA 1.49 15.76 NA NA NA 0 NA NA NA 0.00 NA NA NA 0.00 2.23 1.04 3.16 6.43 12% 9% 13% 11% 35.61
18 S Arizona VA HCS Tucson # AZ 678 1a yes yes yes NA yes yes NA 131.8 18.0 2.8 18.08 NA 0.49 18.57 5.73 NA 3.02 8.75 4.69 0 2.45 7.14 NA NA NA 0.00 4.03 1.56 1.54 7.13 2.27 1.26 2.10 5.63 11% 9% 17% 12% 41.38
18 New Mexico HCS Albuquerque # NM 501 1a yes yes yes NA yes yes NA 159.3 20.1 3.0 20.44 0.02 1.50 21.95 5.30 1.12 4.77 11.19 NA NA NA 0 5.52 0.78 0.38 6.68 NA NA NA 0.00 4.33 1.28 3.08 8.69 11% 21% 8% 13% 39.39
18 Amarillo VA HCS Amarillo # TX 504 2 yes yes yes NA yes yes yes 49.3 6.4 2.1 12.19 0.04 0.77 13.00 NA NA NA 0.00 NA NA NA 0 5.98 3.40 2.10 11.47 NA NA NA 0.00 0.96 1.00 1.88 3.83 14% 10% 25% 16% 38.74
18 West Texas VA HCS Big Spring # TX 519 3 yes yes yes NA yes yes NA 24.2 2.5 1.5 NA NA NA 0.00 34.91 10.17 NA 45.08 NA NA NA 0 NA NA NA 0.00 NA NA NA 0.00 1.72 2.07 1.99 5.78 22% 22% 24% 22% 33.85
18 El Paso VA HCS El Paso # TX 756 3 NA yes NA yes yes no yes 50.9 1.7 1.8 NA NA NA 0.00 NA NA NA 0.00 NA NA NA 0 NA NA NA 0.00 NA NA NA 0.00 NA NA NA 0.00 12% 12% 0% 8% 24.02
Rocky Mountain Network - VISN 19 0.00 0.00 0 0.00 0.00 0.00 NA
19 VA Eastern Colorado HCS Denver, Pueblo
Denver # CO 554 1a yes yes yes NA yes yes NA 145.5 55.6 2.7 23.47 NA 0.19 23.66 7.55 0.03 2.74 10.32 8.65 0.02 0.96 9.63 NA NA NA 0.00 7.41 0.97 0.65 9.02 1.56 1.22 2.32 5.09 14% 15% 13% 14% 33.03
19 VAMC Grand Junction # CO 575 2 yes yes yes NA yes yes NA 27.6 4.6 2.4 36.34 NA NA 36.34 NA NA NA 0.00 NA NA NA 0 6.87 3.54 0.20 10.61 8.69 11.59 0.00 20.28 2.42 2.20 0.62 5.24 10% 19% 55% 28% 45.01
19 VA Montana HCS Fort Harrison # MT 436 2 yes yes yes NA yes yes yes 58.3 11.9 2.0 31.21 NA NA 31.21 NA NA NA 0.00 NA NA NA 0 7.96 3.17 1.86 12.98 NA NA NA 0.00 2.33 0.67 1.96 4.96 18% 21% 16% 18% 27.88
19 VA Salt Lake City HCS Salt Lake City # UT 660 1b yes yes NA NA yes yes NA 65.8 57.7 2.4 14.39 NA 0.30 14.69 7.25 0.53 0.05 7.83 7.84 0 0.05 7.89 NA NA NA 0.00 6.37 1.20 0.20 7.77 NA NA NA 0.00 9% 9% 0% 6% 34.70
19 VAMC Cheyenne # WY 442 2 yes yes yes NA yes yes NA 26.3 2.9 1.4 40.57 NA 4.40 44.97 NA NA NA 0.00 NA NA NA 0 5.56 NA 3.57 9.13 NA NA NA 0.00 1.68 1.19 3.26 6.13 16% 19% 22% 19% 30.20
19 VAMC Sheridan # WY 666 3 yes yes yes NA yes yes NA 17.9 3.3 1.6 NA NA NA 0.00 10.16 4.10 1.25 15.51 NA NA NA 0 NA NA NA 0.00 3.49 1.37 2.04 6.90 1.56 1.15 2.16 4.87 15% 19% 6% 13% 44.14
Page 24 of 35
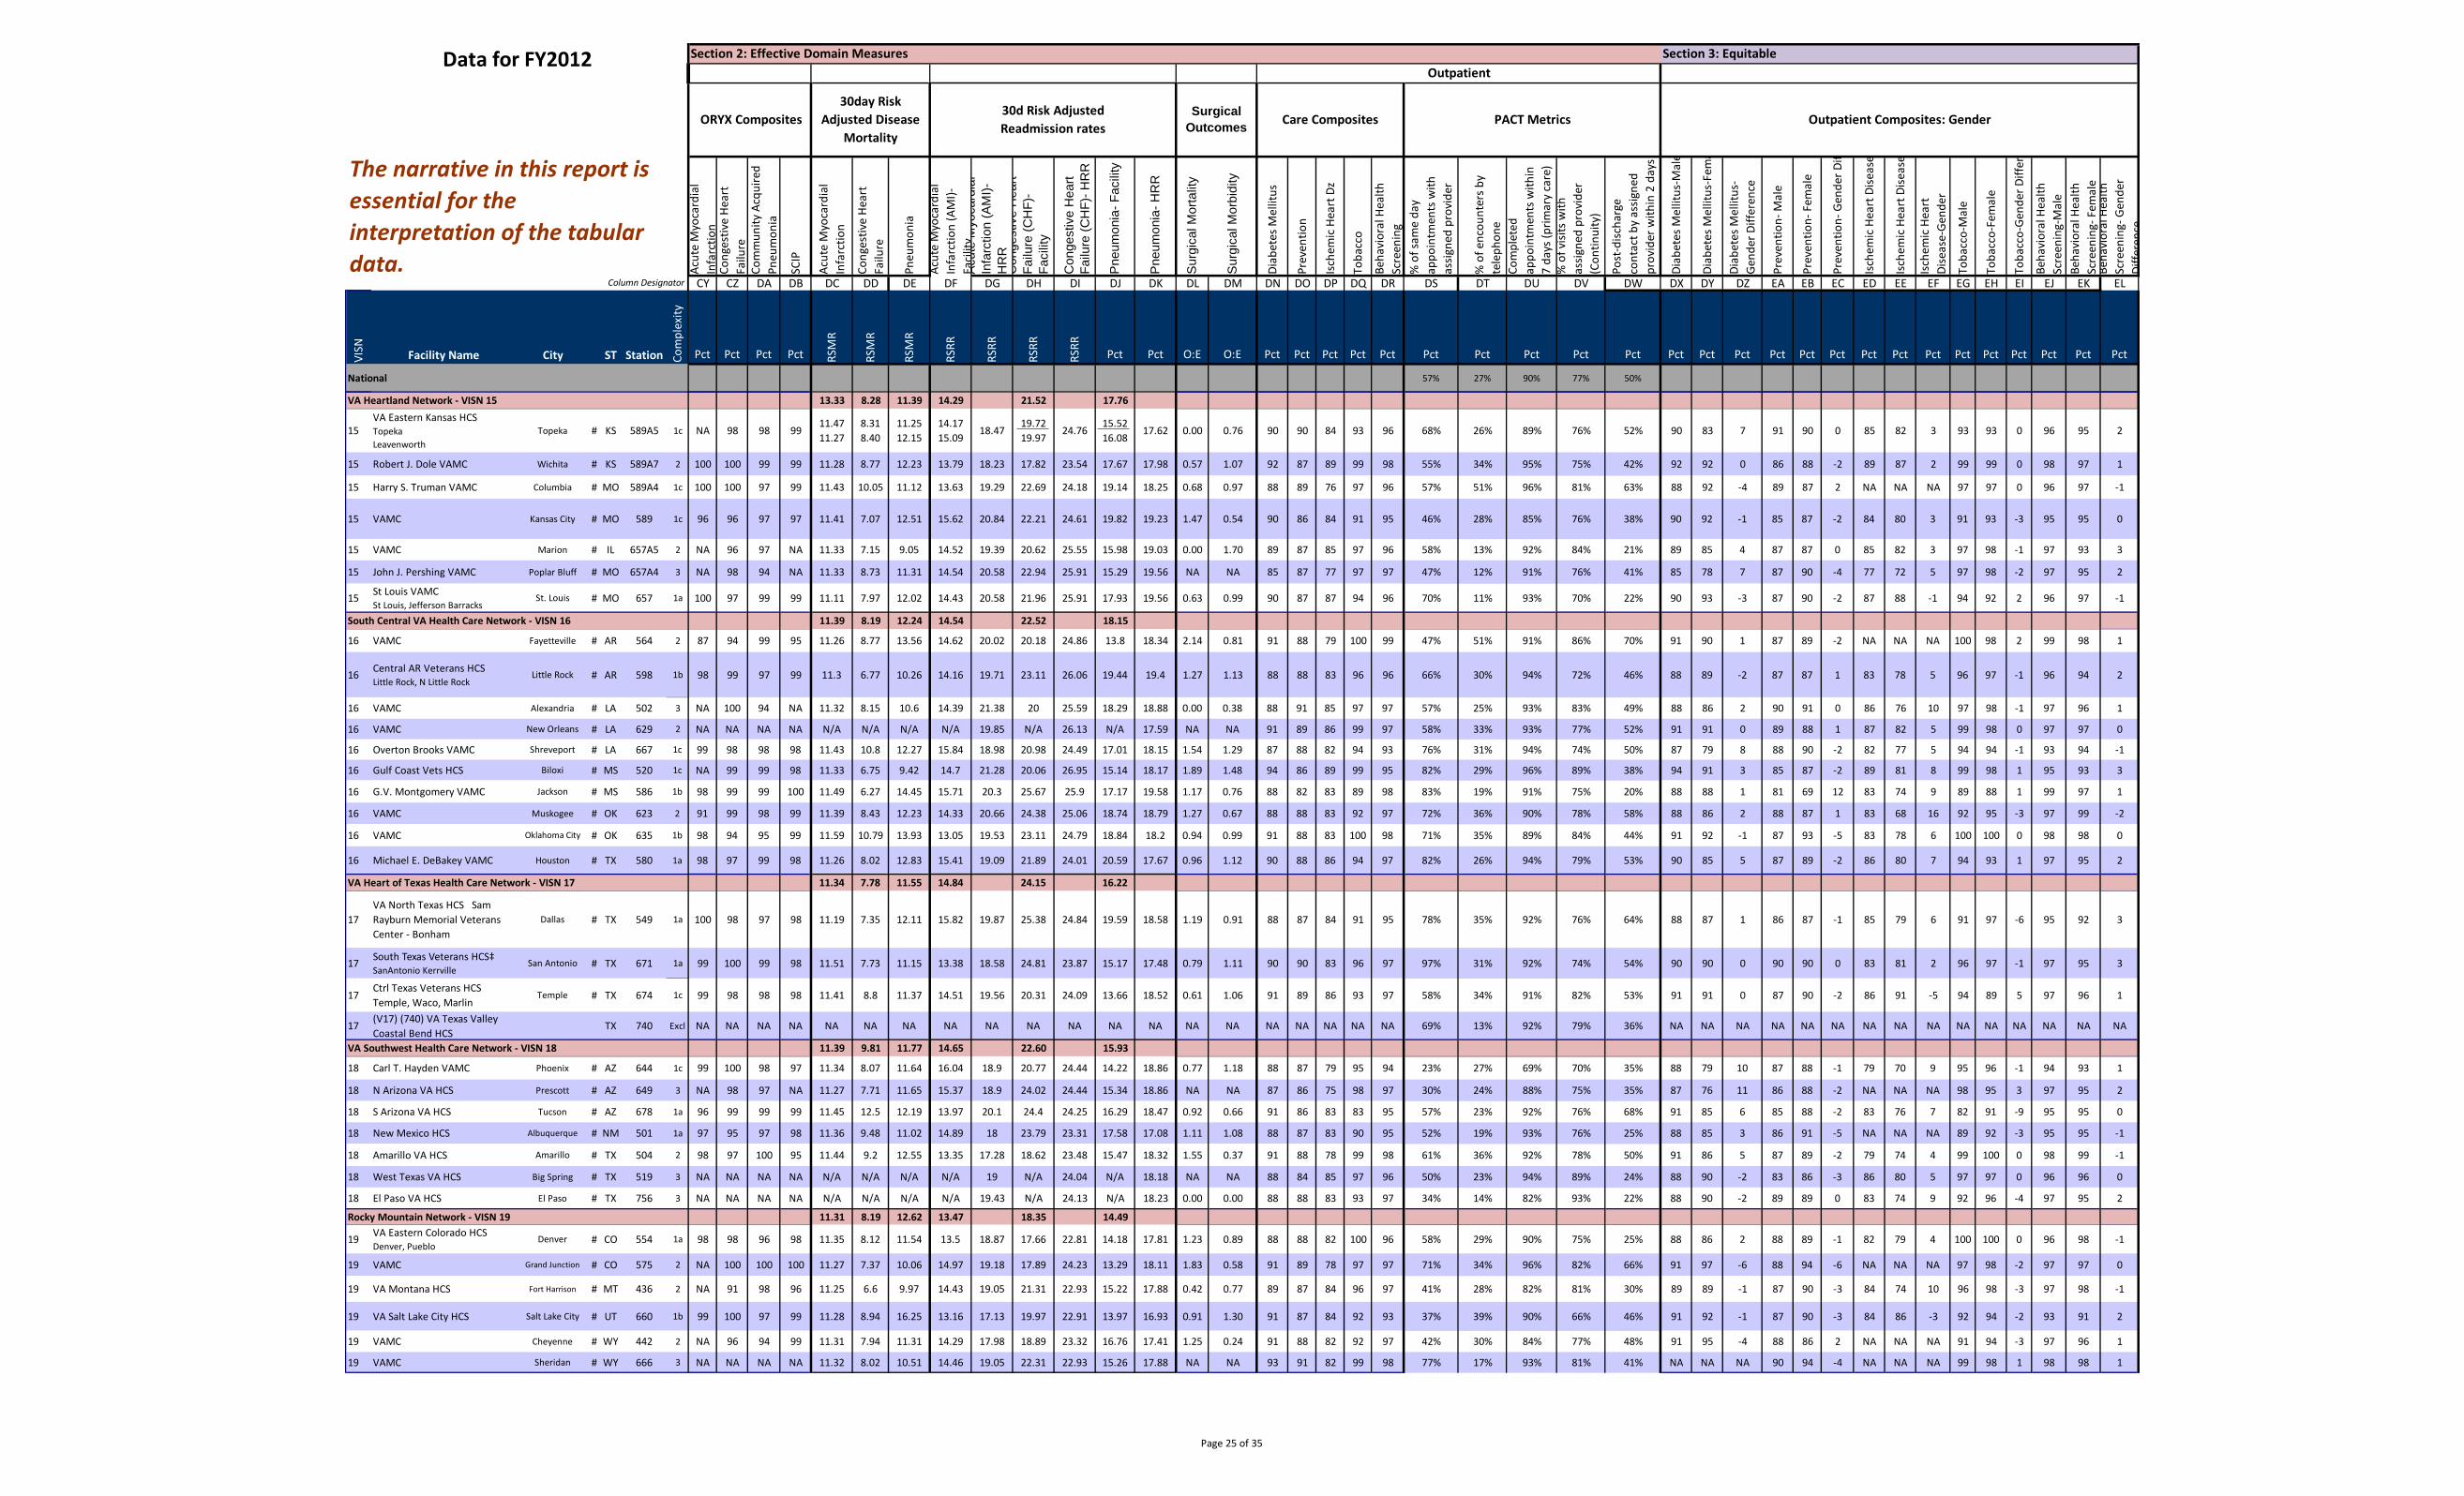
Data for FY2012
Column Designator
The narrative in this report is essential for the interpretation of the tabular data.
Section 2: Effective Domain Measures Section 3: Equitable Outpatient
ORYX Composites 30day Risk
Adjusted Disease Mortality
30d Risk Adjusted Readmission rates
Surgical Outcomes Care Composites PACT Metrics Outpatient Composites: Gender
e
Acut
e M
yoca
rdia
l In
farc
tion
Cong
estiv
e He
art
Failu
reCo
mm
unity
Acq
uire
d Pn
eum
onia
SCIP
Acut
e M
yoca
rdia
l In
farc
tion
Cong
estiv
e He
art
Failu
re
Pneu
mon
ia
Acut
e M
yoca
rdia
l In
farc
tion
(AM
I)-
Faci
lity
DF
Acu
te M
yoca
rdia
lIn
farc
tion
(AM
I)-
HR
RC
onge
stiv
e H
eart
Failu
re (C
HF)
- Fa
cilit
y
Con
gest
ive
Hea
rtFa
ilure
(CH
F)- H
RR
Pne
umon
ia- F
acili
ty
Pne
umon
ia- H
RR
Sur
gica
l Mor
talit
y
Sur
gica
l Mor
bidi
ty
Diab
etes
Mel
litus
Prev
entio
n
Isch
emic
Hea
rt D
z
Toba
cco
Beha
vior
al H
ealth
Scre
enin
g%
of s
ame
day
appo
intm
ents
with
as
signe
d pr
ovid
er
% o
f enc
ount
ers b
yte
leph
one
Com
plet
edap
poin
tmen
ts w
ithin
7
days
(prim
ary
care
)%
of v
isits
with
assig
ned
prov
ider
(Con
tinui
ty)
Post
-disc
harg
eco
ntac
t by
assig
ned
prov
ider
with
in 2
day
s
Diab
etes
Mel
litus
-Mal
e
Diab
etes
Mel
litus
-Fem
a
Diab
etes
Mel
litus
-Ge
nder
Diff
eren
ce
Prev
entio
n- M
ale
Prev
entio
n- F
emal
e
Prev
entio
n- G
ende
r Dif
Isch
emic
Hea
rt D
iseas
e
Isch
emic
Hea
rt D
iseas
e
Isch
emic
Hea
rt
Dise
ase-
Gend
er
Toba
cco-
Mal
e
Toba
cco-
Fem
ale
Toba
cco-
Gend
er D
iffer
Beha
vior
al H
ealth
Scre
enin
g-M
ale
Beha
vior
al H
ealth
Scre
enin
g- F
emal
eBe
havi
oral
Hea
lthSc
reen
ing-
Gen
der
Diffe
renc
e
CY CZ DA DB DC DD DE DG DH DI DJ DK DL DM DN DO DP DQ DR DS DT DU DV DW DX DY DZ EA EB EC ED EE EF EG EH EI EJ EK EL
VISN Facility Name City ST Station Com
plex
ity
Pct Pct Pct Pct RSM
R
RSM
R
RSM
R
RSRR
RSRR
RSRR
RSRR
Pct Pct O:E O:E Pct Pct Pct Pct Pct Pct Pct Pct Pct Pct Pct Pct Pct Pct Pct Pct Pct Pct Pct Pct Pct Pct Pct Pct Pct
National 57% 27% 90% 77% 50%
VA Heartland Network - VISN 15 13.33 8.28 11.39 14.29 21.52 17.76
15 VA Eastern Kansas HCS Topeka Leavenworth
Topeka # KS 589A5 1c NA 98 98 99 11.47 11.27
8.31 8.40
11.25 12.15
14.17 15.09
18.47 19.72 19.97
24.76 15.52 16.08
17.62 0.00 0.76 90 90 84 93 96 68% 26% 89% 76% 52% 90 83 7 91 90 0 85 82 3 93 93 0 96 95 2
15 Robert J. Dole VAMC Wichita # KS 589A7 2 100 100 99 99 11.28 8.77 12.23 13.79 18.23 17.82 23.54 17.67 17.98 0.57 1.07 92 87 89 99 98 55% 34% 95% 75% 42% 92 92 0 86 88 -2 89 87 2 99 99 0 98 97 1
15 Harry S. Truman VAMC Columbia # MO 589A4 1c 100 100 97 99 11.43 10.05 11.12 13.63 19.29 22.69 24.18 19.14 18.25 0.68 0.97 88 89 76 97 96 57% 51% 96% 81% 63% 88 92 -4 89 87 2 NA NA NA 97 97 0 96 97 -1
15 VAMC Kansas City # MO 589 1c 96 96 97 97 11.41 7.07 12.51 15.62 20.84 22.21 24.61 19.82 19.23 1.47 0.54 90 86 84 91 95 46% 28% 85% 76% 38% 90 92 -1 85 87 -2 84 80 3 91 93 -3 95 95 0
15 VAMC Marion # IL 657A5 2 NA 96 97 NA 11.33 7.15 9.05 14.52 19.39 20.62 25.55 15.98 19.03 0.00 1.70 89 87 85 97 96 58% 13% 92% 84% 21% 89 85 4 87 87 0 85 82 3 97 98 -1 97 93 3
15 John J. Pershing VAMC Poplar Bluff # MO 657A4 3 NA 98 94 NA 11.33 8.73 11.31 14.54 20.58 22.94 25.91 15.29 19.56 NA NA 85 87 77 97 97 47% 12% 91% 76% 41% 85 78 7 87 90 -4 77 72 5 97 98 -2 97 95 2
15 St Louis VAMC St Louis, Jefferson Barracks
St. Louis # MO 657 1a 100 97 99 99 11.11 7.97 12.02 14.43 20.58 21.96 25.91 17.93 19.56 0.63 0.99 90 87 87 94 96 70% 11% 93% 70% 22% 90 93 -3 87 90 -2 87 88 -1 94 92 2 96 97 -1
South Central VA Health Care Network - VISN 16 11.39 8.19 12.24 14.54 22.52 18.15
16 VAMC Fayetteville # AR 564 2 87 94 99 95 11.26 8.77 13.56 14.62 20.02 20.18 24.86 13.8 18.34 2.14 0.81 91 88 79 100 99 47% 51% 91% 86% 70% 91 90 1 87 89 -2 NA NA NA 100 98 2 99 98 1
16 Central AR Veterans HCS Little Rock, N Little Rock
Little Rock # AR 598 1b 98 99 97 99 11.3 6.77 10.26 14.16 19.71 23.11 26.06 19.44 19.4 1.27 1.13 88 88 83 96 96 66% 30% 94% 72% 46% 88 89 -2 87 87 1 83 78 5 96 97 -1 96 94 2
16 VAMC Alexandria # LA 502 3 NA 100 94 NA 11.32 8.15 10.6 14.39 21.38 20 25.59 18.29 18.88 0.00 0.38 88 91 85 97 97 57% 25% 93% 83% 49% 88 86 2 90 91 0 86 76 10 97 98 -1 97 96 1
16 VAMC New Orleans # LA 629 2 NA NA NA NA N/A N/A N/A N/A 19.85 N/A 26.13 N/A 17.59 NA NA 91 89 86 99 97 58% 33% 93% 77% 52% 91 91 0 89 88 1 87 82 5 99 98 0 97 97 0
16 Overton Brooks VAMC Shreveport # LA 667 1c 99 98 98 98 11.43 10.8 12.27 15.84 18.98 20.98 24.49 17.01 18.15 1.54 1.29 87 88 82 94 93 76% 31% 94% 74% 50% 87 79 8 88 90 -2 82 77 5 94 94 -1 93 94 -1
16 Gulf Coast Vets HCS Biloxi # MS 520 1c NA 99 99 98 11.33 6.75 9.42 14.7 21.28 20.06 26.95 15.14 18.17 1.89 1.48 94 86 89 99 95 82% 29% 96% 89% 38% 94 91 3 85 87 -2 89 81 8 99 98 1 95 93 3
16 G.V. Montgomery VAMC Jackson # MS 586 1b 98 99 99 100 11.49 6.27 14.45 15.71 20.3 25.67 25.9 17.17 19.58 1.17 0.76 88 82 83 89 98 83% 19% 91% 75% 20% 88 88 1 81 69 12 83 74 9 89 88 1 99 97 1
16 VAMC Muskogee # OK 623 2 91 99 98 99 11.39 8.43 12.23 14.33 20.66 24.38 25.06 18.74 18.79 1.27 0.67 88 88 83 92 97 72% 36% 90% 78% 58% 88 86 2 88 87 1 83 68 16 92 95 -3 97 99 -2
16 VAMC Oklahoma City # OK 635 1b 98 94 95 99 11.59 10.79 13.93 13.05 19.53 23.11 24.79 18.84 18.2 0.94 0.99 91 88 83 100 98 71% 35% 89% 84% 44% 91 92 -1 87 93 -5 83 78 6 100 100 0 98 98 0
16 Michael E. DeBakey VAMC Houston # TX 580 1a 98 97 99 98 11.26 8.02 12.83 15.41 19.09 21.89 24.01 20.59 17.67 0.96 1.12 90 88 86 94 97 82% 26% 94% 79% 53% 90 85 5 87 89 -2 86 80 7 94 93 1 97 95 2
VA Heart of Texas Health Care Network - VISN 17 11.34 7.78 11.55 14.84 24.15 16.22
17 VA North Texas HCS Sam Rayburn Memorial Veterans Center - Bonham
Dallas # TX 549 1a 100 98 97 98 11.19 7.35 12.11 15.82 19.87 25.38 24.84 19.59 18.58 1.19 0.91 88 87 84 91 95 78% 35% 92% 76% 64% 88 87 1 86 87 -1 85 79 6 91 97 -6 95 92 3
17 South Texas Veterans HCS‡ SanAntonio Kerrville
San Antonio # TX 671 1a 99 100 99 98 11.51 7.73 11.15 13.38 18.58 24.81 23.87 15.17 17.48 0.79 1.11 90 90 83 96 97 97% 31% 92% 74% 54% 90 90 0 90 90 0 83 81 2 96 97 -1 97 95 3
17 Ctrl Texas Veterans HCS Temple, Waco, Marlin
Temple # TX 674 1c 99 98 98 98 11.41 8.8 11.37 14.51 19.56 20.31 24.09 13.66 18.52 0.61 1.06 91 89 86 93 97 58% 34% 91% 82% 53% 91 91 0 87 90 -2 86 91 -5 94 89 5 97 96 1
17 (V17) (740) VA Texas Valley Coastal Bend HCS
TX 740 Excl NA NA NA NA NA NA NA NA NA NA NA NA NA NA NA NA NA NA NA NA 69% 13% 92% 79% 36% NA NA NA NA NA NA NA NA NA NA NA NA NA NA NA
VA Southwest Health Care Network - VISN 18 11.39 9.81 11.77 14.65 22.60 15.93
18 Carl T. Hayden VAMC Phoenix # AZ 644 1c 99 100 98 97 11.34 8.07 11.64 16.04 18.9 20.77 24.44 14.22 18.86 0.77 1.18 88 87 79 95 94 23% 27% 69% 70% 35% 88 79 10 87 88 -1 79 70 9 95 96 -1 94 93 1
18 N Arizona VA HCS Prescott # AZ 649 3 NA 98 97 NA 11.27 7.71 11.65 15.37 18.9 24.02 24.44 15.34 18.86 NA NA 87 86 75 98 97 30% 24% 88% 75% 35% 87 76 11 86 88 -2 NA NA NA 98 95 3 97 95 2
18 S Arizona VA HCS Tucson # AZ 678 1a 96 99 99 99 11.45 12.5 12.19 13.97 20.1 24.4 24.25 16.29 18.47 0.92 0.66 91 86 83 83 95 57% 23% 92% 76% 68% 91 85 6 85 88 -2 83 76 7 82 91 -9 95 95 0
18 New Mexico HCS Albuquerque # NM 501 1a 97 95 97 98 11.36 9.48 11.02 14.89 18 23.79 23.31 17.58 17.08 1.11 1.08 88 87 83 90 95 52% 19% 93% 76% 25% 88 85 3 86 91 -5 NA NA NA 89 92 -3 95 95 -1
18 Amarillo VA HCS Amarillo # TX 504 2 98 97 100 95 11.44 9.2 12.55 13.35 17.28 18.62 23.48 15.47 18.32 1.55 0.37 91 88 78 99 98 61% 36% 92% 78% 50% 91 86 5 87 89 -2 79 74 4 99 100 0 98 99 -1
18 West Texas VA HCS Big Spring # TX 519 3 NA NA NA NA N/A N/A N/A N/A 19 N/A 24.04 N/A 18.18 NA NA 88 84 85 97 96 50% 23% 94% 89% 24% 88 90 -2 83 86 -3 86 80 5 97 97 0 96 96 0
18 El Paso VA HCS El Paso # TX 756 3 NA NA NA NA N/A N/A N/A N/A 19.43 N/A 24.13 N/A 18.23 0.00 0.00 88 88 83 93 97 34% 14% 82% 93% 22% 88 90 -2 89 89 0 83 74 9 92 96 -4 97 95 2
Rocky Mountain Network - VISN 19 11.31 8.19 12.62 13.47 18.35 14.49
19 VA Eastern Colorado HCS Denver, Pueblo
Denver # CO 554 1a 98 98 96 98 11.35 8.12 11.54 13.5 18.87 17.66 22.81 14.18 17.81 1.23 0.89 88 88 82 100 96 58% 29% 90% 75% 25% 88 86 2 88 89 -1 82 79 4 100 100 0 96 98 -1
19 VAMC Grand Junction # CO 575 2 NA 100 100 100 11.27 7.37 10.06 14.97 19.18 17.89 24.23 13.29 18.11 1.83 0.58 91 89 78 97 97 71% 34% 96% 82% 66% 91 97 -6 88 94 -6 NA NA NA 97 98 -2 97 97 0
19 VA Montana HCS Fort Harrison # MT 436 2 NA 91 98 96 11.25 6.6 9.97 14.43 19.05 21.31 22.93 15.22 17.88 0.42 0.77 89 87 84 96 97 41% 28% 82% 81% 30% 89 89 -1 87 90 -3 84 74 10 96 98 -3 97 98 -1
19 VA Salt Lake City HCS Salt Lake City # UT 660 1b 99 100 97 99 11.28 8.94 16.25 13.16 17.13 19.97 22.91 13.97 16.93 0.91 1.30 91 87 84 92 93 37% 39% 90% 66% 46% 91 92 -1 87 90 -3 84 86 -3 92 94 -2 93 91 2
19 VAMC Cheyenne # WY 442 2 NA 96 94 99 11.31 7.94 11.31 14.29 17.98 18.89 23.32 16.76 17.41 1.25 0.24 91 88 82 92 97 42% 30% 84% 77% 48% 91 95 -4 88 86 2 NA NA NA 91 94 -3 97 96 1
19 VAMC Sheridan # WY 666 3 NA NA NA NA 11.32 8.02 10.51 14.46 19.05 22.31 22.93 15.26 17.88 NA NA 93 91 82 99 98 77% 17% 93% 81% 41% NA NA NA 90 94 -4 NA NA NA 99 98 1 98 98 1
Page 25 of 35
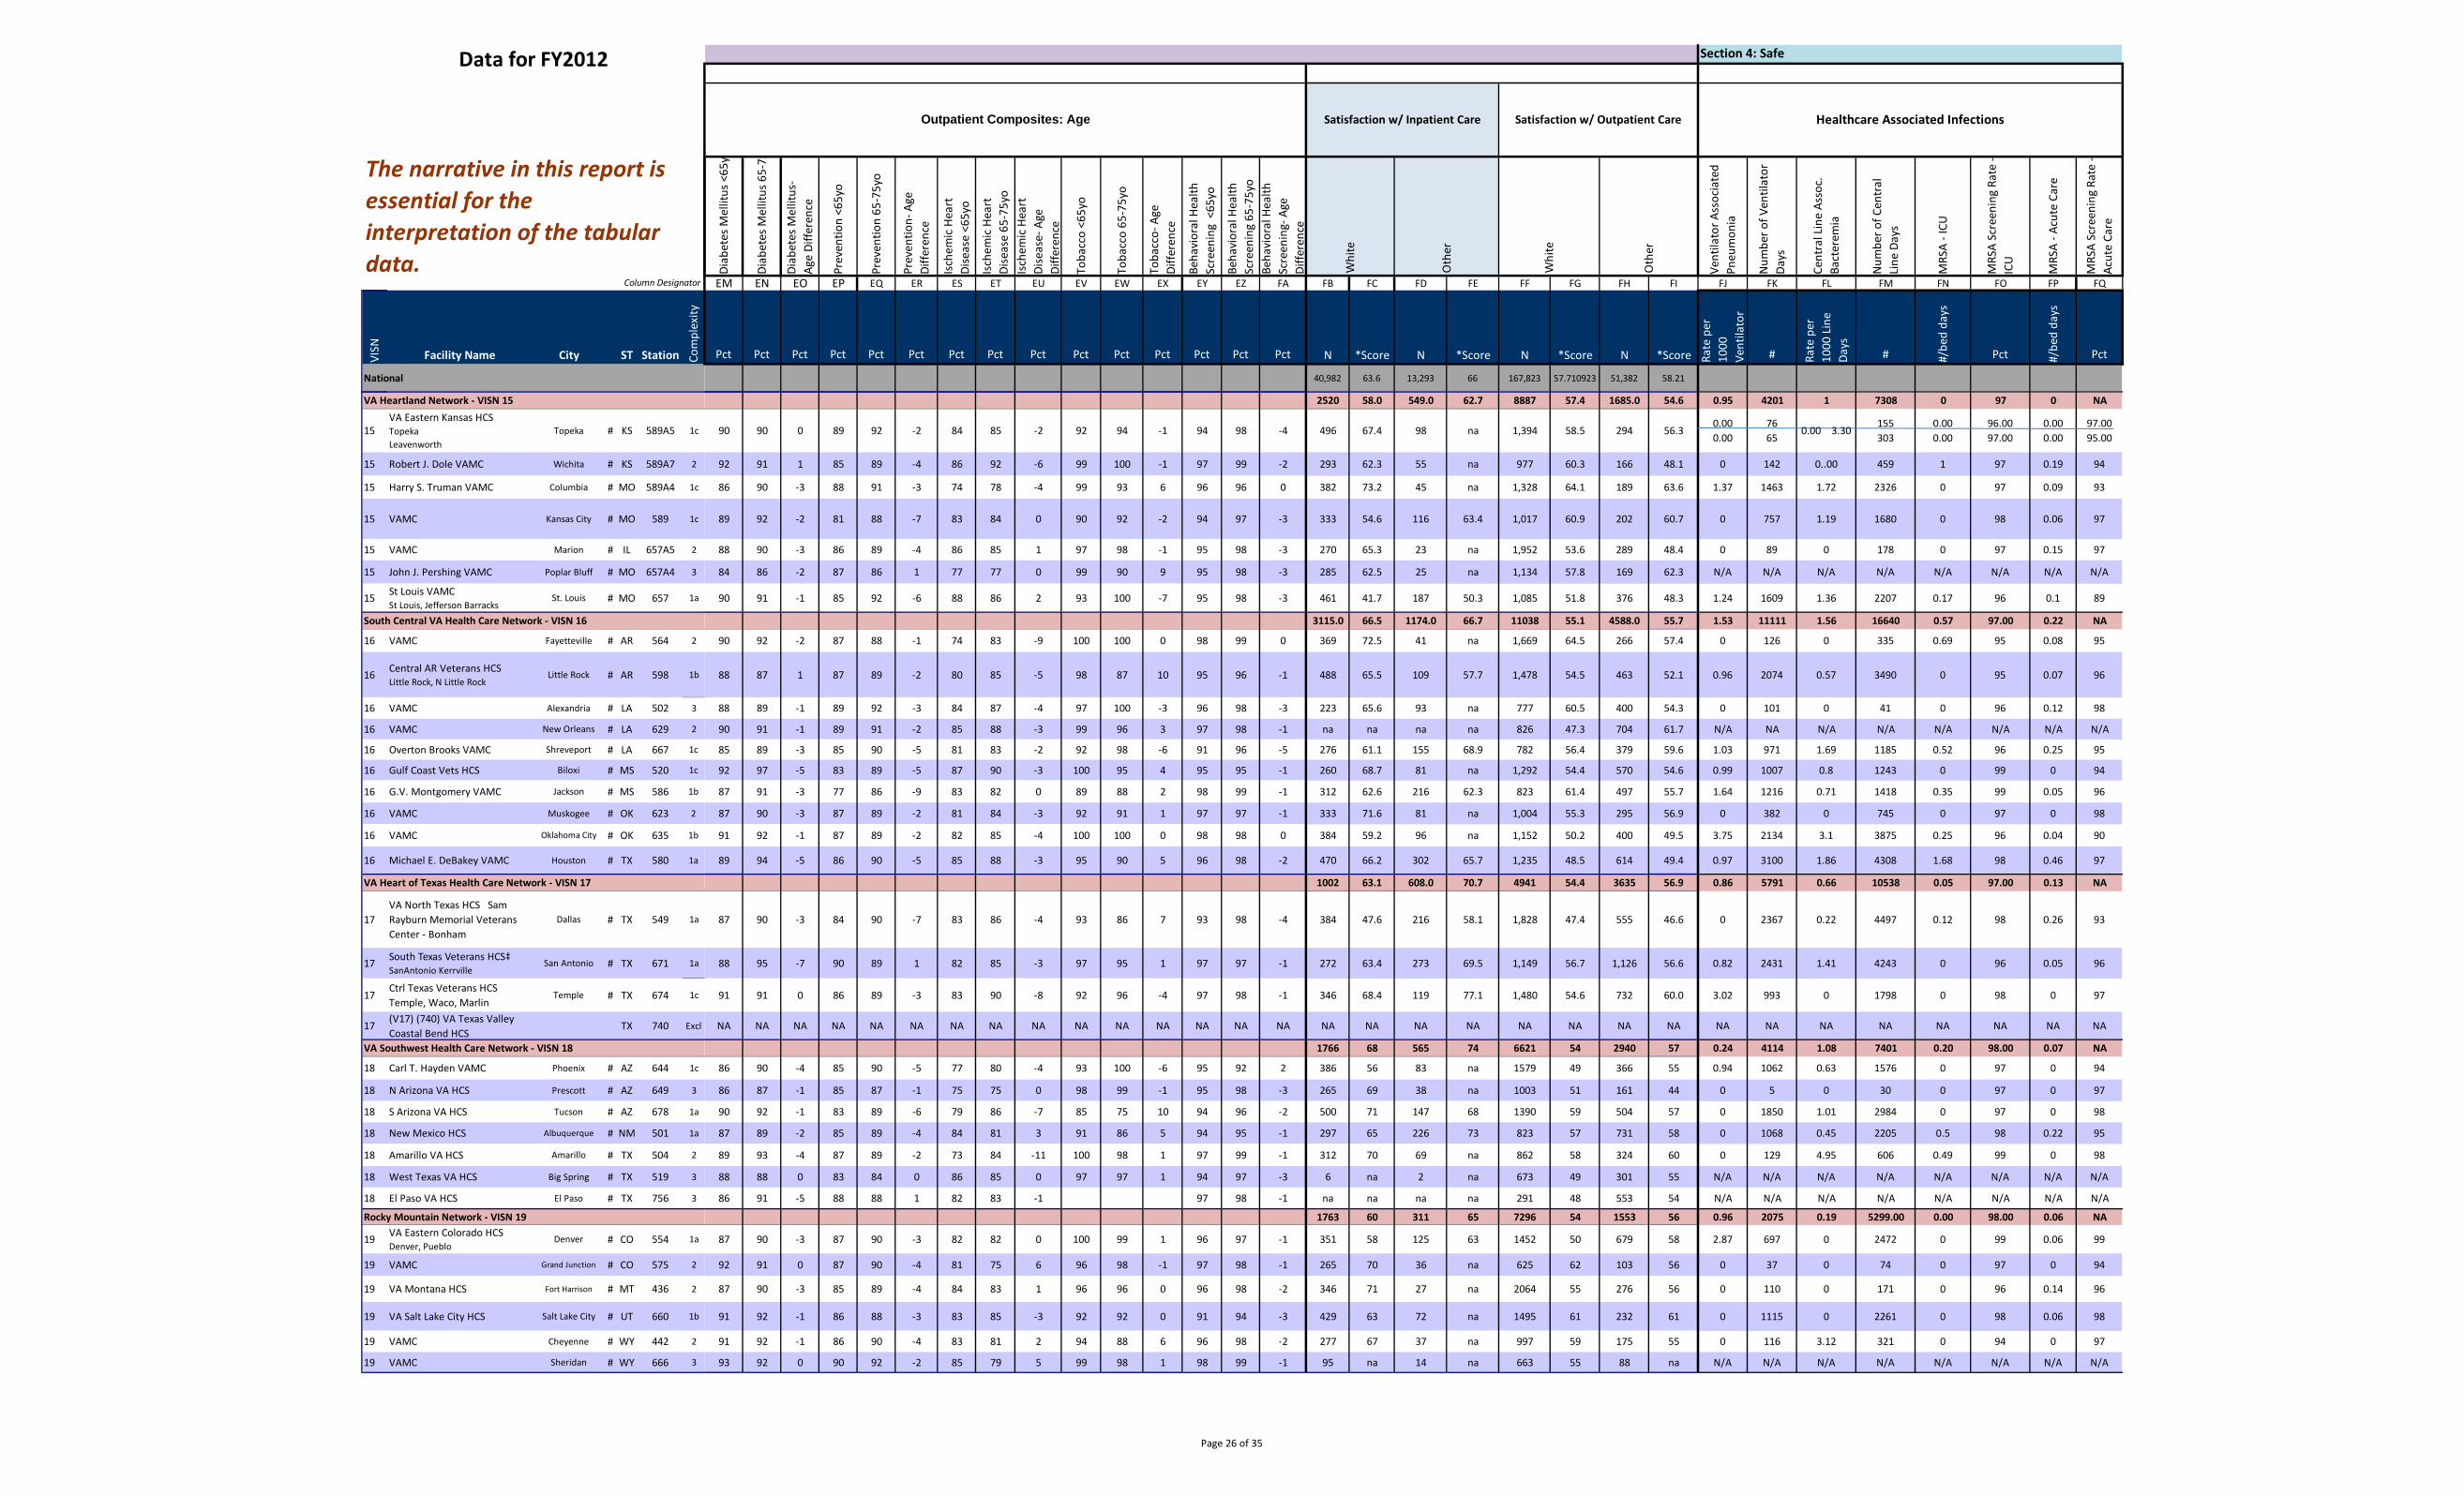
Data for FY2012
Column Designator
The narrative in this report is essential for the interpretation of the tabular data.
Section 4: Safe
Outpatient Composites: Age Satisfaction w/ Inpatient Care Satisfaction w/ Outpatient Care Healthcare Associated Infections
Diab
etes
Mel
litus
<65
y
Diab
etes
Mel
litus
65-
75
Diab
etes
Mel
litus
-Ag
e Di
ffere
nce
Prev
entio
n <6
5yo
Prev
entio
n 65
-75y
o
Prev
entio
n- A
geDi
ffere
nce
Isch
emic
Hea
rt
Dise
ase
<65y
o
Isch
emic
Hea
rt
Dise
ase
65-7
5yo
Isch
emic
Hea
rt
Dise
ase-
Age
Diffe
renc
e
Toba
cco
<65y
o
Toba
cco
65-7
5yo
Toba
cco-
Age
Diffe
renc
e
Beha
vior
al H
ealth
Scre
enin
g <
65yo
Beha
vior
al H
ealth
Scre
enin
g 65
-75y
oBe
havi
oral
Hea
lthSc
reen
ing-
Age
Diffe
renc
e
Whi
te
Oth
er
Whi
te
Oth
er
Vent
ilato
r Ass
ocia
ted
Pneu
mon
ia
Num
ber o
f Ven
tilat
orDa
ys
Cent
ral L
ine
Asso
c.Ba
cter
emia
Num
ber o
f Cen
tral
Line
Day
s
MRS
A -I
CU
MRS
A Sc
reen
ing
Rate
-IC
U
MRS
A -A
cute
Car
e
MRS
A Sc
reen
ing
Rate
-Ac
ute
Care
EM EN EO EP EQ ER ES ET EU EV EW EX EY EZ FA FB FC FD FE FF FG FH FI FJ FK FL FM FN FO FP FQ
VISN Facility Name City ST Station Com
plex
ity
Pct Pct Pct Pct Pct Pct Pct Pct Pct Pct Pct Pct Pct Pct Pct N *Score N *Score N *Score N *Score Rate
per
1000
Vent
ilato
r
# Rate
per
1000
Lin
eDa
ys
# #/be
d da
ys
Pct #/be
d da
ys
Pct
National 40,982 63.6 13,293 66 167,823 57.710923 51,382 58.21
VA Heartland Network - VISN 15 2520 58.0 549.0 62.7 8887 57.4 1685.0 54.6 0.95 4201 1 7308 0 97 0 NA
15 VA Eastern Kansas HCS Topeka Leavenworth
Topeka # KS 589A5 1c 90 90 0 89 92 -2 84 85 -2 92 94 -1 94 98 -4 496 67.4 98 na 1,394 58.5 294 56.3 0.00 0.00
76 65
0.00 3.30 155 303
0.00 0.00
96.00 97.00
0.00 0.00
97.00 95.00
15 Robert J. Dole VAMC Wichita # KS 589A7 2 92 91 1 85 89 -4 86 92 -6 99 100 -1 97 99 -2 293 62.3 55 na 977 60.3 166 48.1 0 142 0..00 459 1 97 0.19 94
15 Harry S. Truman VAMC Columbia # MO 589A4 1c 86 90 -3 88 91 -3 74 78 -4 99 93 6 96 96 0 382 73.2 45 na 1,328 64.1 189 63.6 1.37 1463 1.72 2326 0 97 0.09 93
15 VAMC Kansas City # MO 589 1c 89 92 -2 81 88 -7 83 84 0 90 92 -2 94 97 -3 333 54.6 116 63.4 1,017 60.9 202 60.7 0 757 1.19 1680 0 98 0.06 97
15 VAMC Marion # IL 657A5 2 88 90 -3 86 89 -4 86 85 1 97 98 -1 95 98 -3 270 65.3 23 na 1,952 53.6 289 48.4 0 89 0 178 0 97 0.15 97
15 John J. Pershing VAMC Poplar Bluff # MO 657A4 3 84 86 -2 87 86 1 77 77 0 99 90 9 95 98 -3 285 62.5 25 na 1,134 57.8 169 62.3 N/A N/A N/A N/A N/A N/A N/A N/A
15 St Louis VAMC St Louis, Jefferson Barracks
St. Louis # MO 657 1a 90 91 -1 85 92 -6 88 86 2 93 100 -7 95 98 -3 461 41.7 187 50.3 1,085 51.8 376 48.3 1.24 1609 1.36 2207 0.17 96 0.1 89
South Central VA Health Care Network - VISN 16 3115.0 66.5 1174.0 66.7 11038 55.1 4588.0 55.7 1.53 11111 1.56 16640 0.57 97.00 0.22 NA
16 VAMC Fayetteville # AR 564 2 90 92 -2 87 88 -1 74 83 -9 100 100 0 98 99 0 369 72.5 41 na 1,669 64.5 266 57.4 0 126 0 335 0.69 95 0.08 95
16 Central AR Veterans HCS Little Rock, N Little Rock
Little Rock # AR 598 1b 88 87 1 87 89 -2 80 85 -5 98 87 10 95 96 -1 488 65.5 109 57.7 1,478 54.5 463 52.1 0.96 2074 0.57 3490 0 95 0.07 96
16 VAMC Alexandria # LA 502 3 88 89 -1 89 92 -3 84 87 -4 97 100 -3 96 98 -3 223 65.6 93 na 777 60.5 400 54.3 0 101 0 41 0 96 0.12 98
16 VAMC New Orleans # LA 629 2 90 91 -1 89 91 -2 85 88 -3 99 96 3 97 98 -1 na na na na 826 47.3 704 61.7 N/A NA N/A N/A N/A N/A N/A N/A
16 Overton Brooks VAMC Shreveport # LA 667 1c 85 89 -3 85 90 -5 81 83 -2 92 98 -6 91 96 -5 276 61.1 155 68.9 782 56.4 379 59.6 1.03 971 1.69 1185 0.52 96 0.25 95
16 Gulf Coast Vets HCS Biloxi # MS 520 1c 92 97 -5 83 89 -5 87 90 -3 100 95 4 95 95 -1 260 68.7 81 na 1,292 54.4 570 54.6 0.99 1007 0.8 1243 0 99 0 94
16 G.V. Montgomery VAMC Jackson # MS 586 1b 87 91 -3 77 86 -9 83 82 0 89 88 2 98 99 -1 312 62.6 216 62.3 823 61.4 497 55.7 1.64 1216 0.71 1418 0.35 99 0.05 96
16 VAMC Muskogee # OK 623 2 87 90 -3 87 89 -2 81 84 -3 92 91 1 97 97 -1 333 71.6 81 na 1,004 55.3 295 56.9 0 382 0 745 0 97 0 98
16 VAMC Oklahoma City # OK 635 1b 91 92 -1 87 89 -2 82 85 -4 100 100 0 98 98 0 384 59.2 96 na 1,152 50.2 400 49.5 3.75 2134 3.1 3875 0.25 96 0.04 90
16 Michael E. DeBakey VAMC Houston # TX 580 1a 89 94 -5 86 90 -5 85 88 -3 95 90 5 96 98 -2 470 66.2 302 65.7 1,235 48.5 614 49.4 0.97 3100 1.86 4308 1.68 98 0.46 97
VA Heart of Texas Health Care Network - VISN 17 1002 63.1 608.0 70.7 4941 54.4 3635 56.9 0.86 5791 0.66 10538 0.05 97.00 0.13 NA
17 VA North Texas HCS Sam Rayburn Memorial Veterans Center - Bonham
Dallas # TX 549 1a 87 90 -3 84 90 -7 83 86 -4 93 86 7 93 98 -4 384 47.6 216 58.1 1,828 47.4 555 46.6 0 2367 0.22 4497 0.12 98 0.26 93
17 South Texas Veterans HCS‡ SanAntonio Kerrville
San Antonio # TX 671 1a 88 95 -7 90 89 1 82 85 -3 97 95 1 97 97 -1 272 63.4 273 69.5 1,149 56.7 1,126 56.6 0.82 2431 1.41 4243 0 96 0.05 96
17 Ctrl Texas Veterans HCS Temple, Waco, Marlin
Temple # TX 674 1c 91 91 0 86 89 -3 83 90 -8 92 96 -4 97 98 -1 346 68.4 119 77.1 1,480 54.6 732 60.0 3.02 993 0 1798 0 98 0 97
17 (V17) (740) VA Texas Valley Coastal Bend HCS
TX 740 Excl NA NA NA NA NA NA NA NA NA NA NA NA NA NA NA NA NA NA NA NA NA NA NA NA NA NA NA NA NA NA NA
VA Southwest Health Care Network - VISN 18 1766 68 565 74 6621 54 2940 57 0.24 4114 1.08 7401 0.20 98.00 0.07 NA
18 Carl T. Hayden VAMC Phoenix # AZ 644 1c 86 90 -4 85 90 -5 77 80 -4 93 100 -6 95 92 2 386 56 83 na 1579 49 366 55 0.94 1062 0.63 1576 0 97 0 94
18 N Arizona VA HCS Prescott # AZ 649 3 86 87 -1 85 87 -1 75 75 0 98 99 -1 95 98 -3 265 69 38 na 1003 51 161 44 0 5 0 30 0 97 0 97
18 S Arizona VA HCS Tucson # AZ 678 1a 90 92 -1 83 89 -6 79 86 -7 85 75 10 94 96 -2 500 71 147 68 1390 59 504 57 0 1850 1.01 2984 0 97 0 98
18 New Mexico HCS Albuquerque # NM 501 1a 87 89 -2 85 89 -4 84 81 3 91 86 5 94 95 -1 297 65 226 73 823 57 731 58 0 1068 0.45 2205 0.5 98 0.22 95
18 Amarillo VA HCS Amarillo # TX 504 2 89 93 -4 87 89 -2 73 84 -11 100 98 1 97 99 -1 312 70 69 na 862 58 324 60 0 129 4.95 606 0.49 99 0 98
18 West Texas VA HCS Big Spring # TX 519 3 88 88 0 83 84 0 86 85 0 97 97 1 94 97 -3 6 na 2 na 673 49 301 55 N/A N/A N/A N/A N/A N/A N/A N/A
18 El Paso VA HCS El Paso # TX 756 3 86 91 -5 88 88 1 82 83 -1 97 98 -1 na na na na 291 48 553 54 N/A N/A N/A N/A N/A N/A N/A N/A
Rocky Mountain Network - VISN 19 1763 60 311 65 7296 54 1553 56 0.96 2075 0.19 5299.00 0.00 98.00 0.06 NA
19 VA Eastern Colorado HCS Denver, Pueblo
Denver # CO 554 1a 87 90 -3 87 90 -3 82 82 0 100 99 1 96 97 -1 351 58 125 63 1452 50 679 58 2.87 697 0 2472 0 99 0.06 99
19 VAMC Grand Junction # CO 575 2 92 91 0 87 90 -4 81 75 6 96 98 -1 97 98 -1 265 70 36 na 625 62 103 56 0 37 0 74 0 97 0 94
19 VA Montana HCS Fort Harrison # MT 436 2 87 90 -3 85 89 -4 84 83 1 96 96 0 96 98 -2 346 71 27 na 2064 55 276 56 0 110 0 171 0 96 0.14 96
19 VA Salt Lake City HCS Salt Lake City # UT 660 1b 91 92 -1 86 88 -3 83 85 -3 92 92 0 91 94 -3 429 63 72 na 1495 61 232 61 0 1115 0 2261 0 98 0.06 98
19 VAMC Cheyenne # WY 442 2 91 92 -1 86 90 -4 83 81 2 94 88 6 96 98 -2 277 67 37 na 997 59 175 55 0 116 3.12 321 0 94 0 97
19 VAMC Sheridan # WY 666 3 93 92 0 90 92 -2 85 79 5 99 98 1 98 99 -1 95 na 14 na 663 55 88 na N/A N/A N/A N/A N/A N/A N/A N/A
Page 26 of 35
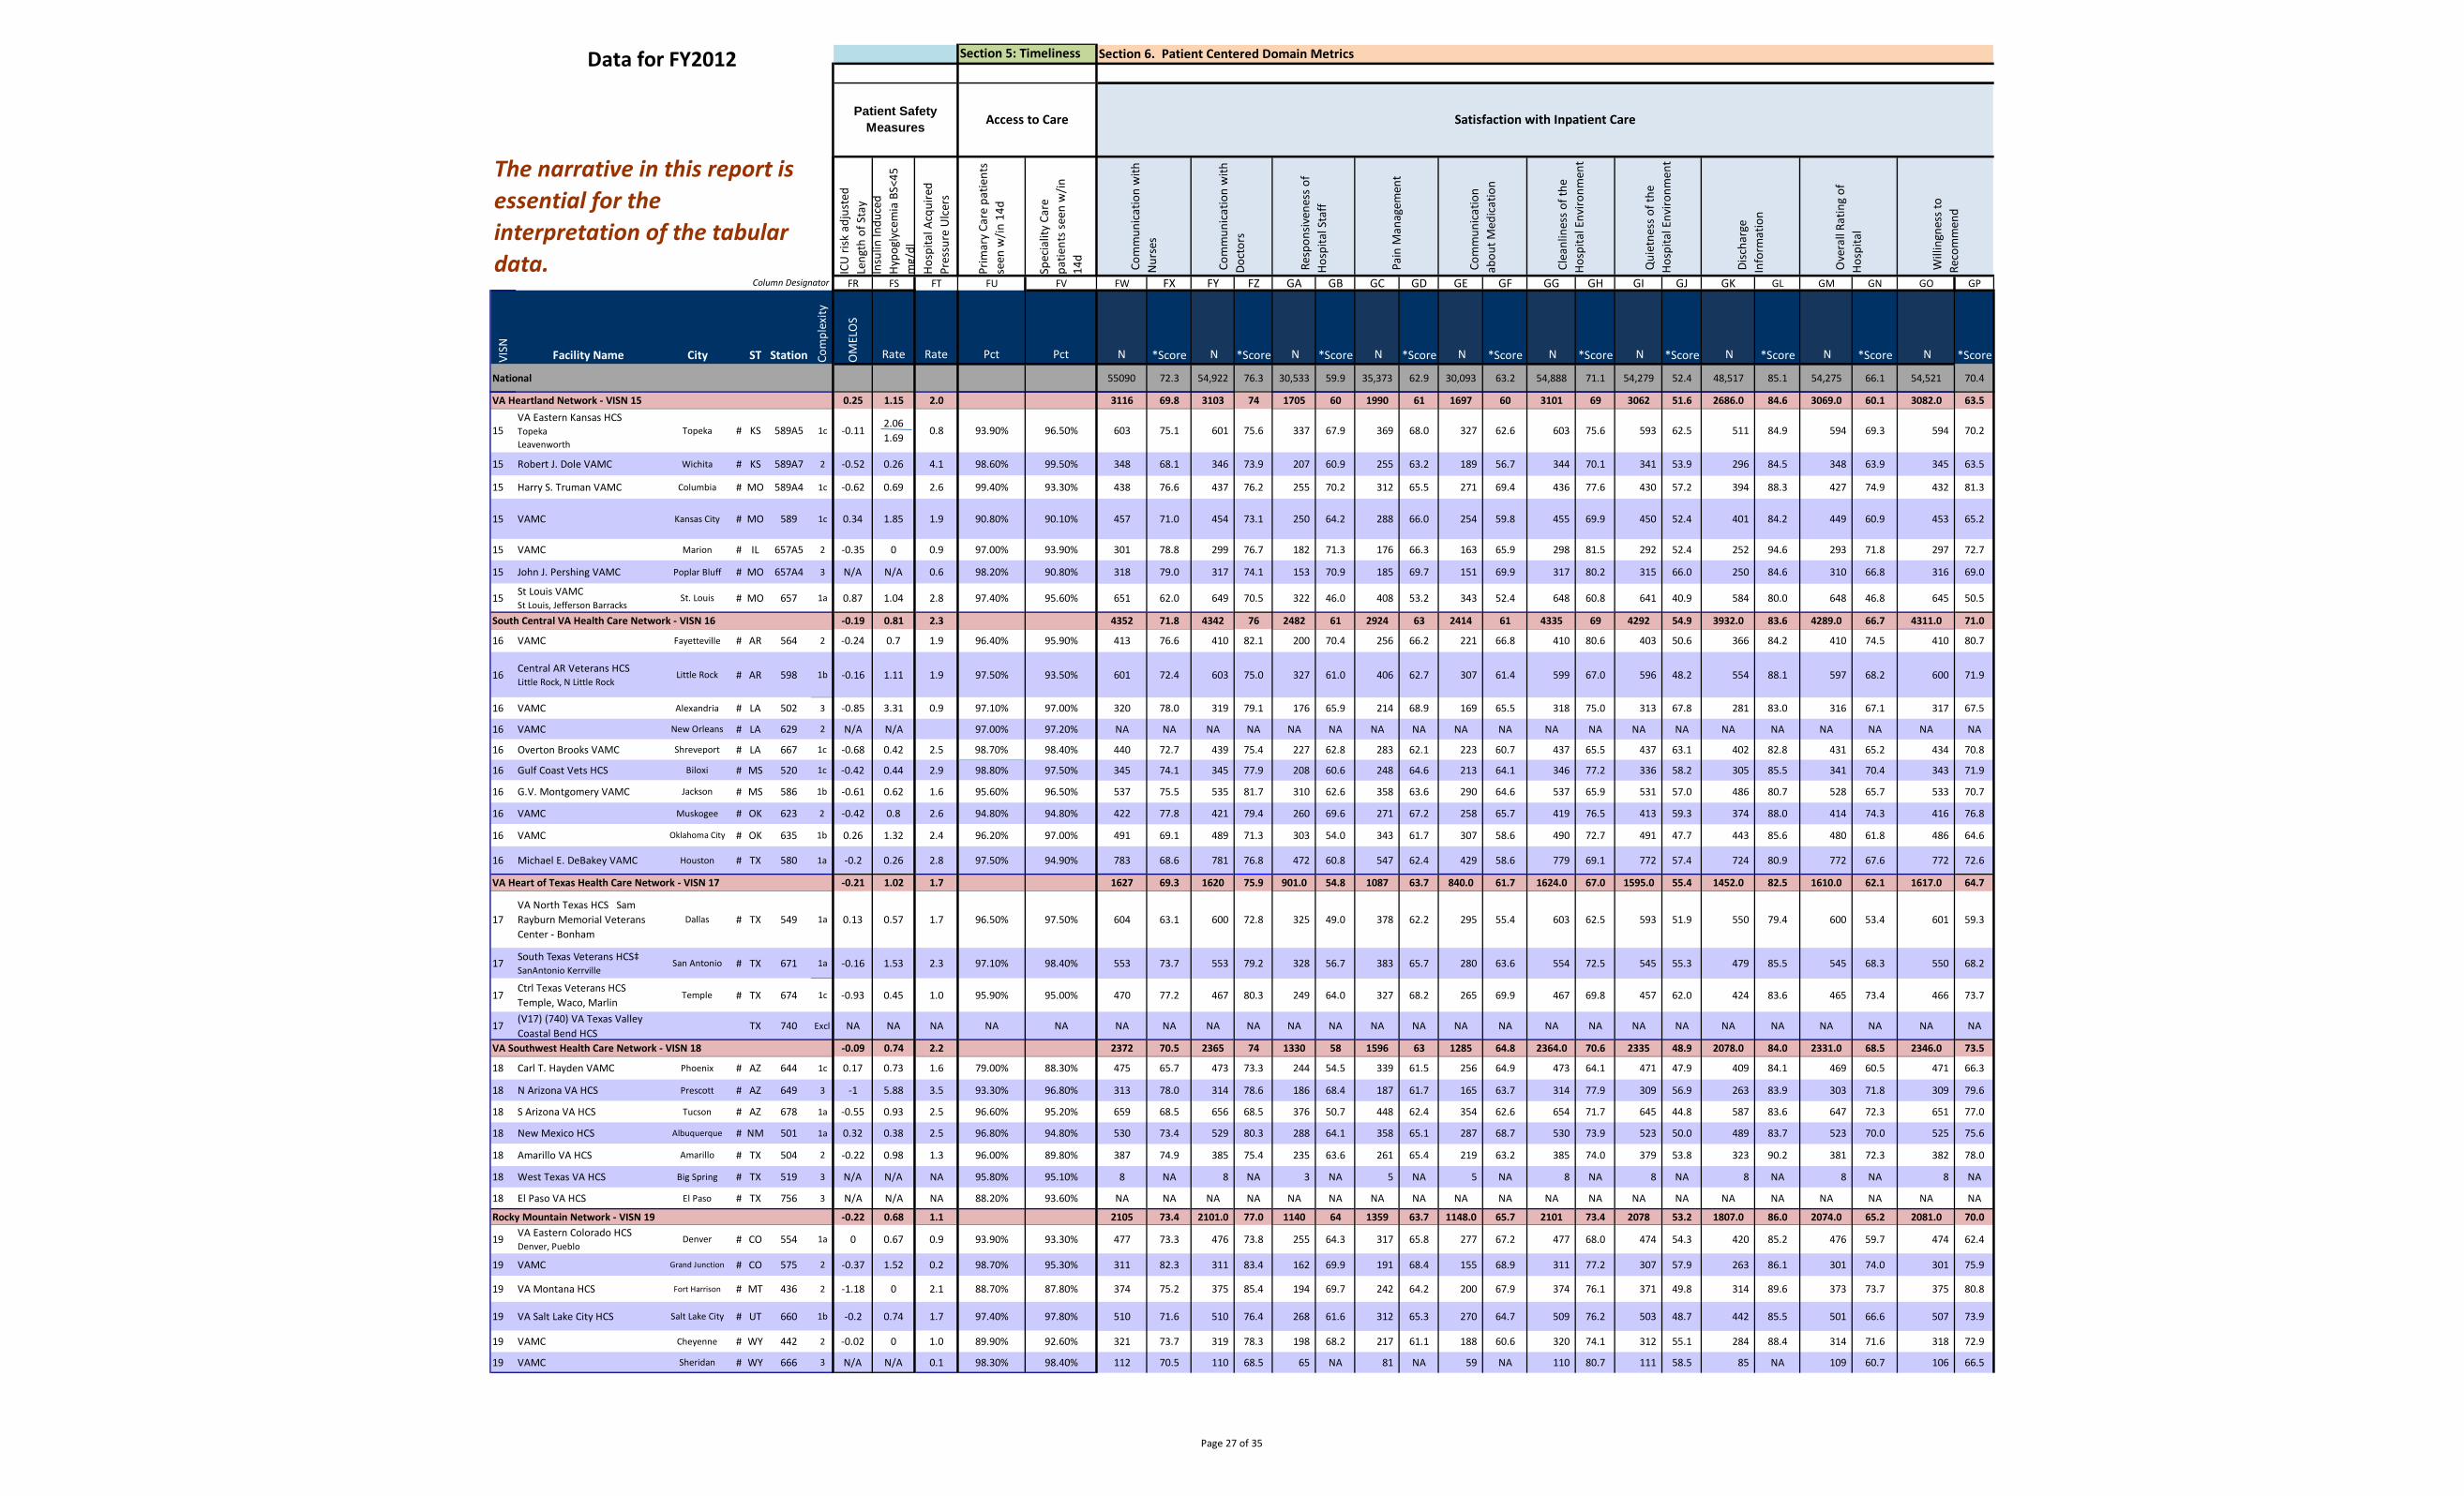
Data for FY2012
Column Designator
The narrative in this report is essential for the interpretation of the tabular data.
Section 5: Timeliness Section 6. Patient Centered Domain Metrics
Patient Safety Measures Access to Care Satisfaction with Inpatient Care
ICU
risk
adj
uste
d Le
ngth
of S
tay
Insu
lin In
duce
d Hy
pogl
ycem
ia B
S<45
m
g/dl
Hosp
ital A
cqui
red
Pres
sure
Ulc
ers
Prim
ary
Care
pat
ient
sse
en w
/in 1
4d
Spec
ialit
y Ca
repa
tient
s see
n w
/in14
d
Com
mun
icat
ion
with
N
urse
s
Com
mun
icat
ion
with
Do
ctor
s
Res
pons
iven
ess o
fHo
spita
l Sta
ff
Pai
n M
anag
emen
t
Com
mun
icat
ion
abou
t Med
icat
ion
Cle
anlin
ess o
f the
Hosp
ital E
nviro
nmen
t
Qui
etne
ss o
f the
Hosp
ital E
nviro
nmen
t
Disc
harg
eIn
form
atio
n
Ove
rall
Ratin
g of
Hosp
ital
Will
ingn
ess t
oRe
com
men
d
FR FS FT FU FV FW FX FY FZ GA GB GC GD GE GF GG GH GI GJ GK GL GM GN GO GP
VISN Facility Name City ST Station Com
plex
ity
OM
ELO
S
Rate Rate Pct Pct N *Score N *Score N *Score N *Score N *Score N *Score N *Score N *Score N *Score N *Score
National 55090 72.3 54,922 76.3 30,533 59.9 35,373 62.9 30,093 63.2 54,888 71.1 54,279 52.4 48,517 85.1 54,275 66.1 54,521 70.4
VA Heartland Network - VISN 15 0.25 1.15 2.0 3116 69.8 3103 74 1705 60 1990 61 1697 60 3101 69 3062 51.6 2686.0 84.6 3069.0 60.1 3082.0 63.5
15 VA Eastern Kansas HCS Topeka Leavenworth
Topeka # KS 589A5 1c -0.11 2.06 1.69
0.8 93.90% 96.50% 603 75.1 601 75.6 337 67.9 369 68.0 327 62.6 603 75.6 593 62.5 511 84.9 594 69.3 594 70.2
15 Robert J. Dole VAMC Wichita # KS 589A7 2 -0.52 0.26 4.1 98.60% 99.50% 348 68.1 346 73.9 207 60.9 255 63.2 189 56.7 344 70.1 341 53.9 296 84.5 348 63.9 345 63.5
15 Harry S. Truman VAMC Columbia # MO 589A4 1c -0.62 0.69 2.6 99.40% 93.30% 438 76.6 437 76.2 255 70.2 312 65.5 271 69.4 436 77.6 430 57.2 394 88.3 427 74.9 432 81.3
15 VAMC Kansas City # MO 589 1c 0.34 1.85 1.9 90.80% 90.10% 457 71.0 454 73.1 250 64.2 288 66.0 254 59.8 455 69.9 450 52.4 401 84.2 449 60.9 453 65.2
15 VAMC Marion # IL 657A5 2 -0.35 0 0.9 97.00% 93.90% 301 78.8 299 76.7 182 71.3 176 66.3 163 65.9 298 81.5 292 52.4 252 94.6 293 71.8 297 72.7
15 John J. Pershing VAMC Poplar Bluff # MO 657A4 3 N/A N/A 0.6 98.20% 90.80% 318 79.0 317 74.1 153 70.9 185 69.7 151 69.9 317 80.2 315 66.0 250 84.6 310 66.8 316 69.0
15 St Louis VAMC St Louis, Jefferson Barracks
St. Louis # MO 657 1a 0.87 1.04 2.8 97.40% 95.60% 651 62.0 649 70.5 322 46.0 408 53.2 343 52.4 648 60.8 641 40.9 584 80.0 648 46.8 645 50.5
South Central VA Health Care Network - VISN 16 -0.19 0.81 2.3 4352 71.8 4342 76 2482 61 2924 63 2414 61 4335 69 4292 54.9 3932.0 83.6 4289.0 66.7 4311.0 71.0
16 VAMC Fayetteville # AR 564 2 -0.24 0.7 1.9 96.40% 95.90% 413 76.6 410 82.1 200 70.4 256 66.2 221 66.8 410 80.6 403 50.6 366 84.2 410 74.5 410 80.7
16 Central AR Veterans HCS Little Rock, N Little Rock
Little Rock # AR 598 1b -0.16 1.11 1.9 97.50% 93.50% 601 72.4 603 75.0 327 61.0 406 62.7 307 61.4 599 67.0 596 48.2 554 88.1 597 68.2 600 71.9
16 VAMC Alexandria # LA 502 3 -0.85 3.31 0.9 97.10% 97.00% 320 78.0 319 79.1 176 65.9 214 68.9 169 65.5 318 75.0 313 67.8 281 83.0 316 67.1 317 67.5
16 VAMC New Orleans # LA 629 2 N/A N/A 97.00% 97.20% NA NA NA NA NA NA NA NA NA NA NA NA NA NA NA NA NA NA NA NA
16 Overton Brooks VAMC Shreveport # LA 667 1c -0.68 0.42 2.5 98.70% 98.40% 440 72.7 439 75.4 227 62.8 283 62.1 223 60.7 437 65.5 437 63.1 402 82.8 431 65.2 434 70.8
16 Gulf Coast Vets HCS Biloxi # MS 520 1c -0.42 0.44 2.9 98.80% 97.50% 345 74.1 345 77.9 208 60.6 248 64.6 213 64.1 346 77.2 336 58.2 305 85.5 341 70.4 343 71.9
16 G.V. Montgomery VAMC Jackson # MS 586 1b -0.61 0.62 1.6 95.60% 96.50% 537 75.5 535 81.7 310 62.6 358 63.6 290 64.6 537 65.9 531 57.0 486 80.7 528 65.7 533 70.7
16 VAMC Muskogee # OK 623 2 -0.42 0.8 2.6 94.80% 94.80% 422 77.8 421 79.4 260 69.6 271 67.2 258 65.7 419 76.5 413 59.3 374 88.0 414 74.3 416 76.8
16 VAMC Oklahoma City # OK 635 1b 0.26 1.32 2.4 96.20% 97.00% 491 69.1 489 71.3 303 54.0 343 61.7 307 58.6 490 72.7 491 47.7 443 85.6 480 61.8 486 64.6
16 Michael E. DeBakey VAMC Houston # TX 580 1a -0.2 0.26 2.8 97.50% 94.90% 783 68.6 781 76.8 472 60.8 547 62.4 429 58.6 779 69.1 772 57.4 724 80.9 772 67.6 772 72.6
VA Heart of Texas Health Care Network - VISN 17 -0.21 1.02 1.7 1627 69.3 1620 75.9 901.0 54.8 1087 63.7 840.0 61.7 1624.0 67.0 1595.0 55.4 1452.0 82.5 1610.0 62.1 1617.0 64.7
17 VA North Texas HCS Sam Rayburn Memorial Veterans Center - Bonham
Dallas # TX 549 1a 0.13 0.57 1.7 96.50% 97.50% 604 63.1 600 72.8 325 49.0 378 62.2 295 55.4 603 62.5 593 51.9 550 79.4 600 53.4 601 59.3
17 South Texas Veterans HCS‡ SanAntonio Kerrville
San Antonio # TX 671 1a -0.16 1.53 2.3 97.10% 98.40% 553 73.7 553 79.2 328 56.7 383 65.7 280 63.6 554 72.5 545 55.3 479 85.5 545 68.3 550 68.2
17 Ctrl Texas Veterans HCS Temple, Waco, Marlin
Temple # TX 674 1c -0.93 0.45 1.0 95.90% 95.00% 470 77.2 467 80.3 249 64.0 327 68.2 265 69.9 467 69.8 457 62.0 424 83.6 465 73.4 466 73.7
17 (V17) (740) VA Texas Valley Coastal Bend HCS
TX 740 Excl NA NA NA NA NA NA NA NA NA NA NA NA NA NA NA NA NA NA NA NA NA NA NA NA NA
VA Southwest Health Care Network - VISN 18 -0.09 0.74 2.2 2372 70.5 2365 74 1330 58 1596 63 1285 64.8 2364.0 70.6 2335 48.9 2078.0 84.0 2331.0 68.5 2346.0 73.5
18 Carl T. Hayden VAMC Phoenix # AZ 644 1c 0.17 0.73 1.6 79.00% 88.30% 475 65.7 473 73.3 244 54.5 339 61.5 256 64.9 473 64.1 471 47.9 409 84.1 469 60.5 471 66.3
18 N Arizona VA HCS Prescott # AZ 649 3 -1 5.88 3.5 93.30% 96.80% 313 78.0 314 78.6 186 68.4 187 61.7 165 63.7 314 77.9 309 56.9 263 83.9 303 71.8 309 79.6
18 S Arizona VA HCS Tucson # AZ 678 1a -0.55 0.93 2.5 96.60% 95.20% 659 68.5 656 68.5 376 50.7 448 62.4 354 62.6 654 71.7 645 44.8 587 83.6 647 72.3 651 77.0
18 New Mexico HCS Albuquerque # NM 501 1a 0.32 0.38 2.5 96.80% 94.80% 530 73.4 529 80.3 288 64.1 358 65.1 287 68.7 530 73.9 523 50.0 489 83.7 523 70.0 525 75.6
18 Amarillo VA HCS Amarillo # TX 504 2 -0.22 0.98 1.3 96.00% 89.80% 387 74.9 385 75.4 235 63.6 261 65.4 219 63.2 385 74.0 379 53.8 323 90.2 381 72.3 382 78.0
18 West Texas VA HCS Big Spring # TX 519 3 N/A N/A NA 95.80% 95.10% 8 NA 8 NA 3 NA 5 NA 5 NA 8 NA 8 NA 8 NA 8 NA 8 NA
18 El Paso VA HCS El Paso # TX 756 3 N/A N/A NA 88.20% 93.60% NA NA NA NA NA NA NA NA NA NA NA NA NA NA NA NA NA NA NA NA
Rocky Mountain Network - VISN 19 -0.22 0.68 1.1 2105 73.4 2101.0 77.0 1140 64 1359 63.7 1148.0 65.7 2101 73.4 2078 53.2 1807.0 86.0 2074.0 65.2 2081.0 70.0
19 VA Eastern Colorado HCS Denver, Pueblo
Denver # CO 554 1a 0 0.67 0.9 93.90% 93.30% 477 73.3 476 73.8 255 64.3 317 65.8 277 67.2 477 68.0 474 54.3 420 85.2 476 59.7 474 62.4
19 VAMC Grand Junction # CO 575 2 -0.37 1.52 0.2 98.70% 95.30% 311 82.3 311 83.4 162 69.9 191 68.4 155 68.9 311 77.2 307 57.9 263 86.1 301 74.0 301 75.9
19 VA Montana HCS Fort Harrison # MT 436 2 -1.18 0 2.1 88.70% 87.80% 374 75.2 375 85.4 194 69.7 242 64.2 200 67.9 374 76.1 371 49.8 314 89.6 373 73.7 375 80.8
19 VA Salt Lake City HCS Salt Lake City # UT 660 1b -0.2 0.74 1.7 97.40% 97.80% 510 71.6 510 76.4 268 61.6 312 65.3 270 64.7 509 76.2 503 48.7 442 85.5 501 66.6 507 73.9
19 VAMC Cheyenne # WY 442 2 -0.02 0 1.0 89.90% 92.60% 321 73.7 319 78.3 198 68.2 217 61.1 188 60.6 320 74.1 312 55.1 284 88.4 314 71.6 318 72.9
19 VAMC Sheridan # WY 666 3 N/A N/A 0.1 98.30% 98.40% 112 70.5 110 68.5 65 NA 81 NA 59 NA 110 80.7 111 58.5 85 NA 109 60.7 106 66.5
Page 27 of 35
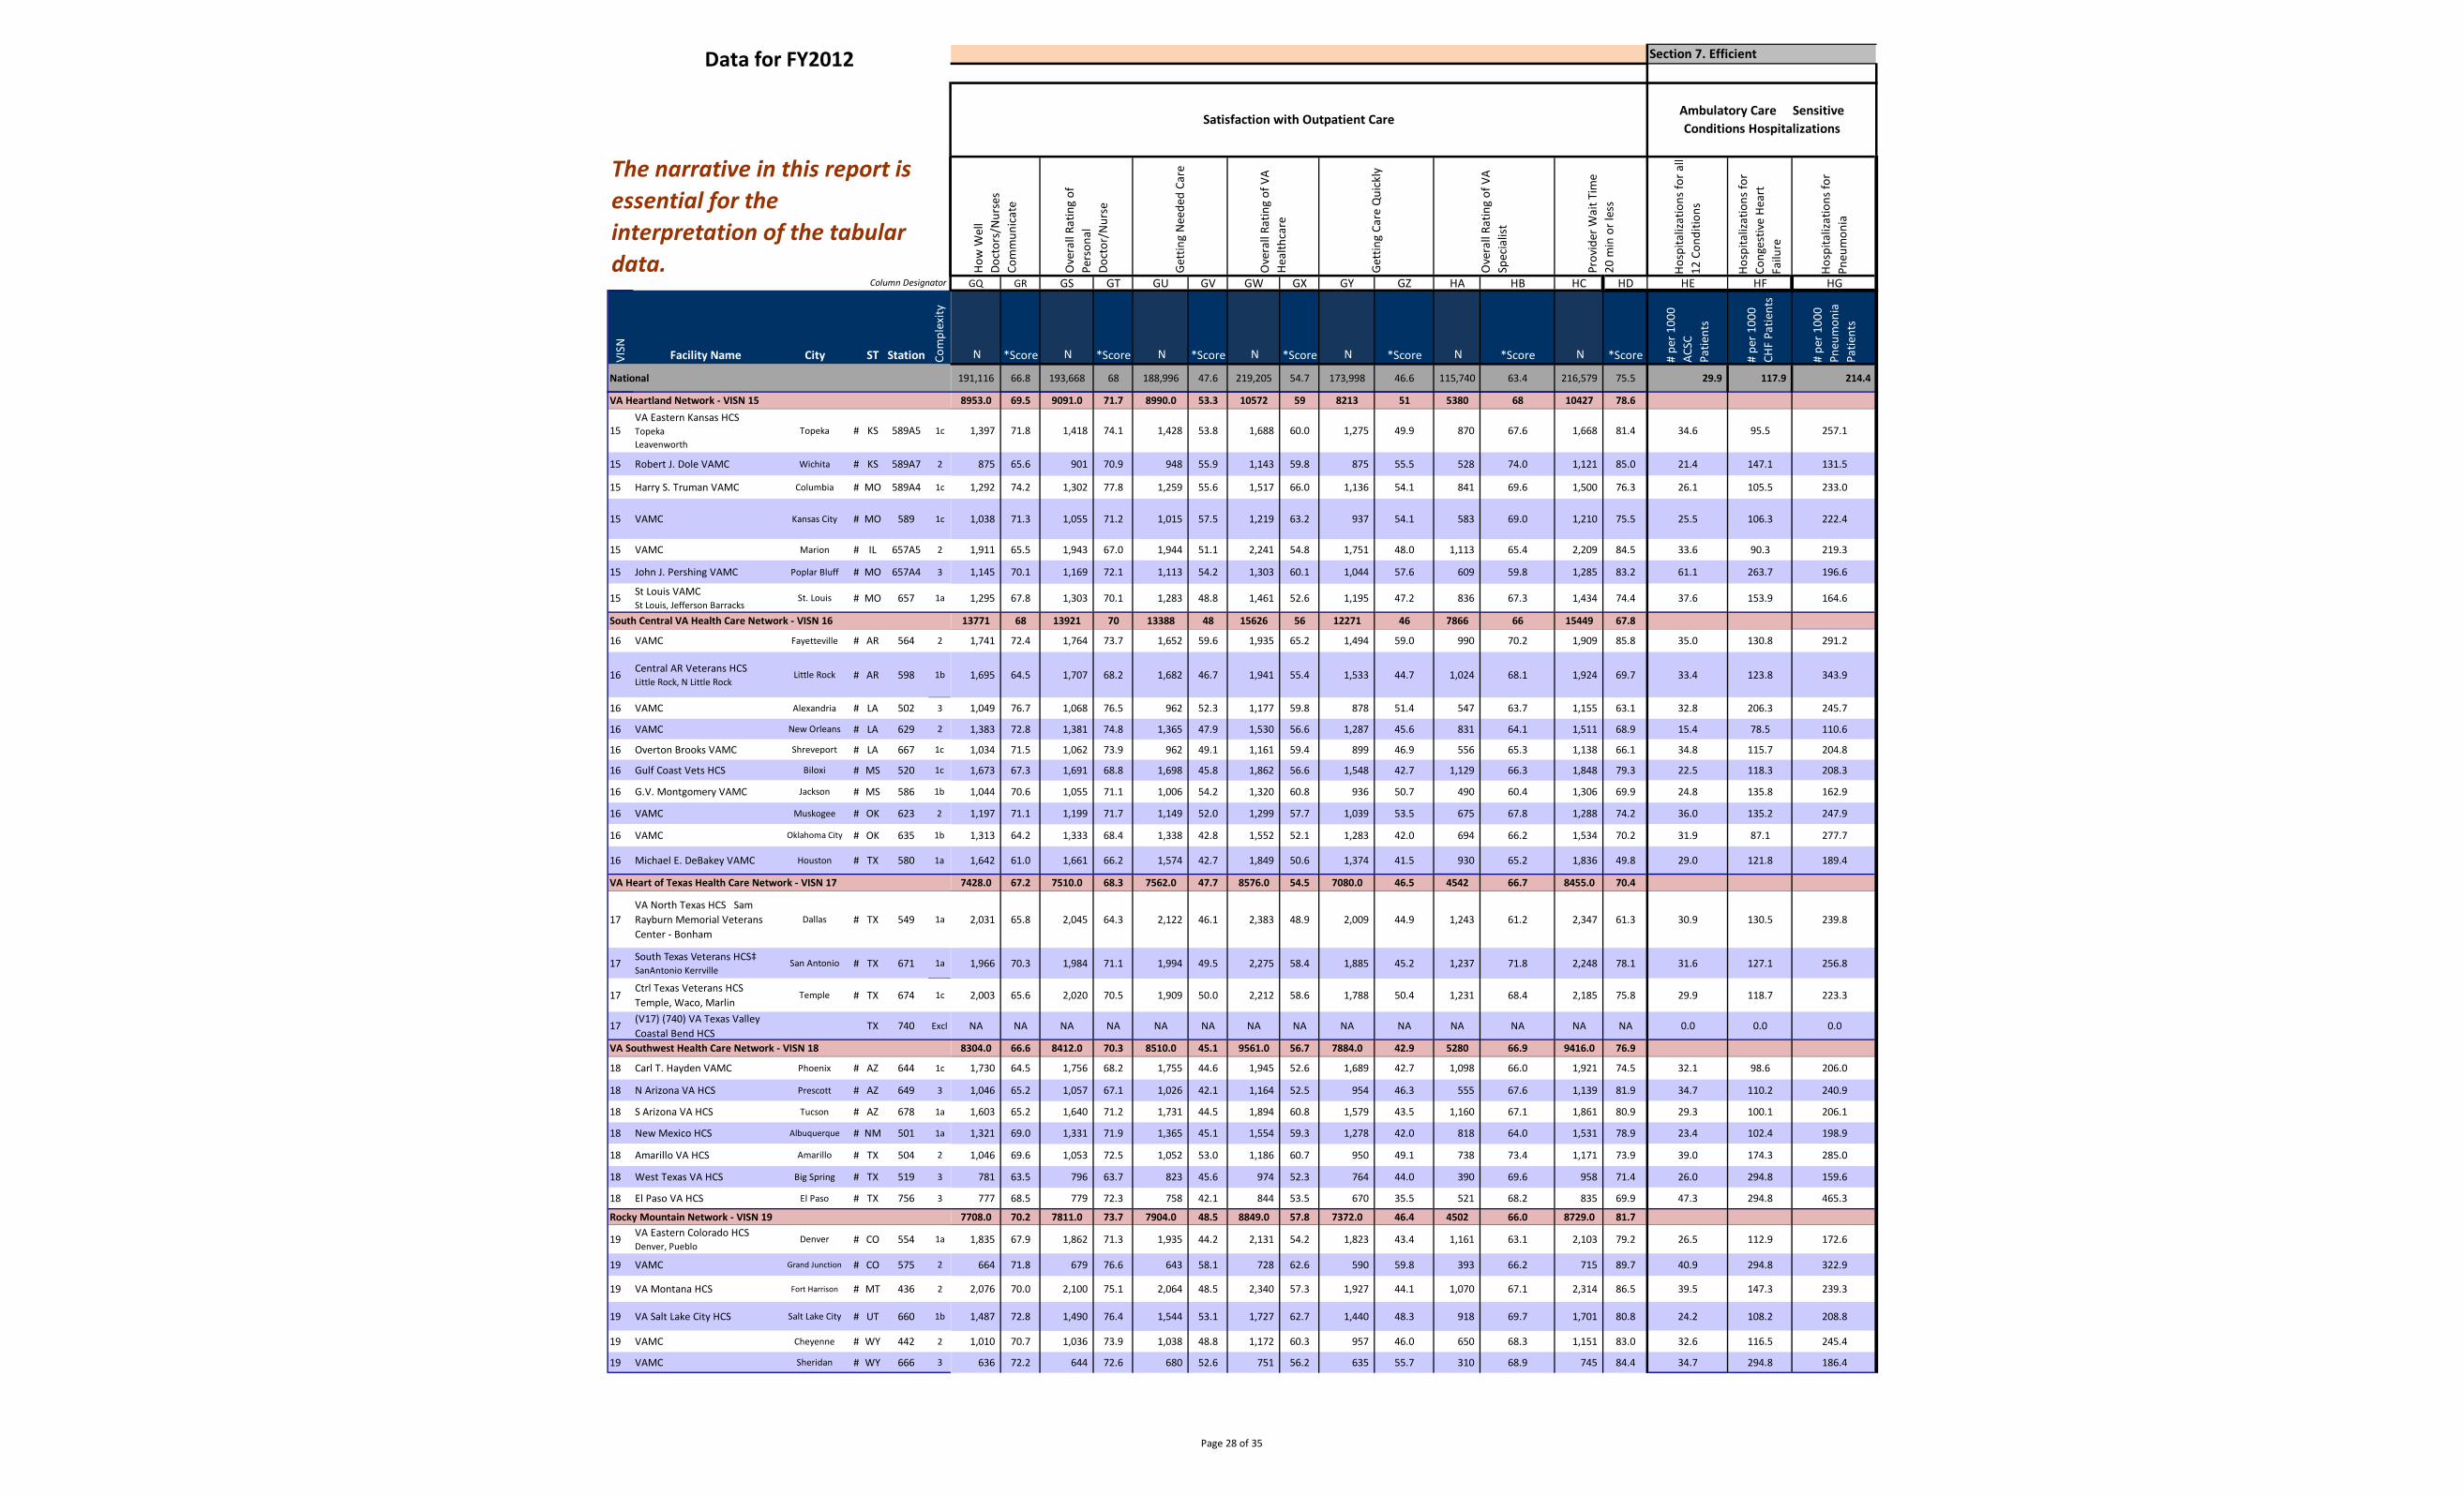
VISN Facility Name City ST Station Com
plex
ity
National
Data for FY2012
Column Designator
The narrative in this report is essential for the interpretation of the tabular data.
VA Heartland Network - VISN 15
15 VA Eastern Kansas HCS Topeka Leavenworth
Topeka # KS 589A5 1c
15 Robert J. Dole VAMC Wichita # KS 589A7 2
15 Harry S. Truman VAMC Columbia # MO 589A4 1c
15 VAMC Kansas City # MO 589 1c
15 VAMC Marion # IL 657A5 2
15 John J. Pershing VAMC Poplar Bluff # MO 657A4 3
15 St Louis VAMC St Louis, Jefferson Barracks
St. Louis # MO 657 1a
South Central VA Health Care Network - VISN 16
16 VAMC Fayetteville # AR 564 2
16 Central AR Veterans HCS Little Rock, N Little Rock
Little Rock # AR 598 1b
16 VAMC Alexandria # LA 502 3
16 VAMC New Orleans # LA 629 2
16 Overton Brooks VAMC Shreveport # LA 667 1c
16 Gulf Coast Vets HCS Biloxi # MS 520 1c
16 G.V. Montgomery VAMC Jackson # MS 586 1b
16 VAMC Muskogee # OK 623 2
16 VAMC Oklahoma City # OK 635 1b
16 Michael E. DeBakey VAMC Houston # TX 580 1a
VA Heart of Texas Health Care Network - VISN 17
17 VA North Texas HCS Sam Rayburn Memorial Veterans Center - Bonham
Dallas # TX 549 1a
17 South Texas Veterans HCS‡ SanAntonio Kerrville
San Antonio # TX 671 1a
17 Ctrl Texas Veterans HCS Temple, Waco, Marlin
Temple # TX 674 1c
17 (V17) (740) VA Texas Valley Coastal Bend HCS
TX 740 Excl
VA Southwest Health Care Network - VISN 18
18 Carl T. Hayden VAMC Phoenix # AZ 644 1c
18 N Arizona VA HCS Prescott # AZ 649 3
18 S Arizona VA HCS Tucson # AZ 678 1a
18 New Mexico HCS Albuquerque # NM 501 1a
18 Amarillo VA HCS Amarillo # TX 504 2
18 West Texas VA HCS Big Spring # TX 519 3
18 El Paso VA HCS El Paso # TX 756 3
Rocky Mountain Network - VISN 19
19 VA Eastern Colorado HCS Denver, Pueblo
Denver # CO 554 1a
19 VAMC Grand Junction # CO 575 2
19 VA Montana HCS Fort Harrison # MT 436 2
19 VA Salt Lake City HCS Salt Lake City # UT 660 1b
19 VAMC Cheyenne # WY 442 2
19 VAMC Sheridan # WY 666 3
Hosp
italiz
atio
ns fo
r all
12 C
ondi
tions
Hosp
italiz
atio
ns fo
rCo
nges
tive
Hear
t Fa
ilure
Hosp
italiz
atio
ns fo
rPn
eum
onia
GQ GR GS GT GU GV GW GX GY GZ HA HB HC HD HE HF HG
N *Score N *Score N *Score N *Score N *Score N *Score N *Score # pe
r 100
0 AC
SC
Patie
nts
# pe
r 100
0 CH
F Pa
tient
s
# pe
r 100
0 Pn
eum
onia
Patie
nts
191,116 66.8 193,668 68 188,996 47.6 219,205 54.7 173,998 46.6 115,740 63.4 216,579 75.5 29.9 117.9 214.4
Ambulatory Care Sensitive Conditions Hospitalizations
Prov
ider
Wai
t Tim
e20
min
or l
ess
How
Wel
l Do
ctor
s/N
urse
s Co
mm
unic
ate
Ove
rall
Ratin
g of
Pers
onal
Doct
or/N
urse
Gett
ing
Nee
ded
Care
Ove
rall
Ratin
g of
VA
Heal
thca
re
Gett
ing
Care
Qui
ckly
Satisfaction with Outpatient Care
Section 7. Efficient
Ove
rall
Ratin
g of
VA
Spec
ialis
t
8953.0 69.5 9091.0 71.7 8990.0 53.3 10572 59 8213 51 5380 68 10427 78.6
1,397 71.8 1,418 74.1 1,428 53.8 1,688 60.0 1,275 49.9 870 67.6 1,668 81.4 34.6 95.5 257.1
875 65.6 901 70.9 948 55.9 1,143 59.8 875 55.5 528 74.0 1,121 85.0 21.4 147.1 131.5
1,292 74.2 1,302 77.8 1,259 55.6 1,517 66.0 1,136 54.1 841 69.6 1,500 76.3 26.1 105.5 233.0
1,038 71.3 1,055 71.2 1,015 57.5 1,219 63.2 937 54.1 583 69.0 1,210 75.5 25.5 106.3 222.4
1,911 65.5 1,943 67.0 1,944 51.1 2,241 54.8 1,751 48.0 1,113 65.4 2,209 84.5 33.6 90.3 219.3
1,145 70.1 1,169 72.1 1,113 54.2 1,303 60.1 1,044 57.6 609 59.8 1,285 83.2 61.1 263.7 196.6
1,295 67.8 1,303 70.1 1,283 48.8 1,461 52.6 1,195 47.2 836 67.3 1,434 74.4 37.6 153.9 164.6
13771 68 13921 70 13388 48 15626 56 12271 46 7866 66 15449 67.8
1,741 72.4 1,764 73.7 1,652 59.6 1,935 65.2 1,494 59.0 990 70.2 1,909 85.8 35.0 130.8 291.2
1,695 64.5 1,707 68.2 1,682 46.7 1,941 55.4 1,533 44.7 1,024 68.1 1,924 69.7 33.4 123.8 343.9
1,049 76.7 1,068 76.5 962 52.3 1,177 59.8 878 51.4 547 63.7 1,155 63.1 32.8 206.3 245.7
1,383 72.8 1,381 74.8 1,365 47.9 1,530 56.6 1,287 45.6 831 64.1 1,511 68.9 15.4 78.5 110.6
1,034 71.5 1,062 73.9 962 49.1 1,161 59.4 899 46.9 556 65.3 1,138 66.1 34.8 115.7 204.8
1,673 67.3 1,691 68.8 1,698 45.8 1,862 56.6 1,548 42.7 1,129 66.3 1,848 79.3 22.5 118.3 208.3
1,044 70.6 1,055 71.1 1,006 54.2 1,320 60.8 936 50.7 490 60.4 1,306 69.9 24.8 135.8 162.9
1,197 71.1 1,199 71.7 1,149 52.0 1,299 57.7 1,039 53.5 675 67.8 1,288 74.2 36.0 135.2 247.9
1,313 64.2 1,333 68.4 1,338 42.8 1,552 52.1 1,283 42.0 694 66.2 1,534 70.2 31.9 87.1 277.7
1,642 61.0 1,661 66.2 1,574 42.7 1,849 50.6 1,374 41.5 930 65.2 1,836 49.8 29.0 121.8 189.4
7428.0 67.2 7510.0 68.3 7562.0 47.7 8576.0 54.5 7080.0 46.5 4542 66.7 8455.0 70.4
2,031 65.8 2,045 64.3 2,122 46.1 2,383 48.9 2,009 44.9 1,243 61.2 2,347 61.3 30.9 130.5 239.8
1,966 70.3 1,984 71.1 1,994 49.5 2,275 58.4 1,885 45.2 1,237 71.8 2,248 78.1 31.6 127.1 256.8
2,003 65.6 2,020 70.5 1,909 50.0 2,212 58.6 1,788 50.4 1,231 68.4 2,185 75.8 29.9 118.7 223.3
NA NA NA NA NA NA NA NA NA NA NA NA NA NA 0.0 0.0 0.0
8304.0 66.6 8412.0 70.3 8510.0 45.1 9561.0 56.7 7884.0 42.9 5280 66.9 9416.0 76.9
1,730 64.5 1,756 68.2 1,755 44.6 1,945 52.6 1,689 42.7 1,098 66.0 1,921 74.5 32.1 98.6 206.0
1,046 65.2 1,057 67.1 1,026 42.1 1,164 52.5 954 46.3 555 67.6 1,139 81.9 34.7 110.2 240.9
1,603 65.2 1,640 71.2 1,731 44.5 1,894 60.8 1,579 43.5 1,160 67.1 1,861 80.9 29.3 100.1 206.1
1,321 69.0 1,331 71.9 1,365 45.1 1,554 59.3 1,278 42.0 818 64.0 1,531 78.9 23.4 102.4 198.9
1,046 69.6 1,053 72.5 1,052 53.0 1,186 60.7 950 49.1 738 73.4 1,171 73.9 39.0 174.3 285.0
781 63.5 796 63.7 823 45.6 974 52.3 764 44.0 390 69.6 958 71.4 26.0 294.8 159.6
777 68.5 779 72.3 758 42.1 844 53.5 670 35.5 521 68.2 835 69.9 47.3 294.8 465.3
7708.0 70.2 7811.0 73.7 7904.0 48.5 8849.0 57.8 7372.0 46.4 4502 66.0 8729.0 81.7
1,835 67.9 1,862 71.3 1,935 44.2 2,131 54.2 1,823 43.4 1,161 63.1 2,103 79.2 26.5 112.9 172.6
664 71.8 679 76.6 643 58.1 728 62.6 590 59.8 393 66.2 715 89.7 40.9 294.8 322.9
2,076 70.0 2,100 75.1 2,064 48.5 2,340 57.3 1,927 44.1 1,070 67.1 2,314 86.5 39.5 147.3 239.3
1,487 72.8 1,490 76.4 1,544 53.1 1,727 62.7 1,440 48.3 918 69.7 1,701 80.8 24.2 108.2 208.8
1,010 70.7 1,036 73.9 1,038 48.8 1,172 60.3 957 46.0 650 68.3 1,151 83.0 32.6 116.5 245.4
636 72.2 644 72.6 680 52.6 751 56.2 635 55.7 310 68.9 745 84.4 34.7 294.8 186.4
Page 28 of 35
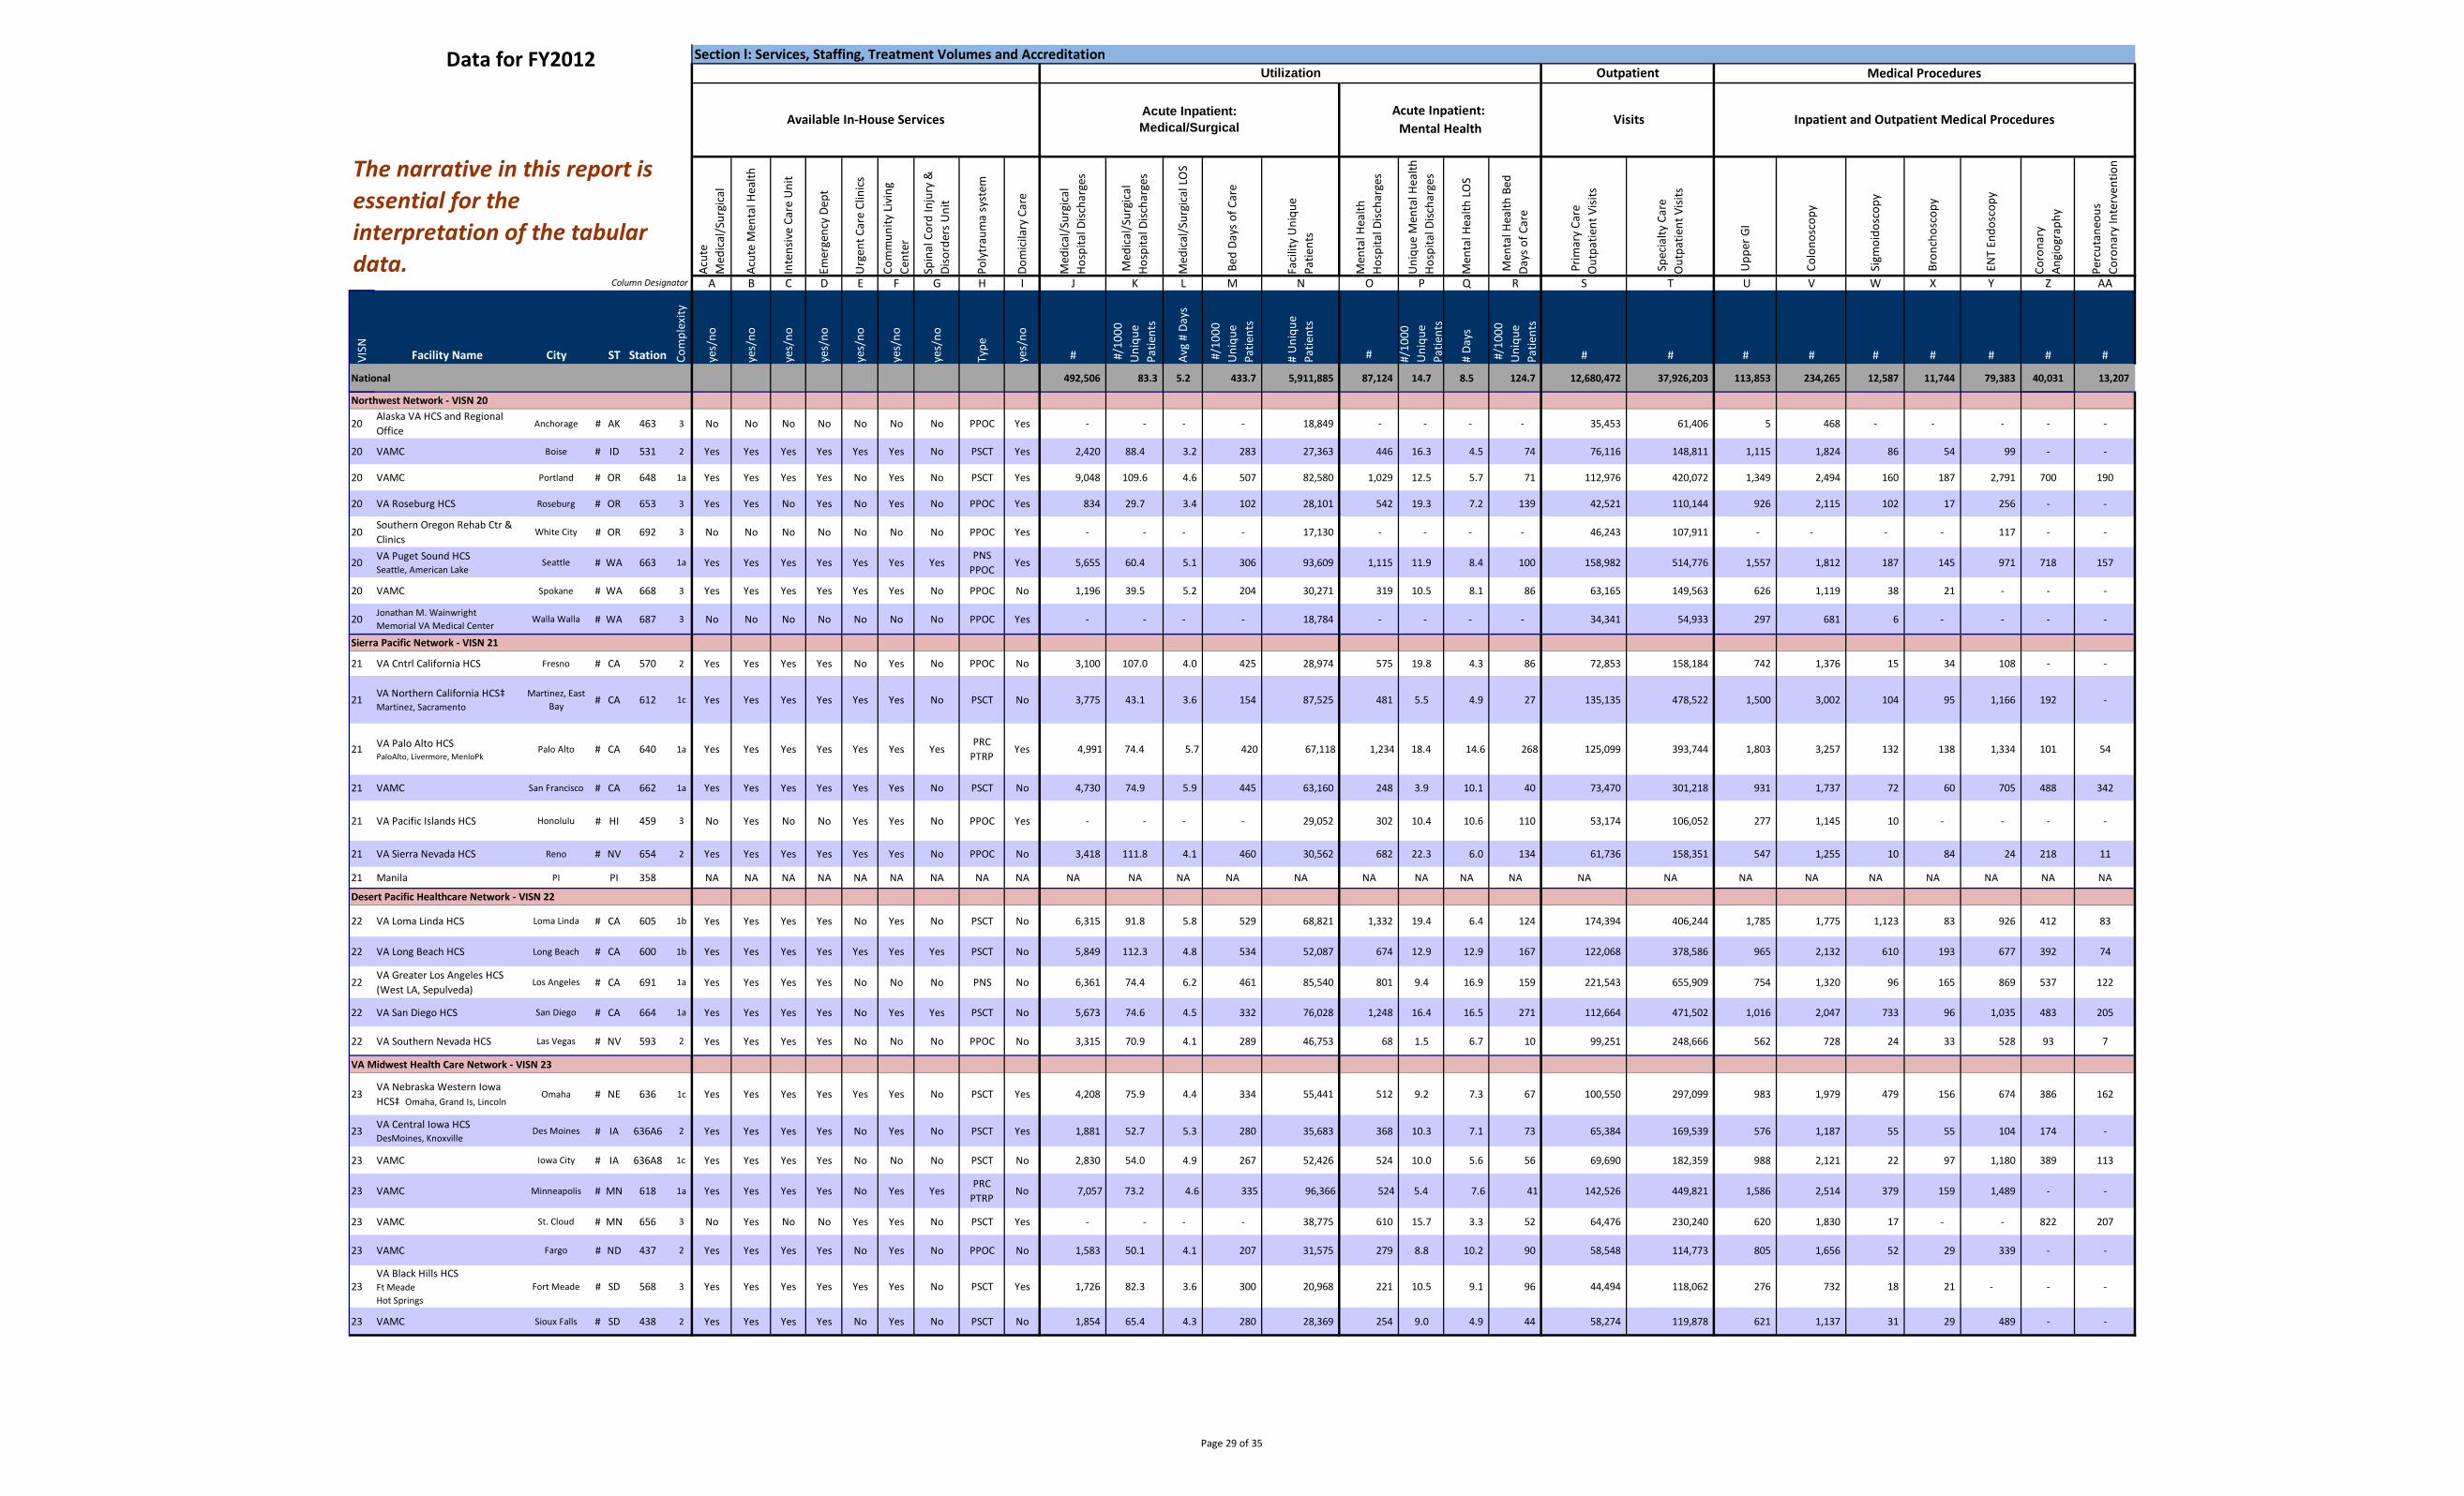
Data for FY2012
Column Designator
The narrative in this report is essential for the interpretation of the tabular data.
Section l: Services, Staffing, Treatment Volumes and Accreditation Utilization Outpatient Medical Procedures
Available In-House Services Acute Inpatient: Medical/Surgical
Acute Inpatient: Mental Health
Visits Inpatient and Outpatient Medical Procedures
Acut
eM
edic
al/S
urgi
cal
Acut
e M
enta
l Hea
lth
Inte
nsiv
e Ca
re U
nit
Emer
genc
y De
pt
Urg
ent C
are
Clin
ics
Com
mun
ity L
ivin
gCe
nter
Spin
al C
ord
Inju
ry &
Diso
rder
s Uni
t
Poly
trau
ma
syst
em
Dom
icila
ry C
are
Med
ical
/Sur
gica
l Ho
spita
l Disc
harg
es
Med
ical
/Sur
gica
lHo
spita
l Disc
harg
es
Med
ical
/Sur
gica
l LO
S
Bed
Day
s of C
are
Faci
lity
Uni
que
Patie
nts
Men
tal H
ealth
Hosp
ital D
ischa
rges
Uni
que
Men
tal H
ealth
Ho
spita
l Disc
harg
es
Men
tal H
ealth
LO
S
Men
tal H
ealth
Bed
Days
of C
are
Prim
ary
Care
Out
patie
nt V
isits
Spe
cial
ty C
are
Out
patie
nt V
isits
Upp
er G
I
Col
onos
copy
Sig
moi
dosc
opy
Bro
ncho
scop
y
EN
T En
dosc
opy
Coro
nary
Angi
ogra
phy
Perc
utan
eous
Coro
nary
Inte
rven
tion
A B C D E F G H I J K L M N O P Q R S T U V W X Y Z AA
VISN Facility Name City ST Station Com
plex
ity
yes/
no
yes/
no
yes/
no
yes/
no
yes/
no
yes/
no
yes/
no
Type
yes/
no
# #/1
000
Uni
que
Patie
nts
Avg
# Da
ys
#/1
000
Uni
que
Patie
nts
# U
niqu
ePa
tient
s
# #/10
00
Uni
que
Patie
nts
# Da
ys
#/1
000
Uni
que
Patie
nts
# # # # # # # # #
National 492,506 83.3 5.2 433.7 5,911,885 87,124 14.7 8.5 124.7 12,680,472 37,926,203 113,853 234,265 12,587 11,744 79,383 40,031 13,207
Northwest Network - VISN 20
20 Alaska VA HCS and Regional Office
Anchorage # AK 463 3 No No No No No No No PPOC Yes - - - - 18,849 - - - - 35,453 61,406 5 468 - - - - -
20 VAMC Boise # ID 531 2 Yes Yes Yes Yes Yes Yes No PSCT Yes 2,420 88.4 3.2 283 27,363 446 16.3 4.5 74 76,116 148,811 1,115 1,824 86 54 99 - -
20 VAMC Portland # OR 648 1a Yes Yes Yes Yes No Yes No PSCT Yes 9,048 109.6 4.6 507 82,580 1,029 12.5 5.7 71 112,976 420,072 1,349 2,494 160 187 2,791 700 190
20 VA Roseburg HCS Roseburg # OR 653 3 Yes Yes No Yes No Yes No PPOC Yes 834 29.7 3.4 102 28,101 542 19.3 7.2 139 42,521 110,144 926 2,115 102 17 256 - -
20 Southern Oregon Rehab Ctr & Clinics
White City # OR 692 3 No No No No No No No PPOC Yes - - - - 17,130 - - - - 46,243 107,911 - - - - 117 - -
20 VA Puget Sound HCS Seattle, American Lake
Seattle # WA 663 1a Yes Yes Yes Yes Yes Yes Yes PNS
PPOC Yes 5,655 60.4 5.1 306 93,609 1,115 11.9 8.4 100 158,982 514,776 1,557 1,812 187 145 971 718 157
20 VAMC Spokane # WA 668 3 Yes Yes Yes Yes Yes Yes No PPOC No 1,196 39.5 5.2 204 30,271 319 10.5 8.1 86 63,165 149,563 626 1,119 38 21 - - -
20 Jonathan M. Wainwright Memorial VA Medical Center
Walla Walla # WA 687 3 No No No No No No No PPOC Yes - - - - 18,784 - - - - 34,341 54,933 297 681 6 - - - -
Sierra Pacific Network - VISN 21
21 VA Cntrl California HCS Fresno # CA 570 2 Yes Yes Yes Yes No Yes No PPOC No 3,100 107.0 4.0 425 28,974 575 19.8 4.3 86 72,853 158,184 742 1,376 15 34 108 - -
21 VA Northern California HCS‡ Martinez, Sacramento
Martinez, East Bay # CA 612 1c Yes Yes Yes Yes Yes Yes No PSCT No 3,775 43.1 3.6 154 87,525 481 5.5 4.9 27 135,135 478,522 1,500 3,002 104 95 1,166 192 -
21 VA Palo Alto HCS PaloAlto, Livermore, MenloPk
Palo Alto # CA 640 1a Yes Yes Yes Yes Yes Yes Yes PRC
PTRP Yes 4,991 74.4 5.7 420 67,118 1,234 18.4 14.6 268 125,099 393,744 1,803 3,257 132 138 1,334 101 54
21 VAMC San Francisco # CA 662 1a Yes Yes Yes Yes Yes Yes No PSCT No 4,730 74.9 5.9 445 63,160 248 3.9 10.1 40 73,470 301,218 931 1,737 72 60 705 488 342
21 VA Pacific Islands HCS Honolulu # HI 459 3 No Yes No No Yes Yes No PPOC Yes - - - - 29,052 302 10.4 10.6 110 53,174 106,052 277 1,145 10 - - - -
21 VA Sierra Nevada HCS Reno # NV 654 2 Yes Yes Yes Yes Yes Yes No PPOC No 3,418 111.8 4.1 460 30,562 682 22.3 6.0 134 61,736 158,351 547 1,255 10 84 24 218 11
21 Manila PI PI 358 NA NA NA NA NA NA NA NA NA NA NA NA NA NA NA NA NA NA NA NA NA NA NA NA NA NA NA
Desert Pacific Healthcare Network - VISN 22
22 VA Loma Linda HCS Loma Linda # CA 605 1b Yes Yes Yes Yes No Yes No PSCT No 6,315 91.8 5.8 529 68,821 1,332 19.4 6.4 124 174,394 406,244 1,785 1,775 1,123 83 926 412 83
22 VA Long Beach HCS Long Beach # CA 600 1b Yes Yes Yes Yes Yes Yes Yes PSCT No 5,849 112.3 4.8 534 52,087 674 12.9 12.9 167 122,068 378,586 965 2,132 610 193 677 392 74
22 VA Greater Los Angeles HCS (West LA, Sepulveda)
Los Angeles # CA 691 1a Yes Yes Yes Yes No No No PNS No 6,361 74.4 6.2 461 85,540 801 9.4 16.9 159 221,543 655,909 754 1,320 96 165 869 537 122
22 VA San Diego HCS San Diego # CA 664 1a Yes Yes Yes Yes No Yes Yes PSCT No 5,673 74.6 4.5 332 76,028 1,248 16.4 16.5 271 112,664 471,502 1,016 2,047 733 96 1,035 483 205
22 VA Southern Nevada HCS Las Vegas # NV 593 2 Yes Yes Yes Yes No No No PPOC No 3,315 70.9 4.1 289 46,753 68 1.5 6.7 10 99,251 248,666 562 728 24 33 528 93 7
VA Midwest Health Care Network - VISN 23
23 VA Nebraska Western Iowa HCS‡ Omaha, Grand Is, Lincoln
Omaha # NE 636 1c Yes Yes Yes Yes Yes Yes No PSCT Yes 4,208 75.9 4.4 334 55,441 512 9.2 7.3 67 100,550 297,099 983 1,979 479 156 674 386 162
23 VA Central Iowa HCS DesMoines, Knoxville
Des Moines # IA 636A6 2 Yes Yes Yes Yes No Yes No PSCT Yes 1,881 52.7 5.3 280 35,683 368 10.3 7.1 73 65,384 169,539 576 1,187 55 55 104 174 -
23 VAMC Iowa City # IA 636A8 1c Yes Yes Yes Yes No No No PSCT No 2,830 54.0 4.9 267 52,426 524 10.0 5.6 56 69,690 182,359 988 2,121 22 97 1,180 389 113
23 VAMC Minneapolis # MN 618 1a Yes Yes Yes Yes No Yes Yes PRC
PTRP No 7,057 73.2 4.6 335 96,366 524 5.4 7.6 41 142,526 449,821 1,586 2,514 379 159 1,489 - -
23 VAMC St. Cloud # MN 656 3 No Yes No No Yes Yes No PSCT Yes - - - - 38,775 610 15.7 3.3 52 64,476 230,240 620 1,830 17 - - 822 207
23 VAMC Fargo # ND 437 2 Yes Yes Yes Yes No Yes No PPOC No 1,583 50.1 4.1 207 31,575 279 8.8 10.2 90 58,548 114,773 805 1,656 52 29 339 - -
23 VA Black Hills HCS Ft Meade Hot Springs
Fort Meade # SD 568 3 Yes Yes Yes Yes Yes Yes No PSCT Yes 1,726 82.3 3.6 300 20,968 221 10.5 9.1 96 44,494 118,062 276 732 18 21 - - -
23 VAMC Sioux Falls # SD 438 2 Yes Yes Yes Yes No Yes No PSCT No 1,854 65.4 4.3 280 28,369 254 9.0 4.9 44 58,274 119,878 621 1,137 31 29 489 - -
Page 29 of 35
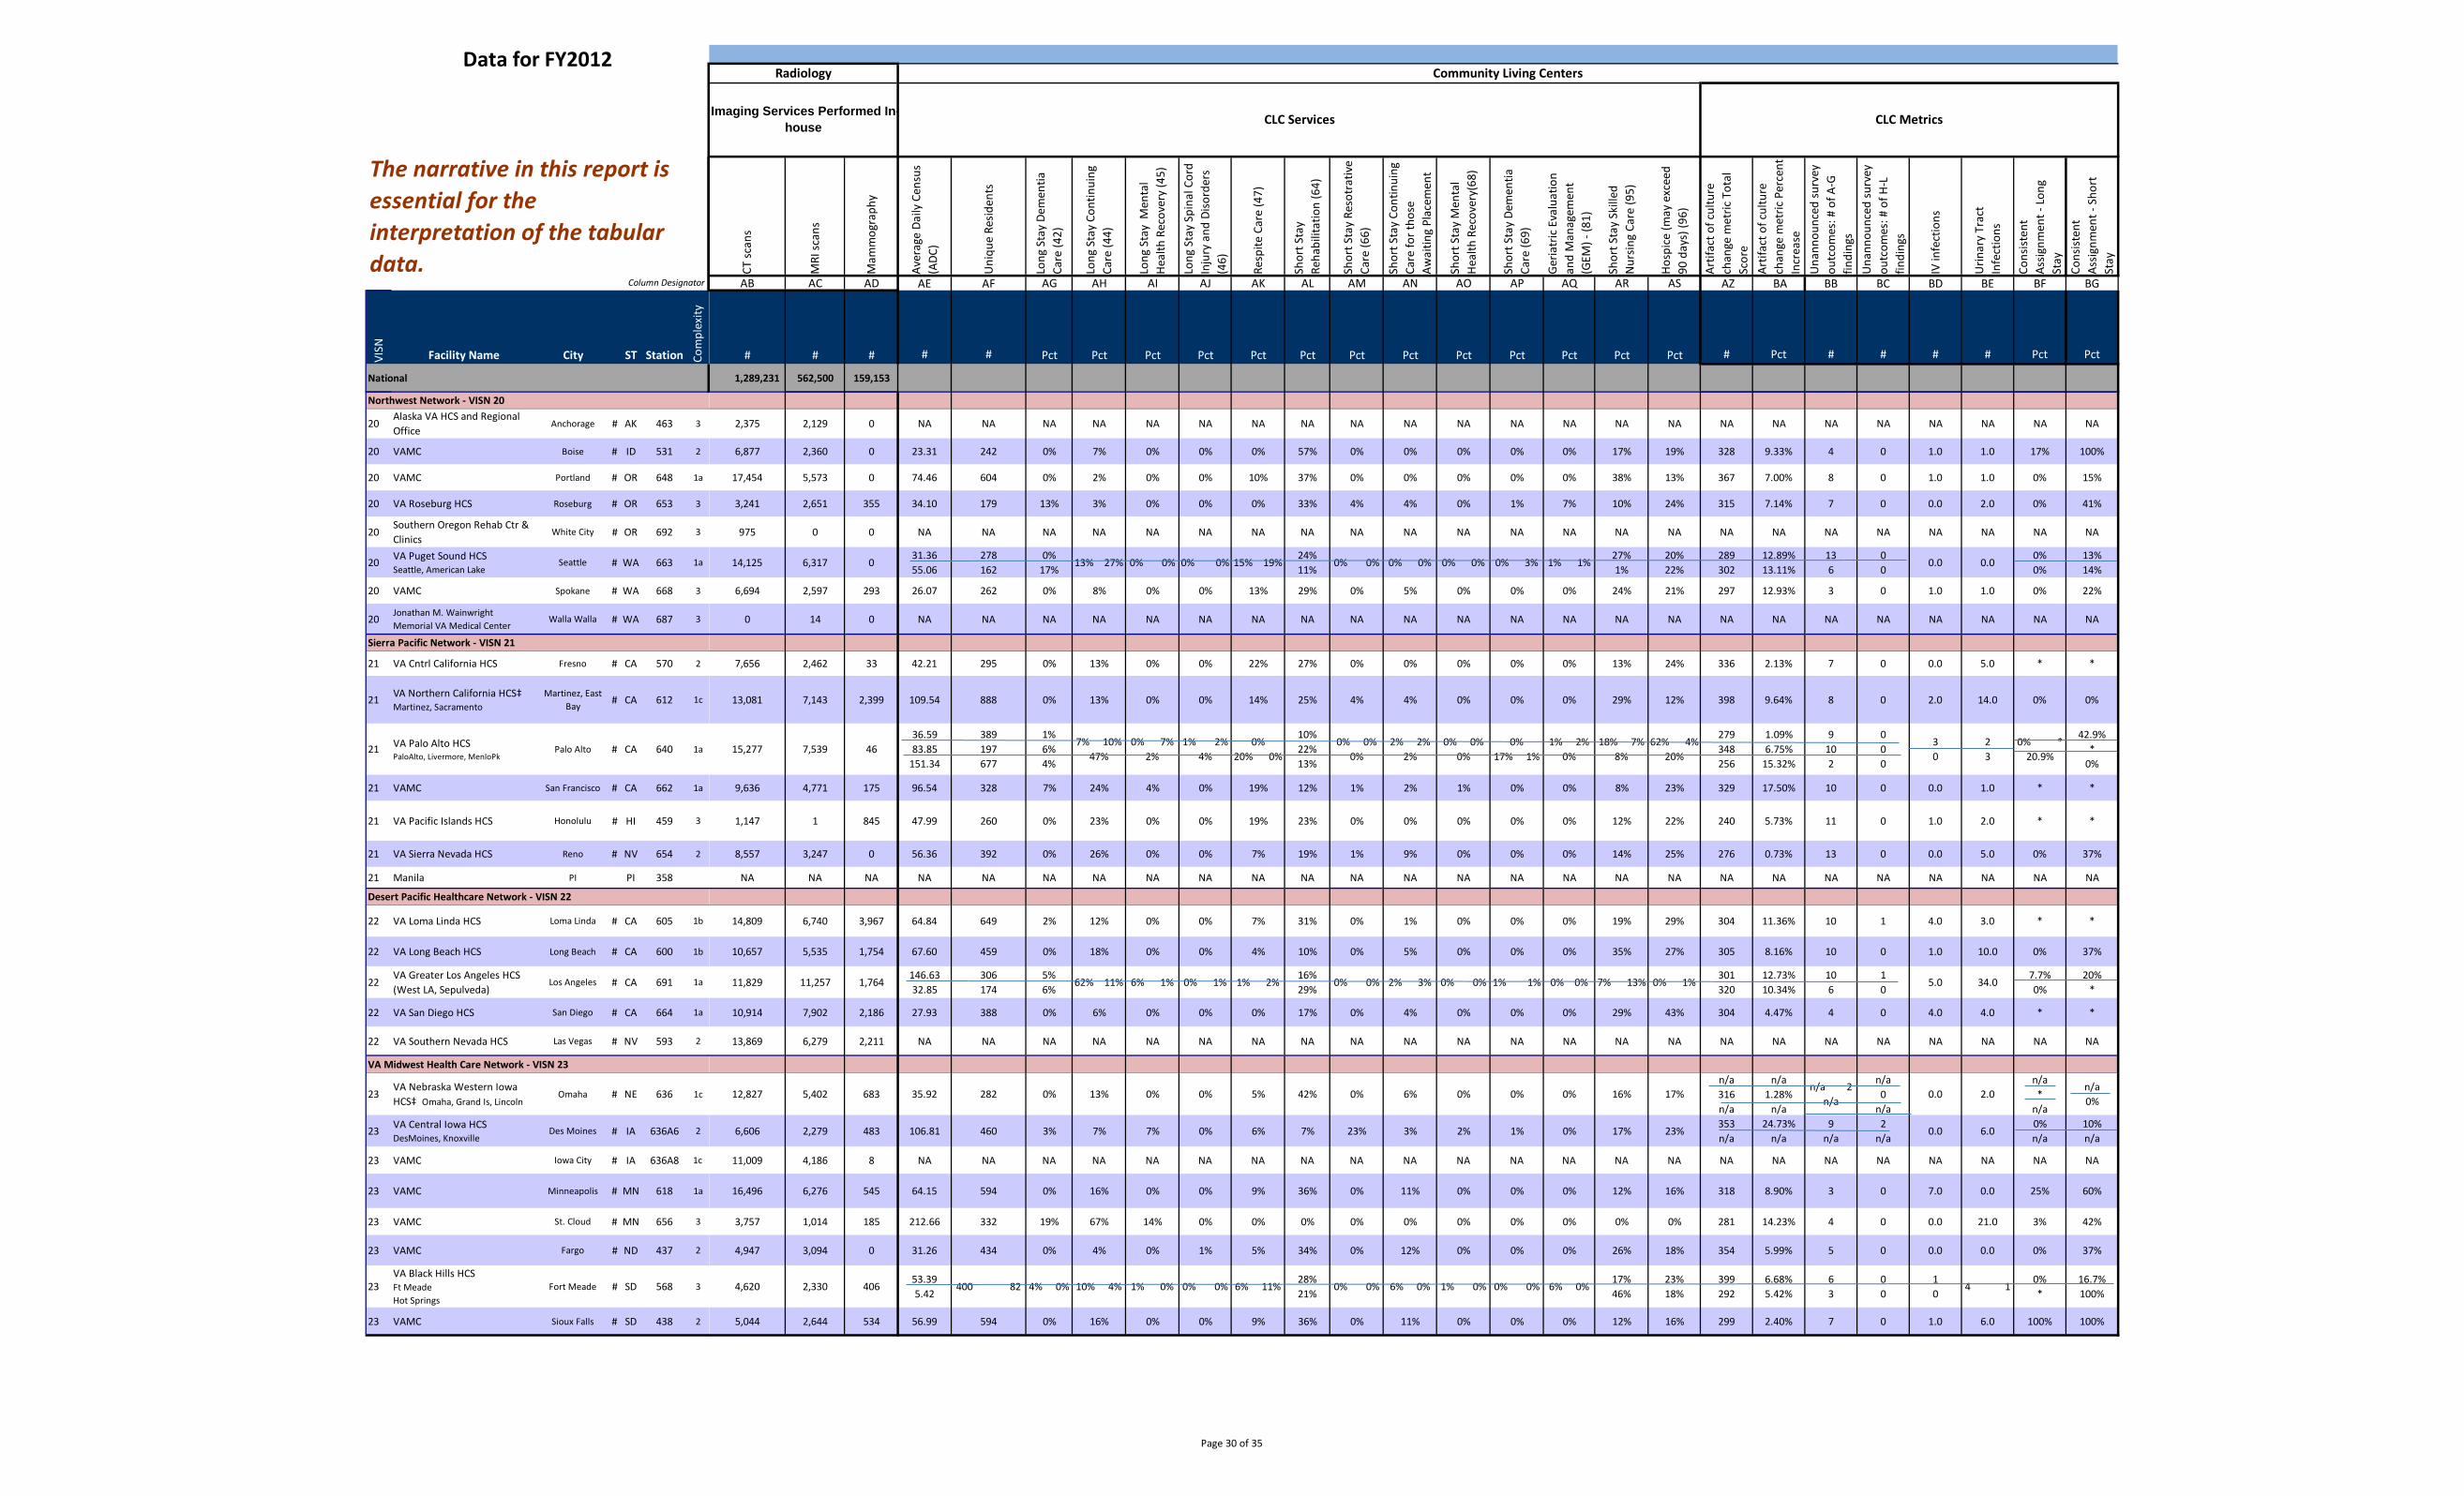
VISN Facility Name City ST Station Com
plex
ity
National
Data for FY2012
Column Designator
The narrative in this report is essential for the interpretation of the tabular data.
Northwest Network - VISN 20
20 Alaska VA HCS and Regional Office
Anchorage # AK 463 3
20 VAMC Boise # ID 531 2
20 VAMC Portland # OR 648 1a
20 VA Roseburg HCS Roseburg # OR 653 3
20 Southern Oregon Rehab Ctr & Clinics
White City # OR 692 3
20 VA Puget Sound HCS Seattle, American Lake
Seattle # WA 663 1a
20 VAMC Spokane # WA 668 3
20 Jonathan M. Wainwright Memorial VA Medical Center
Walla Walla # WA 687 3
Sierra Pacific Network - VISN 21
21 VA Cntrl California HCS Fresno # CA 570 2
21 VA Northern California HCS‡ Martinez, Sacramento
Martinez, East Bay # CA 612 1c
21 VA Palo Alto HCS PaloAlto, Livermore, MenloPk
Palo Alto # CA 640 1a
21 VAMC San Francisco # CA 662 1a
21 VA Pacific Islands HCS Honolulu # HI 459 3
21 VA Sierra Nevada HCS Reno # NV 654 2
21 Manila PI PI 358
Desert Pacific Healthcare Network - VISN 22
22 VA Loma Linda HCS Loma Linda # CA 605 1b
22 VA Long Beach HCS Long Beach # CA 600 1b
22 VA Greater Los Angeles HCS (West LA, Sepulveda)
Los Angeles # CA 691 1a
22 VA San Diego HCS San Diego # CA 664 1a
22 VA Southern Nevada HCS Las Vegas # NV 593 2
VA Midwest Health Care Network - VISN 23
23 VA Nebraska Western Iowa HCS‡ Omaha, Grand Is, Lincoln
Omaha # NE 636 1c
23 VA Central Iowa HCS DesMoines, Knoxville
Des Moines # IA 636A6 2
23 VAMC Iowa City # IA 636A8 1c
23 VAMC Minneapolis # MN 618 1a
23 VAMC St. Cloud # MN 656 3
23 VAMC Fargo # ND 437 2
23 VA Black Hills HCS Ft Meade Hot Springs
Fort Meade # SD 568 3
23 VAMC Sioux Falls # SD 438 2
CT s
cans
MRI
scan
s
Mam
mog
raph
y
Aver
age
Daily
Cen
sus
(ADC
)
Uni
que
Resid
ents
Long
Sta
y De
men
tiaCa
re (4
2)
Long
Sta
y Co
ntin
uing
Care
(44)
Long
Sta
y M
enta
lHe
alth
Rec
over
y (4
5)
Long
Sta
y Sp
inal
Cor
d In
jury
and
Diso
rder
s(4
6)
Resp
ite C
are
(47)
Shor
t Sta
yRe
habi
litat
ion
(64)
Shor
t Sta
y Re
sotr
ativ
eCa
re (6
6)
Shor
t Sta
y Co
ntin
uing
Care
for t
hose
Awai
ting
Plac
emen
t
Shor
t Sta
y M
enta
lHe
alth
Rec
over
y(68
)
Shor
t Sta
y De
men
tiaCa
re (6
9)
Geria
tric
Eva
luat
ion
and
Man
agem
ent
(GEM
) - (8
1)
Shor
t Sta
y Sk
illed
Nur
sing
Care
(95)
Hosp
ice
(may
exc
eed
90 d
ays)
(96)
Artif
act o
f cul
ture
chan
ge m
etric
Tot
alSc
ore
Artif
act o
f cul
ture
chan
ge m
etric
Per
cent
In
crea
seU
nann
ounc
ed su
rvey
outc
omes
: # o
f A-G
findi
ngs
Una
nnou
nced
surv
eyou
tcom
es: #
of H
-Lfin
ding
s
IV in
fect
ions
Urin
ary
Trac
tIn
fect
ions
Cons
isten
t As
signm
ent -
Lon
gSt
ayCo
nsist
ent
Assig
nmen
t -Sh
ort
Stay
AB AC AD AE AF AG AH AI AJ AK AL AM AN AO AP AQ AR AS AZ BA BB BC BD BE BF BG
# # # # # Pct Pct Pct Pct Pct Pct Pct Pct Pct Pct Pct Pct Pct # Pct # # # # Pct Pct
1,289,231 562,500 159,153
CLC Services
Radiology Community Living Centers
CLC Metrics Imaging Services Performed In-house
2,375 2,129 0 NA NA NA NA NA NA NA NA NA NA NA NA NA NA NA NA NA NA NA NA NA NA NA
6,877 2,360 0 23.31 242 0% 7% 0% 0% 0% 57% 0% 0% 0% 0% 0% 17% 19% 328 9.33% 4 0 1.0 1.0 17% 100%
17,454 5,573 0 74.46 604 0% 2% 0% 0% 10% 37% 0% 0% 0% 0% 0% 38% 13% 367 7.00% 8 0 1.0 1.0 0% 15%
3,241 2,651 355 34.10 179 13% 3% 0% 0% 0% 33% 4% 4% 0% 1% 7% 10% 24% 315 7.14% 7 0 0.0 2.0 0% 41%
975 0 0 NA NA NA NA NA NA NA NA NA NA NA NA NA NA NA NA NA NA NA NA NA NA NA
14,125 6,317 0 31.36 55.06
278 162
0% 17%
13% 27% 0% 0% 0% 0% 15% 19% 24% 11%
0% 0% 0% 0% 0% 0% 0% 3% 1% 1% 27% 1%
20% 22%
289 302
12.89% 13.11%
13 6
0 0
0.0 0.0 0% 0%
13% 14%
6,694 2,597 293 26.07 262 0% 8% 0% 0% 13% 29% 0% 5% 0% 0% 0% 24% 21% 297 12.93% 3 0 1.0 1.0 0% 22%
0 14 0 NA NA NA NA NA NA NA NA NA NA NA NA NA NA NA NA NA NA NA NA NA NA NA
7,656 2,462 33 42.21 295 0% 13% 0% 0% 22% 27% 0% 0% 0% 0% 0% 13% 24% 336 2.13% 7 0 0.0 5.0 * *
13,081 7,143 2,399 109.54 888 0% 13% 0% 0% 14% 25% 4% 4% 0% 0% 0% 29% 12% 398 9.64% 8 0 2.0 14.0 0% 0%
15,277 7,539 46 36.59 83.85
151.34
389 197 677
1% 6% 4%
7% 10% 47%
0% 7% 2%
1% 2% 4%
0% 20% 0%
10% 22% 13%
0% 0% 0%
2% 2% 2%
0% 0% 0%
0% 17% 1%
1% 2% 0%
18% 7% 8%
62% 4% 20%
279 348 256
1.09% 6.75%
15.32%
9 10 2
0 0 0
3 0
2 3
0% * 20.9%
42.9% *
0%
9,636 4,771 175 96.54 328 7% 24% 4% 0% 19% 12% 1% 2% 1% 0% 0% 8% 23% 329 17.50% 10 0 0.0 1.0 * *
1,147 1 845 47.99 260 0% 23% 0% 0% 19% 23% 0% 0% 0% 0% 0% 12% 22% 240 5.73% 11 0 1.0 2.0 * *
8,557 3,247 0 56.36 392 0% 26% 0% 0% 7% 19% 1% 9% 0% 0% 0% 14% 25% 276 0.73% 13 0 0.0 5.0 0% 37%
NA NA NA NA NA NA NA NA NA NA NA NA NA NA NA NA NA NA NA NA NA NA NA NA NA NA
14,809 6,740 3,967 64.84 649 2% 12% 0% 0% 7% 31% 0% 1% 0% 0% 0% 19% 29% 304 11.36% 10 1 4.0 3.0 * *
10,657 5,535 1,754 67.60 459 0% 18% 0% 0% 4% 10% 0% 5% 0% 0% 0% 35% 27% 305 8.16% 10 0 1.0 10.0 0% 37%
11,829 11,257 1,764 146.63 32.85
306 174
5% 6%
62% 11% 6% 1% 0% 1% 1% 2% 16% 29%
0% 0% 2% 3% 0% 0% 1% 1% 0% 0% 7% 13% 0% 1% 301 320
12.73% 10.34%
10 6
1 0
5.0 34.0 7.7% 0%
20% *
10,914 7,902 2,186 27.93 388 0% 6% 0% 0% 0% 17% 0% 4% 0% 0% 0% 29% 43% 304 4.47% 4 0 4.0 4.0 * *
13,869 6,279 2,211 NA NA NA NA NA NA NA NA NA NA NA NA NA NA NA NA NA NA NA NA NA NA NA
12,827 5,402 683 35.92 282 0% 13% 0% 0% 5% 42% 0% 6% 0% 0% 0% 16% 17% n/a 316 n/a
n/a 1.28%
n/a
n/a 2 n/a
n/a 0
n/a 0.0 2.0
n/a *
n/a
n/a 0%
6,606 2,279 483 106.81 460 3% 7% 7% 0% 6% 7% 23% 3% 2% 1% 0% 17% 23% 353 n/a
24.73% n/a
9 n/a
2 n/a
0.0 6.0 0% n/a
10% n/a
11,009 4,186 8 NA NA NA NA NA NA NA NA NA NA NA NA NA NA NA NA NA NA NA NA NA NA NA
16,496 6,276 545 64.15 594 0% 16% 0% 0% 9% 36% 0% 11% 0% 0% 0% 12% 16% 318 8.90% 3 0 7.0 0.0 25% 60%
3,757 1,014 185 212.66 332 19% 67% 14% 0% 0% 0% 0% 0% 0% 0% 0% 0% 0% 281 14.23% 4 0 0.0 21.0 3% 42%
4,947 3,094 0 31.26 434 0% 4% 0% 1% 5% 34% 0% 12% 0% 0% 0% 26% 18% 354 5.99% 5 0 0.0 0.0 0% 37%
4,620 2,330 406 53.39 5.42
400 82 4% 0% 10% 4% 1% 0% 0% 0% 6% 11% 28% 21%
0% 0% 6% 0% 1% 0% 0% 0% 6% 0% 17% 46%
23% 18%
399 292
6.68% 5.42%
6 3
0 0
1 0
4 1 0% *
16.7% 100%
5,044 2,644 534 56.99 594 0% 16% 0% 0% 9% 36% 0% 11% 0% 0% 0% 12% 16% 299 2.40% 7 0 1.0 6.0 100% 100%
Page 30 of 35
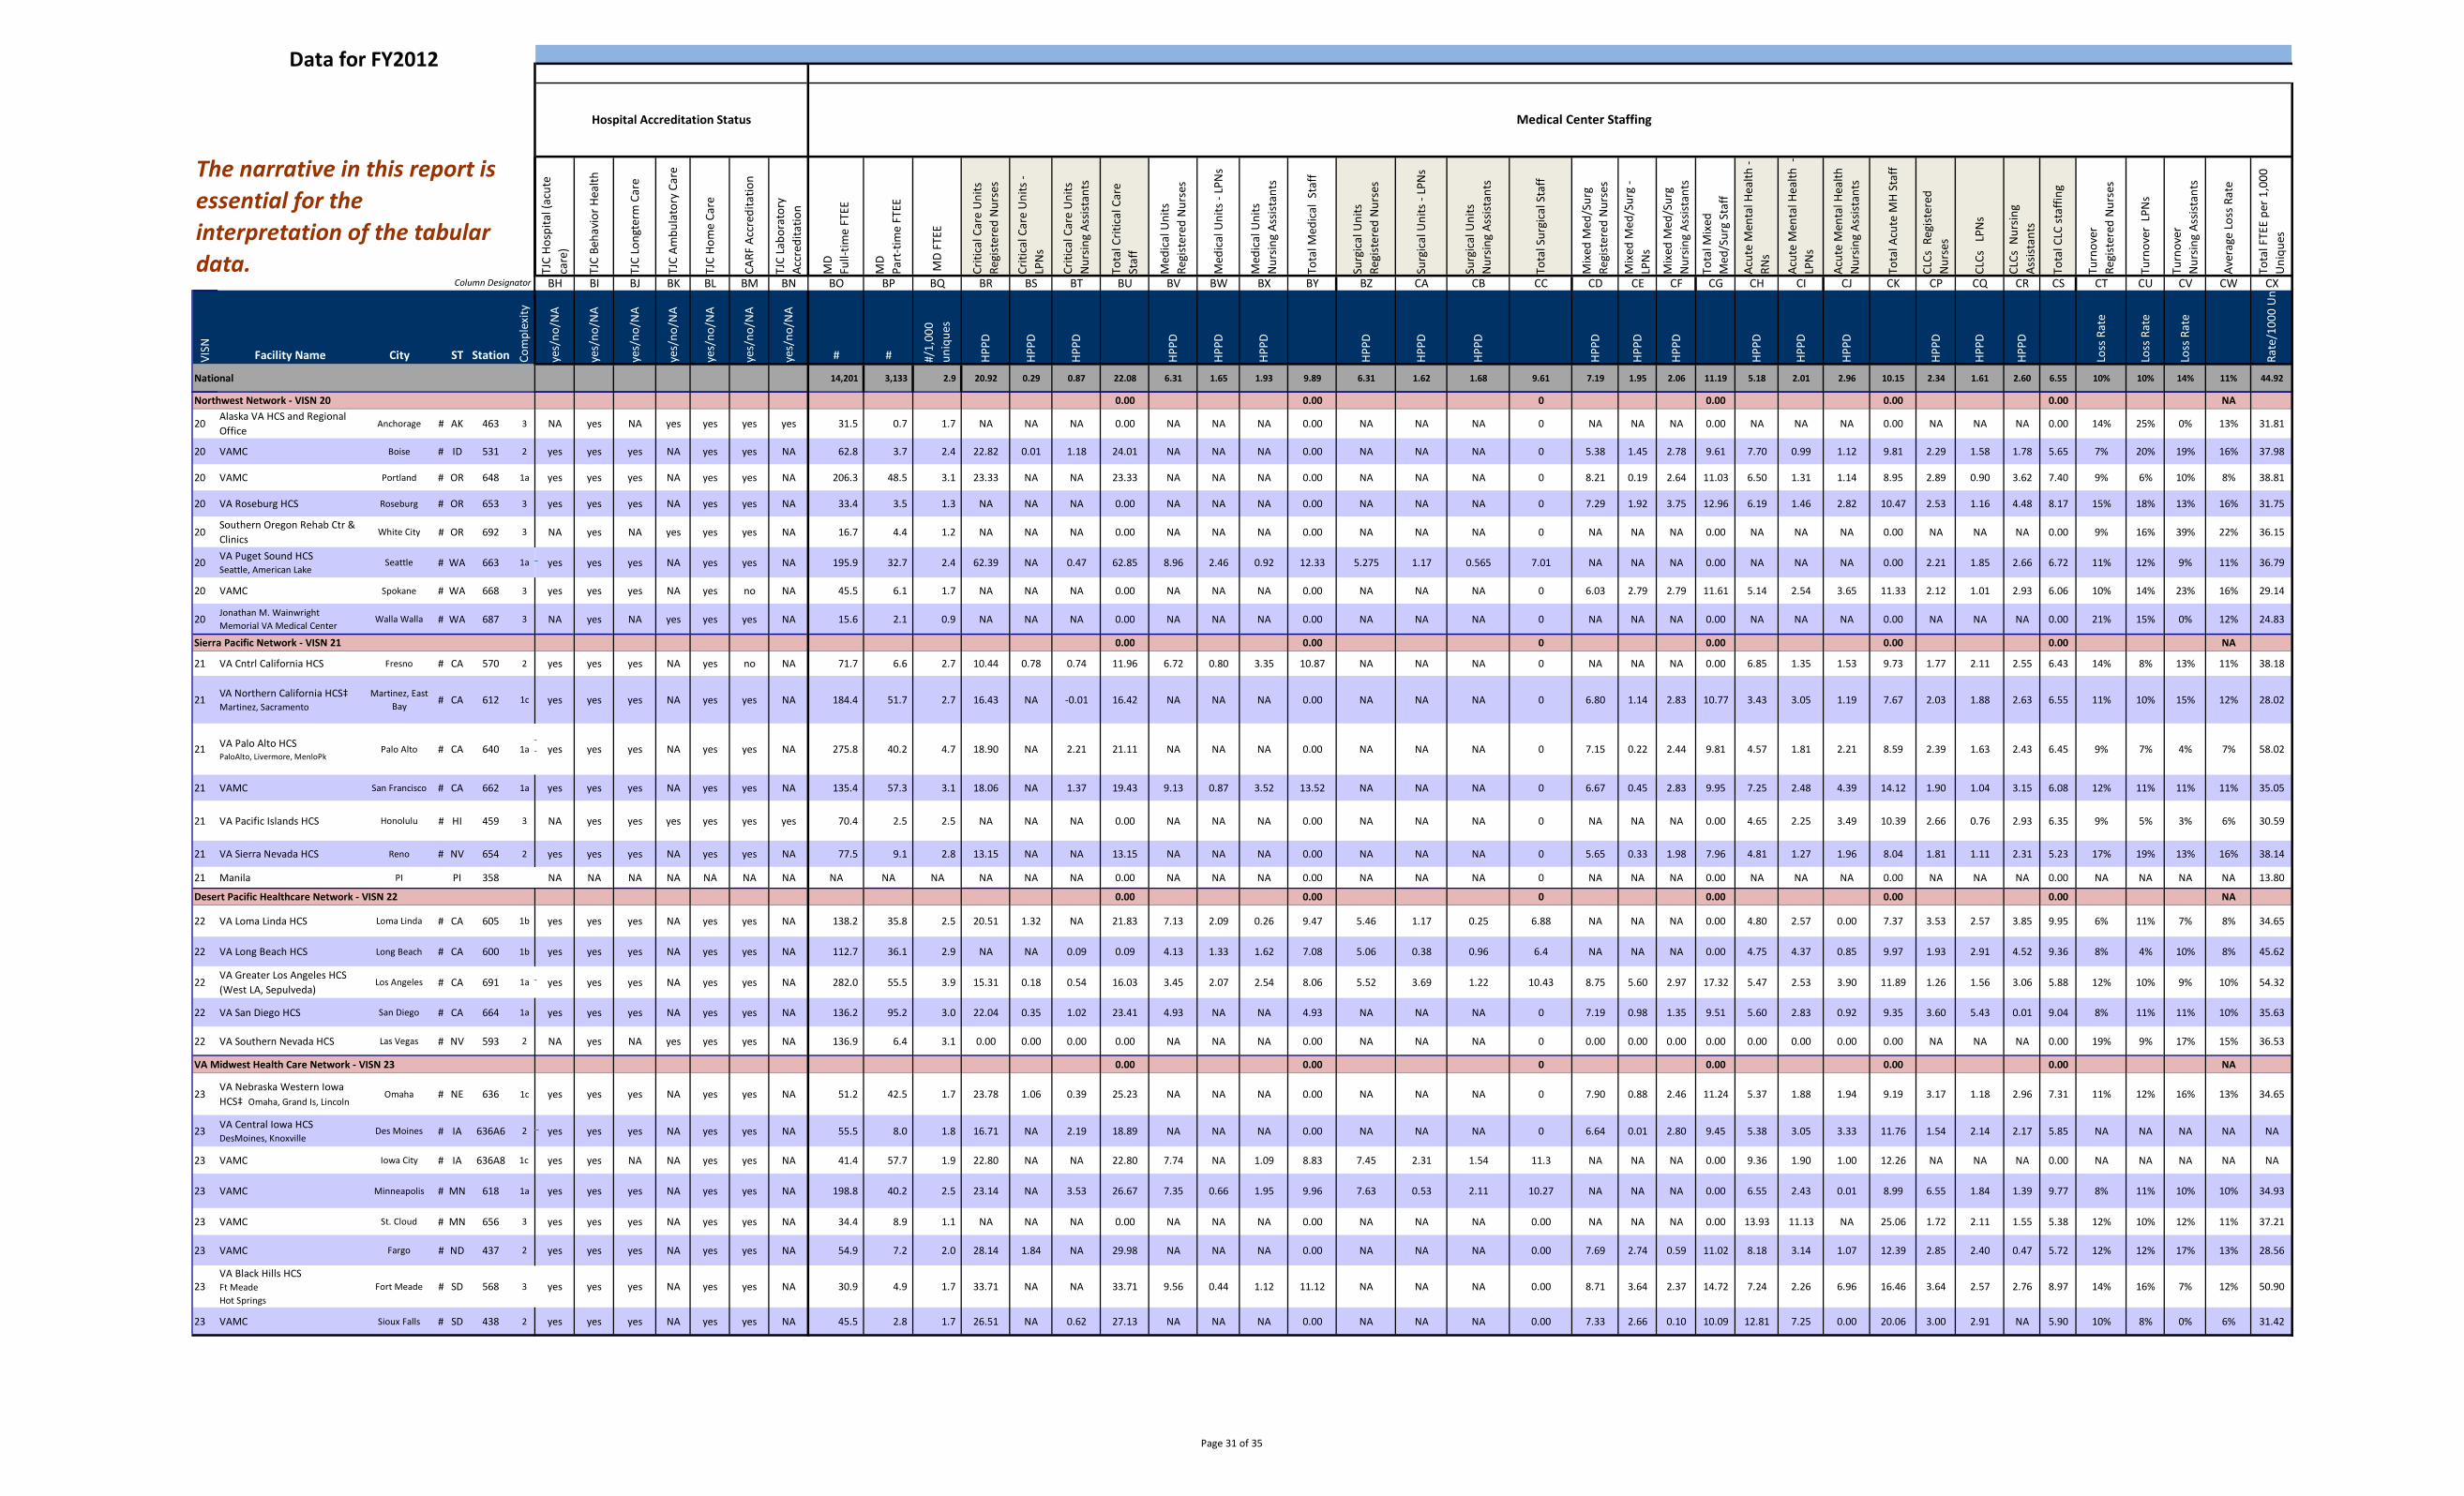
Data for FY2012
Column Designator
The narrative in this report is essential for the interpretation of the tabular data.
Hospital Accreditation Status Medical Center Staffing
TJC
Hosp
ital (
acut
eca
re)
TJC
Beha
vior
Hea
lth
TJC
Long
term
Car
e
TJC
Ambu
lato
ry C
are
TJC
Hom
e Ca
re
CARF
Acc
redi
tatio
n
TJC
Labo
rato
ryAc
cred
itatio
n
MD
Full-
time
FTEE
MD
Part
-tim
e FT
EE
MD
FTEE
Criti
cal C
are
Uni
tsRe
gist
ered
Nur
ses
Criti
cal C
are
Uni
ts -
LPN
s
Criti
cal C
are
Uni
tsN
ursin
g As
sista
nts
Tota
l Crit
ical
Car
eSt
aff
Med
ical
Uni
tsRe
gist
ered
Nur
ses
Med
ical
Uni
ts -
LPN
s
Med
ical
Uni
tsN
ursin
g As
sista
nts
Tota
l Med
ical
Sta
ff
Surg
ical
Uni
tsRe
gist
ered
Nur
ses
Surg
ical
Uni
ts -
LPN
s
Surg
ical
Uni
tsN
ursin
g As
sista
nts
Tota
l Sur
gica
l Sta
ff
Mix
ed M
ed/S
urg
Regi
ster
ed N
urse
s
Mix
ed M
ed/S
urg
-LP
Ns
Mix
ed M
ed/S
urg
Nur
sing
Assis
tant
s
Tota
l Mix
edM
ed/S
urg
Staf
f
Acut
e M
enta
l Hea
lth -
RNs
Acut
e M
enta
l Hea
lth -
LPN
s
Acut
e M
enta
l Hea
lthN
ursin
g As
sista
nts
Tota
l Acu
te M
H St
aff
CLCs
Reg
ister
edN
urse
s
CLCs
LPN
s
CLCs
Nur
sing
Assis
tant
s
Tota
l CLC
staf
fing
Turn
over
Re
gist
ered
Nur
ses
Turn
over
LPN
s
Turn
over
N
ursin
g As
sista
nts
Aver
age
Loss
Rat
e
Tota
l FTE
E pe
r 1,0
00
Uni
ques
BH BI BJ BK BL BM BN BO BP BQ BR BS BT BU BV BW BX BY BZ CA CB CC CD CE CF CG CH CI CJ CK CP CQ CR CS CT CU CV CW CX
VISN Facility Name City ST Station Com
plex
ity
yes/
no/N
A
yes/
no/N
A
yes/
no/N
A
yes/
no/N
A
yes/
no/N
A
yes/
no/N
A
yes/
no/N
A
# # #/1,
000
uniq
ues
HPPD
HPPD
HPPD
HPPD
HPPD
HPPD
HPPD
HPPD
HPPD
HPPD
HPPD
HPPD
HPPD
HPPD
HPPD
HPPD
HPPD
HPPD
Loss
Rat
e
Loss
Rat
e
Loss
Rat
e
Rate
/100
0 U
n
National 14,201 3,133 2.9 20.92 0.29 0.87 22.08 6.31 1.65 1.93 9.89 6.31 1.62 1.68 9.61 7.19 1.95 2.06 11.19 5.18 2.01 2.96 10.15 2.34 1.61 2.60 6.55 10% 10% 14% 11% 44.92
Northwest Network - VISN 20 0.00 0.00 0 0.00 0.00 0.00 NA
20 Alaska VA HCS and Regional Office
Anchorage # AK 463 3 NA yes NA yes yes yes yes 31.5 0.7 1.7 NA NA NA 0.00 NA NA NA 0.00 NA NA NA 0 NA NA NA 0.00 NA NA NA 0.00 NA NA NA 0.00 14% 25% 0% 13% 31.81
20 VAMC Boise # ID 531 2 yes yes yes NA yes yes NA 62.8 3.7 2.4 22.82 0.01 1.18 24.01 NA NA NA 0.00 NA NA NA 0 5.38 1.45 2.78 9.61 7.70 0.99 1.12 9.81 2.29 1.58 1.78 5.65 7% 20% 19% 16% 37.98
20 VAMC Portland # OR 648 1a yes yes yes NA yes yes NA 206.3 48.5 3.1 23.33 NA NA 23.33 NA NA NA 0.00 NA NA NA 0 8.21 0.19 2.64 11.03 6.50 1.31 1.14 8.95 2.89 0.90 3.62 7.40 9% 6% 10% 8% 38.81
20 VA Roseburg HCS Roseburg # OR 653 3 yes yes yes NA yes yes NA 33.4 3.5 1.3 NA NA NA 0.00 NA NA NA 0.00 NA NA NA 0 7.29 1.92 3.75 12.96 6.19 1.46 2.82 10.47 2.53 1.16 4.48 8.17 15% 18% 13% 16% 31.75
20 Southern Oregon Rehab Ctr & Clinics
White City # OR 692 3 NA yes NA yes yes yes NA 16.7 4.4 1.2 NA NA NA 0.00 NA NA NA 0.00 NA NA NA 0 NA NA NA 0.00 NA NA NA 0.00 NA NA NA 0.00 9% 16% 39% 22% 36.15
20 VA Puget Sound HCS Seattle, American Lake
Seattle # WA 663 1a yes yes yes NA yes yes NA 195.9 32.7 2.4 62.39 NA 0.47 62.85 8.96 2.46 0.92 12.33 5.275 1.17 0.565 7.01 NA NA NA 0.00 NA NA NA 0.00 2.21 1.85 2.66 6.72 11% 12% 9% 11% 36.79
20 VAMC Spokane # WA 668 3 yes yes yes NA yes no NA 45.5 6.1 1.7 NA NA NA 0.00 NA NA NA 0.00 NA NA NA 0 6.03 2.79 2.79 11.61 5.14 2.54 3.65 11.33 2.12 1.01 2.93 6.06 10% 14% 23% 16% 29.14
20 Jonathan M. Wainwright Memorial VA Medical Center
Walla Walla # WA 687 3 NA yes NA yes yes yes NA 15.6 2.1 0.9 NA NA NA 0.00 NA NA NA 0.00 NA NA NA 0 NA NA NA 0.00 NA NA NA 0.00 NA NA NA 0.00 21% 15% 0% 12% 24.83
Sierra Pacific Network - VISN 21 0.00 0.00 0 0.00 0.00 0.00 NA
21 VA Cntrl California HCS Fresno # CA 570 2 yes yes yes NA yes no NA 71.7 6.6 2.7 10.44 0.78 0.74 11.96 6.72 0.80 3.35 10.87 NA NA NA 0 NA NA NA 0.00 6.85 1.35 1.53 9.73 1.77 2.11 2.55 6.43 14% 8% 13% 11% 38.18
21 VA Northern California HCS‡ Martinez, Sacramento
Martinez, East Bay # CA 612 1c yes yes yes NA yes yes NA 184.4 51.7 2.7 16.43 NA -0.01 16.42 NA NA NA 0.00 NA NA NA 0 6.80 1.14 2.83 10.77 3.43 3.05 1.19 7.67 2.03 1.88 2.63 6.55 11% 10% 15% 12% 28.02
21 VA Palo Alto HCS PaloAlto, Livermore, MenloPk
Palo Alto # CA 640 1a yes yes yes NA yes yes NA 275.8 40.2 4.7 18.90 NA 2.21 21.11 NA NA NA 0.00 NA NA NA 0 7.15 0.22 2.44 9.81 4.57 1.81 2.21 8.59 2.39 1.63 2.43 6.45 9% 7% 4% 7% 58.02
21 VAMC San Francisco # CA 662 1a yes yes yes NA yes yes NA 135.4 57.3 3.1 18.06 NA 1.37 19.43 9.13 0.87 3.52 13.52 NA NA NA 0 6.67 0.45 2.83 9.95 7.25 2.48 4.39 14.12 1.90 1.04 3.15 6.08 12% 11% 11% 11% 35.05
21 VA Pacific Islands HCS Honolulu # HI 459 3 NA yes yes yes yes yes yes 70.4 2.5 2.5 NA NA NA 0.00 NA NA NA 0.00 NA NA NA 0 NA NA NA 0.00 4.65 2.25 3.49 10.39 2.66 0.76 2.93 6.35 9% 5% 3% 6% 30.59
21 VA Sierra Nevada HCS Reno # NV 654 2 yes yes yes NA yes yes NA 77.5 9.1 2.8 13.15 NA NA 13.15 NA NA NA 0.00 NA NA NA 0 5.65 0.33 1.98 7.96 4.81 1.27 1.96 8.04 1.81 1.11 2.31 5.23 17% 19% 13% 16% 38.14
21 Manila PI PI 358 NA NA NA NA NA NA NA NA NA NA NA NA NA 0.00 NA NA NA 0.00 NA NA NA 0 NA NA NA 0.00 NA NA NA 0.00 NA NA NA 0.00 NA NA NA NA 13.80
Desert Pacific Healthcare Network - VISN 22 0.00 0.00 0 0.00 0.00 0.00 NA
22 VA Loma Linda HCS Loma Linda # CA 605 1b yes yes yes NA yes yes NA 138.2 35.8 2.5 20.51 1.32 NA 21.83 7.13 2.09 0.26 9.47 5.46 1.17 0.25 6.88 NA NA NA 0.00 4.80 2.57 0.00 7.37 3.53 2.57 3.85 9.95 6% 11% 7% 8% 34.65
22 VA Long Beach HCS Long Beach # CA 600 1b yes yes yes NA yes yes NA 112.7 36.1 2.9 NA NA 0.09 0.09 4.13 1.33 1.62 7.08 5.06 0.38 0.96 6.4 NA NA NA 0.00 4.75 4.37 0.85 9.97 1.93 2.91 4.52 9.36 8% 4% 10% 8% 45.62
22 VA Greater Los Angeles HCS (West LA, Sepulveda)
Los Angeles # CA 691 1a yes yes yes NA yes yes NA 282.0 55.5 3.9 15.31 0.18 0.54 16.03 3.45 2.07 2.54 8.06 5.52 3.69 1.22 10.43 8.75 5.60 2.97 17.32 5.47 2.53 3.90 11.89 1.26 1.56 3.06 5.88 12% 10% 9% 10% 54.32
22 VA San Diego HCS San Diego # CA 664 1a yes yes yes NA yes yes NA 136.2 95.2 3.0 22.04 0.35 1.02 23.41 4.93 NA NA 4.93 NA NA NA 0 7.19 0.98 1.35 9.51 5.60 2.83 0.92 9.35 3.60 5.43 0.01 9.04 8% 11% 11% 10% 35.63
22 VA Southern Nevada HCS Las Vegas # NV 593 2 NA yes NA yes yes yes NA 136.9 6.4 3.1 0.00 0.00 0.00 0.00 NA NA NA 0.00 NA NA NA 0 0.00 0.00 0.00 0.00 0.00 0.00 0.00 0.00 NA NA NA 0.00 19% 9% 17% 15% 36.53
VA Midwest Health Care Network - VISN 23 0.00 0.00 0 0.00 0.00 0.00 NA
23 VA Nebraska Western Iowa HCS‡ Omaha, Grand Is, Lincoln
Omaha # NE 636 1c yes yes yes NA yes yes NA 51.2 42.5 1.7 23.78 1.06 0.39 25.23 NA NA NA 0.00 NA NA NA 0 7.90 0.88 2.46 11.24 5.37 1.88 1.94 9.19 3.17 1.18 2.96 7.31 11% 12% 16% 13% 34.65
23 VA Central Iowa HCS DesMoines, Knoxville
Des Moines # IA 636A6 2 yes yes yes NA yes yes NA 55.5 8.0 1.8 16.71 NA 2.19 18.89 NA NA NA 0.00 NA NA NA 0 6.64 0.01 2.80 9.45 5.38 3.05 3.33 11.76 1.54 2.14 2.17 5.85 NA NA NA NA NA
23 VAMC Iowa City # IA 636A8 1c yes yes NA NA yes yes NA 41.4 57.7 1.9 22.80 NA NA 22.80 7.74 NA 1.09 8.83 7.45 2.31 1.54 11.3 NA NA NA 0.00 9.36 1.90 1.00 12.26 NA NA NA 0.00 NA NA NA NA NA
23 VAMC Minneapolis # MN 618 1a yes yes yes NA yes yes NA 198.8 40.2 2.5 23.14 NA 3.53 26.67 7.35 0.66 1.95 9.96 7.63 0.53 2.11 10.27 NA NA NA 0.00 6.55 2.43 0.01 8.99 6.55 1.84 1.39 9.77 8% 11% 10% 10% 34.93
23 VAMC St. Cloud # MN 656 3 yes yes yes NA yes yes NA 34.4 8.9 1.1 NA NA NA 0.00 NA NA NA 0.00 NA NA NA 0.00 NA NA NA 0.00 13.93 11.13 NA 25.06 1.72 2.11 1.55 5.38 12% 10% 12% 11% 37.21
23 VAMC Fargo # ND 437 2 yes yes yes NA yes yes NA 54.9 7.2 2.0 28.14 1.84 NA 29.98 NA NA NA 0.00 NA NA NA 0.00 7.69 2.74 0.59 11.02 8.18 3.14 1.07 12.39 2.85 2.40 0.47 5.72 12% 12% 17% 13% 28.56
23 VA Black Hills HCS Ft Meade Hot Springs
Fort Meade # SD 568 3 yes yes yes NA yes yes NA 30.9 4.9 1.7 33.71 NA NA 33.71 9.56 0.44 1.12 11.12 NA NA NA 0.00 8.71 3.64 2.37 14.72 7.24 2.26 6.96 16.46 3.64 2.57 2.76 8.97 14% 16% 7% 12% 50.90
23 VAMC Sioux Falls # SD 438 2 yes yes yes NA yes yes NA 45.5 2.8 1.7 26.51 NA 0.62 27.13 NA NA NA 0.00 NA NA NA 0.00 7.33 2.66 0.10 10.09 12.81 7.25 0.00 20.06 3.00 2.91 NA 5.90 10% 8% 0% 6% 31.42
Page 31 of 35
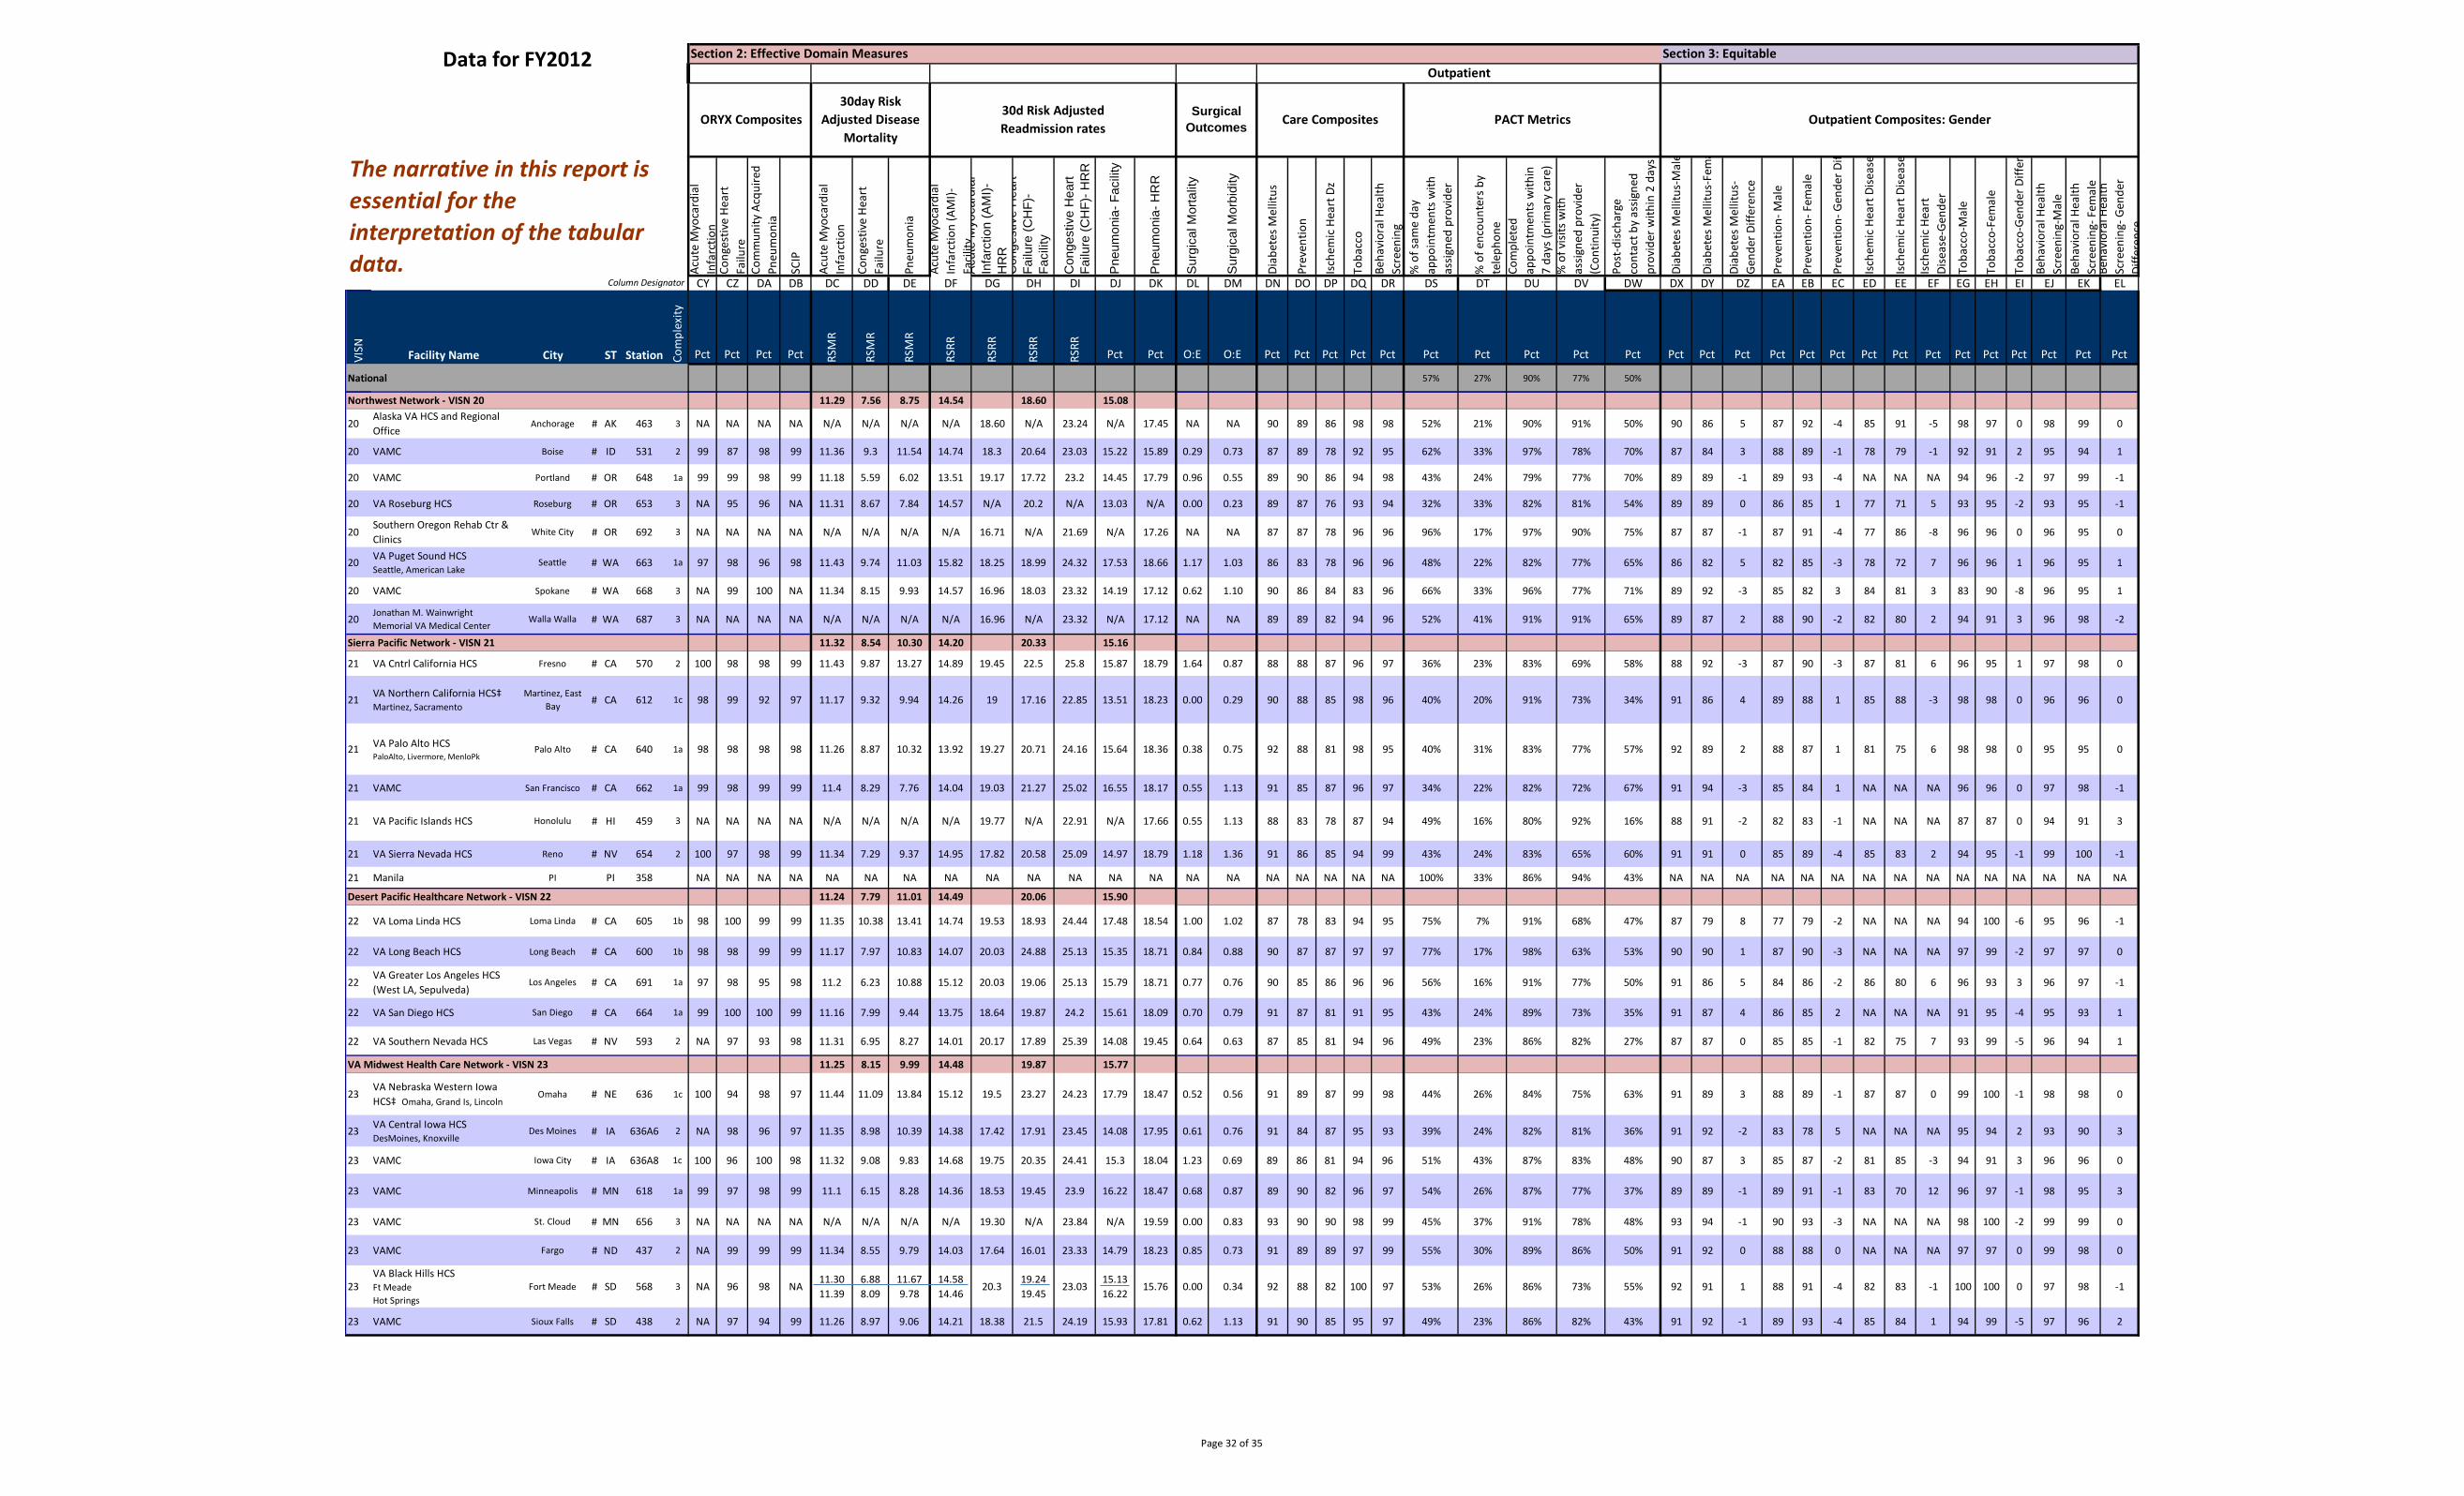
Data for FY2012
Column Designator
The narrative in this report is essential for the interpretation of the tabular data.
Section 2: Effective Domain Measures Section 3: Equitable Outpatient
ORYX Composites 30day Risk
Adjusted Disease Mortality
30d Risk Adjusted Readmission rates
Surgical Outcomes Care Composites PACT Metrics Outpatient Composites: Gender
Acut
e M
yoca
rdia
l In
farc
tion
Cong
estiv
e He
art
Failu
reCo
mm
unity
Acq
uire
d Pn
eum
onia
SCIP
Acut
e M
yoca
rdia
l In
farc
tion
Cong
estiv
e He
art
Failu
re
Pneu
mon
ia
Acut
e M
yoca
rdia
l In
farc
tion
(AM
I)-
Faci
lity
DF
Acu
te M
yoca
rdia
lIn
farc
tion
(AM
I)-
HR
RC
onge
stiv
e H
eart
Failu
re (C
HF)
- Fa
cilit
y
Con
gest
ive
Hea
rtFa
ilure
(CH
F)- H
RR
Pne
umon
ia- F
acili
ty
Pne
umon
ia- H
RR
Sur
gica
l Mor
talit
y
Sur
gica
l Mor
bidi
ty
Diab
etes
Mel
litus
Prev
entio
n
Isch
emic
Hea
rt D
z
Toba
cco
Beha
vior
al H
ealth
Scre
enin
g%
of s
ame
day
appo
intm
ents
with
as
signe
d pr
ovid
er
% o
f enc
ount
ers b
yte
leph
one
Com
plet
edap
poin
tmen
ts w
ithin
7
days
(prim
ary
care
)%
of v
isits
with
assig
ned
prov
ider
(Con
tinui
ty)
Post
-disc
harg
eco
ntac
t by
assig
ned
prov
ider
with
in 2
day
s
Diab
etes
Mel
litus
-Mal
e
Diab
etes
Mel
litus
-Fem
a
Diab
etes
Mel
litus
-Ge
nder
Diff
eren
ce
Prev
entio
n- M
ale
Prev
entio
n- F
emal
e
Prev
entio
n- G
ende
r Dif
Isch
emic
Hea
rt D
iseas
e
Isch
emic
Hea
rt D
iseas
e
Isch
emic
Hea
rt
Dise
ase-
Gend
er
Toba
cco-
Mal
e
Toba
cco-
Fem
ale
Toba
cco-
Gend
er D
iffer
e
Beha
vior
al H
ealth
Scre
enin
g-M
ale
Beha
vior
al H
ealth
Scre
enin
g- F
emal
eBe
havi
oral
Hea
lthSc
reen
ing-
Gen
der
Diffe
renc
e
CY CZ DA DB DC DD DE DG DH DI DJ DK DL DM DN DO DP DQ DR DS DT DU DV DW DX DY DZ EA EB EC ED EE EF EG EH EI EJ EK EL
VISN Facility Name City ST Station Com
plex
ity
Pct Pct Pct Pct RSM
R
RSM
R
RSM
R
RSRR
RSRR
RSRR
RSRR
Pct Pct O:E O:E Pct Pct Pct Pct Pct Pct Pct Pct Pct Pct Pct Pct Pct Pct Pct Pct Pct Pct Pct Pct Pct Pct Pct Pct Pct
National 57% 27% 90% 77% 50%
Northwest Network - VISN 20 11.29 7.56 8.75 14.54 18.60 15.08
20 Alaska VA HCS and Regional Office
Anchorage # AK 463 3 NA NA NA NA N/A N/A N/A N/A 18.60 N/A 23.24 N/A 17.45 NA NA 90 89 86 98 98 52% 21% 90% 91% 50% 90 86 5 87 92 -4 85 91 -5 98 97 0 98 99 0
20 VAMC Boise # ID 531 2 99 87 98 99 11.36 9.3 11.54 14.74 18.3 20.64 23.03 15.22 15.89 0.29 0.73 87 89 78 92 95 62% 33% 97% 78% 70% 87 84 3 88 89 -1 78 79 -1 92 91 2 95 94 1
20 VAMC Portland # OR 648 1a 99 99 98 99 11.18 5.59 6.02 13.51 19.17 17.72 23.2 14.45 17.79 0.96 0.55 89 90 86 94 98 43% 24% 79% 77% 70% 89 89 -1 89 93 -4 NA NA NA 94 96 -2 97 99 -1
20 VA Roseburg HCS Roseburg # OR 653 3 NA 95 96 NA 11.31 8.67 7.84 14.57 N/A 20.2 N/A 13.03 N/A 0.00 0.23 89 87 76 93 94 32% 33% 82% 81% 54% 89 89 0 86 85 1 77 71 5 93 95 -2 93 95 -1
20 Southern Oregon Rehab Ctr & Clinics
White City # OR 692 3 NA NA NA NA N/A N/A N/A N/A 16.71 N/A 21.69 N/A 17.26 NA NA 87 87 78 96 96 96% 17% 97% 90% 75% 87 87 -1 87 91 -4 77 86 -8 96 96 0 96 95 0
20 VA Puget Sound HCS Seattle, American Lake
Seattle # WA 663 1a 97 98 96 98 11.43 9.74 11.03 15.82 18.25 18.99 24.32 17.53 18.66 1.17 1.03 86 83 78 96 96 48% 22% 82% 77% 65% 86 82 5 82 85 -3 78 72 7 96 96 1 96 95 1
20 VAMC Spokane # WA 668 3 NA 99 100 NA 11.34 8.15 9.93 14.57 16.96 18.03 23.32 14.19 17.12 0.62 1.10 90 86 84 83 96 66% 33% 96% 77% 71% 89 92 -3 85 82 3 84 81 3 83 90 -8 96 95 1
20 Jonathan M. Wainwright Memorial VA Medical Center
Walla Walla # WA 687 3 NA NA NA NA N/A N/A N/A N/A 16.96 N/A 23.32 N/A 17.12 NA NA 89 89 82 94 96 52% 41% 91% 91% 65% 89 87 2 88 90 -2 82 80 2 94 91 3 96 98 -2
Sierra Pacific Network - VISN 21 11.32 8.54 10.30 14.20 20.33 15.16
21 VA Cntrl California HCS Fresno # CA 570 2 100 98 98 99 11.43 9.87 13.27 14.89 19.45 22.5 25.8 15.87 18.79 1.64 0.87 88 88 87 96 97 36% 23% 83% 69% 58% 88 92 -3 87 90 -3 87 81 6 96 95 1 97 98 0
21 VA Northern California HCS‡ Martinez, Sacramento
Martinez, East Bay # CA 612 1c 98 99 92 97 11.17 9.32 9.94 14.26 19 17.16 22.85 13.51 18.23 0.00 0.29 90 88 85 98 96 40% 20% 91% 73% 34% 91 86 4 89 88 1 85 88 -3 98 98 0 96 96 0
21 VA Palo Alto HCS PaloAlto, Livermore, MenloPk
Palo Alto # CA 640 1a 98 98 98 98 11.26 8.87 10.32 13.92 19.27 20.71 24.16 15.64 18.36 0.38 0.75 92 88 81 98 95 40% 31% 83% 77% 57% 92 89 2 88 87 1 81 75 6 98 98 0 95 95 0
21 VAMC San Francisco # CA 662 1a 99 98 99 99 11.4 8.29 7.76 14.04 19.03 21.27 25.02 16.55 18.17 0.55 1.13 91 85 87 96 97 34% 22% 82% 72% 67% 91 94 -3 85 84 1 NA NA NA 96 96 0 97 98 -1
21 VA Pacific Islands HCS Honolulu # HI 459 3 NA NA NA NA N/A N/A N/A N/A 19.77 N/A 22.91 N/A 17.66 0.55 1.13 88 83 78 87 94 49% 16% 80% 92% 16% 88 91 -2 82 83 -1 NA NA NA 87 87 0 94 91 3
21 VA Sierra Nevada HCS Reno # NV 654 2 100 97 98 99 11.34 7.29 9.37 14.95 17.82 20.58 25.09 14.97 18.79 1.18 1.36 91 86 85 94 99 43% 24% 83% 65% 60% 91 91 0 85 89 -4 85 83 2 94 95 -1 99 100 -1
21 Manila PI PI 358 NA NA NA NA NA NA NA NA NA NA NA NA NA NA NA NA NA NA NA NA 100% 33% 86% 94% 43% NA NA NA NA NA NA NA NA NA NA NA NA NA NA NA
Desert Pacific Healthcare Network - VISN 22 11.24 7.79 11.01 14.49 20.06 15.90
22 VA Loma Linda HCS Loma Linda # CA 605 1b 98 100 99 99 11.35 10.38 13.41 14.74 19.53 18.93 24.44 17.48 18.54 1.00 1.02 87 78 83 94 95 75% 7% 91% 68% 47% 87 79 8 77 79 -2 NA NA NA 94 100 -6 95 96 -1
22 VA Long Beach HCS Long Beach # CA 600 1b 98 98 99 99 11.17 7.97 10.83 14.07 20.03 24.88 25.13 15.35 18.71 0.84 0.88 90 87 87 97 97 77% 17% 98% 63% 53% 90 90 1 87 90 -3 NA NA NA 97 99 -2 97 97 0
22 VA Greater Los Angeles HCS (West LA, Sepulveda)
Los Angeles # CA 691 1a 97 98 95 98 11.2 6.23 10.88 15.12 20.03 19.06 25.13 15.79 18.71 0.77 0.76 90 85 86 96 96 56% 16% 91% 77% 50% 91 86 5 84 86 -2 86 80 6 96 93 3 96 97 -1
22 VA San Diego HCS San Diego # CA 664 1a 99 100 100 99 11.16 7.99 9.44 13.75 18.64 19.87 24.2 15.61 18.09 0.70 0.79 91 87 81 91 95 43% 24% 89% 73% 35% 91 87 4 86 85 2 NA NA NA 91 95 -4 95 93 1
22 VA Southern Nevada HCS Las Vegas # NV 593 2 NA 97 93 98 11.31 6.95 8.27 14.01 20.17 17.89 25.39 14.08 19.45 0.64 0.63 87 85 81 94 96 49% 23% 86% 82% 27% 87 87 0 85 85 -1 82 75 7 93 99 -5 96 94 1
VA Midwest Health Care Network - VISN 23 11.25 8.15 9.99 14.48 19.87 15.77
23 VA Nebraska Western Iowa HCS‡ Omaha, Grand Is, Lincoln
Omaha # NE 636 1c 100 94 98 97 11.44 11.09 13.84 15.12 19.5 23.27 24.23 17.79 18.47 0.52 0.56 91 89 87 99 98 44% 26% 84% 75% 63% 91 89 3 88 89 -1 87 87 0 99 100 -1 98 98 0
23 VA Central Iowa HCS DesMoines, Knoxville
Des Moines # IA 636A6 2 NA 98 96 97 11.35 8.98 10.39 14.38 17.42 17.91 23.45 14.08 17.95 0.61 0.76 91 84 87 95 93 39% 24% 82% 81% 36% 91 92 -2 83 78 5 NA NA NA 95 94 2 93 90 3
23 VAMC Iowa City # IA 636A8 1c 100 96 100 98 11.32 9.08 9.83 14.68 19.75 20.35 24.41 15.3 18.04 1.23 0.69 89 86 81 94 96 51% 43% 87% 83% 48% 90 87 3 85 87 -2 81 85 -3 94 91 3 96 96 0
23 VAMC Minneapolis # MN 618 1a 99 97 98 99 11.1 6.15 8.28 14.36 18.53 19.45 23.9 16.22 18.47 0.68 0.87 89 90 82 96 97 54% 26% 87% 77% 37% 89 89 -1 89 91 -1 83 70 12 96 97 -1 98 95 3
23 VAMC St. Cloud # MN 656 3 NA NA NA NA N/A N/A N/A N/A 19.30 N/A 23.84 N/A 19.59 0.00 0.83 93 90 90 98 99 45% 37% 91% 78% 48% 93 94 -1 90 93 -3 NA NA NA 98 100 -2 99 99 0
23 VAMC Fargo # ND 437 2 NA 99 99 99 11.34 8.55 9.79 14.03 17.64 16.01 23.33 14.79 18.23 0.85 0.73 91 89 89 97 99 55% 30% 89% 86% 50% 91 92 0 88 88 0 NA NA NA 97 97 0 99 98 0
23 VA Black Hills HCS Ft Meade Hot Springs
Fort Meade # SD 568 3 NA 96 98 NA 11.30 6.88 11.67 14.58
20.3 19.24 19.45
23.03 15.13 16.22
15.76 0.00 0.34 92 88 82 100 97 53% 26% 86% 73% 55% 92 91 1 88 91 -4 82 83 -1 100 100 0 97 98 -111.39 8.09 9.78 14.46
23 VAMC Sioux Falls # SD 438 2 NA 97 94 99 11.26 8.97 9.06 14.21 18.38 21.5 24.19 15.93 17.81 0.62 1.13 91 90 85 95 97 49% 23% 86% 82% 43% 91 92 -1 89 93 -4 85 84 1 94 99 -5 97 96 2
Page 32 of 35
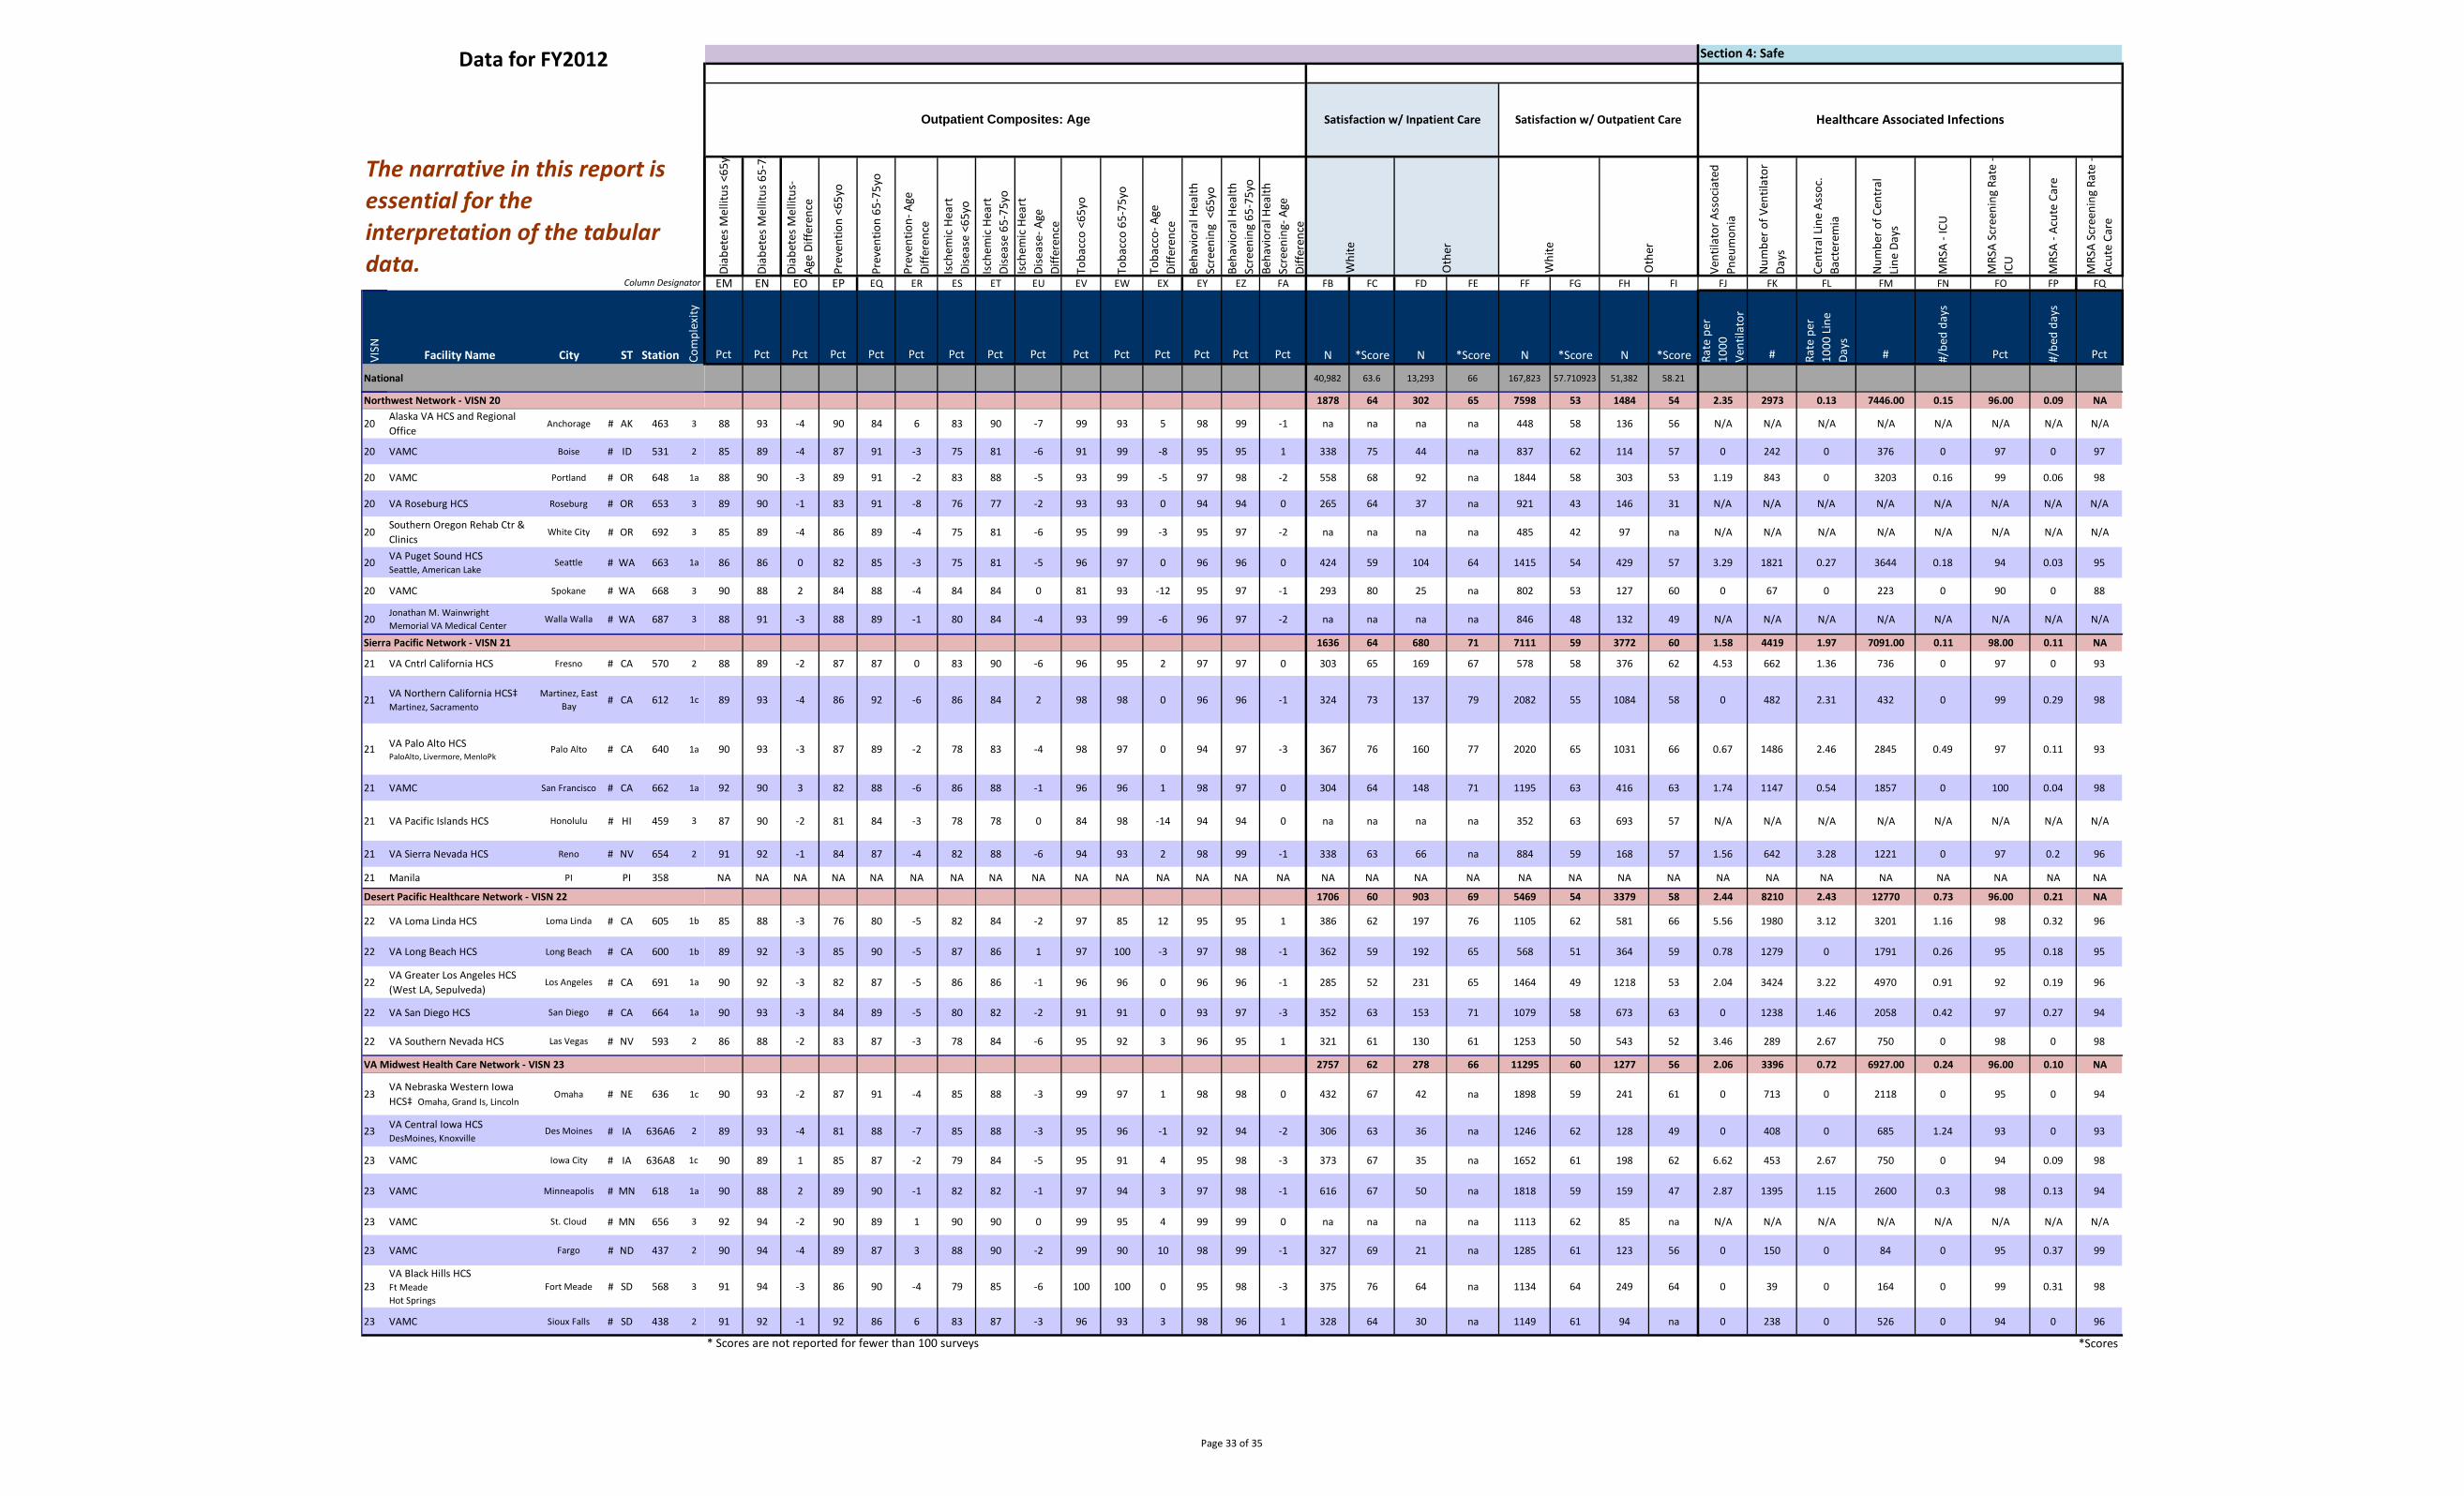
Data for FY2012
Column Designator
The narrative in this report is essential for the interpretation of the tabular data.
Section 4: Safe
Outpatient Composites: Age Satisfaction w/ Inpatient Care Satisfaction w/ Outpatient Care Healthcare Associated Infections
Diab
etes
Mel
litus
<65
y
Diab
etes
Mel
litus
65-
75
Diab
etes
Mel
litus
-Ag
e Di
ffere
nce
Prev
entio
n <6
5yo
Prev
entio
n 65
-75y
o
Prev
entio
n- A
geDi
ffere
nce
Isch
emic
Hea
rt
Dise
ase
<65y
o
Isch
emic
Hea
rt
Dise
ase
65-7
5yo
Isch
emic
Hea
rt
Dise
ase-
Age
Diffe
renc
e
Toba
cco
<65y
o
Toba
cco
65-7
5yo
Toba
cco-
Age
Diffe
renc
e
Beha
vior
al H
ealth
Scre
enin
g <
65yo
Beha
vior
al H
ealth
Scre
enin
g 65
-75y
oBe
havi
oral
Hea
lthSc
reen
ing-
Age
Diffe
renc
e
Whi
te
Oth
er
Whi
te
Oth
er
Vent
ilato
r Ass
ocia
ted
Pneu
mon
ia
Num
ber o
f Ven
tilat
orDa
ys
Cent
ral L
ine
Asso
c.Ba
cter
emia
Num
ber o
f Cen
tral
Line
Day
s
MRS
A -I
CU
MRS
A Sc
reen
ing
Rate
-IC
U
MRS
A -A
cute
Car
e
MRS
A Sc
reen
ing
Rate
-Ac
ute
Care
EM EN EO EP EQ ER ES ET EU EV EW EX EY EZ FA FB FC FD FE FF FG FH FI FJ FK FL FM FN FO FP FQ
VISN Facility Name City ST Station Com
plex
ity
Pct Pct Pct Pct Pct Pct Pct Pct Pct Pct Pct Pct Pct Pct Pct N *Score N *Score N *Score N *Score Rate
per
1000
Vent
ilato
r
# Rate
per
1000
Lin
eDa
ys
# #/be
d da
ys
Pct #/be
d da
ys
Pct
National 40,982 63.6 13,293 66 167,823 57.710923 51,382 58.21
Northwest Network - VISN 20 1878 64 302 65 7598 53 1484 54 2.35 2973 0.13 7446.00 0.15 96.00 0.09 NA
20 Alaska VA HCS and Regional Office
Anchorage # AK 463 3 88 93 -4 90 84 6 83 90 -7 99 93 5 98 99 -1 na na na na 448 58 136 56 N/A N/A N/A N/A N/A N/A N/A N/A
20 VAMC Boise # ID 531 2 85 89 -4 87 91 -3 75 81 -6 91 99 -8 95 95 1 338 75 44 na 837 62 114 57 0 242 0 376 0 97 0 97
20 VAMC Portland # OR 648 1a 88 90 -3 89 91 -2 83 88 -5 93 99 -5 97 98 -2 558 68 92 na 1844 58 303 53 1.19 843 0 3203 0.16 99 0.06 98
20 VA Roseburg HCS Roseburg # OR 653 3 89 90 -1 83 91 -8 76 77 -2 93 93 0 94 94 0 265 64 37 na 921 43 146 31 N/A N/A N/A N/A N/A N/A N/A N/A
20 Southern Oregon Rehab Ctr & Clinics
White City # OR 692 3 85 89 -4 86 89 -4 75 81 -6 95 99 -3 95 97 -2 na na na na 485 42 97 na N/A N/A N/A N/A N/A N/A N/A N/A
20 VA Puget Sound HCS Seattle, American Lake
Seattle # WA 663 1a 86 86 0 82 85 -3 75 81 -5 96 97 0 96 96 0 424 59 104 64 1415 54 429 57 3.29 1821 0.27 3644 0.18 94 0.03 95
20 VAMC Spokane # WA 668 3 90 88 2 84 88 -4 84 84 0 81 93 -12 95 97 -1 293 80 25 na 802 53 127 60 0 67 0 223 0 90 0 88
20 Jonathan M. Wainwright Memorial VA Medical Center
Walla Walla # WA 687 3 88 91 -3 88 89 -1 80 84 -4 93 99 -6 96 97 -2 na na na na 846 48 132 49 N/A N/A N/A N/A N/A N/A N/A N/A
Sierra Pacific Network - VISN 21 1636 64 680 71 7111 59 3772 60 1.58 4419 1.97 7091.00 0.11 98.00 0.11 NA
21 VA Cntrl California HCS Fresno # CA 570 2 88 89 -2 87 87 0 83 90 -6 96 95 2 97 97 0 303 65 169 67 578 58 376 62 4.53 662 1.36 736 0 97 0 93
21 VA Northern California HCS‡ Martinez, Sacramento
Martinez, East Bay # CA 612 1c 89 93 -4 86 92 -6 86 84 2 98 98 0 96 96 -1 324 73 137 79 2082 55 1084 58 0 482 2.31 432 0 99 0.29 98
21 VA Palo Alto HCS PaloAlto, Livermore, MenloPk
Palo Alto # CA 640 1a 90 93 -3 87 89 -2 78 83 -4 98 97 0 94 97 -3 367 76 160 77 2020 65 1031 66 0.67 1486 2.46 2845 0.49 97 0.11 93
21 VAMC San Francisco # CA 662 1a 92 90 3 82 88 -6 86 88 -1 96 96 1 98 97 0 304 64 148 71 1195 63 416 63 1.74 1147 0.54 1857 0 100 0.04 98
21 VA Pacific Islands HCS Honolulu # HI 459 3 87 90 -2 81 84 -3 78 78 0 84 98 -14 94 94 0 na na na na 352 63 693 57 N/A N/A N/A N/A N/A N/A N/A N/A
21 VA Sierra Nevada HCS Reno # NV 654 2 91 92 -1 84 87 -4 82 88 -6 94 93 2 98 99 -1 338 63 66 na 884 59 168 57 1.56 642 3.28 1221 0 97 0.2 96
21 Manila PI PI 358 NA NA NA NA NA NA NA NA NA NA NA NA NA NA NA NA NA NA NA NA NA NA NA NA NA NA NA NA NA NA NA
Desert Pacific Healthcare Network - VISN 22 1706 60 903 69 5469 54 3379 58 2.44 8210 2.43 12770 0.73 96.00 0.21 NA
22 VA Loma Linda HCS Loma Linda # CA 605 1b 85 88 -3 76 80 -5 82 84 -2 97 85 12 95 95 1 386 62 197 76 1105 62 581 66 5.56 1980 3.12 3201 1.16 98 0.32 96
22 VA Long Beach HCS Long Beach # CA 600 1b 89 92 -3 85 90 -5 87 86 1 97 100 -3 97 98 -1 362 59 192 65 568 51 364 59 0.78 1279 0 1791 0.26 95 0.18 95
22 VA Greater Los Angeles HCS (West LA, Sepulveda)
Los Angeles # CA 691 1a 90 92 -3 82 87 -5 86 86 -1 96 96 0 96 96 -1 285 52 231 65 1464 49 1218 53 2.04 3424 3.22 4970 0.91 92 0.19 96
22 VA San Diego HCS San Diego # CA 664 1a 90 93 -3 84 89 -5 80 82 -2 91 91 0 93 97 -3 352 63 153 71 1079 58 673 63 0 1238 1.46 2058 0.42 97 0.27 94
22 VA Southern Nevada HCS Las Vegas # NV 593 2 86 88 -2 83 87 -3 78 84 -6 95 92 3 96 95 1 321 61 130 61 1253 50 543 52 3.46 289 2.67 750 0 98 0 98
VA Midwest Health Care Network - VISN 23 2757 62 278 66 11295 60 1277 56 2.06 3396 0.72 6927.00 0.24 96.00 0.10 NA
23 VA Nebraska Western Iowa HCS‡ Omaha, Grand Is, Lincoln
Omaha # NE 636 1c 90 93 -2 87 91 -4 85 88 -3 99 97 1 98 98 0 432 67 42 na 1898 59 241 61 0 713 0 2118 0 95 0 94
23 VA Central Iowa HCS DesMoines, Knoxville
Des Moines # IA 636A6 2 89 93 -4 81 88 -7 85 88 -3 95 96 -1 92 94 -2 306 63 36 na 1246 62 128 49 0 408 0 685 1.24 93 0 93
23 VAMC Iowa City # IA 636A8 1c 90 89 1 85 87 -2 79 84 -5 95 91 4 95 98 -3 373 67 35 na 1652 61 198 62 6.62 453 2.67 750 0 94 0.09 98
23 VAMC Minneapolis # MN 618 1a 90 88 2 89 90 -1 82 82 -1 97 94 3 97 98 -1 616 67 50 na 1818 59 159 47 2.87 1395 1.15 2600 0.3 98 0.13 94
23 VAMC St. Cloud # MN 656 3 92 94 -2 90 89 1 90 90 0 99 95 4 99 99 0 na na na na 1113 62 85 na N/A N/A N/A N/A N/A N/A N/A N/A
23 VAMC Fargo # ND 437 2 90 94 -4 89 87 3 88 90 -2 99 90 10 98 99 -1 327 69 21 na 1285 61 123 56 0 150 0 84 0 95 0.37 99
23 VA Black Hills HCS Ft Meade Hot Springs
Fort Meade # SD 568 3 91 94 -3 86 90 -4 79 85 -6 100 100 0 95 98 -3 375 76 64 na 1134 64 249 64 0 39 0 164 0 99 0.31 98
23 VAMC Sioux Falls # SD 438 2 91 92 -1 92 86 6 83 87 -3 96 93 3 98 96 1 328 64 30 na 1149 61 94 na 0 238 0 526 0 94 0 96
* Scores are not reported for fewer than 100 surveys *Scores a
Page 33 of 35
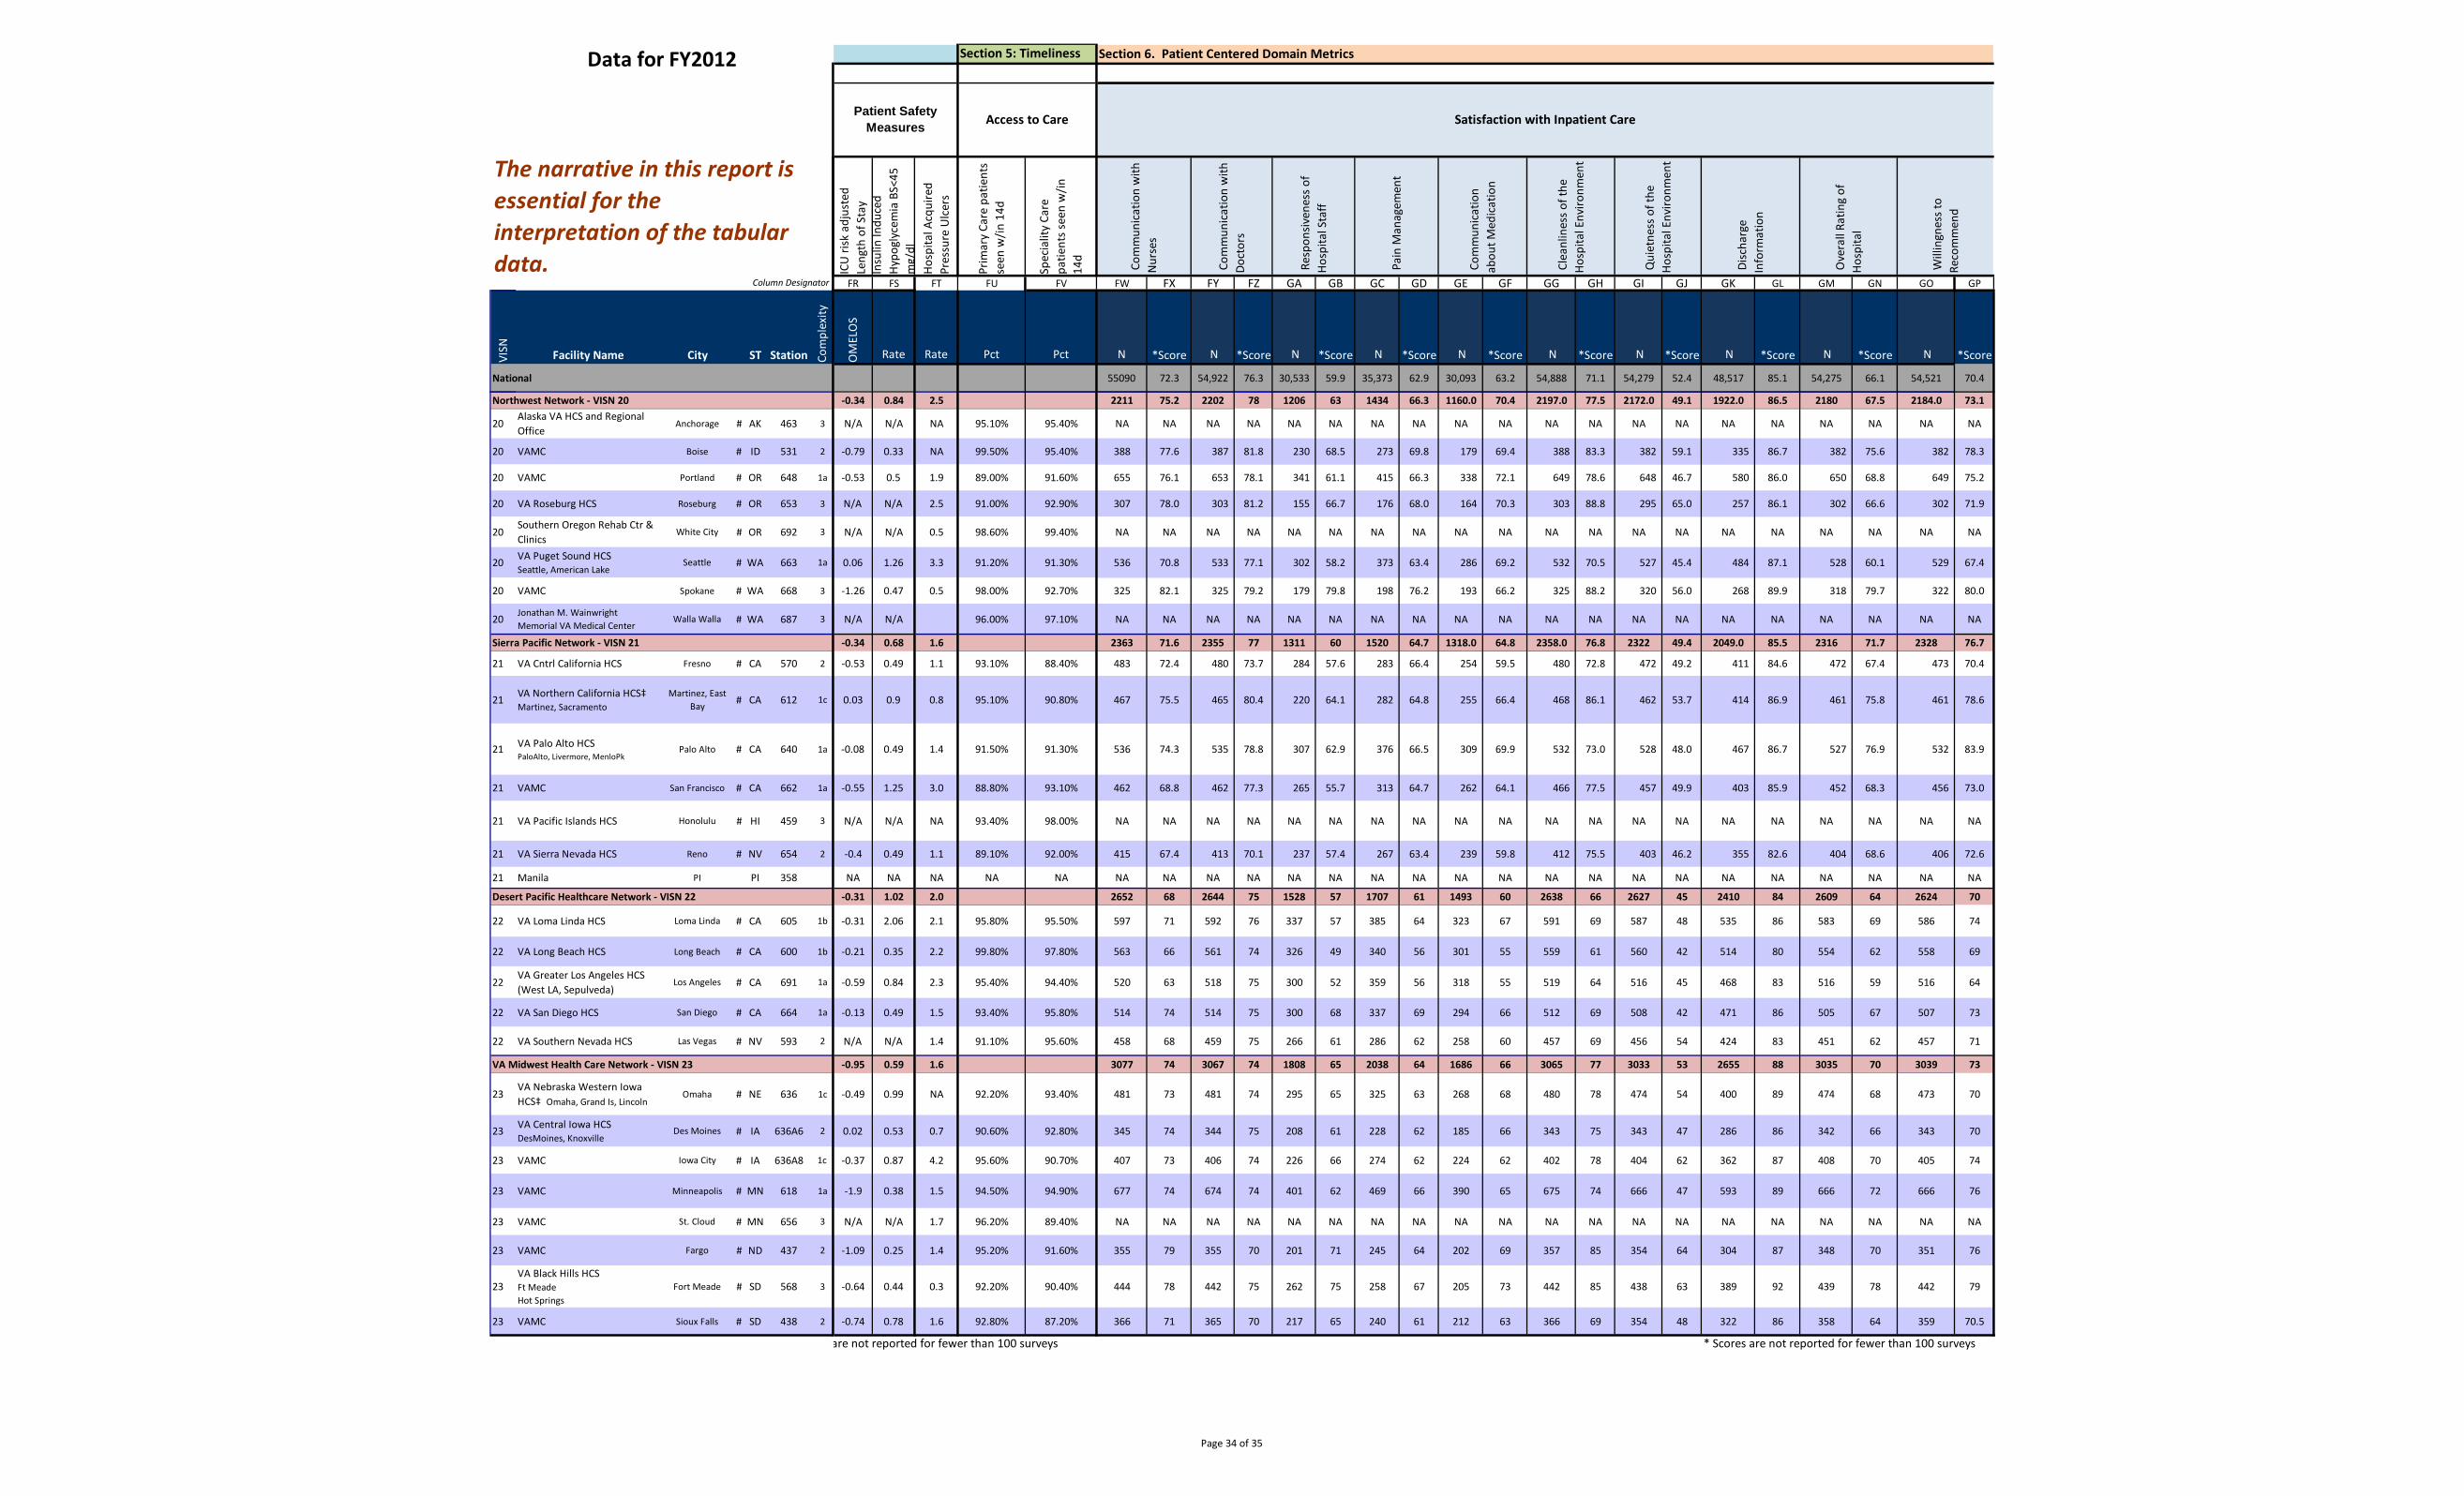
Data for FY2012
Column Designator
The narrative in this report is essential for the interpretation of the tabular data.
Section 5: Timeliness Section 6. Patient Centered Domain Metrics
Patient Safety Measures Access to Care Satisfaction with Inpatient Care
ICU
risk
adj
uste
d Le
ngth
of S
tay
Insu
lin In
duce
d Hy
pogl
ycem
ia B
S<45
m
g/dl
Hosp
ital A
cqui
red
Pres
sure
Ulc
ers
Prim
ary
Care
pat
ient
sse
en w
/in 1
4d
Spec
ialit
y Ca
repa
tient
s see
n w
/in14
d
Com
mun
icat
ion
with
N
urse
s
Com
mun
icat
ion
with
Do
ctor
s
Res
pons
iven
ess o
fHo
spita
l Sta
ff
Pai
n M
anag
emen
t
Com
mun
icat
ion
abou
t Med
icat
ion
Cle
anlin
ess o
f the
Hosp
ital E
nviro
nmen
t
Qui
etne
ss o
f the
Hosp
ital E
nviro
nmen
t
Disc
harg
eIn
form
atio
n
Ove
rall
Ratin
g of
Hosp
ital
Will
ingn
ess t
oRe
com
men
d
FR FS FT FU FV FW FX FY FZ GA GB GC GD GE GF GG GH GI GJ GK GL GM GN GO GP
VISN Facility Name City ST Station Com
plex
ity
OM
ELO
S
Rate Rate Pct Pct N *Score N *Score N *Score N *Score N *Score N *Score N *Score N *Score N *Score N *Score
National 55090 72.3 54,922 76.3 30,533 59.9 35,373 62.9 30,093 63.2 54,888 71.1 54,279 52.4 48,517 85.1 54,275 66.1 54,521 70.4
Northwest Network - VISN 20 -0.34 0.84 2.5 2211 75.2 2202 78 1206 63 1434 66.3 1160.0 70.4 2197.0 77.5 2172.0 49.1 1922.0 86.5 2180 67.5 2184.0 73.1
20 Alaska VA HCS and Regional Office
Anchorage # AK 463 3 N/A N/A NA 95.10% 95.40% NA NA NA NA NA NA NA NA NA NA NA NA NA NA NA NA NA NA NA NA
20 VAMC Boise # ID 531 2 -0.79 0.33 NA 99.50% 95.40% 388 77.6 387 81.8 230 68.5 273 69.8 179 69.4 388 83.3 382 59.1 335 86.7 382 75.6 382 78.3
20 VAMC Portland # OR 648 1a -0.53 0.5 1.9 89.00% 91.60% 655 76.1 653 78.1 341 61.1 415 66.3 338 72.1 649 78.6 648 46.7 580 86.0 650 68.8 649 75.2
20 VA Roseburg HCS Roseburg # OR 653 3 N/A N/A 2.5 91.00% 92.90% 307 78.0 303 81.2 155 66.7 176 68.0 164 70.3 303 88.8 295 65.0 257 86.1 302 66.6 302 71.9
20 Southern Oregon Rehab Ctr & Clinics
White City # OR 692 3 N/A N/A 0.5 98.60% 99.40% NA NA NA NA NA NA NA NA NA NA NA NA NA NA NA NA NA NA NA NA
20 VA Puget Sound HCS Seattle, American Lake
Seattle # WA 663 1a 0.06 1.26 3.3 91.20% 91.30% 536 70.8 533 77.1 302 58.2 373 63.4 286 69.2 532 70.5 527 45.4 484 87.1 528 60.1 529 67.4
20 VAMC Spokane # WA 668 3 -1.26 0.47 0.5 98.00% 92.70% 325 82.1 325 79.2 179 79.8 198 76.2 193 66.2 325 88.2 320 56.0 268 89.9 318 79.7 322 80.0
20 Jonathan M. Wainwright Memorial VA Medical Center
Walla Walla # WA 687 3 N/A N/A 96.00% 97.10% NA NA NA NA NA NA NA NA NA NA NA NA NA NA NA NA NA NA NA NA
Sierra Pacific Network - VISN 21 -0.34 0.68 1.6 2363 71.6 2355 77 1311 60 1520 64.7 1318.0 64.8 2358.0 76.8 2322 49.4 2049.0 85.5 2316 71.7 2328 76.7
21 VA Cntrl California HCS Fresno # CA 570 2 -0.53 0.49 1.1 93.10% 88.40% 483 72.4 480 73.7 284 57.6 283 66.4 254 59.5 480 72.8 472 49.2 411 84.6 472 67.4 473 70.4
21 VA Northern California HCS‡ Martinez, Sacramento
Martinez, East Bay # CA 612 1c 0.03 0.9 0.8 95.10% 90.80% 467 75.5 465 80.4 220 64.1 282 64.8 255 66.4 468 86.1 462 53.7 414 86.9 461 75.8 461 78.6
21 VA Palo Alto HCS PaloAlto, Livermore, MenloPk
Palo Alto # CA 640 1a -0.08 0.49 1.4 91.50% 91.30% 536 74.3 535 78.8 307 62.9 376 66.5 309 69.9 532 73.0 528 48.0 467 86.7 527 76.9 532 83.9
21 VAMC San Francisco # CA 662 1a -0.55 1.25 3.0 88.80% 93.10% 462 68.8 462 77.3 265 55.7 313 64.7 262 64.1 466 77.5 457 49.9 403 85.9 452 68.3 456 73.0
21 VA Pacific Islands HCS Honolulu # HI 459 3 N/A N/A NA 93.40% 98.00% NA NA NA NA NA NA NA NA NA NA NA NA NA NA NA NA NA NA NA NA
21 VA Sierra Nevada HCS Reno # NV 654 2 -0.4 0.49 1.1 89.10% 92.00% 415 67.4 413 70.1 237 57.4 267 63.4 239 59.8 412 75.5 403 46.2 355 82.6 404 68.6 406 72.6
21 Manila PI PI 358 NA NA NA NA NA NA NA NA NA NA NA NA NA NA NA NA NA NA NA NA NA NA NA NA NA
Desert Pacific Healthcare Network - VISN 22 -0.31 1.02 2.0 2652 68 2644 75 1528 57 1707 61 1493 60 2638 66 2627 45 2410 84 2609 64 2624 70
22 VA Loma Linda HCS Loma Linda # CA 605 1b -0.31 2.06 2.1 95.80% 95.50% 597 71 592 76 337 57 385 64 323 67 591 69 587 48 535 86 583 69 586 74
22 VA Long Beach HCS Long Beach # CA 600 1b -0.21 0.35 2.2 99.80% 97.80% 563 66 561 74 326 49 340 56 301 55 559 61 560 42 514 80 554 62 558 69
22 VA Greater Los Angeles HCS (West LA, Sepulveda)
Los Angeles # CA 691 1a -0.59 0.84 2.3 95.40% 94.40% 520 63 518 75 300 52 359 56 318 55 519 64 516 45 468 83 516 59 516 64
22 VA San Diego HCS San Diego # CA 664 1a -0.13 0.49 1.5 93.40% 95.80% 514 74 514 75 300 68 337 69 294 66 512 69 508 42 471 86 505 67 507 73
22 VA Southern Nevada HCS Las Vegas # NV 593 2 N/A N/A 1.4 91.10% 95.60% 458 68 459 75 266 61 286 62 258 60 457 69 456 54 424 83 451 62 457 71
VA Midwest Health Care Network - VISN 23 -0.95 0.59 1.6 3077 74 3067 74 1808 65 2038 64 1686 66 3065 77 3033 53 2655 88 3035 70 3039 73
23 VA Nebraska Western Iowa HCS‡ Omaha, Grand Is, Lincoln
Omaha # NE 636 1c -0.49 0.99 NA 92.20% 93.40% 481 73 481 74 295 65 325 63 268 68 480 78 474 54 400 89 474 68 473 70
23 VA Central Iowa HCS DesMoines, Knoxville
Des Moines # IA 636A6 2 0.02 0.53 0.7 90.60% 92.80% 345 74 344 75 208 61 228 62 185 66 343 75 343 47 286 86 342 66 343 70
23 VAMC Iowa City # IA 636A8 1c -0.37 0.87 4.2 95.60% 90.70% 407 73 406 74 226 66 274 62 224 62 402 78 404 62 362 87 408 70 405 74
23 VAMC Minneapolis # MN 618 1a -1.9 0.38 1.5 94.50% 94.90% 677 74 674 74 401 62 469 66 390 65 675 74 666 47 593 89 666 72 666 76
23 VAMC St. Cloud # MN 656 3 N/A N/A 1.7 96.20% 89.40% NA NA NA NA NA NA NA NA NA NA NA NA NA NA NA NA NA NA NA NA
23 VAMC Fargo # ND 437 2 -1.09 0.25 1.4 95.20% 91.60% 355 79 355 70 201 71 245 64 202 69 357 85 354 64 304 87 348 70 351 76
23 VA Black Hills HCS Ft Meade Hot Springs
Fort Meade # SD 568 3 -0.64 0.44 0.3 92.20% 90.40% 444 78 442 75 262 75 258 67 205 73 442 85 438 63 389 92 439 78 442 79
23 VAMC Sioux Falls # SD 438 2 -0.74 0.78 1.6 92.80% 87.20% 366 71 365 70 217 65 240 61 212 63 366 69 354 48 322 86 358 64 359 70.5
are not reported for fewer than 100 surveys * Scores are not reported for fewer than 100 surveys
Page 34 of 35
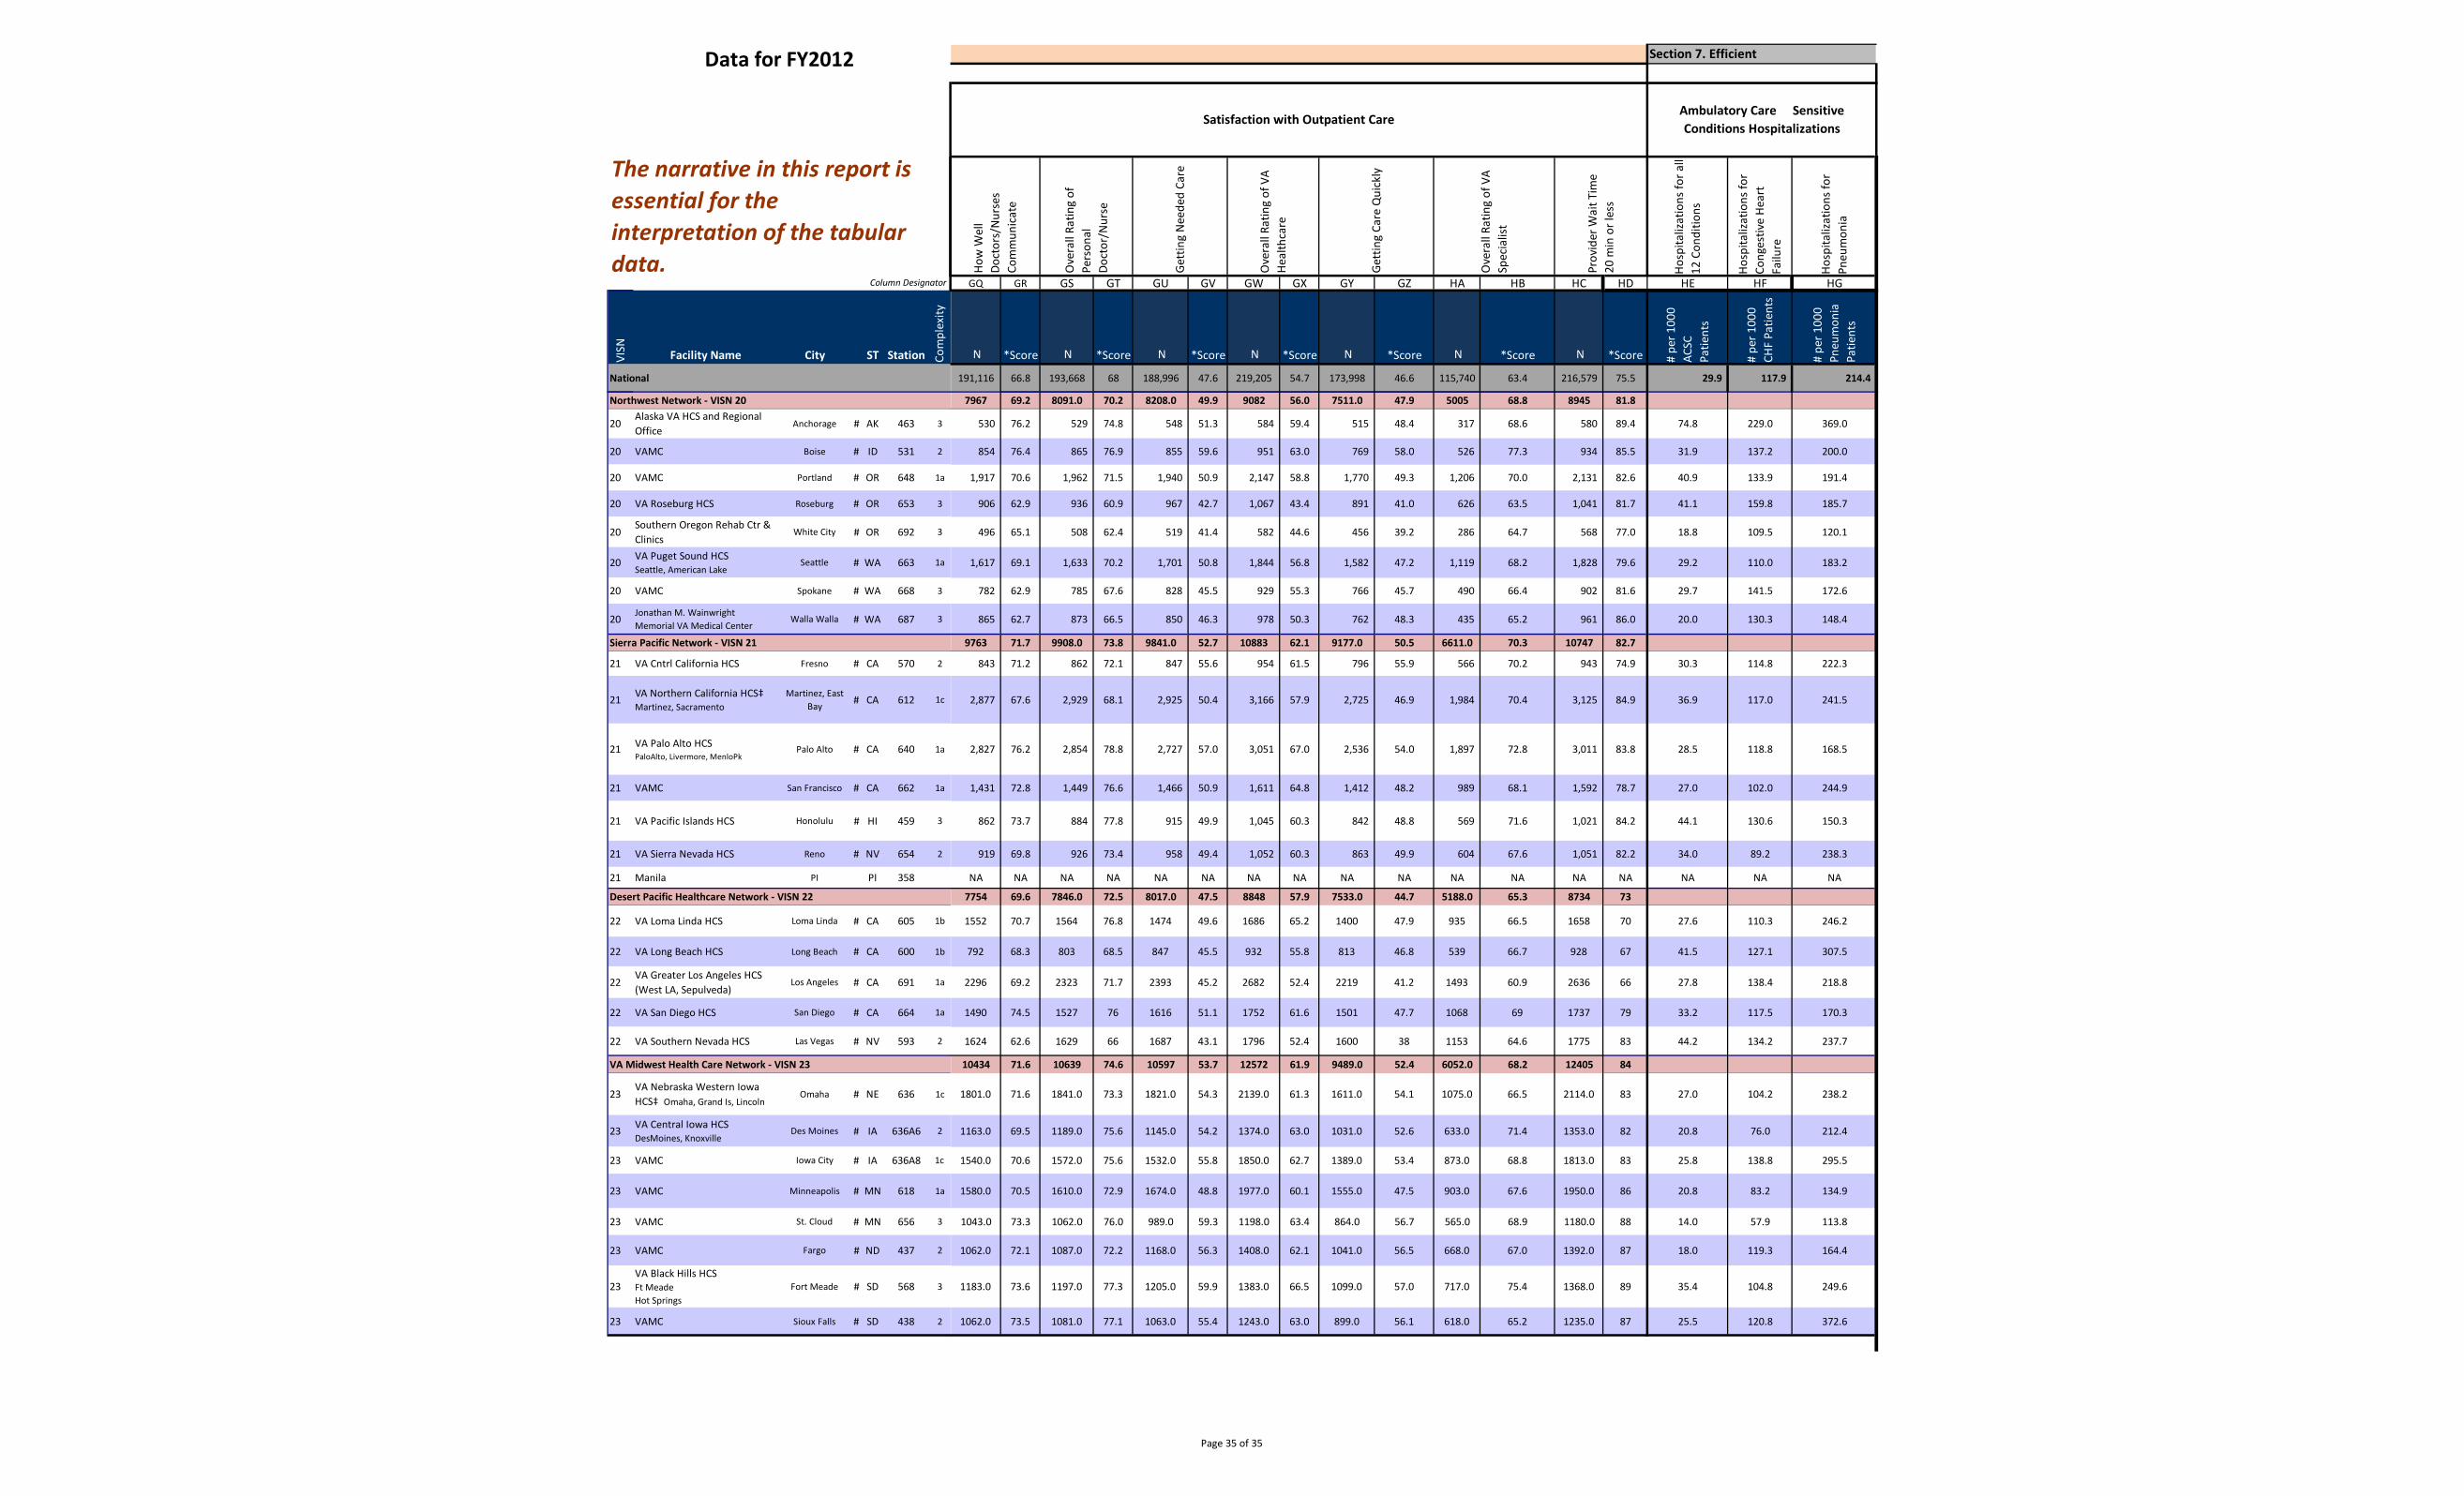
VISN Facility Name City ST Station Com
plex
ity
National
Data for FY2012
Column Designator
The narrative in this report is essential for the interpretation of the tabular data.
Northwest Network - VISN 20
20 Alaska VA HCS and Regional Office
Anchorage # AK 463 3
20 VAMC Boise # ID 531 2
20 VAMC Portland # OR 648 1a
20 VA Roseburg HCS Roseburg # OR 653 3
20 Southern Oregon Rehab Ctr & Clinics
White City # OR 692 3
20 VA Puget Sound HCS Seattle, American Lake
Seattle # WA 663 1a
20 VAMC Spokane # WA 668 3
20 Jonathan M. Wainwright Memorial VA Medical Center
Walla Walla # WA 687 3
Sierra Pacific Network - VISN 21
21 VA Cntrl California HCS Fresno # CA 570 2
21 VA Northern California HCS‡ Martinez, Sacramento
Martinez, East Bay # CA 612 1c
21 VA Palo Alto HCS PaloAlto, Livermore, MenloPk
Palo Alto # CA 640 1a
21 VAMC San Francisco # CA 662 1a
21 VA Pacific Islands HCS Honolulu # HI 459 3
21 VA Sierra Nevada HCS Reno # NV 654 2
21 Manila PI PI 358
Desert Pacific Healthcare Network - VISN 22
22 VA Loma Linda HCS Loma Linda # CA 605 1b
22 VA Long Beach HCS Long Beach # CA 600 1b
22 VA Greater Los Angeles HCS (West LA, Sepulveda)
Los Angeles # CA 691 1a
22 VA San Diego HCS San Diego # CA 664 1a
22 VA Southern Nevada HCS Las Vegas # NV 593 2
VA Midwest Health Care Network - VISN 23
23 VA Nebraska Western Iowa HCS‡ Omaha, Grand Is, Lincoln
Omaha # NE 636 1c
23 VA Central Iowa HCS DesMoines, Knoxville
Des Moines # IA 636A6 2
23 VAMC Iowa City # IA 636A8 1c
23 VAMC Minneapolis # MN 618 1a
23 VAMC St. Cloud # MN 656 3
23 VAMC Fargo # ND 437 2
23 VA Black Hills HCS Ft Meade Hot Springs
Fort Meade # SD 568 3
23 VAMC Sioux Falls # SD 438 2
Hosp
italiz
atio
ns fo
r all
12 C
ondi
tions
Hosp
italiz
atio
ns fo
rCo
nges
tive
Hear
t Fa
ilure
Hosp
italiz
atio
ns fo
rPn
eum
onia
GQ GR GS GT GU GV GW GX GY GZ HA HB HC HD HE HF HG
N *Score N *Score N *Score N *Score N *Score N *Score N *Score # pe
r 100
0 AC
SC
Patie
nts
# pe
r 100
0 CH
F Pa
tient
s
# pe
r 100
0 Pn
eum
onia
Patie
nts
191,116 66.8 193,668 68 188,996 47.6 219,205 54.7 173,998 46.6 115,740 63.4 216,579 75.5 29.9 117.9 214.4
Ambulatory Care Sensitive Conditions Hospitalizations
Prov
ider
Wai
t Tim
e20
min
or l
ess
How
Wel
l Do
ctor
s/N
urse
s Co
mm
unic
ate
Ove
rall
Ratin
g of
Pers
onal
Doct
or/N
urse
Gett
ing
Nee
ded
Care
Ove
rall
Ratin
g of
VA
Heal
thca
re
Gett
ing
Care
Qui
ckly
Satisfaction with Outpatient Care
Section 7. Efficient
Ove
rall
Ratin
g of
VA
Spec
ialis
t
7967 69.2 8091.0 70.2 8208.0 49.9 9082 56.0 7511.0 47.9 5005 68.8 8945 81.8
530 76.2 529 74.8 548 51.3 584 59.4 515 48.4 317 68.6 580 89.4 74.8 229.0 369.0
854 76.4 865 76.9 855 59.6 951 63.0 769 58.0 526 77.3 934 85.5 31.9 137.2 200.0
1,917 70.6 1,962 71.5 1,940 50.9 2,147 58.8 1,770 49.3 1,206 70.0 2,131 82.6 40.9 133.9 191.4
906 62.9 936 60.9 967 42.7 1,067 43.4 891 41.0 626 63.5 1,041 81.7 41.1 159.8 185.7
496 65.1 508 62.4 519 41.4 582 44.6 456 39.2 286 64.7 568 77.0 18.8 109.5 120.1
1,617 69.1 1,633 70.2 1,701 50.8 1,844 56.8 1,582 47.2 1,119 68.2 1,828 79.6 29.2 110.0 183.2
782 62.9 785 67.6 828 45.5 929 55.3 766 45.7 490 66.4 902 81.6 29.7 141.5 172.6
865 62.7 873 66.5 850 46.3 978 50.3 762 48.3 435 65.2 961 86.0 20.0 130.3 148.4
9763 71.7 9908.0 73.8 9841.0 52.7 10883 62.1 9177.0 50.5 6611.0 70.3 10747 82.7
843 71.2 862 72.1 847 55.6 954 61.5 796 55.9 566 70.2 943 74.9 30.3 114.8 222.3
2,877 67.6 2,929 68.1 2,925 50.4 3,166 57.9 2,725 46.9 1,984 70.4 3,125 84.9 36.9 117.0 241.5
2,827 76.2 2,854 78.8 2,727 57.0 3,051 67.0 2,536 54.0 1,897 72.8 3,011 83.8 28.5 118.8 168.5
1,431 72.8 1,449 76.6 1,466 50.9 1,611 64.8 1,412 48.2 989 68.1 1,592 78.7 27.0 102.0 244.9
862 73.7 884 77.8 915 49.9 1,045 60.3 842 48.8 569 71.6 1,021 84.2 44.1 130.6 150.3
919 69.8 926 73.4 958 49.4 1,052 60.3 863 49.9 604 67.6 1,051 82.2 34.0 89.2 238.3
NA NA NA NA NA NA NA NA NA NA NA NA NA NA NA NA NA
7754 69.6 7846.0 72.5 8017.0 47.5 8848 57.9 7533.0 44.7 5188.0 65.3 8734 73
1552 70.7 1564 76.8 1474 49.6 1686 65.2 1400 47.9 935 66.5 1658 70 27.6 110.3 246.2
792 68.3 803 68.5 847 45.5 932 55.8 813 46.8 539 66.7 928 67 41.5 127.1 307.5
2296 69.2 2323 71.7 2393 45.2 2682 52.4 2219 41.2 1493 60.9 2636 66 27.8 138.4 218.8
1490 74.5 1527 76 1616 51.1 1752 61.6 1501 47.7 1068 69 1737 79 33.2 117.5 170.3
1624 62.6 1629 66 1687 43.1 1796 52.4 1600 38 1153 64.6 1775 83 44.2 134.2 237.7
10434 71.6 10639 74.6 10597 53.7 12572 61.9 9489.0 52.4 6052.0 68.2 12405 84
1801.0 71.6 1841.0 73.3 1821.0 54.3 2139.0 61.3 1611.0 54.1 1075.0 66.5 2114.0 83 27.0 104.2 238.2
1163.0 69.5 1189.0 75.6 1145.0 54.2 1374.0 63.0 1031.0 52.6 633.0 71.4 1353.0 82 20.8 76.0 212.4
1540.0 70.6 1572.0 75.6 1532.0 55.8 1850.0 62.7 1389.0 53.4 873.0 68.8 1813.0 83 25.8 138.8 295.5
1580.0 70.5 1610.0 72.9 1674.0 48.8 1977.0 60.1 1555.0 47.5 903.0 67.6 1950.0 86 20.8 83.2 134.9
1043.0 73.3 1062.0 76.0 989.0 59.3 1198.0 63.4 864.0 56.7 565.0 68.9 1180.0 88 14.0 57.9 113.8
1062.0 72.1 1087.0 72.2 1168.0 56.3 1408.0 62.1 1041.0 56.5 668.0 67.0 1392.0 87 18.0 119.3 164.4
1183.0 73.6 1197.0 77.3 1205.0 59.9 1383.0 66.5 1099.0 57.0 717.0 75.4 1368.0 89 35.4 104.8 249.6
1062.0 73.5 1081.0 77.1 1063.0 55.4 1243.0 63.0 899.0 56.1 618.0 65.2 1235.0 87 25.5 120.8 372.6
Page 35 of 35