the meteorological observatory from neumayer gert...
TRANSCRIPT
The Meteorological Observatory from NeumayerGert König-Langlo, Bernd Loose
Alfred-Wegener-Institut, Bremerhaven, Germany
History of NeumayerIn March 1981, the Georg von Neumayer Station (70°37’S, 8°22’W) was established on the Ekstrom Ice Shelf as an observatory for meteorological, geophysical, and atmospheric chemistry measurements, as well as a logistics base for summer expeditions. Ice movements and heavy snow deposits demanded the construction of a new station building. In March 1992, the new station – called Neumayer Station - was completed only ten kilometers from the original site. After 17 years of operation, Neumayer Station has already sunk fourteen meters deep into the ice. Thus, the construction of a new station - called Neumayer_III (70°40’S, 8°16’W) - was necessary. It became operational on February 20th,2009.
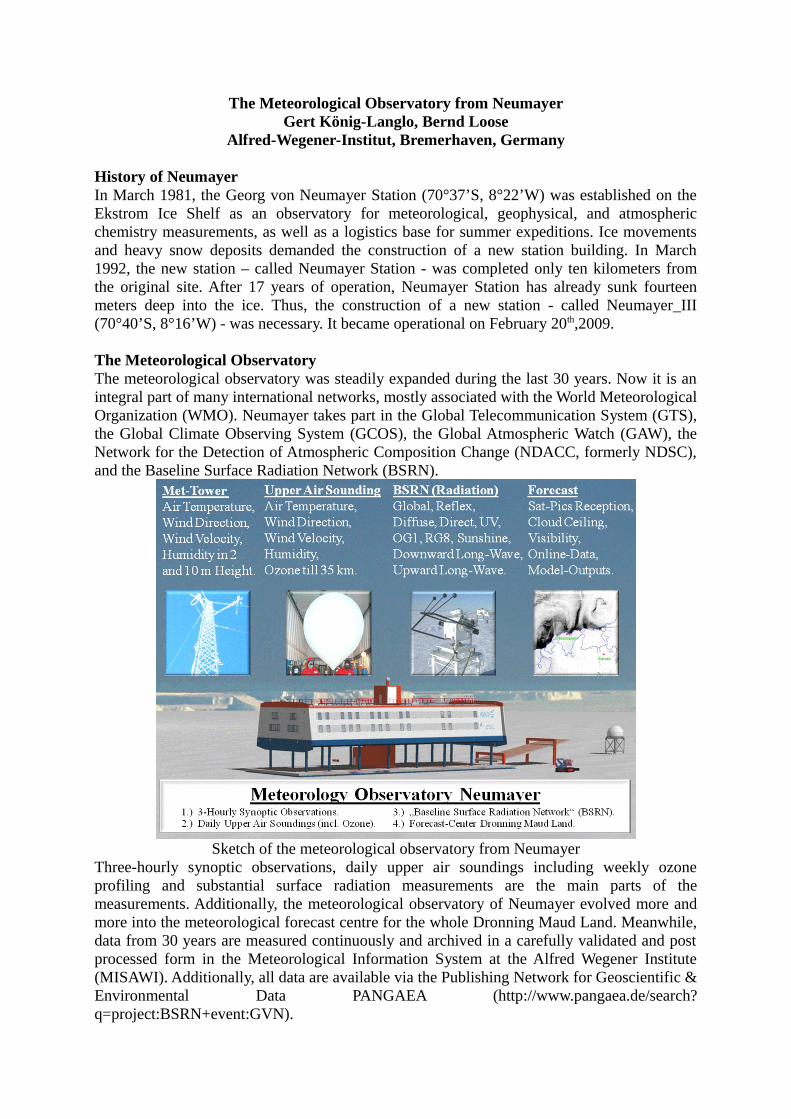
The Meteorological ObservatoryThe meteorological observatory was steadily expanded during the last 30 years. Now it is an integral part of many international networks, mostly associated with the World Meteorological Organization (WMO). Neumayer takes part in the Global Telecommunication System (GTS), the Global Climate Observing System (GCOS), the Global Atmospheric Watch (GAW), the Network for the Detection of Atmospheric Composition Change (NDACC, formerly NDSC), and the Baseline Surface Radiation Network (BSRN).
Sketch of the meteorological observatory from NeumayerThree-hourly synoptic observations, daily upper air soundings including weekly ozone profiling and substantial surface radiation measurements are the main parts of the measurements. Additionally, the meteorological observatory of Neumayer evolved more and more into the meteorological forecast centre for the whole Dronning Maud Land. Meanwhile, data from 30 years are measured continuously and archived in a carefully validated and post processed form in the Meteorological Information System at the Alfred Wegener Institute (MISAWI). Additionally, all data are available via the Publishing Network for Geoscientific & Environmental Data PANGAEA (http://www.pangaea.de/search?q=project:BSRN+event:GVN).
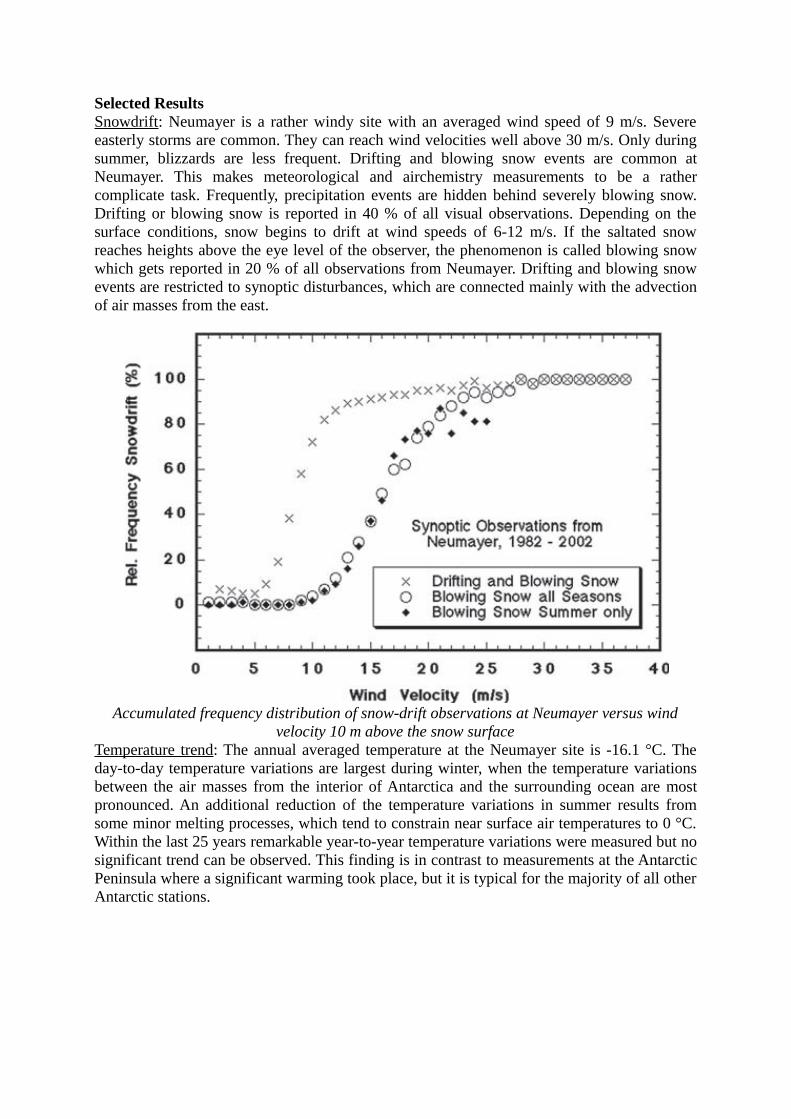
Selected ResultsSnowdrift: Neumayer is a rather windy site with an averaged wind speed of 9 m/s. Severe easterly storms are common. They can reach wind velocities well above 30 m/s. Only during summer, blizzards are less frequent. Drifting and blowing snow events are common at Neumayer. This makes meteorological and airchemistry measurements to be a rather complicate task. Frequently, precipitation events are hidden behind severely blowing snow. Drifting or blowing snow is reported in 40 % of all visual observations. Depending on the surface conditions, snow begins to drift at wind speeds of 6-12 m/s. If the saltated snow reaches heights above the eye level of the observer, the phenomenon is called blowing snow which gets reported in 20 % of all observations from Neumayer. Drifting and blowing snow events are restricted to synoptic disturbances, which are connected mainly with the advection of air masses from the east.
Accumulated frequency distribution of snow-drift observations at Neumayer versus wind velocity 10 m above the snow surface
Temperature trend: The annual averaged temperature at the Neumayer site is -16.1 °C. The day-to-day temperature variations are largest during winter, when the temperature variations between the air masses from the interior of Antarctica and the surrounding ocean are most pronounced. An additional reduction of the temperature variations in summer results from some minor melting processes, which tend to constrain near surface air temperatures to 0 °C. Within the last 25 years remarkable year-to-year temperature variations were measured but no significant trend can be observed. This finding is in contrast to measurements at the Antarctic Peninsula where a significant warming took place, but it is typical for the majority of all other Antarctic stations.
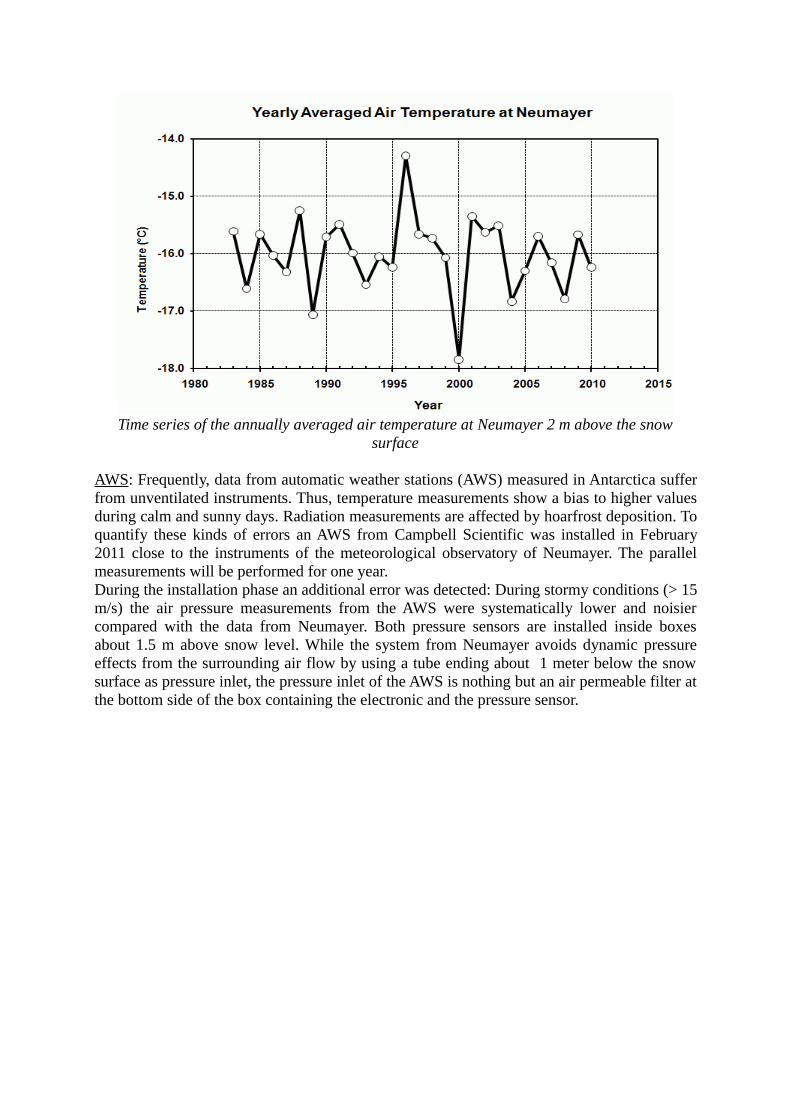
Time series of the annually averaged air temperature at Neumayer 2 m above the snow surface
AWS: Frequently, data from automatic weather stations (AWS) measured in Antarctica suffer from unventilated instruments. Thus, temperature measurements show a bias to higher values during calm and sunny days. Radiation measurements are affected by hoarfrost deposition. To quantify these kinds of errors an AWS from Campbell Scientific was installed in February 2011 close to the instruments of the meteorological observatory of Neumayer. The parallel measurements will be performed for one year. During the installation phase an additional error was detected: During stormy conditions (> 15 m/s) the air pressure measurements from the AWS were systematically lower and noisier compared with the data from Neumayer. Both pressure sensors are installed inside boxes about 1.5 m above snow level. While the system from Neumayer avoids dynamic pressure effects from the surrounding air flow by using a tube ending about 1 meter below the snow surface as pressure inlet, the pressure inlet of the AWS is nothing but an air permeable filter at the bottom side of the box containing the electronic and the pressure sensor.
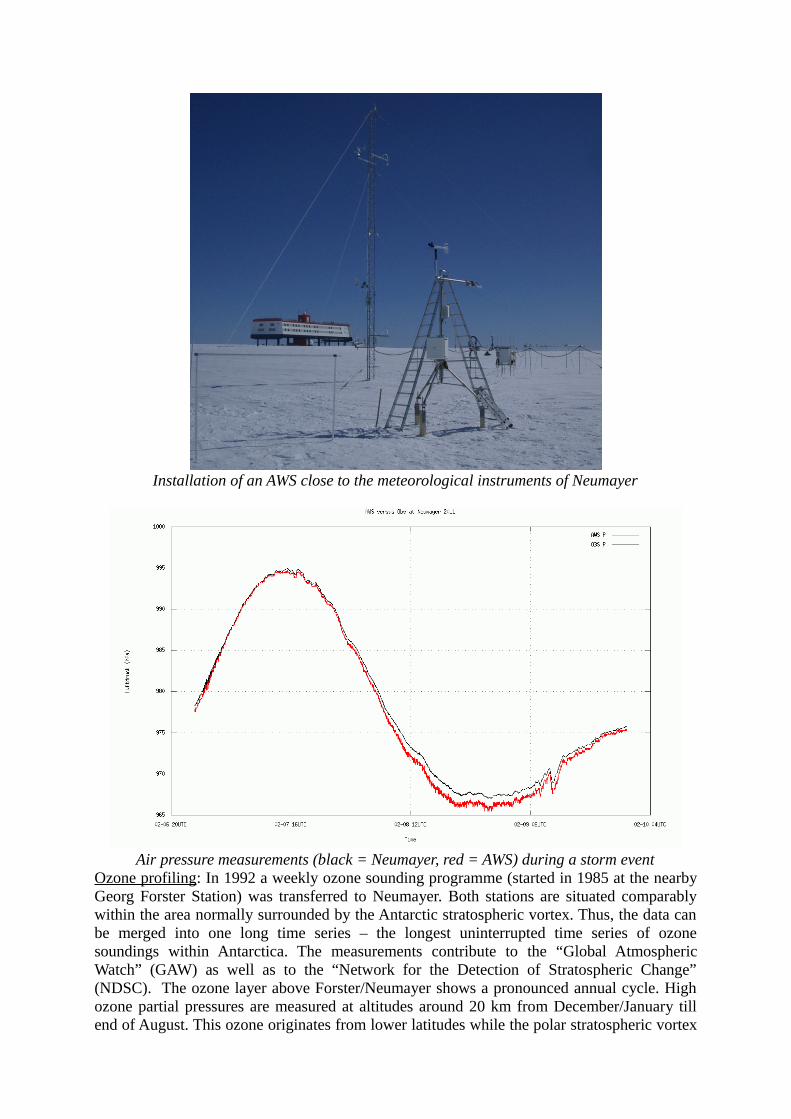
Installation of an AWS close to the meteorological instruments of Neumayer
Air pressure measurements (black = Neumayer, red = AWS) during a storm eventOzone profiling: In 1992 a weekly ozone sounding programme (started in 1985 at the nearby Georg Forster Station) was transferred to Neumayer. Both stations are situated comparably within the area normally surrounded by the Antarctic stratospheric vortex. Thus, the data can be merged into one long time series – the longest uninterrupted time series of ozone soundings within Antarctica. The measurements contribute to the “Global Atmospheric Watch” (GAW) as well as to the “Network for the Detection of Stratospheric Change” (NDSC). The ozone layer above Forster/Neumayer shows a pronounced annual cycle. High ozone partial pressures are measured at altitudes around 20 km from December/January till end of August. This ozone originates from lower latitudes while the polar stratospheric vortex
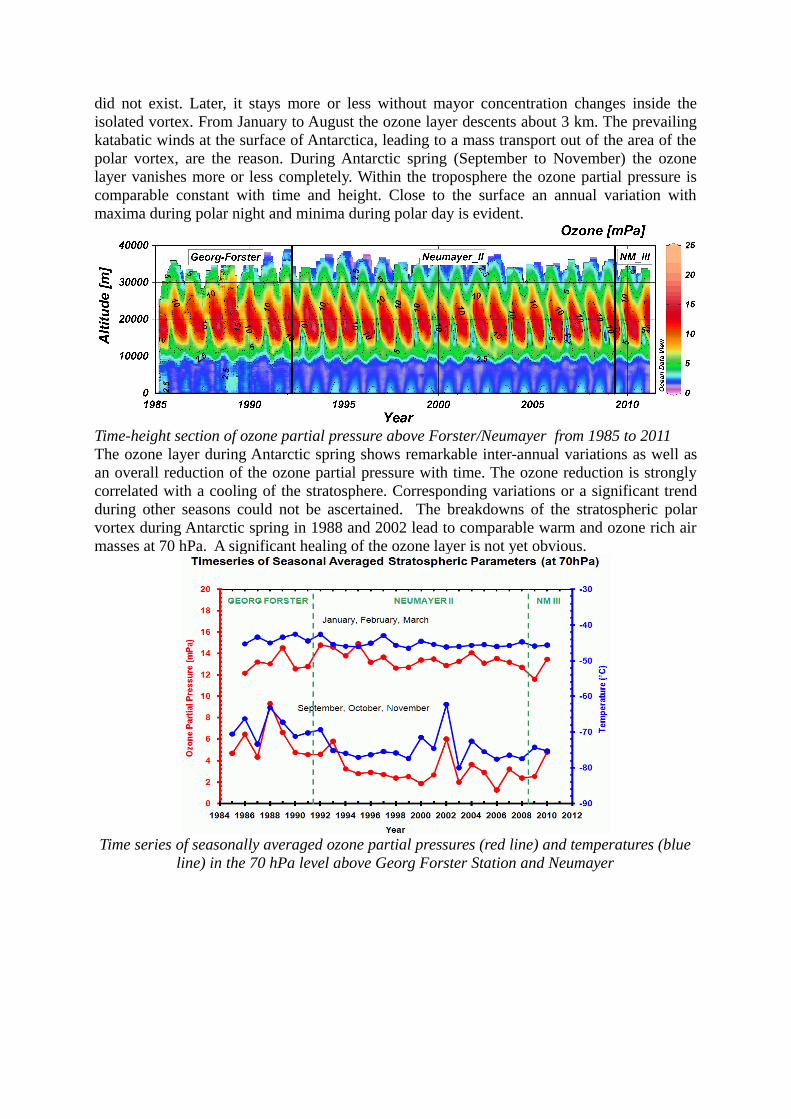
did not exist. Later, it stays more or less without mayor concentration changes inside the isolated vortex. From January to August the ozone layer descents about 3 km. The prevailing katabatic winds at the surface of Antarctica, leading to a mass transport out of the area of the polar vortex, are the reason. During Antarctic spring (September to November) the ozone layer vanishes more or less completely. Within the troposphere the ozone partial pressure is comparable constant with time and height. Close to the surface an annual variation with maxima during polar night and minima during polar day is evident.
Time-height section of ozone partial pressure above Forster/Neumayer from 1985 to 2011The ozone layer during Antarctic spring shows remarkable inter-annual variations as well as an overall reduction of the ozone partial pressure with time. The ozone reduction is strongly correlated with a cooling of the stratosphere. Corresponding variations or a significant trend during other seasons could not be ascertained. The breakdowns of the stratospheric polar vortex during Antarctic spring in 1988 and 2002 lead to comparable warm and ozone rich air masses at 70 hPa. A significant healing of the ozone layer is not yet obvious.
Time series of seasonally averaged ozone partial pressures (red line) and temperatures (blue line) in the 70 hPa level above Georg Forster Station and Neumayer