the mechanics of pitching - illuminillumin.usc.edu/assets/submissions/688/illumin article...
TRANSCRIPT
The Mechanics of Pitching Illumin Article
Jonathan Garcia
WRIT 340
5/7/2013
1
Abstract
The complexity behind a baseball pitcher’s delivery is something that coaches, engineers, and
physicians had trouble understanding for years. With the help of science and advanced
engineering techniques, a pitcher’s delivery can now be analyzed at the biomechanical level. A
pitcher’s delivery was broken down into six distinct phases. The forces and torques that the
pitcher’s body generated were then examined for each of these phases. Researchers found that
improper use of the body at certain phases of the delivery left the pitchers with a very high
susceptibility to injury. Researchers could even break down the data and analyze what muscle
group or joint was more susceptible to injury. These researchers concluded that proper pitching
mechanics could increase a pitchers effectiveness as well as reduce the risk of injury.
2
The Science of Pitching
Have you ever watched a baseball pitcher perform his windup and thought to yourself,
“Is all that stuff he’s doing with his hands and legs really necessary?” A pitcher’s delivery can
be thought of as a detailed choreographed motion where the pitcher tries to utilize every muscle
in his body to deliver effective pitches. How does a pitcher know whether or not his motions are
effectively being used? With the help of advanced engineering techniques, athletes are
discovering how to use their entire body more effectively and efficiently as well as preventing
possible injuries. Engineers are using testing tools such as load cells, 3D motion analysis, and
electromyography (EMG) to help analyze a pitcher’s mechanics. The mechanics of a pitcher are
broken down into six distinct phases, where muscle and joint activity are analyzed. The tools
then measure kinetics (forces and torques) and kinematics (timing and velocity) that a pitcher
exerts during each phase. Force is the muscle activity that cause some change in the velocity of
the ball and torque is the tendency of a force to rotate an object about some axis [2]. These
testing tools can help a pitcher extend their career by reducing injury susceptibility, improve
accuracy, and increase velocity. By understanding each phase of a pitcher’s delivery, it easier to
find where the faults in the pitcher’s delivery lie.
The Phases of a Pitch
Of all sports, baseball pitchers exert the greatest amount of angular velocity on their
shoulder [1]. However, the delivery of the ball is not completely dependent on the shoulder.
Unlike other sports, pitchers control their own rhythm and tempo while making the pitch. Each
pitch is methodical approach using different muscle groups to try and make effective pitches
3
with an efficient pitch count (the amount of pitches a pitcher makes in a single game). Although
a pitcher’s motion can seem like one continuous motion, it is actually a series of many motions.
These motions a pitcher makes is broken down in to six distinctive stages: wind-up, stride, arm
cocking, arm acceleration, arm deceleration, and follow-through [1].
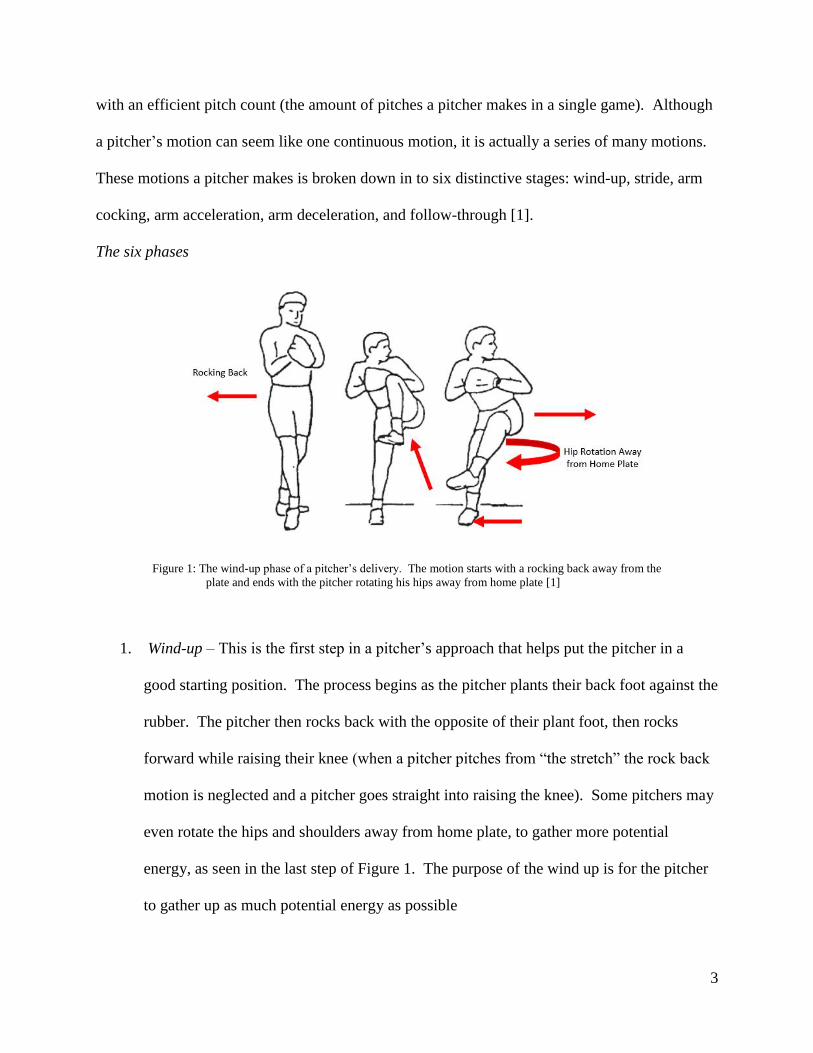
The six phases
Figure 1: The wind-up phase of a pitcher’s delivery. The motion starts with a rocking back away from the
plate and ends with the pitcher rotating his hips away from home plate [1]
1. Wind-up – This is the first step in a pitcher’s approach that helps put the pitcher in a
good starting position. The process begins as the pitcher plants their back foot against the
rubber. The pitcher then rocks back with the opposite of their plant foot, then rocks
forward while raising their knee (when a pitcher pitches from “the stretch” the rock back
motion is neglected and a pitcher goes straight into raising the knee). Some pitchers may
even rotate the hips and shoulders away from home plate, to gather more potential
energy, as seen in the last step of Figure 1. The purpose of the wind up is for the pitcher
to gather up as much potential energy as possible
4
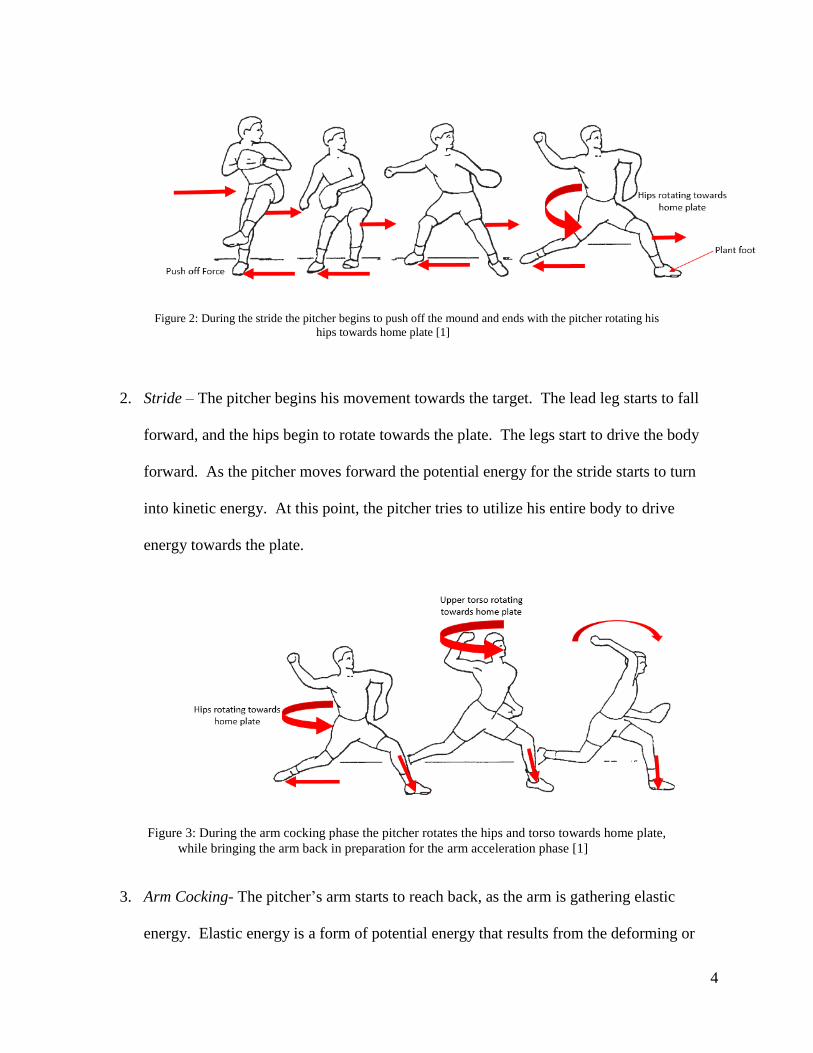
Figure 2: During the stride the pitcher begins to push off the mound and ends with the pitcher rotating his
hips towards home plate [1]
2. Stride – The pitcher begins his movement towards the target. The lead leg starts to fall
forward, and the hips begin to rotate towards the plate. The legs start to drive the body
forward. As the pitcher moves forward the potential energy for the stride starts to turn
into kinetic energy. At this point, the pitcher tries to utilize his entire body to drive
energy towards the plate.
Figure 3: During the arm cocking phase the pitcher rotates the hips and torso towards home plate,
while bringing the arm back in preparation for the arm acceleration phase [1]
3. Arm Cocking- The pitcher’s arm starts to reach back, as the arm is gathering elastic
energy. Elastic energy is a form of potential energy that results from the deforming or
5
stretching of an object e.g. stretching of a spring. In a pitcher’s arm the elastic energy is
stored in the tendons. During the stride and the arm cocking phase, the pelvis starts to
rotate forward, quickly followed by the upper torso. Through this phase, the pelvis,
upper torso, elbow, and shoulder are all working together to generate as much power as
possible. The more power that is generated the faster a pitcher can throw the ball.
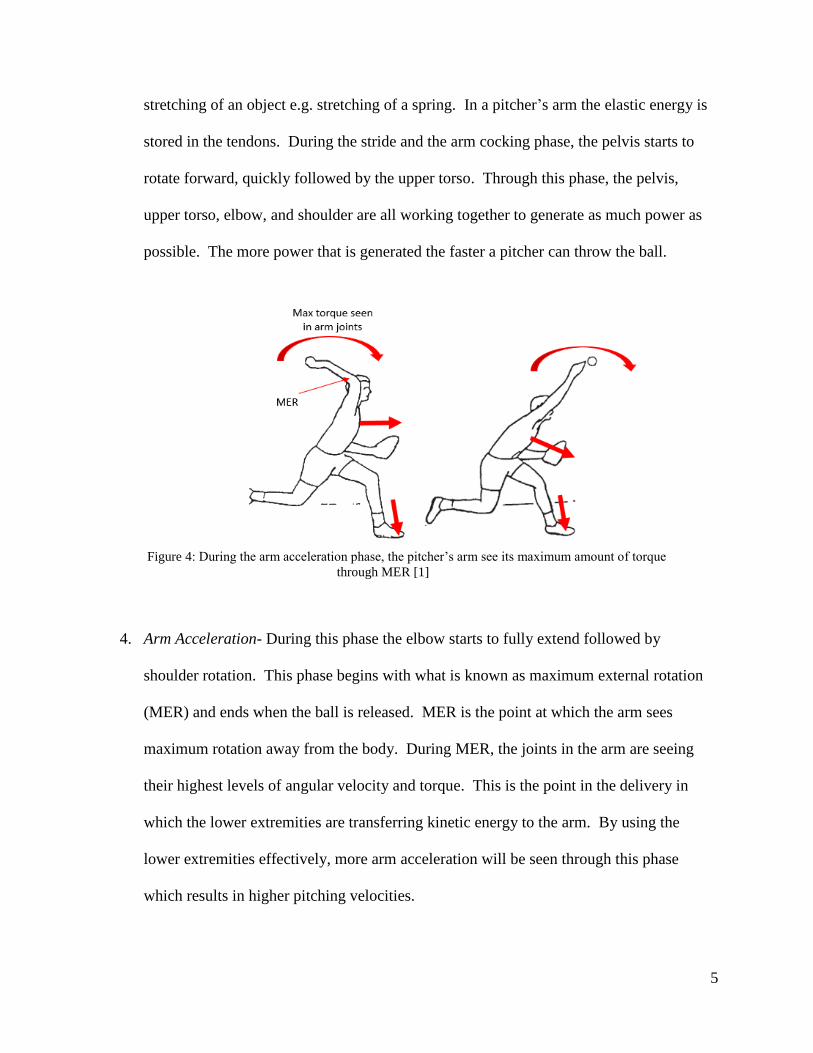
Figure 4: During the arm acceleration phase, the pitcher’s arm see its maximum amount of torque
through MER [1]
4. Arm Acceleration- During this phase the elbow starts to fully extend followed by
shoulder rotation. This phase begins with what is known as maximum external rotation
(MER) and ends when the ball is released. MER is the point at which the arm sees
maximum rotation away from the body. During MER, the joints in the arm are seeing
their highest levels of angular velocity and torque. This is the point in the delivery in
which the lower extremities are transferring kinetic energy to the arm. By using the
lower extremities effectively, more arm acceleration will be seen through this phase
which results in higher pitching velocities.
6
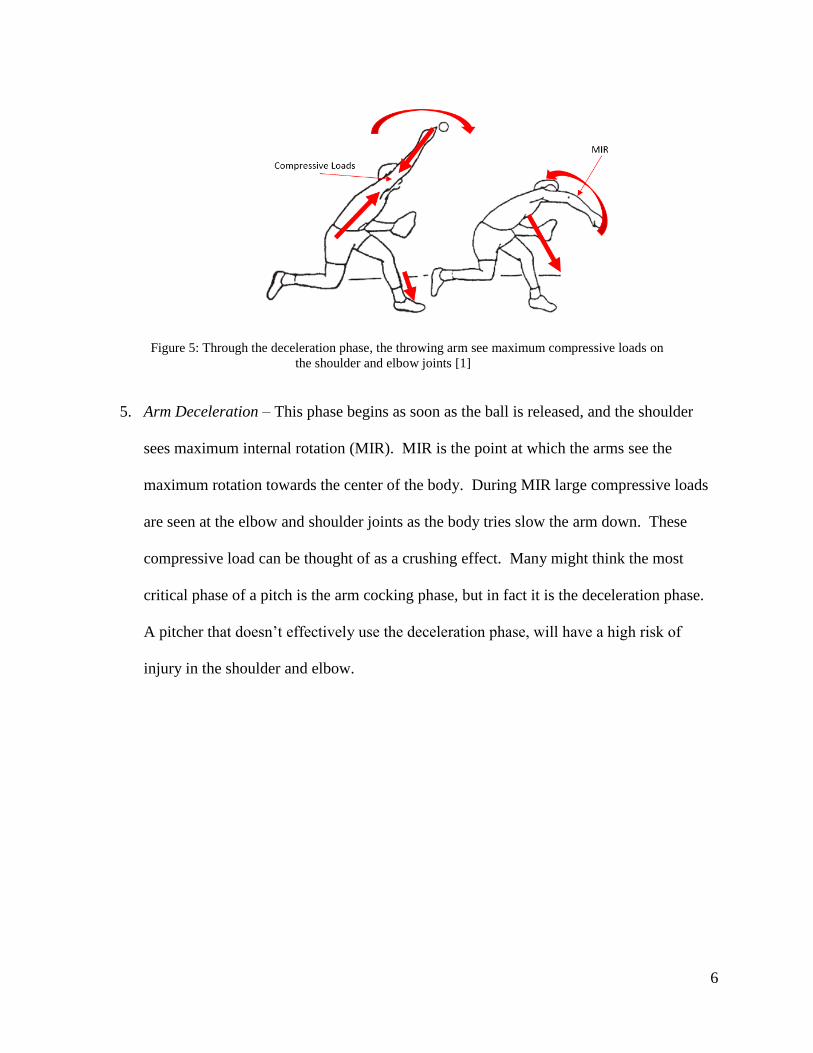
Figure 5: Through the deceleration phase, the throwing arm see maximum compressive loads on
the shoulder and elbow joints [1]
5. Arm Deceleration – This phase begins as soon as the ball is released, and the shoulder
sees maximum internal rotation (MIR). MIR is the point at which the arms see the
maximum rotation towards the center of the body. During MIR large compressive loads
are seen at the elbow and shoulder joints as the body tries slow the arm down. These
compressive load can be thought of as a crushing effect. Many might think the most
critical phase of a pitch is the arm cocking phase, but in fact it is the deceleration phase.
A pitcher that doesn’t effectively use the deceleration phase, will have a high risk of
injury in the shoulder and elbow.
7
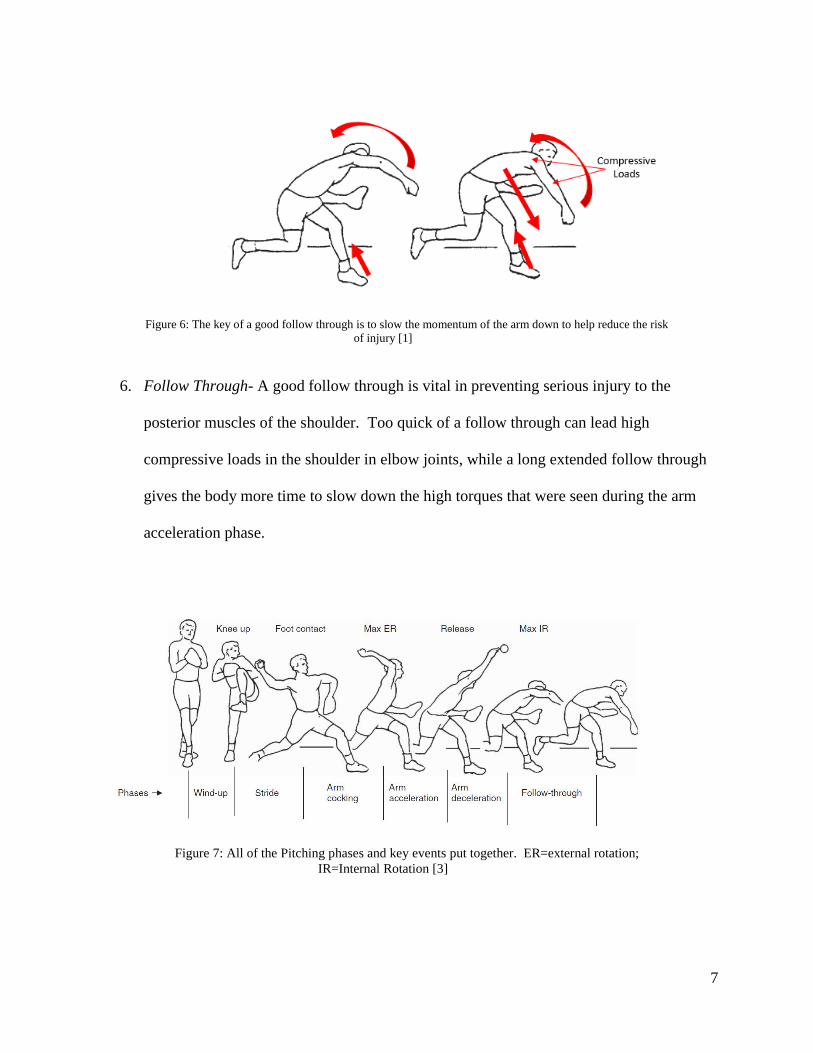
Figure 6: The key of a good follow through is to slow the momentum of the arm down to help reduce the risk
of injury [1]
6. Follow Through- A good follow through is vital in preventing serious injury to the
posterior muscles of the shoulder. Too quick of a follow through can lead high
compressive loads in the shoulder in elbow joints, while a long extended follow through
gives the body more time to slow down the high torques that were seen during the arm
acceleration phase.
Figure 7: All of the Pitching phases and key events put together. ER=external rotation;
IR=Internal Rotation [3]
8
The purpose of all of these motions is to gather up as much potential energy as possible
(i.e. the wind-up) and turn this into as much kinetic energy as possible (i.e. stride, arm cocking,
arm acceleration, and arm deceleration). The pitcher then tries to transmit as much energy as
possible into the ball. Transmitting all this energy makes it possible for pitchers to throw in
excess of 95 MPH.
How engineers are putting science to use in baseball
For many years, pitchers and coaches were only able to analyze a pitcher’s performance
through experience and statistics. Physicians were only able to see what a pitcher was doing
wrong after injury had occurred. For example, if a pitcher had extensive posterior shoulder
damage, the physician could tell that the damage would have more than likely occurred during
the deceleration phase. The posterior muscles of the shoulder have been identified as having a
paramount role in slowing the arm down [4]. Today coaches and physicians, with the help of
engineers, can apply advanced measurement techniques to analyze a pitcher’s mechanics. Some
of these techniques use load cells, 3D motion analysis, and electromyography (EMG) [5-7].
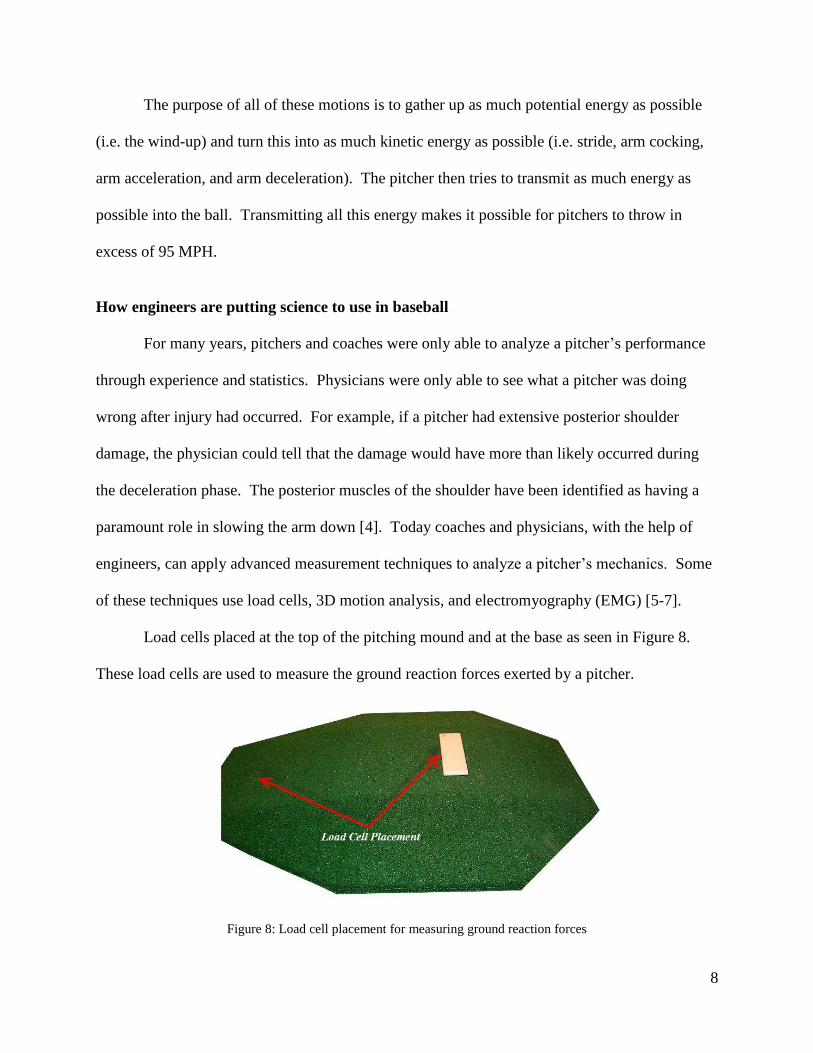
Load cells placed at the top of the pitching mound and at the base as seen in Figure 8.
These load cells are used to measure the ground reaction forces exerted by a pitcher.
Figure 8: Load cell placement for measuring ground reaction forces
9
These ground reaction forces are the push off force and the landing force of the plant foot as seen
in Figure 2. By measuring these forces, the efficiency of how well a pitcher is using his legs can
be analyzed. It has been found that a pitcher’s velocity is directly proportional to the push off
and downward force of the plant foot recorded [6, 8]. By increasing a pitcher’s push off and
landing force, the pitcher’s ball velocity can be increased.
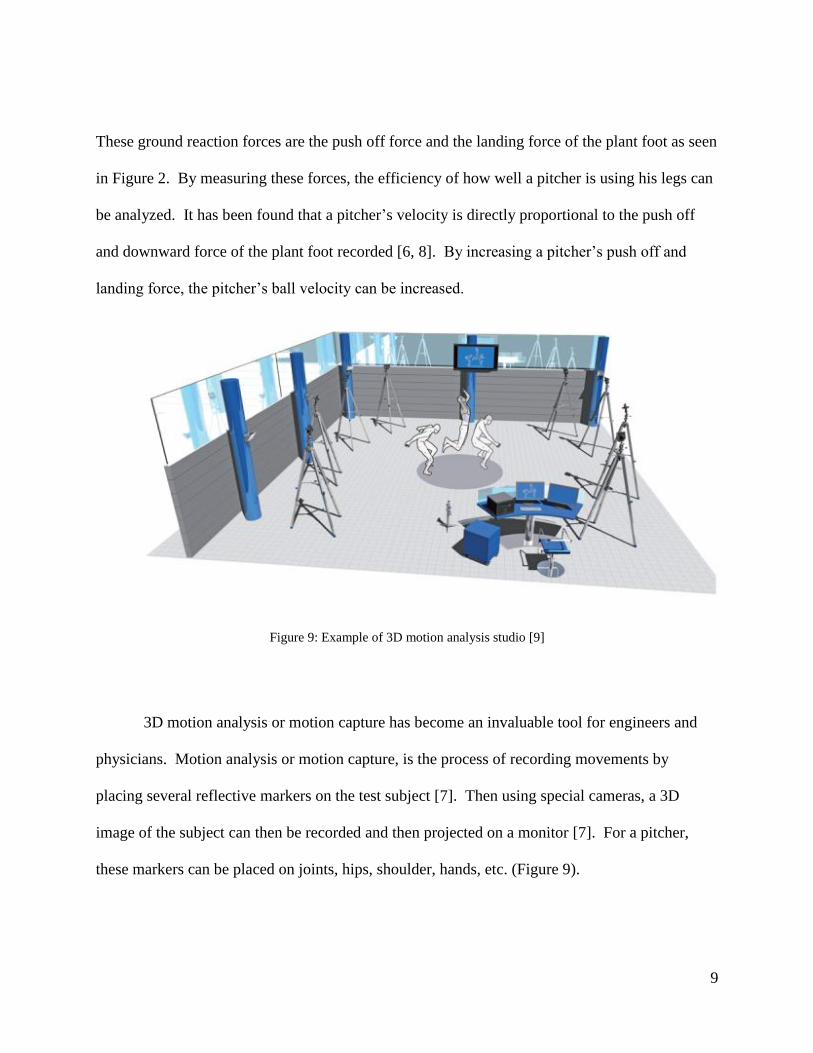
Figure 9: Example of 3D motion analysis studio [9]
3D motion analysis or motion capture has become an invaluable tool for engineers and
physicians. Motion analysis or motion capture, is the process of recording movements by
placing several reflective markers on the test subject [7]. Then using special cameras, a 3D
image of the subject can then be recorded and then projected on a monitor [7]. For a pitcher,
these markers can be placed on joints, hips, shoulder, hands, etc. (Figure 9).
10
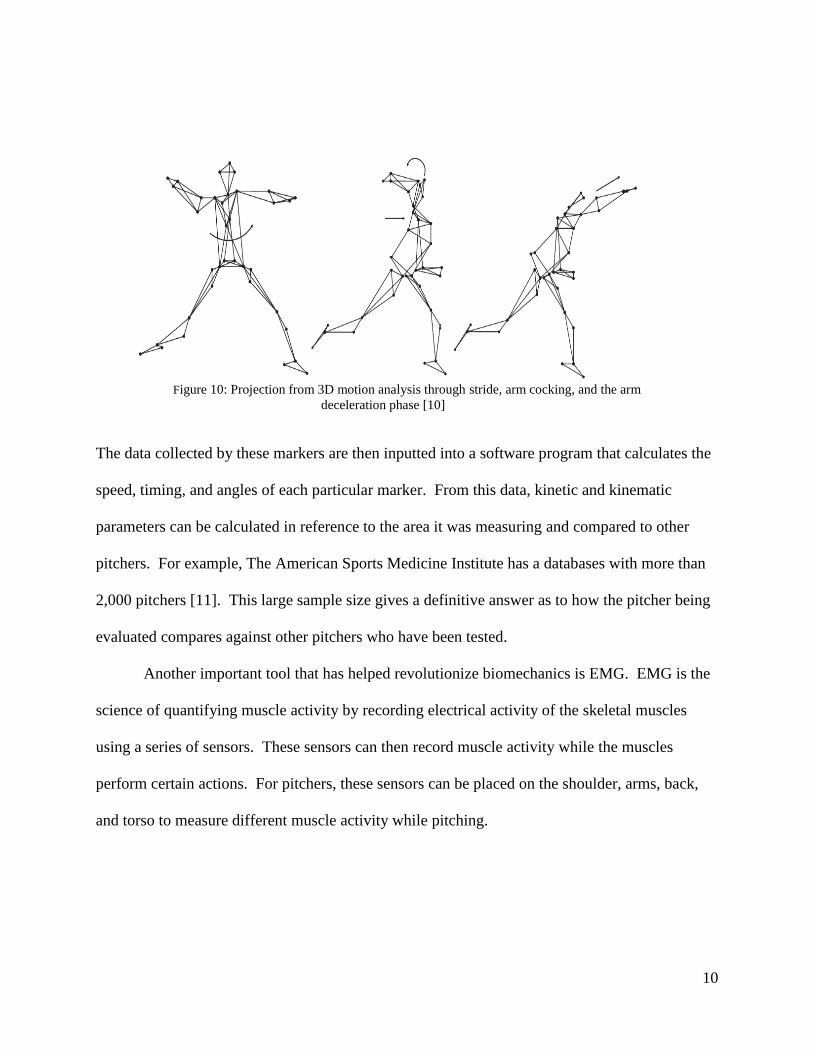
Figure 10: Projection from 3D motion analysis through stride, arm cocking, and the arm
deceleration phase [10]
The data collected by these markers are then inputted into a software program that calculates the
speed, timing, and angles of each particular marker. From this data, kinetic and kinematic
parameters can be calculated in reference to the area it was measuring and compared to other
pitchers. For example, The American Sports Medicine Institute has a databases with more than
2,000 pitchers [11]. This large sample size gives a definitive answer as to how the pitcher being
evaluated compares against other pitchers who have been tested.
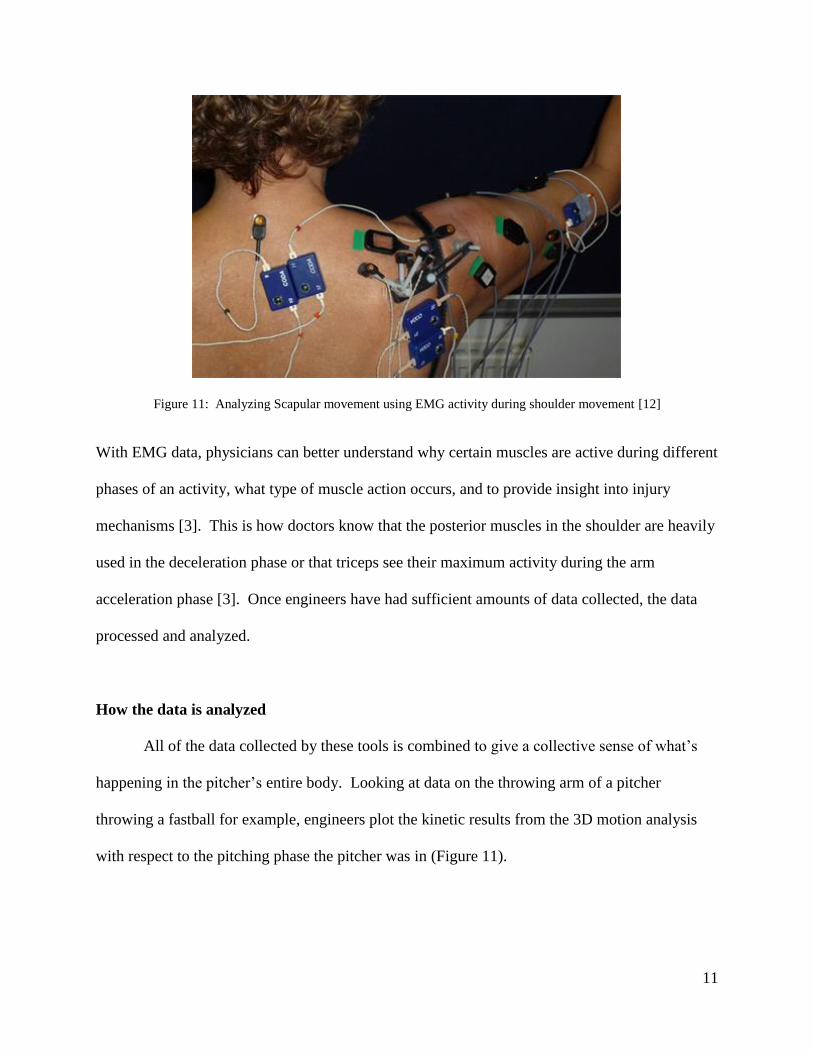
Another important tool that has helped revolutionize biomechanics is EMG. EMG is the
science of quantifying muscle activity by recording electrical activity of the skeletal muscles
using a series of sensors. These sensors can then record muscle activity while the muscles
perform certain actions. For pitchers, these sensors can be placed on the shoulder, arms, back,
and torso to measure different muscle activity while pitching.
11
Figure 11: Analyzing Scapular movement using EMG activity during shoulder movement [12]
With EMG data, physicians can better understand why certain muscles are active during different
phases of an activity, what type of muscle action occurs, and to provide insight into injury
mechanisms [3]. This is how doctors know that the posterior muscles in the shoulder are heavily
used in the deceleration phase or that triceps see their maximum activity during the arm
acceleration phase [3]. Once engineers have had sufficient amounts of data collected, the data
processed and analyzed.
How the data is analyzed
All of the data collected by these tools is combined to give a collective sense of what’s
happening in the pitcher’s entire body. Looking at data on the throwing arm of a pitcher
throwing a fastball for example, engineers plot the kinetic results from the 3D motion analysis
with respect to the pitching phase the pitcher was in (Figure 11).
12
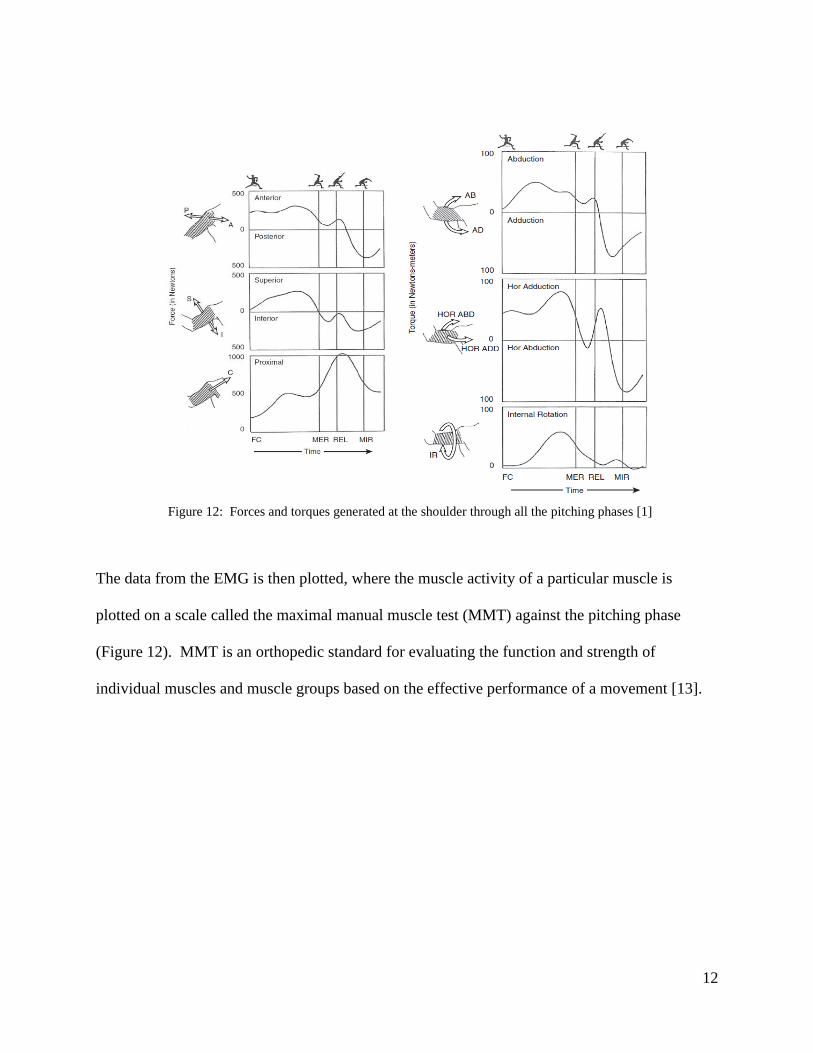
The data from the EMG is then plotted, where the muscle activity of a particular muscle is
plotted on a scale called the maximal manual muscle test (MMT) against the pitching phase
(Figure 12). MMT is an orthopedic standard for evaluating the function and strength of
individual muscles and muscle groups based on the effective performance of a movement [13].
Figure 12: Forces and torques generated at the shoulder through all the pitching phases [1]
13
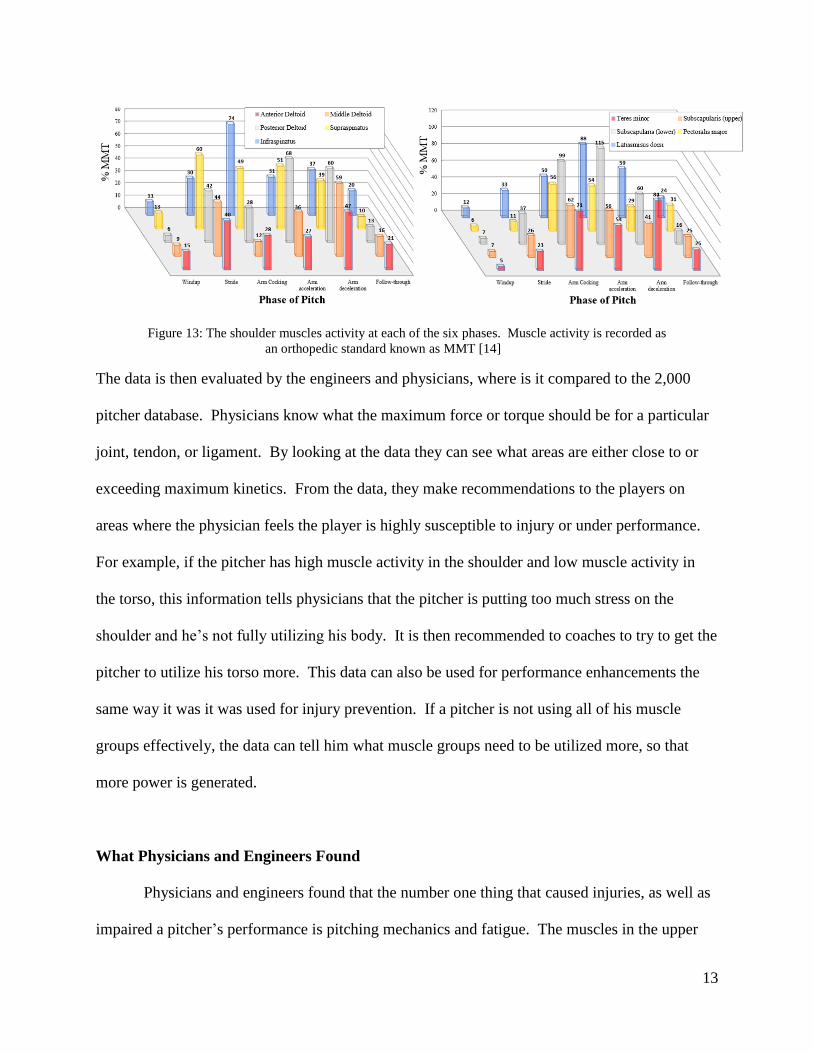
Figure 13: The shoulder muscles activity at each of the six phases. Muscle activity is recorded as
an orthopedic standard known as MMT [14]
The data is then evaluated by the engineers and physicians, where is it compared to the 2,000
pitcher database. Physicians know what the maximum force or torque should be for a particular
joint, tendon, or ligament. By looking at the data they can see what areas are either close to or
exceeding maximum kinetics. From the data, they make recommendations to the players on
areas where the physician feels the player is highly susceptible to injury or under performance.
For example, if the pitcher has high muscle activity in the shoulder and low muscle activity in
the torso, this information tells physicians that the pitcher is putting too much stress on the
shoulder and he’s not fully utilizing his body. It is then recommended to coaches to try to get the
pitcher to utilize his torso more. This data can also be used for performance enhancements the
same way it was it was used for injury prevention. If a pitcher is not using all of his muscle
groups effectively, the data can tell him what muscle groups need to be utilized more, so that
more power is generated.
What Physicians and Engineers Found
Physicians and engineers found that the number one thing that caused injuries, as well as
impaired a pitcher’s performance is pitching mechanics and fatigue. The muscles in the upper
14
extremities contracted in a very coordinated manner, balancing stabilization and rapid motion
[14]. The stabilization during the pitch helps protect the muscles, tendon, ligaments, and joints
as well as maximizing ball velocity. The rapid motion is what influences ball velocity and
accuracy. Balancing the fine line between rapid movement and stabilization is very difficult, but
a pitcher who can do both of those things can maximize their velocity and reduce their risk of
injury. To minimize fatigue, pitchers have a set limit on how many pitches they can throw in a
given amount of days known as a pitch count [11]. Pitch counts have had such an impact on
preventing injuries at the professional level, that even youth levels have adopted them. Studies
have shown that a pitcher that exceeds a pitch count is 36 times more likely to need surgery on
the throwing arm [15].
An understanding of the kinematics and kinetics of the shoulder during athletic activity is
essential for proper treatment of the shoulder. Physicians have found these studies are very
useful in preventing injuries and maximizing performance. If the pitcher participates in a study
before injury occurs, the physician can tell him what injuries he risks as well as make
recommendations on what muscle groups are not being effectively utilized. From the
physician’s recommendations, the pitcher can work with a coach to help modify his pitching
approach. With the help of science, a pitcher’s careers can be extended as well as performance
increased.
How science has illuminated baseball
The difference between good science and bad science is the difference between
interpretation and observation. Interpretation is subjective, while observation is objective and
based on facts. For decades coaches and physicians were basing their reasoning’s for a pitcher’s
15
injuries and performance on interpretation. They were making assumptions about injuries and
performance with very little validity. Now engineers and physicians are using observational
methods, where a set of results can be repeated over and over again. Science and engineering
has helped bring new light to many of the myths surrounding pitching performance and injuries.
A pitcher’s performance can be analyzed to find faults in a pitcher’s mechanics and then come
up with solutions. Physicians and coaches are not just guessing anymore, they have data to
validate their reasoning’s. Science has helped shine light on the beautiful complexity behind
pitching and thanks to science pitchers can now enjoy longer careers pitching at their highest
level.
Biography
Jonathan Garcia is from Los Angeles, CA and is a junior majoring in mechanical engineering at
USC’s Viterbi School of Engineering. Before attending USC, he served for six years in the U.S.
Air Force as well as worked for Space Exploration Technologies (SpaceX) for five years. Once
graduated from USC, he hopes to return to the aerospace industry as a propulsion engineer.
16
Works Cited
[1] G. S. Fleisig, S. Dun, and D. Kingsley, "CHAPTER 31 - Biomechanics of the Shoulder
During Sports," in The Athlete's Shoulder (Second Edition), E. W. Kevin, P.T, D.P.T, M.
R. Michael, P.T, D.P.T, et al., Eds., ed Philadelphia: Churchill Livingstone, 2009, pp.
365-384.
[2] R. A. Serway and J. W. Jewett Jr, Physics for scientists and engineers vol. 1:
Brooks/Cole Publishing Company, 2009.
[3] R. Escamilla and J. Andrews, "Shoulder Muscle Recruitment Patterns and Related
Biomechanics during Upper Extremity Sports," Sports Medicine, vol. 39, pp. 569-590,
2009/07/01 2009.
[4] G. S. Fleisig, J. R. Andrews, C. J. Dillman, and R. F. Escamilla, "Kinetics of baseball
pitching with implications about injury mechanisms," The American journal of sports
medicine, vol. 23, pp. 233-239, 1995.
[5] D. G. E. Robertson, Research methods in biomechanics: Human Kinetics Publishers,
2004.
[6] B. A. MacWilliams, T. Choi, M. K. Perezous, E. Y. S. Chao, and E. G. McFarland,
"Characteristic Ground-Reaction Forces in Baseball Pitching," The American Journal of
Sports Medicine, vol. 26, pp. 66-71, January 1, 1998 1998.
[7] G. Fleisig, "Biomechanics of Baseball Pitching," in International Society of Biomechnics
in Sports 2010 Congress, Marquette, Michigan, 2010.
[8] K. Nosu, Y. Yabuzaki, and K. Yamanaka, "Evaluation of baseball pitching form by
ground reaction force measurement and video analysis," Journal of Visualization, vol. 12,
pp. 293-294, 2009/12/01 2009.
[9] B. Watson, "zFloMotion Analysis: 3D Motion Analysis," vol. 2013, zFloMotion, Ed.,
ed. Boston, MA: zFlo, 2012.
[10] S. Oyama, "Baseball pitching kinematics, joint loads, and injury prevention," Journal of
Sport and Health Science, vol. 1, pp. 80-91, 9// 2012.
[11] J. R. Andrews, "Pitching Biomechanics Evaluation," G. Fleisig, Ed., ed. Birmingham,
AL: American Sports Medicine Institute, 2012.
[12] D. Newham, "Scapular movement and EMG activity during shoulder movement," ed.
King's College London, 2013.
[13] M. Dutton, Orthopaedic examination, evaluation & intervention: a pocket handbook:
McGraw-Hill, 2005.
[14] N. M. DiGiovine, F. W. Jobe, M. Pink, and J. Perry, "An electromyographic analysis of
the upper extremity in pitching," Journal of Shoulder and Elbow Surgery, vol. 1, pp. 15-
25, 1// 1992.
[15] J. Andrews, "Protecting Young Pitching Arms," in The Little Leaugue Pitch Count
Regulation, G. Fleisig, Ed., ed.
Multimedia Suggestions
http://www.youtube.com/watch?v=yEpdoAZiHWQ
https://www.youtube.com/watch?v=ZXG9ru6T-qg