the long-run labor-market consequences of civil war ...ftp.iza.org/dp5028.pdf · consequences of...
TRANSCRIPT
DI
SC
US
SI
ON
P
AP
ER
S
ER
IE
S
Forschungsinstitut zur Zukunft der ArbeitInstitute for the Study of Labor
The Long-Run Labor-Market Consequences ofCivil War: Evidence from the Shining Path in Peru
IZA DP No. 5028
June 2010
Jose Galdo
The Long-Run Labor-Market Consequences of Civil War:
Evidence from the Shining Path in Peru
Jose Galdo Carleton University
and IZA
Discussion Paper No. 5028 June 2010
IZA
P.O. Box 7240 53072 Bonn
Germany
Phone: +49-228-3894-0 Fax: +49-228-3894-180
E-mail: [email protected]
Any opinions expressed here are those of the author(s) and not those of IZA. Research published in this series may include views on policy, but the institute itself takes no institutional policy positions. The Institute for the Study of Labor (IZA) in Bonn is a local and virtual international research center and a place of communication between science, politics and business. IZA is an independent nonprofit organization supported by Deutsche Post Foundation. The center is associated with the University of Bonn and offers a stimulating research environment through its international network, workshops and conferences, data service, project support, research visits and doctoral program. IZA engages in (i) original and internationally competitive research in all fields of labor economics, (ii) development of policy concepts, and (iii) dissemination of research results and concepts to the interested public. IZA Discussion Papers often represent preliminary work and are circulated to encourage discussion. Citation of such a paper should account for its provisional character. A revised version may be available directly from the author.

IZA Discussion Paper No. 5028 June 2010
ABSTRACT
The Long-Run Labor-Market Consequences of Civil War: Evidence from the Shining Path in Peru*
This study exploits district-level variation in the timing and intensity of civil war violence to investigate whether early-life exposure to civil wars affects labor-market outcomes later in life. In particular, we examine the impacts of armed conflict in Peru, a country that experienced the actions of a tenacious, brutally effective war machine, the Shining Path, between 1980 and 1995. This study finds that the most sensitive period to early-life exposure to civil war violence is the first 36 months of life. A one standard deviation increase in civil war exposure leads to a four percent fall in adult monthly earnings. Neither fetal, nor pre-school, periods significantly affect long-run earnings. Substantial heterogeneity in the earnings impacts emerge when considering variation in the types of civil war violence. Sexual violations disproportionally affected the wages of women, while torture and forced disappearances disproportionally affected the wages of men. Evidence on intervening pathways suggests that health rather than schooling is the most important channel in connecting early-life exposure to civil war and adult earnings. JEL Classification: I12, J13, O12, O15 Keywords: civil war, earnings, measurement error, instrumental variable approach,
Shining Path Corresponding author: Jose Galdo Department of Economics and School of Public Policy Carleton University 1011 Dunton Tower Ottawa, ON K1S5B6 Canada E-mail: [email protected]
* I thank Gustavo Bobonis, Ana Dammert, Chris Worswick, Jeff Smith, and Kim Lehrer for valuable comments and suggestions, as well as seminar participants at the 2010 Fifth IZA/World Bank “Employment and Development Conference” in Cape Town. Veronica Montalva provided excellent research assistance. I thank the Peruvian Truth and Reconciliation Commission for sharing the civil war violence dataset. The standard disclaimer applies.
1
1. Introduction
Violence against (and between) civilians is the most important attribute of civil wars. A
minimum of eight out of ten people murdered in civil wars have been civilians (Kriger 1992).
Unlike conventional wars, civil wars are associated with mass murder, forced disappearances,
sexual assaults, and other types of extreme violence deliberately inflicted with the purpose of
intimidating civilians through exemplary terror (Kalyvas 2006).
It is well documented the direct short-run effects of civil wars include the destruction of
vital infrastructure, the collapse of institutions, a large number of displaced individuals,
orphanage children, and a massive loss of life (Collier and Hoeffler 2003). Abadie and
Gardeazabal (2003), for instance, illustrated the negative impact of terrorist violence in the
Basque region of Spain on economic growth. Justino and Verwimp (2006) showed that one out
of five Rwandans moved into poverty after the genocide. Yet, the long-run consequences of civil
wars on human capital development, institutions, and social norms are still very unclear (see
Blattman and Miguel 2009 for an excellent review of the literature).
In this study, we address whether early life exposure to civil war in Peru affects labor-
market earnings later in life, following the critical-period programming theory (e.g., Godfrey and
Barker 2000). For almost two decades, this Andean country experienced the actions of a
tenacious, brutally effective war and political machine with no precedent in its modern history,
the Shining Path. The social and economic losses from this spiral of violence were dramatic.
Eight years after the beginning of the civil war, a special committee appointed by the Senate
estimated the economic losses to be in US$9 billion dollars, equivalent to 66 percent of Peru‟s
total foreign debt, or 45 percent of its GDP in 1988 (DESCO 1989). The production of violence
2
led to over 36,000 serious violence acts, including more than 24,000 documented killings and
forced disappearances (TRC 2003).
A recent body of literature on the legacies of civil wars suggests that schooling
(Chamarbagwala and Moran 2010, Shemyakina 2010, Leon 2009) and health outcomes (Akresh
et al. 2007, 2009, Alderman et al. 2004) are negatively impacted by episodes of civil war; which,
seen through the scope of human capital models, will inevitably affect total lifetime earnings of
those affected. Direct evidence on the long-run labor-market consequences of civil wars,
however, is still a missing gap in the literature. An exception is the work of Blattman and Annan
(2007) who reported less schooling and work experience for former child soldiers in Uganda,
and therefore, less success in their labor market outcomes as adults1. A somewhat different
picture was obtained by Humphreys and Weinstein (2007), who found that increases in Sierra
Leone combatants‟ violence exposure was weakly correlated with employability.
This study does not restrict labor-market analysis to former combatants, but rather uses a
large national representative sample of civilians exposed to civil war at the very beginning of
their lives. Moreover, we examine violence shocks several periods before and after birth to
uncover evidence about the most sensitive or critical period: fetal, early childhood, and pre-
school exposure2. Furthermore, this study uses a large number of cohorts in a representative
sample of the national population that enables us to assess the long-run impacts of civil war
violence, which improves over limited time horizons of most civil war datasets.
1 This evidence is consistent with the findings in the U.S. and European literature for white veterans of conventional
or international wars (see Hearst and Newman 1986; Angrist 1990). 2 This paper has benefited from a recent body of research in economics that relates conditions in early life to
outcomes in later life. This literature has helped in identifying shocks that have long-lasting effects, understanding
the mechanisms of underlying shocks‟ persistence, and highlighting potential pathways connecting childhood and
adult outcomes. So far, this work has primarily focused on the long-run effects of health or environmental shocks in
early life on adult health (Maccini and Yang 2009, Alderman and Behrman 2006; Strauss and Thomas 1998) and
schooling attainment (Glewwe and King 2001, Behrman and Rosenzweig 2004, Alderman et al. 2006 )

3
The civil war in Peru began in the southern Sierra and spread to the rest of the country
over a 15-year period. By exploiting regional variation in the timing and intensity of violence,
we are able to identify its effects on labor-market earnings. Similar strategies were used in recent
studies addressing the impact of civil war violence on human capital outcomes (e.g., Akresh et
al. 2006, 2009; Chamarbagwala and Moran 2010; Shemyakina 2010).
We aim to advance on this literature by way of a systematic analysis of violence
measures. First, we address measurement error in the violence dataset by using instrumental
variables regressions where variables for violence measured in the closest 5 districts serve as
instruments for violence in the individuals‟ district of birth. Measurement error, inherently
affecting the majority of civil war datasets, has not been addressed in this literature (Blattman
and Miguel 2009). Second, we use deviations, or transitory components, in the district-level
violence around birth as an indicator of violence exposure early in life. This is a methodological
advantage compared to the use of the actual intensity of violence that does not separate transitory
shocks from secular trends in violence conditions. Likewise, the use of a very fine level of
variation, at the district level, is an improvement over more aggregate (provincial and
department) civil war datasets.
The distinction between civil war and violence in civil wars has been largely overlooked
in the micro data analysis of civil wars (Kalyvas 2006). Accounting for civil war violence has
primarily been based on a single specific measure of violence, including deaths (Chamarbagwala
and Moran 2010) and abductions (Blattman and Annan 2009), length of exposure to civil war
(e.g., Akresh et al. 2009, Leon 2009), and damage to household dwellings (Shemyakina 2010).
In this study, we uncover evidence on the heterogeneity of civil war impacts by studying
4
separately five types of civil war violence: sexual violations, forced disappearances, abductions,
killings, and forced detentions and torture.
We use two different sources of information to fulfill the data requirements of this
investigation. To capture the socio-demographic and labor-market earnings of civilians, we use
data from the 2006 and 2007 waves of the Peruvian household survey, Encuesta Nacional de
Hogares (ENAHO), which interviewed approximately 22,000 households in both urban and rural
regions in each year. The information on civil war measures comes from the Peruvian Truth and
Reconciliation Commission (TRC), who collected a comprehensive dataset based on the
reconstruction of the civil war period. We then link each individual in the household surveys to
district-specific violence data according to the birth year of the respondent. In particular, we
examine the earnings of working-age individuals born between 1974 and 1993, i.e., aged 14 to
34, in 2007, and thus, affected by the civil war violence during their first six years of life.
Five primary results emerge from this study. First, the most sensitive period to early-life
exposure to civil war violence is the first 36 months of life. A one standard deviation increase in
early childhood exposure to violence leads to a 4 percent fall in adult monthly earnings. Neither
fetal, nor pre-school, periods are significantly related to adult earnings. Second, there is a large
difference in the magnitude of the estimates emerging from standard linear and instrumental
variables approach models, which suggests strong attenuation bias because of measurement error
in the civil war dataset. Third, women are disproportionally affected by civil war violence
relative to men. The magnitude of these differences reaches almost 4 percentage points.
Likewise, civil war violence has disproportionally affected the long-run earnings of urban
people, as compared to those living in rural locations.

5
Fourth, there is substantial heterogeneity in the impacts of civil war on adult earnings,
depending on the type of civil war violence experienced early in life. Exposure to torture and
forced disappearances yields the strongest negative impacts; sexual violations disproportionally
affect the wages of women, while torture and forced disappearances disproportionally affect the
wages of men. Focusing only on the most common types of violence, deaths and abductions,
may underestimate the overall impact of civil war, as the psychological distress that attaches to
other types of violence may have stronger long-lasting human capital impacts. Fifth, the analysis
of the mechanisms connecting adult earnings and violence suggests that health, i.e., height, is the
most important intervening channel. One standard deviation increase in armed violence during
early childhood is significantly associated with one to two standard deviations lower height-for-
age z-scores. On the other hand, schooling attainment does not explain the negative relationship
between early-life exposure to civil war and adult earnings, as children are able to catch up over
time.
The remainder of the paper is organized as follows. In section 2, we provide a
background discussion about the Peruvian civil war. Section 3 describes the datasets and
provides some descriptive statistics. In section 4, we discuss the empirical strategy along with the
main results and sensitivity analyses. Section 5 addresses the study of violence on civil wars.
Section 6 discusses potential pathways. Finally, Section 7 concludes.
2. Civil War Violence in Peru
In the earliest months of 1980, Peru witnessed the emergence of one of the world‟s
deadliest terrorist groups, the Shining Path, a Maoist rebel group that was self-proclaimed as an
6
agent of a world history destined to conclude in a Communist Revolution3. The Shining Path
initiated its actions as a focalized regional political movement in the Southern countryside of
Peru by symbolically burning electoral ballots from the 1980 Presidential election in one of the
poorest localities of the country. Unlike many other conflicts, the civil war in Peru does not
follow the contest model‟s prediction in that armed conflicts flourish in resource rich regions
because of the existence of more rents to fight over (e.g., Le Billon 2005). On the contrary, it
follows Weinstein‟s (2006) typology of an „activist rebellion,‟ where grievance trumped greed,
participation was risky, short-term gains were unlikely, and highly-committed militants
resembled investors dedicated to the cause of the organization and willing to make risky
investments in return for the promise of future rewards (Weinstein 2006).
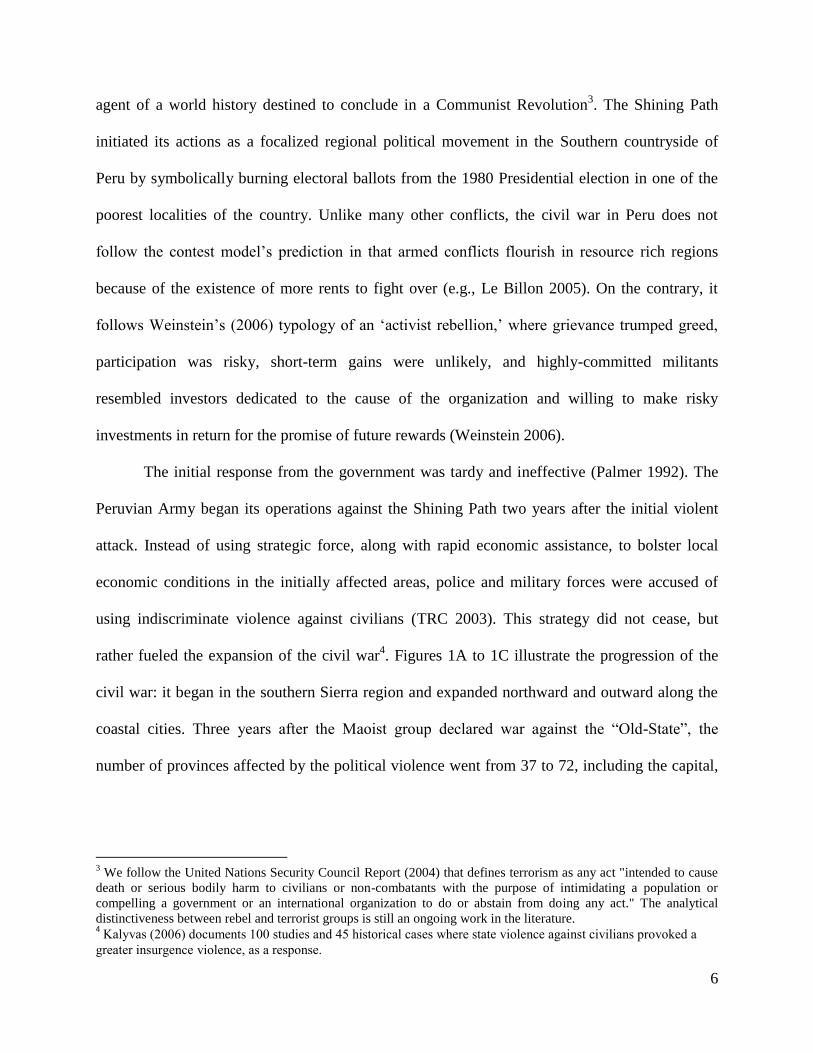
The initial response from the government was tardy and ineffective (Palmer 1992). The
Peruvian Army began its operations against the Shining Path two years after the initial violent
attack. Instead of using strategic force, along with rapid economic assistance, to bolster local
economic conditions in the initially affected areas, police and military forces were accused of
using indiscriminate violence against civilians (TRC 2003). This strategy did not cease, but
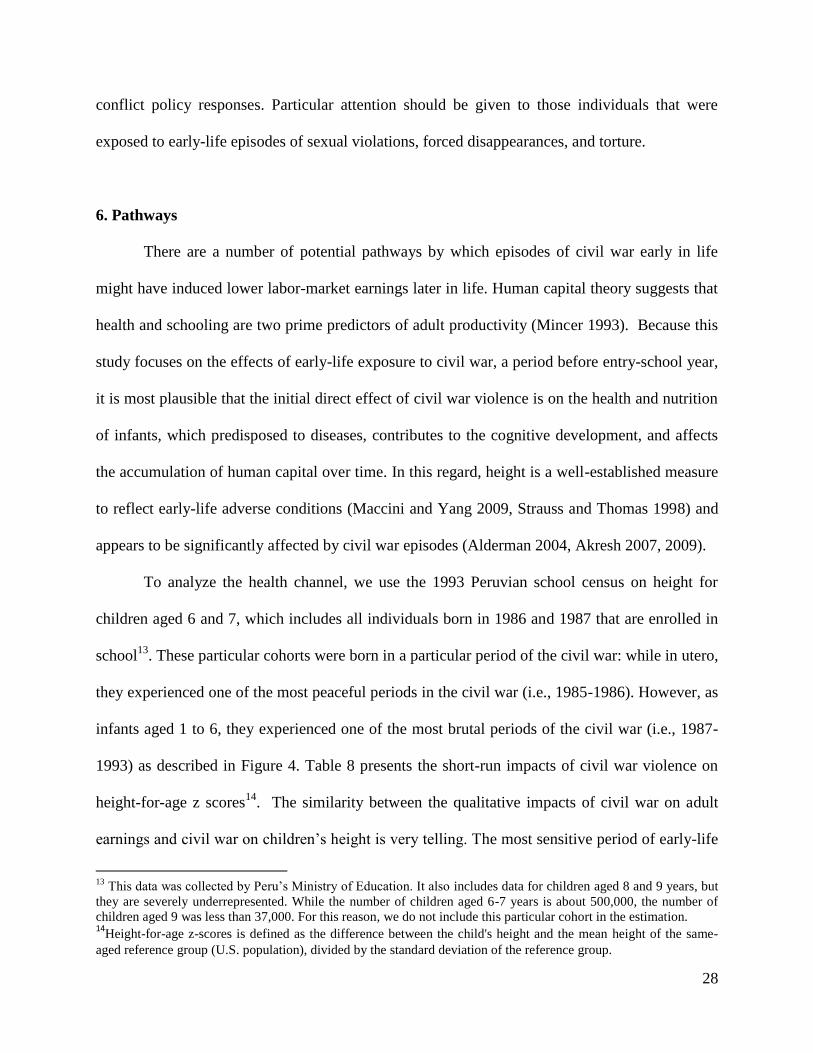
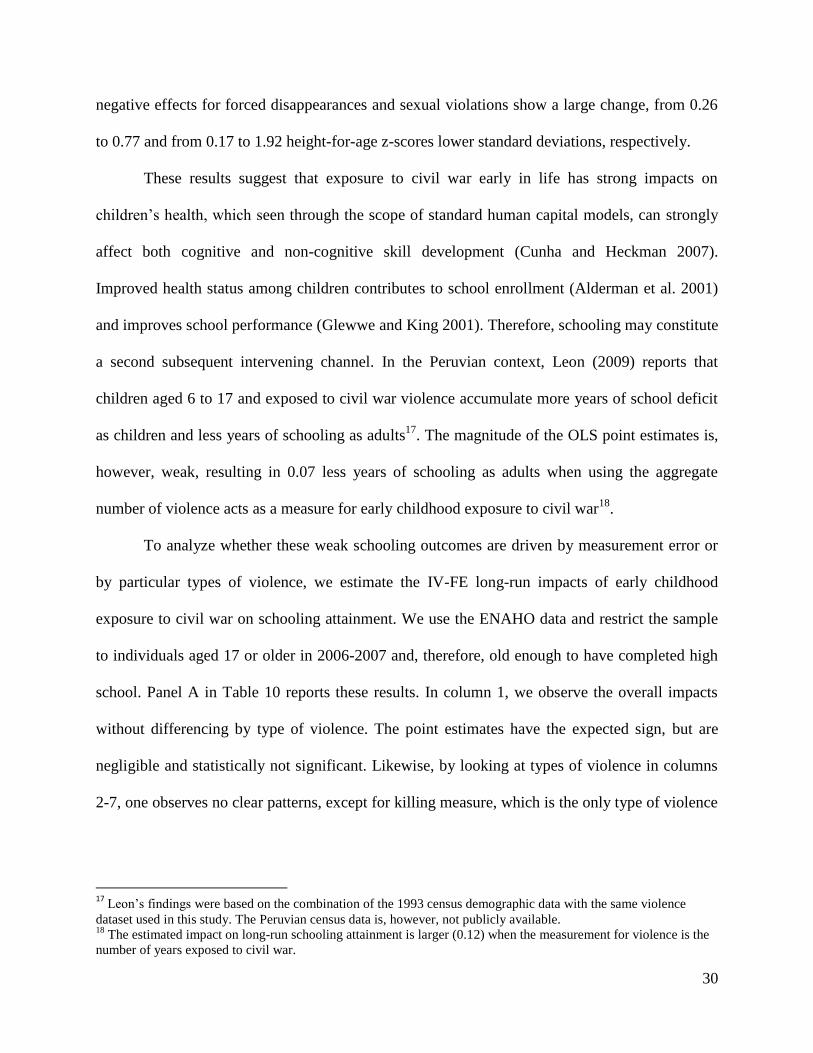
rather fueled the expansion of the civil war4. Figures 1A to 1C illustrate the progression of the
civil war: it began in the southern Sierra region and expanded northward and outward along the
coastal cities. Three years after the Maoist group declared war against the “Old-State”, the
number of provinces affected by the political violence went from 37 to 72, including the capital,
3 We follow the United Nations Security Council Report (2004) that defines terrorism as any act "intended to cause
death or serious bodily harm to civilians or non-combatants with the purpose of intimidating a population or
compelling a government or an international organization to do or abstain from doing any act." The analytical
distinctiveness between rebel and terrorist groups is still an ongoing work in the literature. 4 Kalyvas (2006) documents 100 studies and 45 historical cases where state violence against civilians provoked a
greater insurgence violence, as a response.

7
Lima. By 1986, the civil war expanded to the jungle regions, as 46 percent of the total number of
provinces was under the siege of political violence.
Beginning in August of 1987, the cycle of political violence worsened even more, when a
new group, The Revolutionary Movement Tupac Amaru, began a cycle of violence against the
government. Its actions were much less lethal than that of Shining Path, accounting for only 2
percent of the total number of killings and forced disappearances during the civil war period
(TRC 2003). By 1989, the civil war expanded in all directions, covering 61 percent of the
national territory. Finally, in 1995, almost 75 percent of the Peruvian provinces experienced the
burden of civil war violence.
The end of civil war occurred before 1995 when Shining Path‟s founder and messianic
leader, Abimael Guzman, was captured by a police intelligence operation. The Shining Path‟s
political and war machine collapse abruptly. The end of the civil war in Peru illustrates new
empirical evidence suggesting that insurgent leaders do matter (Guidolin and La Ferrara 2007).
Even though the Peruvian civil war seems to fit the „activist rebellion‟ typology
developed by Weinstein (2006), it does not follow its main prediction5. The Peruvian armed
conflict was marked by deliberate indiscriminate violence against civilians (TRC 2003). The
production of violence was provided by at least two competing parties, with the purpose of
matching their opponent‟s violence to create fear in civilians to cut the other parties access to
them. The number of serious violence acts, i.e., killings, forced disappearances, sexual
5The „activist rebellion type‟ predicts that movements that arise in resource-poor contexts perpetrate into low levels
of indiscriminate violence and employ violence selectively and strategically. On the other hand, the „opportunistic
rebellion type‟ predicts that civil wars emerging in rich natural resources areas tend to commit high levels of
indiscriminate violence (Weinstein 2006). It highlights the limitations of building unified conceptual categories to
describe diverse civil war movements. In this regard, we find useful the analytical boundaries of Kalyvas (2000),
who defined a typology of civil war based on the interaction of two key elements of violence: its purpose and its
production. According to this typology, the Peruvian armed conflict corresponds to „civil war violence‟.
8
violations, torture, forced recruitment, and abductions, climbed to over 36,000 violence events,
including more than 24,000 documented killings and forced disappearances (TRC 2003).
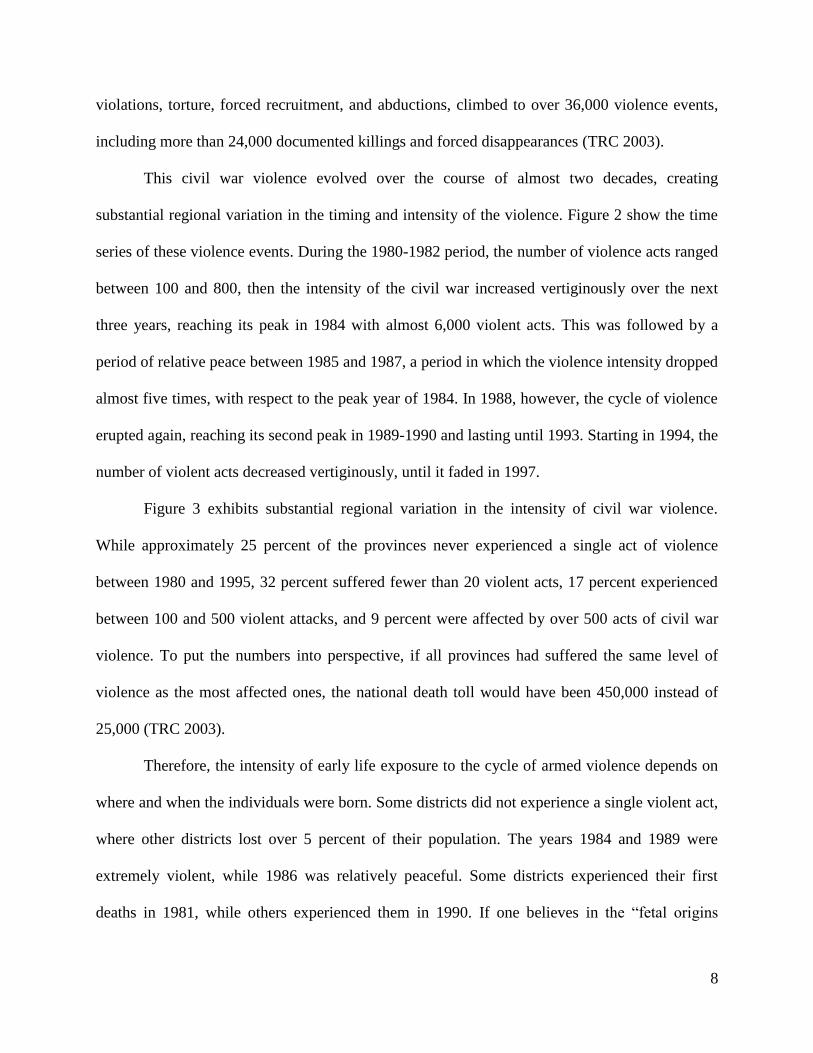
This civil war violence evolved over the course of almost two decades, creating
substantial regional variation in the timing and intensity of the violence. Figure 2 show the time
series of these violence events. During the 1980-1982 period, the number of violence acts ranged
between 100 and 800, then the intensity of the civil war increased vertiginously over the next
three years, reaching its peak in 1984 with almost 6,000 violent acts. This was followed by a
period of relative peace between 1985 and 1987, a period in which the violence intensity dropped
almost five times, with respect to the peak year of 1984. In 1988, however, the cycle of violence
erupted again, reaching its second peak in 1989-1990 and lasting until 1993. Starting in 1994, the
number of violent acts decreased vertiginously, until it faded in 1997.
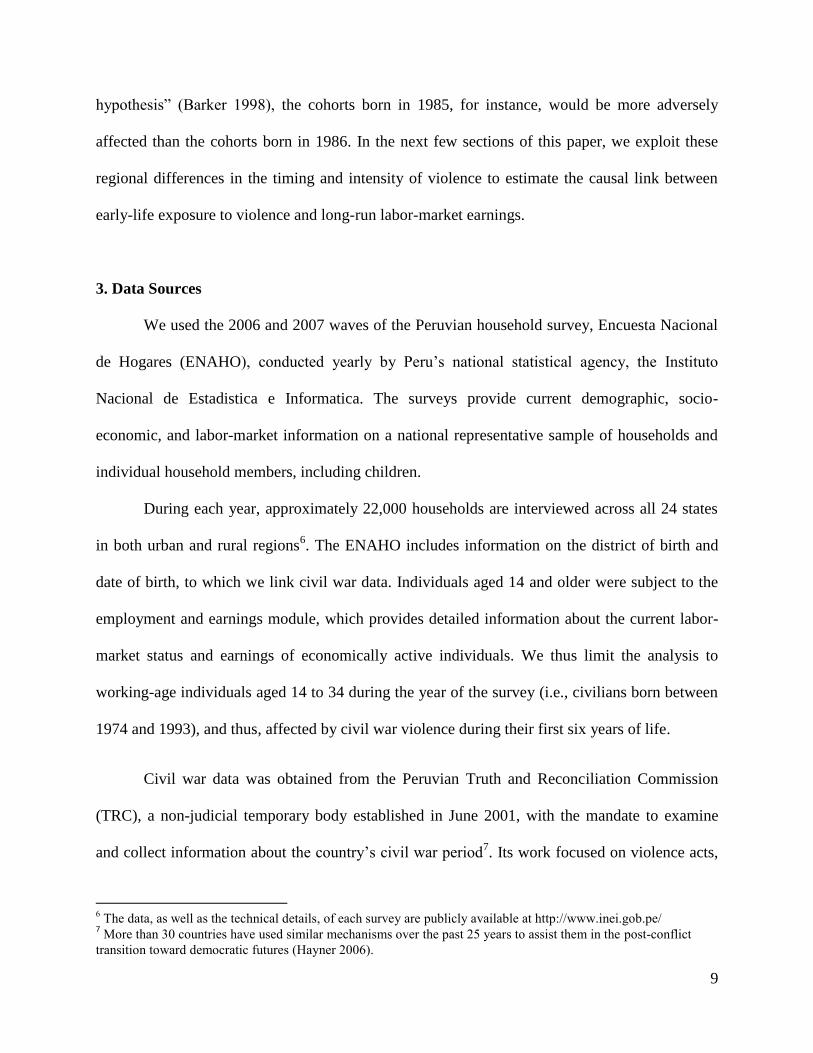
Figure 3 exhibits substantial regional variation in the intensity of civil war violence.
While approximately 25 percent of the provinces never experienced a single act of violence
between 1980 and 1995, 32 percent suffered fewer than 20 violent acts, 17 percent experienced
between 100 and 500 violent attacks, and 9 percent were affected by over 500 acts of civil war
violence. To put the numbers into perspective, if all provinces had suffered the same level of
violence as the most affected ones, the national death toll would have been 450,000 instead of
25,000 (TRC 2003).
Therefore, the intensity of early life exposure to the cycle of armed violence depends on
where and when the individuals were born. Some districts did not experience a single violent act,
where other districts lost over 5 percent of their population. The years 1984 and 1989 were
extremely violent, while 1986 was relatively peaceful. Some districts experienced their first
deaths in 1981, while others experienced them in 1990. If one believes in the “fetal origins
9
hypothesis” (Barker 1998), the cohorts born in 1985, for instance, would be more adversely
affected than the cohorts born in 1986. In the next few sections of this paper, we exploit these
regional differences in the timing and intensity of violence to estimate the causal link between
early-life exposure to violence and long-run labor-market earnings.
3. Data Sources
We used the 2006 and 2007 waves of the Peruvian household survey, Encuesta Nacional
de Hogares (ENAHO), conducted yearly by Peru‟s national statistical agency, the Instituto
Nacional de Estadistica e Informatica. The surveys provide current demographic, socio-
economic, and labor-market information on a national representative sample of households and
individual household members, including children.
During each year, approximately 22,000 households are interviewed across all 24 states
in both urban and rural regions6. The ENAHO includes information on the district of birth and
date of birth, to which we link civil war data. Individuals aged 14 and older were subject to the
employment and earnings module, which provides detailed information about the current labor-
market status and earnings of economically active individuals. We thus limit the analysis to
working-age individuals aged 14 to 34 during the year of the survey (i.e., civilians born between
1974 and 1993), and thus, affected by civil war violence during their first six years of life.
Civil war data was obtained from the Peruvian Truth and Reconciliation Commission
(TRC), a non-judicial temporary body established in June 2001, with the mandate to examine
and collect information about the country‟s civil war period7. Its work focused on violence acts,
6 The data, as well as the technical details, of each survey are publicly available at http://www.inei.gob.pe/
7 More than 30 countries have used similar mechanisms over the past 25 years to assist them in the post-conflict
transition toward democratic futures (Hayner 2006).

10
as long as they were imputable to terrorist organizations, state agents, or paramilitary groups
(Supreme Decrees No 065-2001 and 101-2001). The TRC work, formally concluded on 2003,
constitutes a “historical memory” that documents extensive, detailed information from victims,
survivors, and other witnesses.8
The violence data collected by the TRC comes from the reconstruction of violence acts
that took place in Peru between 1980 and 2000. Every single instance of civil war violence was
coded as an event in a given space and time and placed systematically within a sequence of
events. For each documented act of violence, there is information about the location, time,
victim, and perpetrator. Overall, more than 36,000 violence events were reported.
We link each individual in the ENAHO data to the violence data for their district-specific
birth year. For a given district in a given quarter, we define three explanatory variables: „fetal
exposure‟, defined as the sum of violent acts in the 4 quarters previous to the birth date; „early
childhood exposure,‟ defined as the sum of violent acts during the first 12 quarters of one‟s life
and; „pre-school exposure,‟ defined as the sum of violent acts between the 13 and 24 quarters of
one‟s life. We compute these variables in the TRC dataset and merge this information with each
birth-district/birth-date combination represented in the ENAHO sample.
Table 1 reports the summary statistics for the final matched sample. It is composed of
40,268 workers aged 14 to 34, after including non-remunerated family workers. The average
individual in our sample is 22.7 years old with 9.4 years of schooling, although there is large
schooling differences between urban (10.9) and rural (7.68) areas. Only 33.7 percent of the
sample is married, which is roughly the same across all subsamples. Almost half of the
individuals live in urban areas, where 10 percent do not speak Spanish as their first language.
This percentage increases to 40 percent in rural areas. The average per capita household income
8 The TRC’s final report is available at http://www.cverdad.org.pe/ingles/ifinal/index.php.

11
is three times higher in urban areas than in rural areas. The proportion of working men is higher
(55 percent), relative to that of women (45 percent). The mean monthly earnings are 277 soles
(or about US$ 100), after inputting zero earnings for non-remunerated family workers. Large
earnings gaps are observed between men and women and between urban and rural areas.
The second panel in Table 1 shows that the average individual in our sample was exposed
to two, seven and nine violence shocks while in utero, early childhood, and pre-school periods,
respectively. This distribution is primarily the same across all subsamples. One can also observe
the (unconditional) mean monthly earnings by the intensity of violence in the last panel. There is
a monotonic distribution for adult earnings and the intensity of violence when the violence
measure is the early childhood exposure across all subsamples. This pattern is less obvious when
considering fetal and pre-school violence measures.
4. Empirical Strategy and Results
4.1 Identification
The identification strategy relies on a difference–in-differences approach, where we test
whether children born in districts affected by armed violence have more adverse labor-market
earnings later in life, than their counterparts born before or after in the same district, relative to
those who are born in other regions of the country during the same year. The same strategy was
used in recent studies addressing the impact of civil war violence on schooling and health
(Akresh et al. 2006, 2009; Leon 2009; Chamarbagwala and Moran 2010; Shemyakina 2010).
We aim to advance on this literature by way of a systematic analysis of the intensity of
violence measures. To accomplish this, we first define the intensity of violence by deviations or
12
transitory components of armed violence from the mean for one‟s birth district. Mean district
violence for a particular individual is calculated over the violence period, and excludes the
violence experienced during the individual‟s birth period9. Measuring exposure to armed
violence simply by the level, or number, of violence acts may be dominated by district-specific
secular developments over time. This approach, pioneered by Bengtsson and Lindstrom (2000),
in their study about famine and mortality, has the advantage of separating transitory shocks from
secular trends in violent conditions within districts. At the individual level, transitory movements
in armed violence involve unexpected shocks.
Second, the potential effects of attenuation bias, due to measurement error, are
considered. While the work of the TRC constitutes the most comprehensive effort in the
reconstruction of the civil war in Peru up to date, it is not free of measurement error. Unreported
or undocumented violence acts, for instance, may cause the TRC‟s measurements to be only
imperfectly correlated with actual violence in the individuals‟ birth district. If this is the case, the
standard least squares estimates will be biased and attenuated toward zero (Wooldridge 2005).
Therefore, we instrument violence shocks with alternative measures of the same variable,
measures whose errors are likely to be orthogonal to the original, instrumented variable under the
assumptions of classical measurement error. A similar approach is used, for instance, in Maccini
and Yang (2009), when addressing measurement errors in rainfall variables.
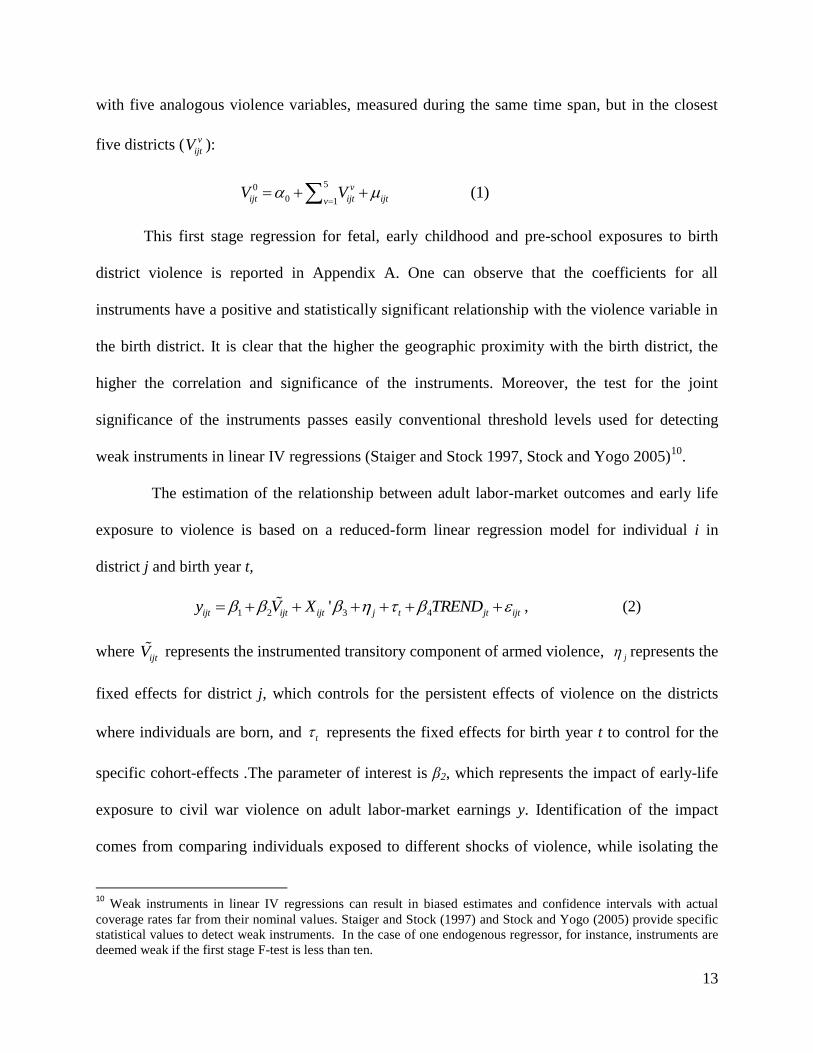
We implement a two-stage least squares model where, in the first step, the main regressor
( 0
ijtV ), the
transitory shocks of violence for individual i in district j born in time t, is instrumented
9 The mean early childhood exposure to violence is computed for two individuals born in the same district during the
quarters q and q+1, as the average of the number of violent acts in quarters {q+1,...,q+12} and {q+2,…,q+13}, respectively. This means that there is no full overlap in the mean violence of individuals born in adjacent quarters
and the differences increased over time. Thus, the overlap breaks completely for individuals born in quarter q and
q+13, q+1 and q+14, and so on. The same procedure is used when constructing fetal and pre-school transitory
measures of violence.
13
with five analogous violence variables, measured during the same time span, but in the closest
five districts ( v
ijtV ):
50
0 1 (1)v
ijt ijt ijtvV V
This first stage regression for fetal, early childhood and pre-school exposures to birth
district violence is reported in Appendix A. One can observe that the coefficients for all
instruments have a positive and statistically significant relationship with the violence variable in
the birth district. It is clear that the higher the geographic proximity with the birth district, the
higher the correlation and significance of the instruments. Moreover, the test for the joint
significance of the instruments passes easily conventional threshold levels used for detecting
weak instruments in linear IV regressions (Staiger and Stock 1997, Stock and Yogo 2005)10
.
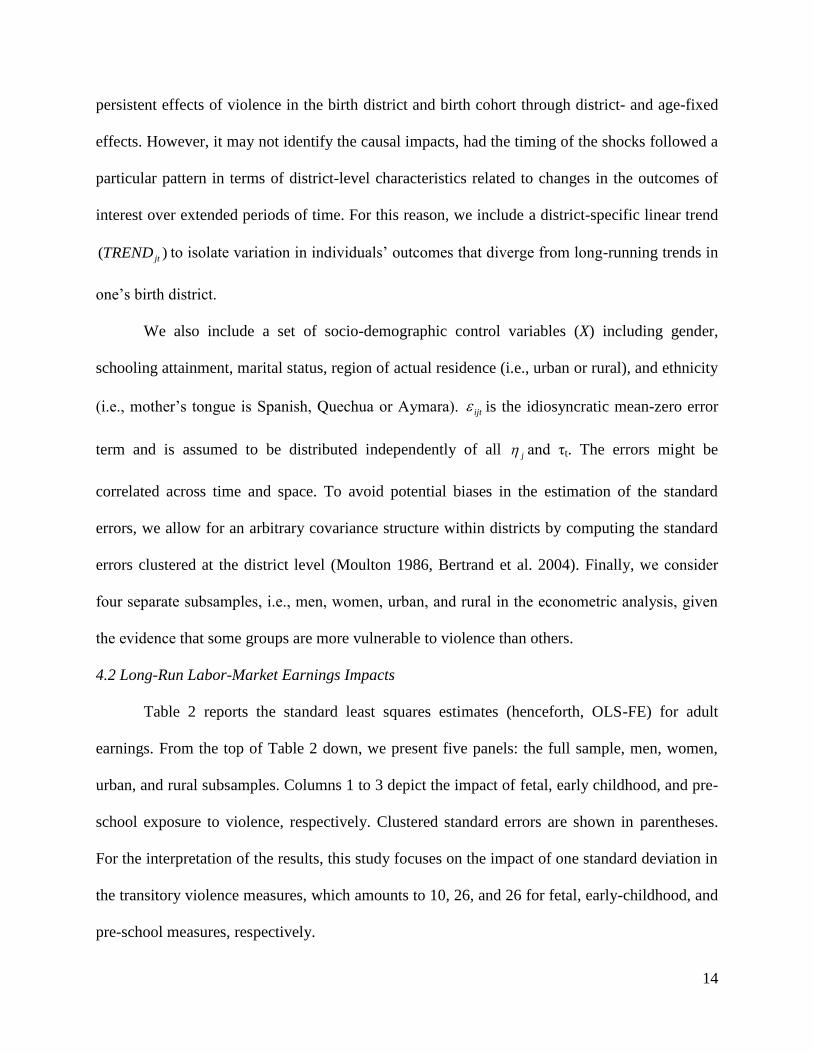
The estimation of the relationship between adult labor-market outcomes and early life
exposure to violence is based on a reduced-form linear regression model for individual i in
district j and birth year t,
1 2 3 4'ijt ijt ijt j t jt ijty V X TREND , (2)
where ijtV represents the instrumented transitory component of armed violence,
j represents the
fixed effects for district j, which controls for the persistent effects of violence on the districts
where individuals are born, and t represents the fixed effects for birth year t to control for the
specific cohort-effects .The parameter of interest is β2, which represents the impact of early-life
exposure to civil war violence on adult labor-market earnings y. Identification of the impact
comes from comparing individuals exposed to different shocks of violence, while isolating the
10
Weak instruments in linear IV regressions can result in biased estimates and confidence intervals with actual
coverage rates far from their nominal values. Staiger and Stock (1997) and Stock and Yogo (2005) provide specific
statistical values to detect weak instruments. In the case of one endogenous regressor, for instance, instruments are
deemed weak if the first stage F-test is less than ten.
14
persistent effects of violence in the birth district and birth cohort through district- and age-fixed
effects. However, it may not identify the causal impacts, had the timing of the shocks followed a
particular pattern in terms of district-level characteristics related to changes in the outcomes of
interest over extended periods of time. For this reason, we include a district-specific linear trend
( )jtTREND to isolate variation in individuals‟ outcomes that diverge from long-running trends in
one‟s birth district.
We also include a set of socio-demographic control variables (X) including gender,
schooling attainment, marital status, region of actual residence (i.e., urban or rural), and ethnicity
(i.e., mother‟s tongue is Spanish, Quechua or Aymara). ijt is the idiosyncratic mean-zero error
term and is assumed to be distributed independently of all j and τt. The errors might be
correlated across time and space. To avoid potential biases in the estimation of the standard
errors, we allow for an arbitrary covariance structure within districts by computing the standard
errors clustered at the district level (Moulton 1986, Bertrand et al. 2004). Finally, we consider
four separate subsamples, i.e., men, women, urban, and rural in the econometric analysis, given
the evidence that some groups are more vulnerable to violence than others.
4.2 Long-Run Labor-Market Earnings Impacts
Table 2 reports the standard least squares estimates (henceforth, OLS-FE) for adult
earnings. From the top of Table 2 down, we present five panels: the full sample, men, women,
urban, and rural subsamples. Columns 1 to 3 depict the impact of fetal, early childhood, and pre-
school exposure to violence, respectively. Clustered standard errors are shown in parentheses.
For the interpretation of the results, this study focuses on the impact of one standard deviation in
the transitory violence measures, which amounts to 10, 26, and 26 for fetal, early-childhood, and
pre-school measures, respectively.

15
The OLS-FE estimates show that the most sensitive period to early-life exposure to civil
war violence is the first 36 months of life. A one standard deviation increase in childhood
exposure to violence leads to a reduction of 7 soles in monthly earnings, which is equivalent to a
2.5 percent fall (relative to the mean earnings of individuals aged 14 to 34). This result is
statistically significant at the 1 percent level. At the same time, we find statistically insignificant
impacts for both fetal and pre-school violence exposure, with point estimates close to zero. This
result suggests that exposure to civil war while in utero or pre-school periods are less important
predictors of labor-market success, with respect to violence shocks occurring during the weaning
and post-weaning life periods. These results are consistent with the findings in Maccini and
Yang (2009) that document that childhood, rather than fetal exposure to environmental
conditions early in life, has the largest impacts on adult socioeconomic and health outcomes.
It is important to recognize, however, the potential role for the serial correlation of shocks
in explaining these results. It is possible that the significant effects we find for early childhood
exposure to violence reflects the correlation of violence measures across time. To address this
point, we include all fetal, early childhood, and pre-school violence measures in the same
regression. If the coefficients associated to early childhood change significantly, then there is
evidence of a serial correlation over time, which undermines the evidence that early childhood
exposure to armed violence matters per se. Column 4 shows the new point estimates. By looking
at the sign and magnitude of the estimates, one confirms that exposure to early childhood
violence significantly affects long-run labor-market earnings. The point estimates and
corresponding standard errors are pretty similar to those observed in column 2, suggesting that
early childhood exposure to violence shocks matters on its own.

16
Panels B and C report significant gender differences in the impacts of civil war on adult
earnings. Women are more adversely affected than men. A one standard deviation increase in
the intensity of violence in early childhood leads to a significant 4 percent reduction in monthly
earnings for women, while the magnitude of the impact on men is almost half and not
statistically significant. This result is consistent with several micro data analyses that illustrate a
disproportional impact of civil war violence on schooling and health for civilian women across
diverse geographical locations, including Asia (Shemyakina 2010), Africa (Akresh 2009), and
Latin America (Chamarbagwala and Moran 2010, Leon 2009). On the other hand, neither fetal,
nor pre-school, exposure to violence appears as relevant predictors for adult earnings.
Finally, Panels D and E show significant differences across urban and rural localities.
Exposure to civil war in early childhood disproportionally affects the long-run earnings of
civilians living in urban districts more than their rural counterparts. We provide three potential
explanations for this finding. First, it is possible that children that experience the worst types of
violence in rural areas migrated later to urban cities, where their parents feel relatively safer.
They may have “imported” long-lasting physiological and structural effects of environmental
conditions around birth to urban areas, which, along with their own difficulties, implies that the
displacement process may have worsened their human capital endowment over time. Second, the
likelihood of measurement error in the computation of civil war intensity may be greater in rural
than urban areas. Therefore, the OLS-FE estimates for rural areas may reflect higher attenuation
bias than the estimates for urban areas. The IV-FE estimates we present in Table 3 will shed
some light on this issue. Third, the outcome of interest (earnings) has a higher variance in urban
districts than rural ones; thus, the standard errors in the urban estimates are relatively larger.
This, in turn, reduces the statistical significance of the point estimates for rural areas.
17
Table 3 reports the instrumental variable estimates (henceforth IV-FE) following the
same logical arrangement as Table 2. Considering the measurement error in the violence data
yields almost a two-fold increase in the magnitude of the point estimates with respect to the
OLS-FE model, yielding an overall negative impact of about 4 percent in monthly adult earnings.
This finding reveals considerable attenuation bias in the estimation of long-run earnings impacts
when neglecting measurement error in the violence data. Moreover, the IV-FE estimates
illustrates significant negative earnings impacts associated with early childhood exposure to
civil war violence for all subsamples, including men and rural persons. The magnitude of the
point estimates reveal that a one standard deviation increase in early childhood exposure to civil
war is associated with a 6.5 and 2.7 percent fall in monthly earnings for women and men. These
results are statistically significant at the 1 and 5 percent level.
Likewise, the long-run earnings of both urban and rural people are significantly affected
by early childhood exposure to civil war, exposure that causes a 4 percent drop in monthly
earnings for both groups. This suggests that accounting for measurement error may be more
important for rural than urban areas. However, the statistical significance of the urban impacts is
stronger (1 percent level) than that of rural areas (10 percent level).
Overall, the qualitative findings from the standard least squares model holds after
accounting for the measurement error. In particular, the most sensitive period for early-life
exposure to the civil war is during the first 3 years of life. Neither fetal, nor pre-school, periods
appear as significant periods when estimating the impacts of violence on earnings later in life.
Moreover, early childhood exposure to armed violence matters in and of itself as the point
estimates do not change after simultaneously including all three measures of violence. Likewise,
18
women are disproportionally affected by civil war violence relative to men. The magnitude of
this difference reaches almost 4 percentage points.
4.3 A Specification Test
A potential econometric concern is that early childhood exposure to violence shocks
could be spuriously capturing the effect of unobservables correlated with idiosyncratic district-
level characteristics that, in turn, affect individuals‟ labor-market productivity. Because this
study focuses on the effects of early-life violence exposure following the extensive critical-
period programming theory, we use, as a specification test, the cohort of adult workers who were
exposed to civil war violence as adults but were old enough to have completed formal schooling,
(non) cognitive development, and health risk factors before the civil war begins. We focus then
on the cohort aged 17 and older in 1980. Thus, any significant long-run earnings impact for this
particular group may suggest that some (unobservable) factors unrelated to environmental
conditions around birth are also in play. If this is the case, the point estimates we reported in
Tables 2 and 3 could be also capturing the effect of those uncontrolled variables.
Table 4 reports the IV-FE estimates for individuals aged between 44 and 65 in 2007, i.e.,
civilians born between 1942 and 1964. The variable of interest, intensity of violence exposure, is
measured as the number of violence acts in one‟s birth district during the civil war period.
Clustered standard errors are shown in parenthesis. Columns 1 and 3 in Table 4 show small and
statistically not significant point estimates. This finding holds for all sub-samples and is not
driven by potential measurement error, as the estimates are based on the instrumental variables
approach model.

19
Unlike children exposed to violence around birth, adults are more mobile and can decide
to change their place of residence over time. Thus, one potential problem with these results is
that the violence measure may not reflect the actual exposure to violence for adult workers, as
they could have migrated across localities during the civil war period. Unfortunately, we cannot
observe the date of migration for each individual in the dataset, but we can identify whether
individuals have migrated or not. With this caveat in mind, we analyze the relationship between
migration status and civil war measures for adults aged 44 to 65. The results are reported in
columns 2 and 4 in Table 4. One can observe that there is no systematic statistical relationship
between migration and adult exposure to civil war after controlling for district fixed effects, birth
year fixed effects, and a district-specific linear trend. This finding holds for all subsamples11
.
The differentiate impact between early childhood and adult exposure to civil war suggests
that our results are not due to an omitted changing trend. Civil war could be spuriously capturing
the effect of unobservables if those uncontrolled variables are only correlated with early
childhood exposure to civil war, but not adult exposure.
4.4 More Sensitivity Tests
In this section, we use several alternative strategies to test the robustness of the impacts
of early childhood exposure to civil war on adult earnings. First, we add to the baseline
regressions a set of economic control variables. There is evidence that cyclical macroeconomic
conditions during childhood can have effects on household income and mortality rates later in
life (Van den Berg et al. 2006). In particular, we include two macro-economic indicators:
11 We also estimated violence impacts for the subsample of adult workers aged 44-65 who, in 2007, were still living
in the same localities that they were born. These unreported estimates do not change the picture a bit: the
coefficients for labor-market earnings are negligible and not statistically significant for all subsamples.
20
inflation and economic growth rates, indicators that illustrate a large variance during the period
of analysis.
Column 2 in Table 5 reports the IV-FE estimates for early childhood exposure to civil
war after including economic control variables. Column 1 shows the baseline results for
comparison purposes. The point estimates (and standard errors) for early childhood exposure to
civil war do not change with respect to their baseline estimates. All quantitative findings of this
study hold after including the macroeconomic covariates to our reduced-form model. It is clear
that by using a very fine level of variation, districts, and by including a district-specific time
trend, we adequately control other time varying factors that may be correlated with the civil war.
Second, the results for monthly earnings, so far, have been based on a sample of working
individuals that include non-remunerated family workers. By default, the labor-market earnings
of these individuals are inputted as zero. In column 3, we exclude non-remunerate family
workers from the analysis, so that the estimates can better reflect the workers‟ market value
productivity. One clear pattern emerges: the point estimates are significantly larger than the
baseline ones for all subsamples but men and remain statistically significant. Relative to the
mean earnings of remunerated workers, the magnitude of the estimates remain almost the same:
7 and 2 percent reduction in monthly earnings for women and men, and 4.8 and 3.4 percent
reduction for civilians living in urban and rural districts.
Third, it is important to consider the potential effects of districts that did not experience a
single act of political violence during the period under analysis. This may bias the results, as long
as these districts may present idiosyncratic differences with respect to the rest of the country. We
therefore exclude from the analysis districts that did not experience a single act of armed
21
violence during the civil war period. This approach allows us to exploit differences in the timing
and intensity of violence within districts that experienced armed violence. Column 4 in Table 5
reports the new point estimates for early childhood exposure to civil war. Once again, all
quantitative and qualitative findings hold. The main results do not change with all coefficient
estimates significant at similar levels.
Finally, we explore how sensitive our results are to migration status. We expected low
levels of migration (for children and their parents) around birth time. Yet, it is a possibility that
we should consider in our estimates. In column 5, we use a dummy variable as the dependent
variable, indicating whether a person migrated or not from her/his province of birth. The
coefficients are negligible and statistically insignificant. There appears to be no systematic effect
of early childhood exposure to armed violence on migration out of the province. This does not
mean that individuals do not migrate at all, as many families could have migrated out of their
localities over time.
5. Types of Civil War Violence
There is an analytical distinction between civil war and violence in civil wars. Violence
against (and between) civilians is implemented through different channels, with the purpose of
shaping individual behavior by attaching a cost to particular actions (Kalyvas 2006). For
instance, forced disappearances may have stronger psychological and mental impacts than the
number of deaths in combat, as it may prevent relatives of the disappeared persons from moving
on with their lives. Likewise, sexual violations can produce the highest levels of stress, fear, and
distrust in women. This distinction has largely been overlooked in the micro data analysis of civil
wars because of lack of information. Accounting for civil war violence is mostly based on
22
measures of a single specific measure of violence, including deaths (Chamarbagwala and Moran
2010) and abductions (Blattman and Annan 2009), length of exposure to civil war (Akresh et al.
2009, Leon 2009), and damage to household dwellings (Shemyakina 2010).
In this section, we introduce some conceptual distinctions in the rationale and purpose of
different types of violence exercised over the civilian population, with the aim of uncovering
evidence about the heterogeneity of civil war violence on long-run earnings. We focus on five
different types of violence: forced detentions and torture, forced disappearances, sexual
violations, abductions, and killings. The qualitative evidence collected from thousands of oral
testimonies by the TRC is illustrative on how these different types of violence have shaped
individuals fate (TRC 2003).
Torture is a term with conceptual autonomy and is typically synonymous with „torment‟.
Torture follows forced detentions. Its ultimate purpose depends on whether it is exercised by the
State, or the insurgents. In the former case, the fundamental purposes are to extract information,
force self-confessions and incentive denunciations of those individuals suspected of
collaborating with the insurgents. In the latter case, the essential purpose is the „exemplary
punishment‟ of civilians who are not collaborating enough with them or are collaborating too
much with the State. Shining Path, for instance, used the systematic torture of civilians in the so-
called “popular judgments”, in which the whole town, or village, was forced to observe the
torture of people so that civilians perceive themselves as potential future victims.
The systematic practice of forced disappearances is considered a crime against humanity
(United Nations 1992). The victims of such cases are commonly kidnapped, tortured, and then
killed; with the body disposed in such a way that no one can prove that the victim is actually
dead. It is often used as a tool to control and intimidate civilians through pure terror. It prevents

23
relatives of the victims from moving on with their lives, as the search for the bodies will become
a regular activity, an activity that directly impacts the household‟s welfare. The psychological
distress is overwhelmingly high, because of the uncertainty and the anxiety experienced,
particularly for children with parents that have disappeared (United Nations 1992). Currently,
Peru is one of the countries with the highest number of forced disappearances in the world
(United Nations 2002); 65 percent of the disappeared people are still missing (TRC 2003).
Sexual violation is a common source of violence particularly exerted particularly on
women in countries torn apart by civil wars. Effective violence requires control. Its purpose is
primarily to express power and dominance over the civilian population. Its aim is to punish,
shame, and coerce civilians who are suspected of collaborating with the other party. Sexual
violence has a profound impact on physical and mental health, with long-term consequences
(Swiss 1998). It may also affect the economic and social well-being of the victims and their
families, as stigmatization and isolation by the community (and their families) follow the act
itself (Mollica 1989).
Abductions are considered a war crime (International Criminal Court Statute, 1998). The
purpose of this type of violence is three-fold: as a source of economic income, as a control of the
civilian population, and as tool of political pressure. In the first case, the victims of abductions
are wealthy individuals who endure extreme living conditions while in captivity. This type of
violence „grease the wheel‟ of insurgencies, as the liberation will depend on ransom payments.
Abductions are also used by rebels to force poor young civilians to join the insurgency (Blattman
and Annan 2009). It directly affects the accumulation of human capital of the victims of these
actions. Finally, abductions are also used as a political and propaganda tool to pressure the
24
government and to impact public opinion. In Peru, 66 percent of abductions during the civil war
period were motivated by economic purposes (TRC 2003).
Killings, including mass murdering, are the epitome of civil war violence on civilians:
eight out of ten individuals killed in contemporary civil wars have been civilians (Kriger 1992).
Yet, it is difficult to isolate a unique purpose of killings and mass murdering, as they summarize
the intensity of civil war violence. In some cases, they are used as a signal to show strength and
determination; they are also used to cause extreme fear in the civilian population to cut one‟s
opponents access to civilians. Particularly important in the Latin America region were the
purpose of killings and the mass murdering of civilians to match the other party‟s violence.
Figure 4 shows the distribution of types of violence over time. Three patterns emerge.
Torture and killings are the most common types of violence in the Peruvian civil war, as they
represent 75 percent of all violent acts reported by the TRC. They are followed by forced
disappearances (11 percent) and abductions (12 percent). Sexual violations, on the other hand,
are the least common type of violence in Peru (less than 2 per cent), suggesting strong
measurement error from misreporting due to stigma. Second, all types of violence show the
same evolution over time, with three well-defined peaks in the cycle of violence: 1983-1984,
1989-1990, and 1992-1993. For instance, the number of killings in 1983 shows a six-fold
increase with respect to the previous year, an increase that is also observed across all types of
violence. Third, all types of violence declined abruptly beginning in 1993, one year after the
capture of Shining Path‟s leader Abimael Guzman.
To analyze the heterogeneous long-run impacts of types of civil war violence, we
implement the same reduced-form approach implemented in section 4. All the econometric
details hold, with the exception of defining violence measures separately, according to each
25
particular type of violence. Tables 6 and 7 report the OLS-FE and IV-FE estimates. In each table,
we present five top down panels: the full sample, men, women, urban, and rural sub-samples.
Each column shows the results for each type of violence estimated separately after including
violence measures for all three periods: fetal, early childhood, and pre-school ones.
Table 6 depicts consistent results with the main finding in the previous section: the most
sensitive period of early-life exposure to civil war is the first 36 months of life. This is common
across all violence measures, and therefore, it is not driven by a particular type of civil war
violence. Neither fetal, nor pre-school, periods show significant negative impacts on long-run
earnings. Overall, forced disappearances and torture show the strongest negative impacts on
earnings in the long-run. A one standard deviation increase in exposure to forced disappearances
(and torture) in early childhood leads to a reduction of 2.6 (and 1.9) percent of monthly earnings
later in life. Surprisingly, killings have fewer impacts on long-run earnings, as the magnitude of
the impacts is less than half of that for torture or forced disappearances12
.
When turning our attention to the gender dimension in Panels B and C, one observes that
diverse types of violence shape the fate of men and women differently. Sexual violations
disproportionally affect women, while torture and forced disappearances disproportionally affect
men. On average, a one standard deviation increase in sexual violations is associated with a
reduction of over 2.6 percent of monthly earnings for women, while exposure to forced
disappearances leads to a 1.8 percent reduction of monthly earnings for men. It is worth noticing
that all types of violence exposure in early childhood show statistically significant negative
effects for both women and men, something that we did not observe when analyzing the earnings
impacts for men when using aggregate measures of violence.
12
The standard deviations for transitory measures of violence are 5.95 for forced disappearances, 3.64 for killings,
3.37 for abductions, 2.54 for torture, and 0.45 for sexual violations.
26
Finally, when looking at Panels D and E, one observes strong heterogeneous impacts
between urban and rural areas. The results suggest that the disproportionally negative impact we
found in section 4 against individuals living in urban areas is not driven by a particular type of
violence, as the econometric analysis shows significant earnings impacts across all types of
violence. Within urban areas, forced disappearances (-2.0 percent), torture (-1.6 percent), and
sexual violations (-1.4 percent) are the types of violence with the largest negative impacts on
monthly earnings. In rural areas, torture (-2.1 percent) and abductions (-1.7 percent) yield the
largest violence impacts.
Table 7 shows the counterpart IV-FE estimates for types of violence. Similar to the
evidence presented in section 4 on aggregate measures of violence, the magnitude of the
estimates by type of violence is substantially larger than those emerging from standard OLS-FE
models. For example, the IV-FE estimates shows that a one standard deviation increase in forced
disappearances and torture leads to a 4.1 and 6.4 percent reduction in monthly earnings later in
life, respectively. These results illustrate the importance of considering attenuation bias in most
civil war datasets because of the intrinsic measurement difficulties in the computation of
violence in countries torn apart for civil wars.
Setting aside the magnitude of the estimates, all main qualitative findings emerging from
the standard least squares model holds after correcting for measurement error: torture and forced
disappearances yield the strongest negative impacts on earnings later in life; sexual violations
disproportionally affect the wages of women (-9.5 percent), while torture (-6.0 percent) and
forced disappearances (-2.6 percent) disproportionally affect the wages of men. Finally, the
wages of individuals living in urban districts were more affected than those of rural ones with
27
sexual violations (-5.2 percent), torture (-5.4 percent), and forced disappearances (-3.5 percent),
as the most sensitive types of violence for urban people.
Unlike the standard OLS estimates, however, the correction for measurement error causes
an increase in the standard errors, which, in turn, reduces the statistical significance of some
outcomes, particularly for abductions and killings. We did not observe this pattern when
correcting for the measurement error in the aggregate measure of violence in section 4. A closer
examination of the first stage regression shows a plausible explanation. The instruments are
relatively weaker when splitting the violence measures for type of violence. The statistical
significance of the instruments (as well as the F-test) is lower in this case, than when predicting
the aggregate measure of violence.
By combining Tables 6 and 7, some lessons emerge. First, the significant negative
impacts associated with early childhood exposure to civil war is not driven by measurement
error, or by a particular type of violence, as the findings are robust through different models and
types of violence. Second, there is substantial heterogeneity in the computation of adult earnings
impacts, depending on the type of civil war violence experienced in early life. Focusing only on
specific types of violence, mostly deaths and abductions, may underestimate the overall impact
of civil war on long-run labor-market outcomes as the psychological distress attaches to other
types of violence and, most importantly, the aggregate impact of all types of violence have
stronger human capital impacts later in life. Third, the disproportionally negative impacts on
individuals living in urban districts relative to rural ones are consistent across all types of
violence, which suggest that this finding is not forced by specific types of violence that could
have predominated in urban areas. Fourth, all these results point out policy implications for post-
28
conflict policy responses. Particular attention should be given to those individuals that were
exposed to early-life episodes of sexual violations, forced disappearances, and torture.
6. Pathways
There are a number of potential pathways by which episodes of civil war early in life
might have induced lower labor-market earnings later in life. Human capital theory suggests that
health and schooling are two prime predictors of adult productivity (Mincer 1993). Because this
study focuses on the effects of early-life exposure to civil war, a period before entry-school year,
it is most plausible that the initial direct effect of civil war violence is on the health and nutrition
of infants, which predisposed to diseases, contributes to the cognitive development, and affects
the accumulation of human capital over time. In this regard, height is a well-established measure
to reflect early-life adverse conditions (Maccini and Yang 2009, Strauss and Thomas 1998) and
appears to be significantly affected by civil war episodes (Alderman 2004, Akresh 2007, 2009).
To analyze the health channel, we use the 1993 Peruvian school census on height for
children aged 6 and 7, which includes all individuals born in 1986 and 1987 that are enrolled in
school13
. These particular cohorts were born in a particular period of the civil war: while in utero,
they experienced one of the most peaceful periods in the civil war (i.e., 1985-1986). However, as
infants aged 1 to 6, they experienced one of the most brutal periods of the civil war (i.e., 1987-
1993) as described in Figure 4. Table 8 presents the short-run impacts of civil war violence on
height-for-age z scores14
. The similarity between the qualitative impacts of civil war on adult
earnings and civil war on children‟s height is very telling. The most sensitive period of early-life
13
This data was collected by Peru‟s Ministry of Education. It also includes data for children aged 8 and 9 years, but
they are severely underrepresented. While the number of children aged 6-7 years is about 500,000, the number of
children aged 9 was less than 37,000. For this reason, we do not include this particular cohort in the estimation. 14
Height-for-age z-scores is defined as the difference between the child's height and the mean height of the same-
aged reference group (U.S. population), divided by the standard deviation of the reference group.

29
exposure to civil war on height is during the first 36 months of life. Neither fetal, nor pre-school,
periods are negatively related to children‟s height. One standard deviation increase in armed
violence during early childhood is significantly associated with 0.35 (OLS-FE) and 2.0 (IV-FE)
standard deviations lower height-for-age z-scores15
. Likewise, the height of girls is
disproportionally affected by civil war relative to that of boys. The point estimates show 0.38
and 0.28 standard deviations lower height-for-age z-scores for girls and boys in the OLS-FE
model; while these scores reach 2.60 and 1.36 standard deviations in the IV-FE model.
Furthermore, the height of children living in urban districts is also disproportionally affected,
relative to rural ones, with the magnitude of these differences closely resembling the gender gap.
Table 9 shows the short-run height estimates by types of violence. Once again, the
similarity of the civil war impacts on adult earnings and children‟s height is worth noticing. By
looking at the standard OLS estimates, one observes that forced disappearances, torture, and
sexual violations appear to be the most hurtful type of civil war violence on civilians, yielding
0.26, 0.22, and 0.17 height-for-age z-scores lower standard deviations, respectively16
. Moreover,
sexual violations disproportionally affect the height of girls (0.23 standard deviations), while
torture (0.28) and forced disappearances (0.26) disproportionally affect the height of boys.
Furthermore, children living in urban areas were most affected by forced disappearances (0.43)
and torture (0.26), while those in rural districts were disproportionally affected by torture (0.21).
Accounting for measurement error does not change any of the qualitative results, except
that the increase in the size of the standard errors leads to a loss in statistical significance for
torture and killing violence measures, as shown in Panel B. The magnitude of the point estimates
suggests, once again, a strong attenuation bias for the standard linear model as the overall
15
The standard deviation is 11.5 for the transitory measure of early childhood violence for this particular cohort. 16
The standard deviations for the transitory measures of violence for this particular cohort are 0.29, 2.59, 0.80, 0.92,
and 1.76 for sexual violations, forced disappearances, abductions, killings, and torture, respectively.
30
negative effects for forced disappearances and sexual violations show a large change, from 0.26
to 0.77 and from 0.17 to 1.92 height-for-age z-scores lower standard deviations, respectively.
These results suggest that exposure to civil war early in life has strong impacts on
children‟s health, which seen through the scope of standard human capital models, can strongly
affect both cognitive and non-cognitive skill development (Cunha and Heckman 2007).
Improved health status among children contributes to school enrollment (Alderman et al. 2001)
and improves school performance (Glewwe and King 2001). Therefore, schooling may constitute
a second subsequent intervening channel. In the Peruvian context, Leon (2009) reports that
children aged 6 to 17 and exposed to civil war violence accumulate more years of school deficit
as children and less years of schooling as adults17
. The magnitude of the OLS point estimates is,
however, weak, resulting in 0.07 less years of schooling as adults when using the aggregate
number of violence acts as a measure for early childhood exposure to civil war18
.
To analyze whether these weak schooling outcomes are driven by measurement error or
by particular types of violence, we estimate the IV-FE long-run impacts of early childhood
exposure to civil war on schooling attainment. We use the ENAHO data and restrict the sample
to individuals aged 17 or older in 2006-2007 and, therefore, old enough to have completed high
school. Panel A in Table 10 reports these results. In column 1, we observe the overall impacts
without differencing by type of violence. The point estimates have the expected sign, but are
negligible and statistically not significant. Likewise, by looking at types of violence in columns
2-7, one observes no clear patterns, except for killing measure, which is the only type of violence
17
Leon‟s findings were based on the combination of the 1993 census demographic data with the same violence
dataset used in this study. The Peruvian census data is, however, not publicly available. 18
The estimated impact on long-run schooling attainment is larger (0.12) when the measurement for violence is the
number of years exposed to civil war.

31
that shows negative and statistically significant results, ranging from 0.015 to 0.052 less years of
schooling for one standard deviation increase in the exposure to killings.
Overall, the magnitude of the schooling estimates is weak and consistent with Leon‟s
(2009) findings. This robust pattern suggests that, in the long-run, years of schooling is not a
significant channel to explain the negative relationship between early-life exposure to civil war
and adult earnings as children are able to catch up. However, there is large evidence of the
negative relationship between household welfare and the quality of the education received in
Peru (Valdivia 1997). As the civil war intensified poverty and inequality, families and
communities lost property, and military spending crowded-out necessary public investment in
education, the quality of schooling received for those most affected would be negatively
affected. We cannot test directly this „quality‟ channel, which constitutes a topic of interest for
future research. We can, however, indirectly address this issue by examining the impact of early-
life exposure to civil war on long-run household wealth.
Therefore, we constructed a wealth index that uses, as inputs, household assets including
characteristics of the household‟s dwelling collected in the ENAHO dataset. By aggregating over
ten household assets through factor analytic methods, this index represents a proxy for long-run
economic status, rather than a measure of current welfare or poverty (Filmer and Pritchett 2001).
Panel B in Table 10 reports the estimates using the same IV-FE empirical approach as before.
The magnitude of the estimated coefficient is small, but statistically significant: a one standard
deviation increase in early childhood exposure to civil war is associated with a 0.08 lower asset
index later in life for women and urban people. Consistent with our previous findings, forced
disappearances, sexual violations, and torture yield the largest impacts on household wealth,
while abductions and killings show the lesser impacts.

32
All being told, these results provide suggestive evidence that health is the most important
intervening pathway between early childhood exposure to civil war violence and adult earnings.
It is not trivial that the TRC placed post-conflict health-related problems on Peru‟s national
agenda. One of the final recommendations of the TRC was the establishment of health
reparations, after uncovering direct evidence from almost 17,000 people about a host of
psychosomatic problems, including chronic depression, generalized anxiousness, and stress
(TRC 2003)
7. Conclusions
Using detailed information about the timing and location of armed violence in Peru along
with nationally representative household surveys collected in 2006 and 2007, this study shows a
significant effect of early childhood exposure to armed violence on labor-market earnings later in
life. On average, and keeping everything else constant, a one standard deviation increase in
violence leads to a 4 percent decrease in adult earnings. This negative effect has
disproportionally affected women and individuals living in urban areas and is robust to a variety
of sensitivity checks and econometric details. On the other hand, we did not find any significant
effect of either fetus or pre-school exposure to armed violence on adult earnings. Of particular
importance is the large difference in the magnitude of the estimates between the standard linear
and instrumental variables approach models, which may suggests a strong attenuation bias in
studies that do not address issues of measurement error in violence datasets.
The analytical distinction between civil war and violence in civil wars (Kalyvas 2000),
largely overlooked in the micro data analysis of civil wars, proves to be useful in uncovering
substantial heterogeneity of civil war impacts on civilians‟ outcomes. Forced disappearances and

33
torture yields the strongest negative impacts on earnings later in life; sexual violations
disproportionally affect the wages of women, while torture and forced disappearances
disproportionally affect the wages of men. Finally, the wages of individuals living in urban
districts were more affected than that of people in rural areas with sexual violations, torture, and
forced disappearances as the most sensitive types of violence for urban people.
The analysis of pathways connecting adult earnings and early-life exposure to violence
suggests that the most plausible explanation lies in infant health, due to long-lasting
physiological and structural effects, as well as through household wealth restrictions. In
particular, the strong similarity in the qualitative findings about the relationship between civil
war and adult earnings and civil war and children‟s height is very telling. On the contrary, the
weak and not significant impact of the civil war on long-run schooling attainment suggests that
children were able to catch up over time.
These findings imply that, from a policy standpoint, it is particularly useful to focus on
children aged zero to three living in regions affected by civil war episodes. Their long-run
productivity may be significantly increased if their conditions are improved, for example, by way
of food, shelter, and health care provisions. Understanding the heterogeneity of civil war impacts
is also important in the design of appropriate post-conflict policy responses, including the
targeting of individuals or groups that were disproportionally affected by an armed conflict. For
instance, the current heated debate on policy and political circles in Peru about the exact number
of murdered people during the civil conflict is of second order importance to improving the
conditions of individuals that were affected by particular types of violence, including forced
disappearances, torture, and sexual violations.

34
References
Abadie and Gardeazabal (2003). “The Economic Costs of Conflict: A Case Study of the Basque
Country,” American Economic Review 93(1), 112-132
Akresh, R, and D. de Walque. (2009).”Armed Conflict and Schooling: Evidence from the 1994
Rwandan Genocide,” Review of Economics and Statistics, Forthcoming.
Akresh, R., T.Bundervoet and P.Verwimp. (2009) “Health and Civil War in Burundi.” Journal of
Human Resources, 44(2): 536-563.
Alderman, H. and J. Behrman. (2006). “Reducing the Incidence of Low Birth Weight in Low-
Income Countries Has Substantial Economic Benefits,” World Bank Research Observer,
21(1):25-48.
Alderman, H., J.Hoddinott and B.Kinsey. (2006). “Long Term Consequences of Early Childhood
Malnutrition,” Oxford Economic Papers, 58(3): 450-474.
Almond, D. (2006). “Is the 1918 Influenza Pandemic Over? Long-term Effects of In Utero
Influenza Exposure in the Post-1940 U.S. Population.” Journal of Political Economy,
114: 672-712.
Angrist, J. (1990). “Lifetime Earnings and the Vietnam Era Draft Lottery: Evidence from Social
Security Administrative Records.” American Economic Review, 80(3), 313-36.
Barker, D. (1998). Mothers, Babies, and Health in Later Life. Edinburgh, U.K.: Churchill
Livingstone.
Behrman, J. and M. Rosenzweig (2004). “Returns to Birthweight.” Review of Economics and
Statistics, 86 (2): 586-601.
Blattman, C. and J.Annan (2007). “The Consequences of Child Soldiering.” Review of
Economics and Statistics. Forthcoming.
Blattman, C. and E. Miguel. (2009). “Civil War” Journal of Economic Literature, Forthcoming.
Camacho, A. (2009). “Stress and Birth Weight: Evidence from Terrorist Attacks”. American
Economic Review: Papers & Proceedings. 98(2), 511-515.
Chamarbagwala R., and H. Moran (2010). “The Human Capital Consequences of Civil War:
Evidence from Guatemala,” Journal of Development Economics. Forthcoming.
Collier, Paul, and A. Hoeffler. (1998) “On Economic Causes of Civil War” Oxford Economic
Papers, 50(4), 563-573.
Comisión de la Verdad y Reconciliación (2003). Informe Final.
Filmer, D, and L. Prichett. (2001). “Estimating Wealth Effects Without Expenditure of Data - Or
Tears: An Application to Enrollments in States of India”. Demography.
Glewwe, P., and E. King (2001). “The Impact of Early Childhood Nutrition and Academic
Achievement: Does the Timing of Malnutrition Matter?” World Bank Economic Review,
15(1): 81-114.
Gorriti G. (1999). “The Shining Path: A History of the Millenarian War in Peru”
Guidolin M., and E. La Ferrara. (2007),”Diamonds are Forever, Wars are Not: Is Conflict Bad
for Private Firms”, American Economic Review 97:1978-93.
Hearst, N., T. Newman and S. Hulley. (1986). “Delayed effects of the military draft on mortality.
A randomized natural experiment.” New England Journal of Medicine, 314(10): 620-24.
Humphreys M., and J. Weinstein (2007), “Demobilization and Reintegration”, Journal of
Conflict Resolution, 51:4, 531-567
Justino P., and P. Verwimp, (2006). “Poverty Dynamics, Violent Conflict and Convergence in
Rwanda”, HCN WP16.
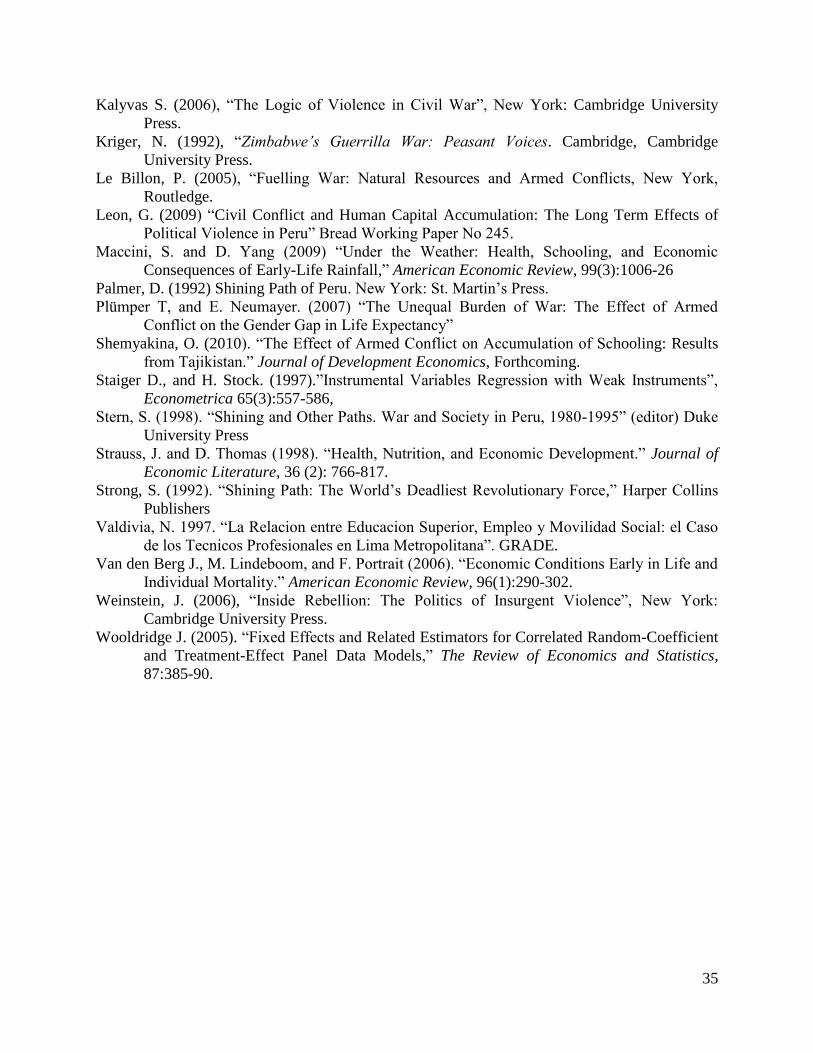
35
Kalyvas S. (2006), “The Logic of Violence in Civil War”, New York: Cambridge University
Press.
Kriger, N. (1992), “Zimbabwe’s Guerrilla War: Peasant Voices. Cambridge, Cambridge
University Press.
Le Billon, P. (2005), “Fuelling War: Natural Resources and Armed Conflicts, New York,
Routledge.
Leon, G. (2009) “Civil Conflict and Human Capital Accumulation: The Long Term Effects of
Political Violence in Peru” Bread Working Paper No 245.
Maccini, S. and D. Yang (2009) “Under the Weather: Health, Schooling, and Economic
Consequences of Early-Life Rainfall,” American Economic Review, 99(3):1006-26
Palmer, D. (1992) Shining Path of Peru. New York: St. Martin‟s Press.
Plümper T, and E. Neumayer. (2007) “The Unequal Burden of War: The Effect of Armed
Conflict on the Gender Gap in Life Expectancy”
Shemyakina, O. (2010). “The Effect of Armed Conflict on Accumulation of Schooling: Results
from Tajikistan.” Journal of Development Economics, Forthcoming.
Staiger D., and H. Stock. (1997).”Instrumental Variables Regression with Weak Instruments”,
Econometrica 65(3):557-586,
Stern, S. (1998). “Shining and Other Paths. War and Society in Peru, 1980-1995” (editor) Duke
University Press
Strauss, J. and D. Thomas (1998). “Health, Nutrition, and Economic Development.” Journal of
Economic Literature, 36 (2): 766-817.
Strong, S. (1992). “Shining Path: The World‟s Deadliest Revolutionary Force,” Harper Collins
Publishers
Valdivia, N. 1997. “La Relacion entre Educacion Superior, Empleo y Movilidad Social: el Caso
de los Tecnicos Profesionales en Lima Metropolitana”. GRADE.
Van den Berg J., M. Lindeboom, and F. Portrait (2006). “Economic Conditions Early in Life and
Individual Mortality.” American Economic Review, 96(1):290-302.
Weinstein, J. (2006), “Inside Rebellion: The Politics of Insurgent Violence”, New York:
Cambridge University Press.
Wooldridge J. (2005). “Fixed Effects and Related Estimators for Correlated Random-Coefficient
and Treatment-Effect Panel Data Models,” The Review of Economics and Statistics,
87:385-90.

36
Violence in birth district on violence measures at the closest 5 districts
neighbor 1 neighbor 2 neighbor 3 neighbor 4 neighbor 5
0.382 0.477 0.226 0.202 0.108
(0.007)*** (0.008)*** (0.009)*** (0.008)*** (0.006)***
F-test 3469
R2
0.30
neighbor 1 neighbor 2 neighbor 3 neighbor 4 neighbor 5
0.561 0.541 0.238 0.111 0.074
(0.007)*** (0.009)*** (0.009)*** (0.008)*** (0.006)***
F-test 4496
R2
0.36
neighbor 1 neighbor 2 neighbor 3 neighbor 4 neighbor 5
0.373 0.770 0.216 0.085 0.151
(0.006)*** (0.010)*** (0.009)*** (0.008)*** (0.006)***
F-test 4526
R2
0.36
Notes: Standard errors in parenthesis. Estimation includes individuals aged 14 to 34 in the
2006-2007 ENAHO data.
Violence measures come from the Peruvian Truth and Reconciliation Commission (TRC)
The intensity of violence is defined by deviations or transitory components of armed violence
from the mean of one's birth district. Mean district violence is calculated over the violence period
and excludes the violence experienced in the individual's birth period.
*** Statistically significant at the 1 percent level.
Appendix A: First-Stage Least Squared Estimates
Panel A: Fetal Exposure to Civil War
Panel B: Early Childhood Exposure to Civil War
Panel C: Pre-School Exposure to Civil War
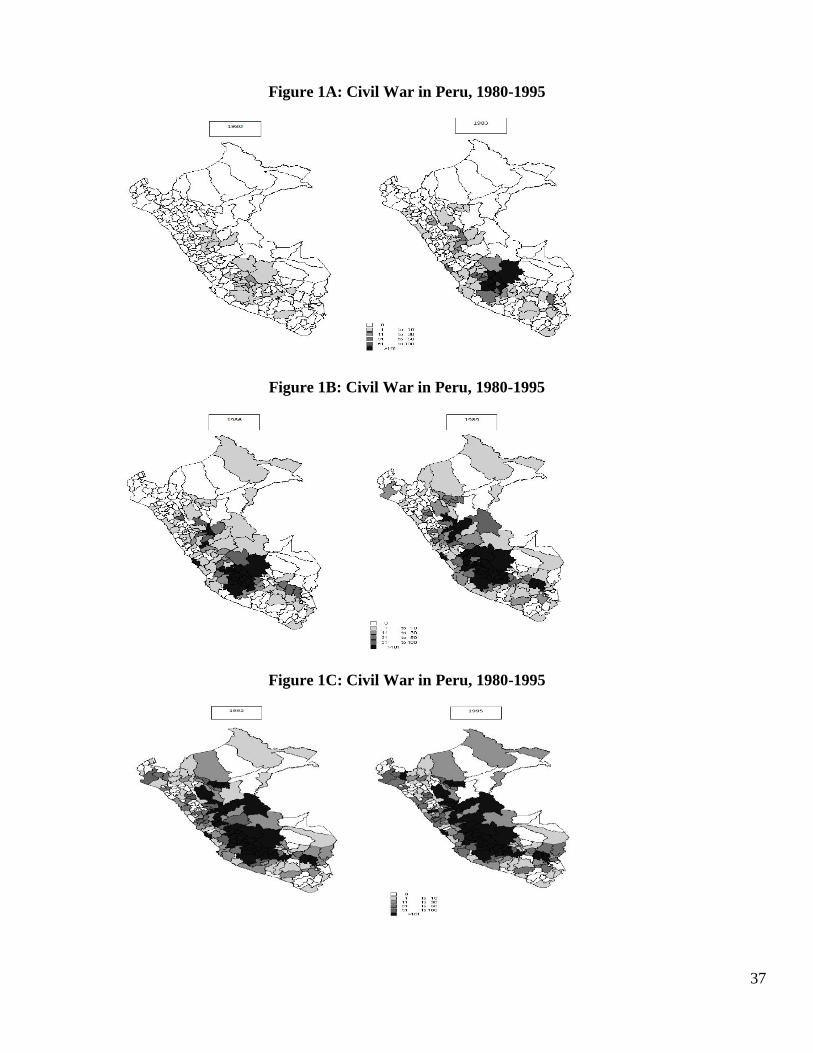
37
Figure 1A: Civil War in Peru, 1980-1995
Figure 1B: Civil War in Peru, 1980-1995
Figure 1C: Civil War in Peru, 1980-1995
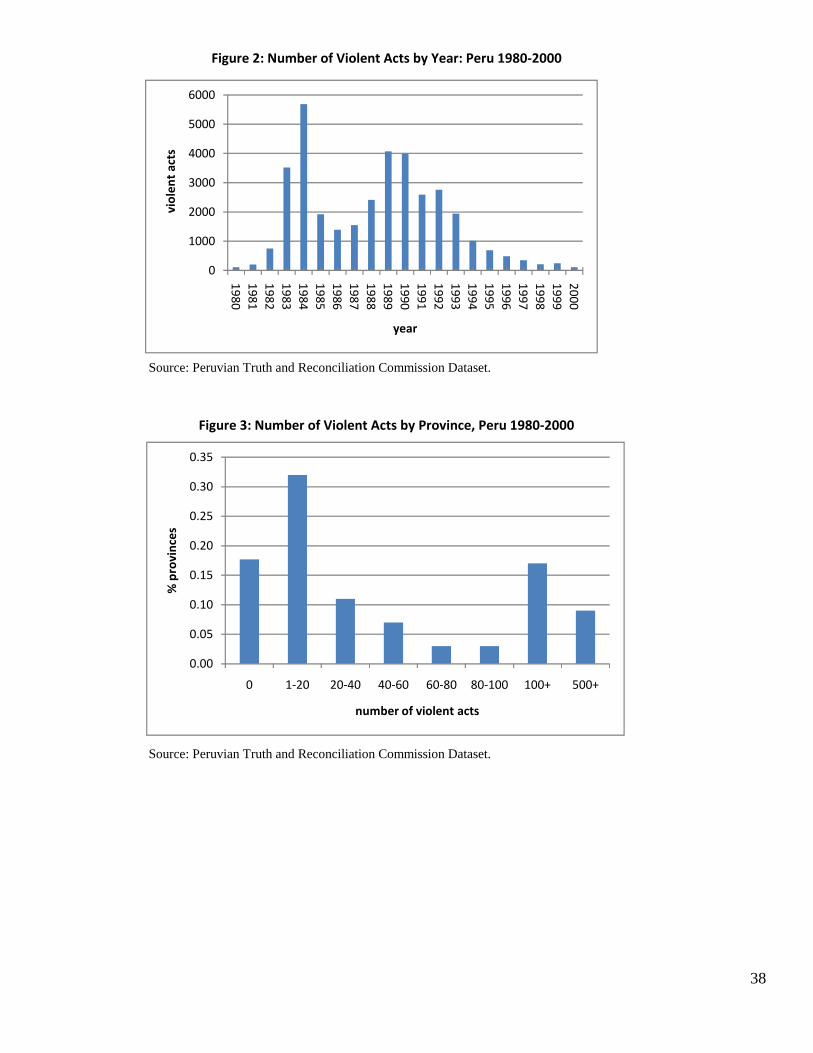
38
Source: Peruvian Truth and Reconciliation Commission Dataset.
Source: Peruvian Truth and Reconciliation Commission Dataset.
Figure 2: Number of Violent Acts by Year: Peru 1980-2000
Figure 3: Number of Violent Acts by Province, Peru 1980-2000
0
1000
2000
3000
4000
5000
6000
19
80
19
81
19
82
19
83
19
84
19
85
19
86
19
87
19
88
19
89
19
90
19
91
19
92
19
93
19
94
19
95
19
96
19
97
19
98
19
99
20
00
vio
len
t ac
ts
year
0.00
0.05
0.10
0.15
0.20
0.25
0.30
0.35
0 1-20 20-40 40-60 60-80 80-100 100+ 500+
% p
rovi
nce
s
number of violent acts

39
Source: Peruvian Truth and Reconciliation Commission Dataset.
Figure 4: Types of Violence by Year: Peru 1980-2000
0
500
1000
1500
2000
19
80
19
81
19
82
19
83
19
84
19
85
19
86
19
87
19
88
19
89
19
90
19
91
19
92
19
93
19
94
19
95
19
96
19
97
19
98
19
99
20
00
vio
len
t ac
ts
year
abduction
torture
killings
desappearences
sexual viol.
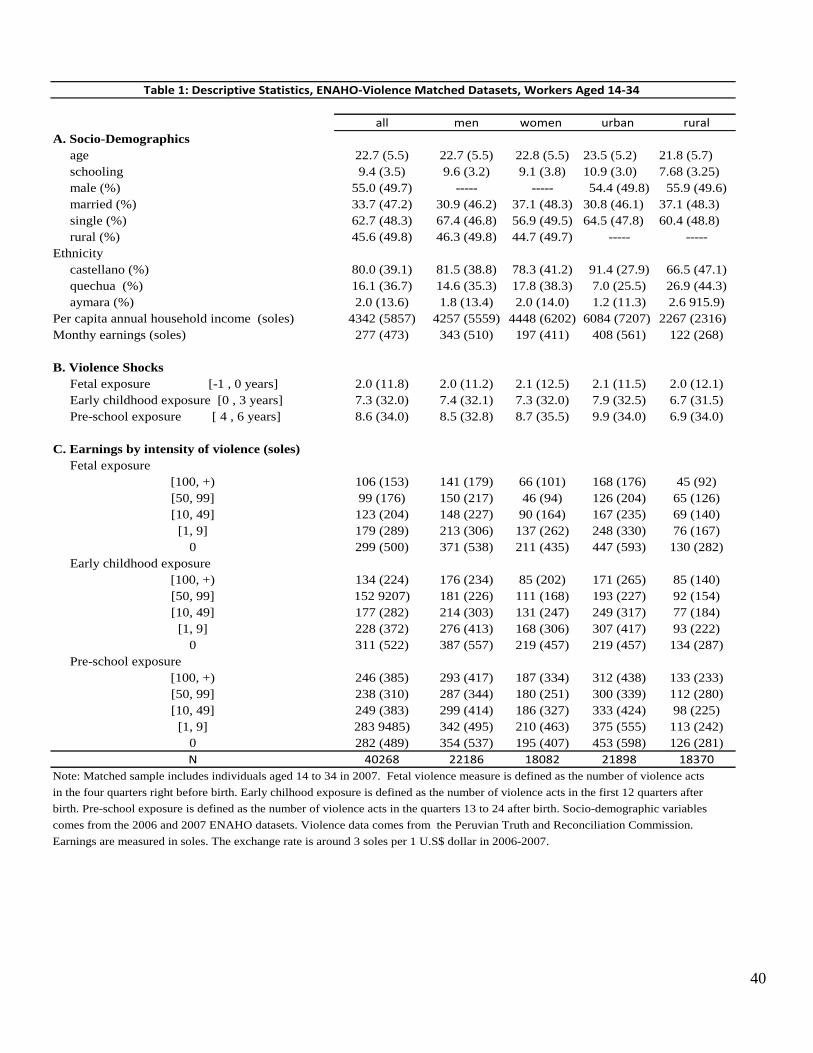
40
all men women urban rural
A. Socio-Demographics
age 22.7 (5.5) 22.7 (5.5) 22.8 (5.5) 23.5 (5.2) 21.8 (5.7)
schooling 9.4 (3.5) 9.6 (3.2) 9.1 (3.8) 10.9 (3.0) 7.68 (3.25)
male (%) 55.0 (49.7) ----- ----- 54.4 (49.8) 55.9 (49.6)
married (%) 33.7 (47.2) 30.9 (46.2) 37.1 (48.3) 30.8 (46.1) 37.1 (48.3)
single (%) 62.7 (48.3) 67.4 (46.8) 56.9 (49.5) 64.5 (47.8) 60.4 (48.8)
rural (%) 45.6 (49.8) 46.3 (49.8) 44.7 (49.7) ----- -----
Ethnicity
castellano (%) 80.0 (39.1) 81.5 (38.8) 78.3 (41.2) 91.4 (27.9) 66.5 (47.1)
quechua (%) 16.1 (36.7) 14.6 (35.3) 17.8 (38.3) 7.0 (25.5) 26.9 (44.3)
aymara (%) 2.0 (13.6) 1.8 (13.4) 2.0 (14.0) 1.2 (11.3) 2.6 915.9)
Per capita annual household income (soles) 4342 (5857) 4257 (5559) 4448 (6202) 6084 (7207) 2267 (2316)
Monthy earnings (soles) 277 (473) 343 (510) 197 (411) 408 (561) 122 (268)
B. Violence Shocks
Fetal exposure [-1 , 0 years] 2.0 (11.8) 2.0 (11.2) 2.1 (12.5) 2.1 (11.5) 2.0 (12.1)
Early childhood exposure [0 , 3 years] 7.3 (32.0) 7.4 (32.1) 7.3 (32.0) 7.9 (32.5) 6.7 (31.5)
Pre-school exposure [ 4 , 6 years] 8.6 (34.0) 8.5 (32.8) 8.7 (35.5) 9.9 (34.0) 6.9 (34.0)
C. Earnings by intensity of violence (soles)
Fetal exposure
[100, +) 106 (153) 141 (179) 66 (101) 168 (176) 45 (92)
[50, 99] 99 (176) 150 (217) 46 (94) 126 (204) 65 (126)
[10, 49] 123 (204) 148 (227) 90 (164) 167 (235) 69 (140)
[1, 9] 179 (289) 213 (306) 137 (262) 248 (330) 76 (167)
0 299 (500) 371 (538) 211 (435) 447 (593) 130 (282)
Early childhood exposure
[100, +) 134 (224) 176 (234) 85 (202) 171 (265) 85 (140)
[50, 99] 152 9207) 181 (226) 111 (168) 193 (227) 92 (154)
[10, 49] 177 (282) 214 (303) 131 (247) 249 (317) 77 (184)
[1, 9] 228 (372) 276 (413) 168 (306) 307 (417) 93 (222)
0 311 (522) 387 (557) 219 (457) 219 (457) 134 (287)
Pre-school exposure
[100, +) 246 (385) 293 (417) 187 (334) 312 (438) 133 (233)
[50, 99] 238 (310) 287 (344) 180 (251) 300 (339) 112 (280)
[10, 49] 249 (383) 299 (414) 186 (327) 333 (424) 98 (225)
[1, 9] 283 9485) 342 (495) 210 (463) 375 (555) 113 (242)
0 282 (489) 354 (537) 195 (407) 453 (598) 126 (281)
N 40268 22186 18082 21898 18370
Note: Matched sample includes individuals aged 14 to 34 in 2007. Fetal violence measure is defined as the number of violence acts
in the four quarters right before birth. Early chilhood exposure is defined as the number of violence acts in the first 12 quarters after
birth. Pre-school exposure is defined as the number of violence acts in the quarters 13 to 24 after birth. Socio-demographic variables
Table 1: Descriptive Statistics, ENAHO-Violence Matched Datasets, Workers Aged 14-34
comes from the 2006 and 2007 ENAHO datasets. Violence data comes from the Peruvian Truth and Reconciliation Commission.
Earnings are measured in soles. The exchange rate is around 3 soles per 1 U.S$ dollar in 2006-2007.

41
(1) (2) (3) (4)
fetal exposure [-1,0] -0.100 ----- ----- 0.074
(0.188) ----- ----- (0.130)
early childhood [0-3] ----- -0.267 ----- -0.276
----- (0.105)*** ----- (0.093)***
pre-school [4-6] ----- ----- 0.008 0.009
----- ----- (0.054) (0.051)
n=40268, R2
=0.33
fetal exposure [-1,0] -0.024 ----- ----- 0.083
(0.299) ----- ----- (0.227)
early childhood [0-3] ----- -0.208 ----- -0.219
----- (0.158) ----- (0.142)
pre-school [4-6] ----- ----- -0.067 -0.069
----- ----- (0.069) (0.073)
n=22186 , R2
=0.36
fetal exposure [-1,0] -0.212 ----- ----- 0.057
(0.158) ----- ----- (0.131)
early childhood [0-3] ----- -0.303 ----- -0.308
----- (0.096)*** ----- (0.093)***
pre-school [4-6] ----- ----- 0.121 0.120
----- ----- (0.086) (0.084)
n=18082, R2
=0.33
fetal exposure [-1,0] -0.014 ----- ----- 0.258
(0.269) ----- ----- (0.252)
early childhood [0-3] ----- -0.357 ----- -0.378
----- (0.105)*** ----- (0.088)***
pre-school [4-6] ----- ----- 0.125 0.110
----- ----- (0.061)* (0.062)*
n=21898, R2
=0.29
fetal exposure [-1,0] -0.088 ----- ----- -0.015
(0.135) ----- ----- (0.113)
early childhood [0-3] ----- -0.123 ----- -0.122
----- (0.084) ----- (0.082)
pre-school [4-6] ----- ----- 0.019 0.019
----- ----- (0.072) (0.075)
n=18370, R2
=0.36
Notes: Standard errors clustered by district of birth in parenthesis. In addition to district fixed effects,
birth year fixed effect, and district-specific linear trends, OLS regressions include gender, schooling,
sex, rural/urban indicator, and ethnicity. Estimation is based on individuals aged 14 to 34 in the 2006-2007
ENAHO data. The intensity of violence is defined by deviations or transitory components of armed
violence from the mean for one's birth district. Mean district violence is calculated over the violence
period and excludes the violence experienced in the individual's birth period.
*** Statistically significant at the 1 percent level; ** Statistically significant at the 5 percent level
* Statistically significant at the 10 percent level.
Panel B: Men
Panel C: Women
Panel D: Urban
Panel E: Rural
Table 2: OLS-FE estimates of early-life exposure to civil war on long-run earnings
Panel A: All sample

42
(1) (2) (3) (4)
fetal exposure [-1,0] -0.126 ----- ----- 0.097
(0.232) ----- ----- (0.190)
early childhood [0-3] ----- -0.427 ----- -0.429
----- (0.141)*** ----- (0.140)***
pre-school [4-6] ----- ----- -0.231 -0.214
----- ----- (0.127)* (0.132)
n=40246, R2
=0.33
fetal exposure [-1,0] -0.021 ----- ----- 0.131
(0.370) ----- ----- (0.320)
early childhood [0-3] ----- -0.343 ----- -0.355
----- (0.176)* ----- (0.169)**
pre-school [4-6] ----- ----- -0.172 -0.168
----- ----- (0.179) (0.176)
n=22171 , R2
=0.36
fetal exposure [-1,0] -0.380 ----- ----- -0.091
(0.274) ----- ----- (0.268)
early childhood [0-3] ----- -0.515 ----- -0.493
----- (0.171)*** ----- (0.178)***
pre-school [4-6] ----- ----- -0.188 -0.171
----- ----- (0.226) (0.236)
n=18075, R2
=0.33
fetal exposure [-1,0] -0.466 ----- ----- -0.081
(0.434) ----- ----- (0.421)
early childhood [0-3] ----- -0.687 ----- -0.677
----- (0.200)*** ----- (0.194)***
pre-school [4-6] ----- ----- 0.077 0.042
----- ----- (0.220) (0.227)
n=21894, R2
=0.29
fetal exposure [-1,0] 0.040 ----- ----- 0.127
(0.218) ----- ----- (0.244)
early childhood [0-3] ----- -0.191 ----- -0.194
----- (0.101)* ----- (0.105)*
pre-school [4-6] ----- ----- -0.152 -0.134
----- ----- (0.116) (0.121)
n=18352, R2
=0.36
Notes: Standard errors clustered by district of birth in parenthesis. In addition to district fixed effects,
birth year fixed effect, and district-specific linear trends, regressions include gender, schooling,
sex, rural/urban indicator, and ethnicity. Estimation is based on individuals aged 14 to 34 in the 2006-2007
ENAHO data. The intensity of violence is defined by deviations or transitory components of armed
violence from the mean for one's birth district. Mean district violence is calculated over the violence
period and excludes the violence experienced in the individual's birth period. Violence in individual's
birth district is istrumented with violence shocks measured at the closest 5 districts to respondent's birth place.
*** Statistically significant at the 1 percent level; **Statistically significant at the 5 percent level;
* Statistically significant at the 10 percent level.
Panel B: Men
Panel C: Women
Panel D: Urban
Panel E: Rural
Table 3: IV-FE estimates of early life exposure to civil war on long-run earnings
Panel A: All sample

43
earnings migration earnings migration
0.063 -0.0003 0.016 -0.0004
(0.377) (0.0003) (0.242) (0.0003)
N 14184 14184 11758 11758
R2
0.22 0.35 0.49 0.36
earnings migration earnings migration
0.347 -0.0002 -0.142 -0.0003
(0.408) (0.0003) (0.201) (0.0003)
N 14842 14842 11100 11100
R2
0.28 0.36 0.16 0.39
Notes: Standard errors clustered by district of birth in parenthesis. In addition to district fixed effects, birth
year fixed effect, and district-specific linear trends, regressions include gender, schooling, sex, rural/urban
indicator, and ethnicity. Estimation is based on individuals aged 44 to 65 in 2006-2007 ENAHO data.
The intensity of violence is defined by deviations or transitory components of armed violence
from the mean for one's birth district. Mean district violence is calculated over the violence period and
excludes the violence experienced in the individual's birth period.
Violence in individual's birth district is istrumented with violence shocks measured at the closest 5 districts
to respondent's birth place
*** Statistically significant at the 1 percent level;
** Statistically significant at the 5 level;
* Statistically significant at the 10 percent level.
Table 4: Significance Test
IV-FE Impacts of Civil War on Long-Run Earnings of Adults, Aged 44-65
Panel A: Men Panel B: Women
Panel B: Urban Panel D: Rural

44
(1) (2) (3) (4) (5) (1) (2) (3) (4) (5)
early childhood civil war on earnings -0.343 -0.343 -0.353 -0.307 ---- -0.515 -0.515 -0.987 -0.506 ----
(0.176)* (0.177)* (0.184)* (0.173)* ---- (0.171)*** (0.171)***(0.281)***(0.167)*** ----
early childhood civil war on migration ---- ---- ---- ----- 0.000027 ----- ----- ----- ----- 0.000139
(0.000248) (0.000270)
N 22171 22171 16366 15692 22171 18075 18075 10095 12750 18075
R2
0.36 0.36 0.32 0.33 0.30 0.33 0.33 0.33 0.30 0.32
(1) (2) (3) (4) (5) (1) (2) (3) (4) (5)
early childhood civil war on earnings -0.687 -0.687 -0.953 -0.652 ---- -0.191 -0.191 -0.325 -0.183 ----
(0.200)*** (0.201)***(0.290)***(0.195)*** ---- (0.101)* (0.102)* (0.174)* (0.105)* ----
early childhood civil war on migration ---- ---- ---- ----- -0.000102 ---- ---- ---- ----- 0.000121
(0.000250) (0.000158)
N 21894 21894 17455 17731 21894 18352 18352 9007 10711 18352
R2
0.29 0.29 0.33 0.27 0.39 0.36 0.36 0.32 0.34 0.41
birth FE yes yes yes yes yes yes yes yes yes yes
district FE yes yes yes yes yes yes yes yes yes yes
district linear trend yes yes yes yes yes yes yes yes yes yes
macroeconomic covariates no yes no no no no yes no no no
excluding non-remunerated family workers no no yes no no no no yes no no
excluding districts with no armed violence no no no yes no no no no yes no
Notes: Standard errors clustered by district of birth in parenthesis. In addition to district fixed effects, birth year fixed effects, and district-specific linear trends, regressions include
gender, schooling, sex, rural/urban indicator and ethnicity controls. The estimation includes individuals aged 14 to 34 in 2006-2007 ENAHO data.
The intensity of violence is defined by deviations or transitory components of armed violence from the mean for one's birth district. Mean district violence is calculated
over the violence period and excludes the violence experienced in the individual's birth period.
Violence in individual's birth district is istrumented with violence shocks measured at the closest 5 districts to respondent's birth place.
*** Statistically significant at the 1 percent level;
** Statistically significant at the 5 level;
* Statistically significant at the 10 percent level.
Table 5: Sensitivity Tests, IV-FE Esimates
Early Childhood Exposure to Civil War on Long-Run Labor-Market Earnings
Men Women
Urban Rural
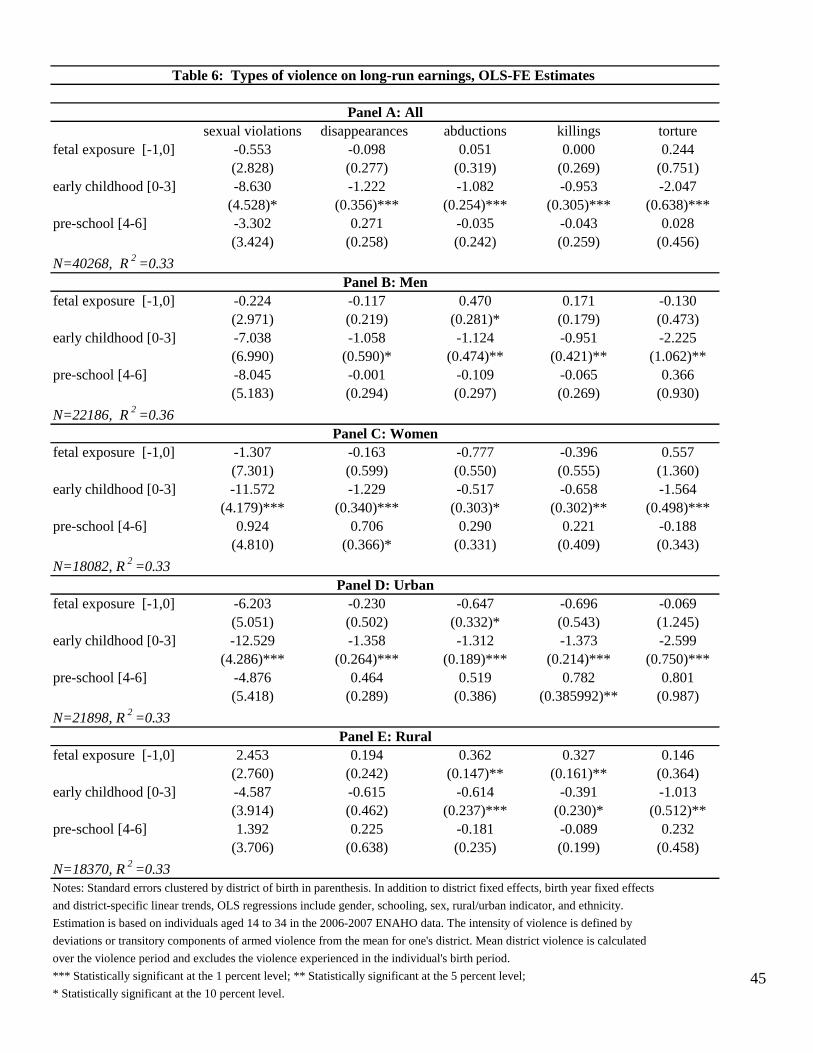
45
sexual violations disappearances abductions killings torture
fetal exposure [-1,0] -0.553 -0.098 0.051 0.000 0.244
(2.828) (0.277) (0.319) (0.269) (0.751)
early childhood [0-3] -8.630 -1.222 -1.082 -0.953 -2.047
(4.528)* (0.356)*** (0.254)*** (0.305)*** (0.638)***
pre-school [4-6] -3.302 0.271 -0.035 -0.043 0.028
(3.424) (0.258) (0.242) (0.259) (0.456)
N=40268, R2
=0.33
fetal exposure [-1,0] -0.224 -0.117 0.470 0.171 -0.130
(2.971) (0.219) (0.281)* (0.179) (0.473)
early childhood [0-3] -7.038 -1.058 -1.124 -0.951 -2.225
(6.990) (0.590)* (0.474)** (0.421)** (1.062)**
pre-school [4-6] -8.045 -0.001 -0.109 -0.065 0.366
(5.183) (0.294) (0.297) (0.269) (0.930)
N=22186, R2
=0.36
fetal exposure [-1,0] -1.307 -0.163 -0.777 -0.396 0.557
(7.301) (0.599) (0.550) (0.555) (1.360)
early childhood [0-3] -11.572 -1.229 -0.517 -0.658 -1.564
(4.179)*** (0.340)*** (0.303)* (0.302)** (0.498)***
pre-school [4-6] 0.924 0.706 0.290 0.221 -0.188
(4.810) (0.366)* (0.331) (0.409) (0.343)
N=18082, R2
=0.33
fetal exposure [-1,0] -6.203 -0.230 -0.647 -0.696 -0.069
(5.051) (0.502) (0.332)* (0.543) (1.245)
early childhood [0-3] -12.529 -1.358 -1.312 -1.373 -2.599
(4.286)*** (0.264)*** (0.189)*** (0.214)*** (0.750)***
pre-school [4-6] -4.876 0.464 0.519 0.782 0.801
(5.418) (0.289) (0.386) (0.385992)** (0.987)
N=21898, R2
=0.33
fetal exposure [-1,0] 2.453 0.194 0.362 0.327 0.146
(2.760) (0.242) (0.147)** (0.161)** (0.364)
early childhood [0-3] -4.587 -0.615 -0.614 -0.391 -1.013
(3.914) (0.462) (0.237)*** (0.230)* (0.512)**
pre-school [4-6] 1.392 0.225 -0.181 -0.089 0.232
(3.706) (0.638) (0.235) (0.199) (0.458)
N=18370, R2
=0.33
Notes: Standard errors clustered by district of birth in parenthesis. In addition to district fixed effects, birth year fixed effects
and district-specific linear trends, OLS regressions include gender, schooling, sex, rural/urban indicator, and ethnicity.
Estimation is based on individuals aged 14 to 34 in the 2006-2007 ENAHO data. The intensity of violence is defined by
deviations or transitory components of armed violence from the mean for one's district. Mean district violence is calculated
over the violence period and excludes the violence experienced in the individual's birth period.
*** Statistically significant at the 1 percent level; ** Statistically significant at the 5 percent level;
* Statistically significant at the 10 percent level.
Table 6: Types of violence on long-run earnings, OLS-FE Estimates
Panel A: All
Panel D: Urban
Panel E: Rural
Panel C: Women
Panel B: Men
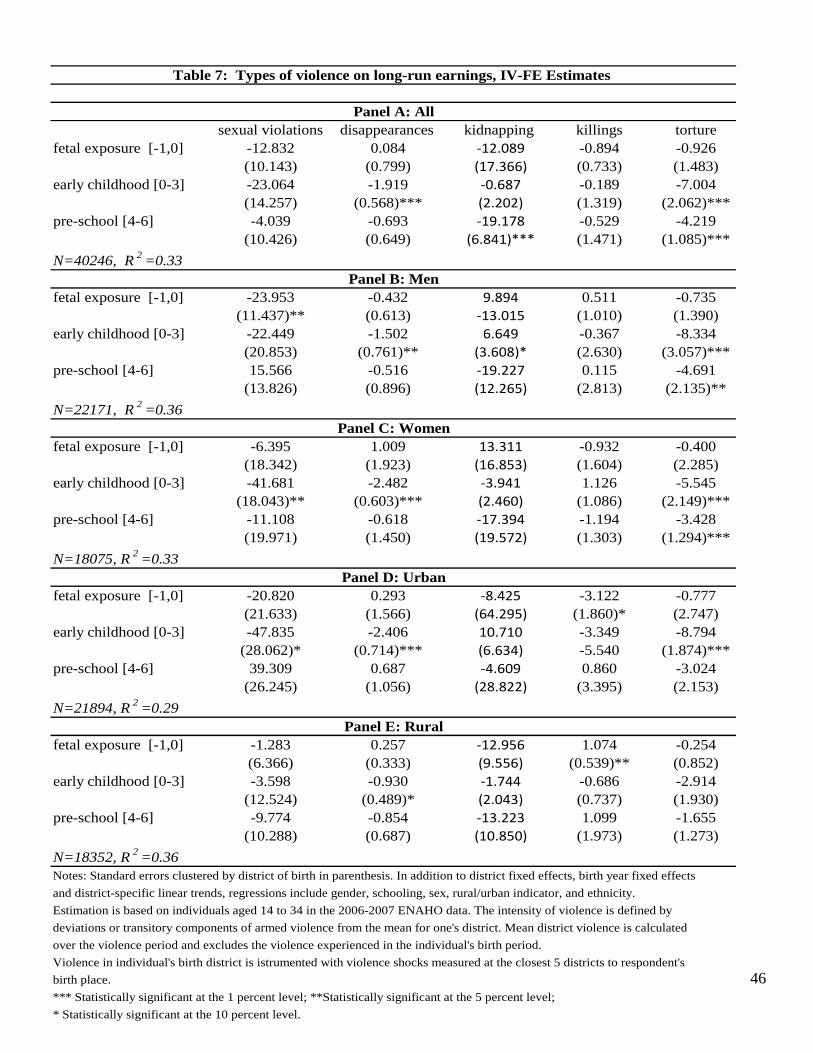
46
sexual violations disappearances kidnapping killings torture
fetal exposure [-1,0] -12.832 0.084 -12.089 -0.894 -0.926
(10.143) (0.799) (17.366) (0.733) (1.483)
early childhood [0-3] -23.064 -1.919 -0.687 -0.189 -7.004
(14.257) (0.568)*** (2.202) (1.319) (2.062)***
pre-school [4-6] -4.039 -0.693 -19.178 -0.529 -4.219
(10.426) (0.649) (6.841)*** (1.471) (1.085)***
N=40246, R2
=0.33
fetal exposure [-1,0] -23.953 -0.432 9.894 0.511 -0.735
(11.437)** (0.613) -13.015 (1.010) (1.390)
early childhood [0-3] -22.449 -1.502 6.649 -0.367 -8.334
(20.853) (0.761)** (3.608)* (2.630) (3.057)***
pre-school [4-6] 15.566 -0.516 -19.227 0.115 -4.691
(13.826) (0.896) (12.265) (2.813) (2.135)**
N=22171, R2
=0.36
fetal exposure [-1,0] -6.395 1.009 13.311 -0.932 -0.400
(18.342) (1.923) (16.853) (1.604) (2.285)
early childhood [0-3] -41.681 -2.482 -3.941 1.126 -5.545
(18.043)** (0.603)*** (2.460) (1.086) (2.149)***
pre-school [4-6] -11.108 -0.618 -17.394 -1.194 -3.428
(19.971) (1.450) (19.572) (1.303) (1.294)***
N=18075, R2
=0.33
fetal exposure [-1,0] -20.820 0.293 -8.425 -3.122 -0.777
(21.633) (1.566) (64.295) (1.860)* (2.747)
early childhood [0-3] -47.835 -2.406 10.710 -3.349 -8.794
(28.062)* (0.714)*** (6.634) -5.540 (1.874)***
pre-school [4-6] 39.309 0.687 -4.609 0.860 -3.024
(26.245) (1.056) (28.822) (3.395) (2.153)
N=21894, R2
=0.29
fetal exposure [-1,0] -1.283 0.257 -12.956 1.074 -0.254
(6.366) (0.333) (9.556) (0.539)** (0.852)
early childhood [0-3] -3.598 -0.930 -1.744 -0.686 -2.914
(12.524) (0.489)* (2.043) (0.737) (1.930)
pre-school [4-6] -9.774 -0.854 -13.223 1.099 -1.655
(10.288) (0.687) (10.850) (1.973) (1.273)
N=18352, R2
=0.36
Notes: Standard errors clustered by district of birth in parenthesis. In addition to district fixed effects, birth year fixed effects
and district-specific linear trends, regressions include gender, schooling, sex, rural/urban indicator, and ethnicity.
Estimation is based on individuals aged 14 to 34 in the 2006-2007 ENAHO data. The intensity of violence is defined by
deviations or transitory components of armed violence from the mean for one's district. Mean district violence is calculated
over the violence period and excludes the violence experienced in the individual's birth period.
Violence in individual's birth district is istrumented with violence shocks measured at the closest 5 districts to respondent's
birth place.
*** Statistically significant at the 1 percent level; **Statistically significant at the 5 percent level;
* Statistically significant at the 10 percent level.
Panel D: Urban
Table 7: Types of violence on long-run earnings, IV-FE Estimates
Panel A: All
Panel B: Men
Panel C: Women
Panel E: Rural
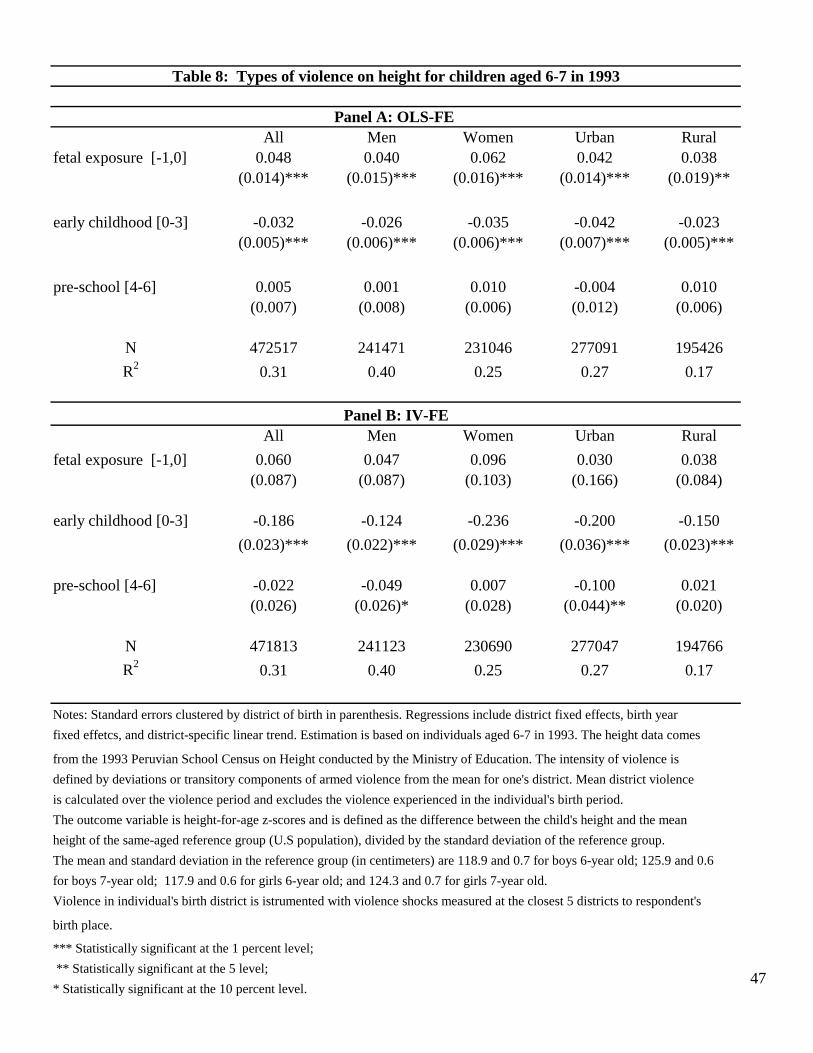
47
All Men Women Urban Rural
fetal exposure [-1,0] 0.048 0.040 0.062 0.042 0.038
(0.014)*** (0.015)*** (0.016)*** (0.014)*** (0.019)**
early childhood [0-3] -0.032 -0.026 -0.035 -0.042 -0.023
(0.005)*** (0.006)*** (0.006)*** (0.007)*** (0.005)***
pre-school [4-6] 0.005 0.001 0.010 -0.004 0.010
(0.007) (0.008) (0.006) (0.012) (0.006)
N 472517 241471 231046 277091 195426
R2
0.31 0.40 0.25 0.27 0.17
All Men Women Urban Rural
fetal exposure [-1,0] 0.060 0.047 0.096 0.030 0.038
(0.087) (0.087) (0.103) (0.166) (0.084)
early childhood [0-3] -0.186 -0.124 -0.236 -0.200 -0.150
(0.023)*** (0.022)*** (0.029)*** (0.036)*** (0.023)***
pre-school [4-6] -0.022 -0.049 0.007 -0.100 0.021
(0.026) (0.026)* (0.028) (0.044)** (0.020)
N 471813 241123 230690 277047 194766
R2
0.31 0.40 0.25 0.27 0.17
Notes: Standard errors clustered by district of birth in parenthesis. Regressions include district fixed effects, birth year
fixed effetcs, and district-specific linear trend. Estimation is based on individuals aged 6-7 in 1993. The height data comes
from the 1993 Peruvian School Census on Height conducted by the Ministry of Education. The intensity of violence is
defined by deviations or transitory components of armed violence from the mean for one's district. Mean district violence
is calculated over the violence period and excludes the violence experienced in the individual's birth period.
The outcome variable is height-for-age z-scores and is defined as the difference between the child's height and the mean
height of the same-aged reference group (U.S population), divided by the standard deviation of the reference group.
The mean and standard deviation in the reference group (in centimeters) are 118.9 and 0.7 for boys 6-year old; 125.9 and 0.6
for boys 7-year old; 117.9 and 0.6 for girls 6-year old; and 124.3 and 0.7 for girls 7-year old.
Violence in individual's birth district is istrumented with violence shocks measured at the closest 5 districts to respondent's
birth place.
*** Statistically significant at the 1 percent level;
** Statistically significant at the 5 level;
* Statistically significant at the 10 percent level.
Table 8: Types of violence on height for children aged 6-7 in 1993
Panel A: OLS-FE
Panel B: IV-FE

48
sexual violations disappearances abductions killings torture
ALL -0.604 -0.101 -0.087 -0.21 -0.132
N=472517 (0.229)*** (0.030)*** (0.029)*** (0.045)*** (0.038)***
R2=0.31
Men -0.338 -0.092 -0.054 -0.263 -0.084
N=241471 (0.276) (0.029)*** (0.045) (0.049)*** (0.044)*
R2=0.40
Women -0.822 -0.100 -0.100 -0.139 -0.162
N=231046 (0.215)*** (0.034)*** (0.026)*** (0.045)*** (0.038)***
R2=0.25
Urban -1.003 -0.167 -0.096 -0.300 -0.151
N=277091 (0.350)*** (0.036)*** (0.025)*** (0.067)*** (0.048)***
R2=0.27
Rural -0.319 -0.052 -0.059 -0.154 -0.120
N=195426 (0.141)** (0.023)** (0.060) (0.046)*** (0.048)**
R2=0.17
sexual violations disappearances abductions killings torture
ALL -6.637 -0.3 -2.788 -0.015 -0.366
N=471813 (1.763)*** (0.048)*** (0.746)*** (0.253) (0.235)
R2=0.31
Men -5.32 -0.205 -2.867 0.017 -0.314
N=241123 (1.791)*** (0.045)*** (0.628)*** (0.274) (0.228)
R2=0.40
Women -7.944 -0.377 -2.495 -0.015 -0.348
N=230690 (2.316)*** (0.062)*** (0.992)** (0.264) (0.307)
R2=0.25
Urban -4.233 -0.313 -2.168 -0.194 -0.306
N=277047 (2.551)* (0.075)*** (1.639) (0.289) (0.263)
R2=0.27
Rural -6.589 -0.250 -2.052 0.146 -0.588
N=194766 (1.696)*** (0.048)*** (0.763)*** (0.35) (0.198)***
R2=0.17
Notes: Standard errors clustered by district of birth in parenthesis. Regressions include district fixed effects, birth year
fixed effetcs, and district-specific linear trend. Estimation is based on individuals aged 6-7 in 1993. The height data comes
from the 1993 Peruvian School Census on Height conducted by the Ministry of Education. The intensity of violence is
defined by deviations or transitory components of armed violence from the mean for one's district. Mean district violence
is calculated over the violence period and excludes the violence experienced in the individual's birth period.
The outcome variable is height-for-age z-scores and is defined as the difference between the child's height and the mean
height of the same-aged reference group (U.S population), divided by the standard deviation of the reference group.
The mean and standard deviation in the reference group (in centimeters) are 118.9 and 0.7 for boys 6-year old; 125.9 and 0.6
for boys 7-year old; 117.9 and 0.6 for girls 6-year old; and 124.3 and 0.7 for girls 7-year old. Violence in individual's birth
district is istrumented with violence shocks measured at the closest 5 districts to respondent's birth place.
*** Statistically significant at the 1 percent level; ** Statistically significant at the 5 percent level;
* Statistically significant at the 10 percent level.
Panel B: IV-FE
Table 9: Early childhood exposure to types of violence on height for children aged 6-7 in 1993
Panel A: OLS-FE

49
All sexual violations disappearances abductions killings torture
Men -0.001 -0.085 0.001 -0.061 -0.057 -0.014
N=17268 (0.002) (0.241) (0.009) (0.170) (0.025)** (0.032)
R2=0.44
Women -0.001 0.410 -0.001 0.701 -0.017 0.007
N=14029 (0.003) (0.375) (0.011) (0.087)*** (0.010)* (0.042)
R2=0.59
Urban -0.001 0.228 -0.002 0.169 -0.036 0.007
N=18465 (0.002) (0.261) (0.009) (0.293) (0.018)* (0.028)
R2=0.32
Rural -0.001 0.043 0.001 0.274 -0.021 -0.008
N=12832 (0.002) (0.308) (0.010) (0.073)*** (0.008)** (0.034)
R2=0.45
All sexual violations disappearances abductions killings torture
Men -0.001 -0.071 -0.005 0.045 0.006 -0.013
N=21738 (0.001) (0.083) (0.002)** (0.011)*** (0.008) (0.012)
R2=0.65
Women -0.003 -0.280 -0.009 -0.014 0.006 -0.040
N=17781 (0.000)*** (0.086)*** (0.002)*** (0.024) (0.005) (0.014)***
R2=0.64
Urban -0.002 -0.251 -0.008 0.107 0.016 -0.025
N=21239 (0.0007)*** (0.101)** (0.001)*** (0.062)* (0.020) (0.014)*
R2=0.52
Rural -0.001 -0.038 -0.003 -0.015 0.000 -0.019
N=18280 (0.0003)* (0.044) (0.001)** (0.006)** (0.002) (0.008)**
R2=0.39
Notes: Standard errors clustered by district of birth in parenthesis. In addition to district fixed effects, birth year fixed effects, and
district-specific linear trends, regressions include gender, schooling, sex, rural/urban indicator, and ethnicity. The estimates for schooling
are based on individuals aged 17 to 34 in the 2006-2007 ENAHO data, while the estimates for wealth are based on individuals 14 to 34
in the 2006-2007 ENAHO data. Wealth index is the first principal component of several household assest including access to safe water,
flush toilet, characteristics of the housing dwelling, computer, telephone, cellphone, internet, TV, and per capita household income.
The intensity of violence is defined by deviations or transitory components of armed violence from the mean for one's birth district.
Mean district violence is calculated over the violence period and excludes the violence experienced in the individual's birth period.
Violence in individual's birth district is istrumented with violence shocks measured at the closest 5 districts to respondent's birth place.
*** Statistically significant at the 1 percent level; **Statistically significant at the 5 percent level; *Statistically significant at the 1
percent level.
Panel A: Schooling Channel
Panel B: Wealth Channel
Table 10: Early childhood exposure to civil war violence, IV-FE estimates