the kinetics of recovery and recrystallization of copper from hardness and thermoelectric-power...
TRANSCRIPT

THE KINETICS OF RECOVERY AND RECRYSTALLIZATION OF COPPER
FROM HARDNESS AND THERMOELECTRIC-POWER MEASUREMENTS*
T. LL. RICHARDS,7 S. F. PUGH,$ and H. J. STOKES?
Annealing of H.C. copper strip cold-rolled with reductions in thickness of 50 per cent and 96 per cent
has been studied as a rate-process by parallel observations of changes in hardness and thermoelectric
power. In accordance with earlier investigations, change in hardness is taken to be proportional to
fraction of metal recrystallized, while thermoelectric power is assumed to be directly related to residual
elastic lattice strain. While the hardness-isothermal annealing curve of strip rolled 50 per cent exhibits
a definite discontinuity indicative of two processes, such as recovery (or polygonization) and recrystalli-
zation, the thermoelectric power curve is, in agreement with Brindley’s earlier conclusion, pseudo
first order. The rate of decrease of average lattice strain during both polygonization and recrystallization
is apparently governed by similar processes of dislocation migration. The annealing of heavily rolled strip is more complex; hardness and thermoelectric power curves, however, are identical, and analysis
of the curves, outlined in an appendix, indicates that the dominant process is one of second order in
agreement with previous findings. The second-order character follows naturally from the concept that decrease in thermoelectric power and softening occurs by direct interaction and annihilation of
stress fields associated with stable arrays of dislocations at grain interfaces. It is,pointed out that this
concept is also consistent with recrystallization as a process of nucleation and growth.
CINETIQUE DE LA RESTAURATION ET DE LA RECRISTALLISATION DU CUIVRE
PAR MESURE DE DURETE ET DU POUVOIR THERMOELECTRIQUE
Le recuit de bandes laminees a froid en cuivre HC apres reduction d’epaisseur de 50 et de 96% a irt.6 Btudie par mesure des changements de durete et du pouvoir thermoelectrique. Conformement 8,
d’anciennes mesures, le changement de durete est proportionnel au pourcentage du metal recristallise,
tandis que le pouvoir thermoelectrique est suppose dependre directement des deformations reticula&x+
residuelles. Tandis que les courbes de durete apres recuit de bandes laminees It 50% montrent une
discontinuite bien deflnie caracteristique de deux processus tels que restauration (ou polygonisation) et
recristallisation, la courbe du pouvoir thermoelectrique est, conformement aux anciennes conclusions
de Brindley, du premier ordre. La vitesse de decroissance de la deformation reticulaire moyenne,
pendant la polygonisation et la recristallisation, est apparemment regie par un mecanisme analogue a
la migration des dislocations. Le recuit des bandes fortement laminees est plus complexe. Les courbes
de durete et du pouvoir thermoelectrique sont neanmoins identiques et leur analyse, faite dans un
appendice, indique que le mecanisme preponderant est du second ordre, en accord avec les mesures
anterieures. Ce caractere est la consequence naturelle de l’idee que la diminution du pouvoir thermo-
Blectrique et celle de la durete sont dues a l’interaction et it la destruction des champs de contraintes
associees aux repartitions stables de dislocations dans les joints de grains. 11 est remarqui: que cette
conception est en accord avec le mecanisme de germination et de croissance pour la recristallisation.
UBER DIE KINETIK DES ERHOLUNGS- UND REKRISTALLISATI~NSVORGANGES
BE1 KUPFER HERGELEITET AUS HARTEMESSUNGEN UND BESTIMMUNGEN
DER THERMOKRAFT
Durch gleichzeitige Beobachtung der Harteiinderungen und der ,&nderungen der Thermokraft wurde
die Zeitabhangigkeit des Anlassvorganges von Walzbiindern aus Hochleitfahigkeitskupfer mit einem
Verformungsgrad von 50 und 96% Dickenabnahme untersucht. In Ubereinstimmung mit friiheren Untersuchungen wird angenommen, dass die Hilrteiinderung proportional dem rekristallisierten Anteil des
Metalles ist, wahrend die Thermokraft in direkter Beziehung zu den verbleibenden elastischen Gitter-
spannungen steht. Wahrend die Hiirtekurve beim isothermen Anlassen des urn 50% verformten Bandes
eine deflnierte Unstetigkeit aufweist, die zwei Vorgiinge anzeigtdie Erholung (oder Polygonisation)
und die Rekristallisation-ist die Kurve der Thermokraft, in tibereinstimmung mit den friiheren
Folgerungen von Brindley, pseudo erster Ordnung. Die Geschwindigkeit des Abbaus der durchschnitt-
lichen Gitterspannungen wahrend der Polygonistion wie such wahrend der Rekristallisation wird offen-
sichtlich durch iihnliche Vorgange der Versetzungswanderung beeinflusst. Die Vorgange beim Anlassen der
stark verformten Bander sind wesentlich verwickelter; die Kurven der Hiirte und der Thermokraft sind
jedoch identisch. Eine Analyse dieser Kurven, die im Anhang umrissen wird, zeigt, dass der beherrschende
Vorgang ein Prozess zweiter Ordnung ist, was mit friiheren Beobachtungen iibereinstimmt. Dass diesen Vorgang ein Prozess zweiter Ordnung ist, folgt naturgemiiss aus der Annahme, dass der Abfall der
Thermokraft und die Hlirteabnahme durch direkte Wechselwirkung und Vernichtung von Spannungs- feldern vorsichgehen unter gleichzeitigem Auftreten von stabilen Versetzungsgebieten an den Grenz- flachen der Khmer. Es wird gezeigt, dass diese Vorstellung mit der Rekristallisation als einem
Keimbildungs- und Wachstumsvorgang im Ubereinstimmung ist.
* Received October 27, 1954. t Research Department, Imperial Chemical Industries
z Formerly as above, now at Atomic Energy Research
Ltd., Metals Division, Birmingham, England. Establishment, Harwell, England.
ACTA METALLURGICA, VOL. 4, JANUARY 1956 75

76 ACTA METALLURGICA, VOL. 4, 1956
1. INTRODUCTION
From analyses of observations of the rate of
recrystallization, made directly or by following
changes of various mechanical and physical properties,
different investigators have concluded that recrystal-
lization simulates a rate process of either the flrst,(lp 2,
second,‘3) or thirdt4) order. The divergent conclusions
can be quite rationally explained on nucleation and
growth theories,(5) but it is difficult to express such
theories in terms of the more elemental and more
widely applicable dislocation theory.
Changes in the observed values of different pro-
perties of the same cold-worked metal on annealing
may occur at distinctly different rates, and, in
attempting to analyse annealing curves, such differ-
ences must be taken into consideration. Some pro-
perties, for example, may be purely dependent on
dislocation density, while others are affected by their
distribution; or alternatively, as has been suggested,(e)
while changes in one property may be associated
with behavior of dislocations, t’hose in other pro-
perties may be more directly related to lattice
vacancies. Also the analysis of the form of annealing
curves is highly dependent on the accuracy of the
curves t’hemselves, so that if such analysis is to have
real significance it is desirable to select for observation
a property which not only can be measured with
sufficient accuracy, but which is quite representative
of the average condition of the specimen examined.
Furthermore, in the analysis, the possibility that more
than one process is involved must be given considera-
tion, and the problem treated accordingly.
The work described in t’he present paper was under-
taken primarily with the object of studying recrystal-
lization as a rate process, but a secondary objective
was to explain the apparently conflicting observations
of Brindleyc2) and of Cook and Richardsc3) on the
recrystallizat,ion behavior of copper. The latter
determined recrystallization rate in heavily cold-
rolled copper strip by hardness measurements which
t’hey had first correlated with t’he proportion of each
sample recrystallized, estimated by direct observation
TABLE 1. Composition of the copper used
per cent
Tin Lead Iron Nickel Manganese Silver Antimony
0.0002 : <0.0002 / 0.0010
0.0005 / <0.0005
0.0022 < 0.0001
Arsenic Bismuth Selenium Tellurium Phosphorus Sulphur oxygen
< 0.0005 < 0.0001
Nil
Et: 0.0010 0.032
of changes in microstructure. From an analysis of
their results they showed that the softening rate
conformed to that of a second-order process, and
therefore proposed a two-stage mechanism involving
recovery and recrystallization. On the other hand,
Brindley’sc2) analysis of annealing curves determined
by Brandsma (‘) from thermoelectric-power measure-
ments indicated a single first-order process. It was
significant that, in their work on kinetics, Cook and
Richards(s) dealt specifically with recrystallization of
copper to cube-texture, while Brandsma’s experi-
ments(‘) were, in all probability, concerned with
recrystallization to random or to retained rolling
texture.
For the present investigation, it was clearly
desirable that thermoelectric-power and hardness
measurements should be made on the same specimens
and on material prepared so as to recrystallize in
characteristically different manners. Accordingly, two batches of cold-rolled H.C. copper strip were
produced in such a way that one recrystallized to
cube-texture and the other to a random structure.
2. PREPARATION OF MATERIAL
A cast slab of tough-pitch copper of H.C. quality
and composition indicated in Table 1 was hot-rolled
from an initial thickness of 3% in. to l&in. The
material was then annealed at 500°C for 3 hr and
cold-rolled to 0.75 in., t’he direction of cold-rolling at
this and all subsequent stages being transverse to that
of the initial hot-rolling. Strip for the experimental work at a thickness of 0.030 in. was then prepared in
the two following ways:-
(a) Strip of Random Structure
Strip, for the annealing experiments on material
recrystallizing to random texture, was prepared from
the 0.75 in. cold-rolled stock by annealing at 9OO”C,
and then cold-rolling to the final gauge of 0.030 in.
with intermediate anneals at 500°C at gauges of
0.150 in. and 0.060 in. The 0.030 in. strip was then
sheared to 4 in. widths. Some of the material was
annealed at 350°C for use as reference leads, while the
remainder was retained in the hard-rolled condition
for the annealing experiments.
(b) Hard-Rolled Strip for Recrystallization to Cube
Texture
Part of the 0.75 in. cold-rolled stock was annealed
at 350°C to a grain size of 0.015 mm, and then rolled
without further annealing to 0.030 in. Since this
material recrystallizes slowly at room temperature,(*)
the rolling was interrupted at a thickness of 0.15 in.,

RICHARDS, PUGH, AND STOKES: RECOVERY AND RECRYSTALLIZATION 77
rolhng to final gauge being carried out immediately
prior to the annealing experiments.
3. EXPERIMENTAL PROCEDURE
(a) Thermoelectric-Power Measurement
The thermoelectric power measurements were made
with a Paschen astatic galvanometer, the control
magnets being adjusted so as to provide a sensitivity
of 3.4 x 1OW volts/mm deflection. Since, with a
temperature difference of 5°C between the junction of
a cold-worked annealed copper thermocouple, an e.m.f.
greater than lo-’ volts is developed, the error in its
measurement is thus about 1 per cent. The galvano-
meter and leads were contained in a constant-
temperature enclosure, on a heavy mounting to reduce
vibration. The 4 in. wide strip sample formed the
detachable short element of a differential thermo-
couple, being bolted to annealed copper reference
leads so that it could be removed for annealing
treatment. A temperature difference was maintained
between the junctions by immersing one of them in
an oil-bath at room temperature, and the other in a
bath about 5°C higher, the exact difference in tempera-
ture being measured by means of a chromel-alumel
thermocouple calibrated against a Beckmann thermo-
meter.
(b) Determination of Isothermal Annealing Curves
The progress of isothermal annealing of the strip
reduced 50 per cent by cold-rolling, which recrystal-
lized to a random crystal orientation, was followed by
measuring thermoelectric power with respect to the
fully annealed reference leads of random crystal
orientation, and by D.P. hardness measurements after
successive ten-minute annealing periods in an air
circulation oven at 180°C.
In order to maintain a steady and uniform temper-
ature and to hasten the attainment of thermal
equilibrium, the specimen was inserted in a narrow
space between two slabs of copper maintained
continuously at a steady temperature in the oven.
At the end of each annealing period the specimen was
water-quenched. The cold-rolled strip, bent into a
U-shape with arms 5 in. long, had holes drilled at the
ends in order to bolt it to the reference leads, the thin
oxide film formed during annealing being first removed
at the contact points by rubbing lightly with metal
polish. The sole purpose of the polishing was to ensure
good electrical contact, any mechanical working of
the surface having no effect, provided the whole
junction was at uniform temperature. Hardness
measurements were also made on the same sample
after each annealing period.
TABLE 2. Diamond pyramid hardness and thermoelectric- power values on annealing at 180°C for H.C. copper strip cold-rolled 50 per cent reduction in thickness
Diamond pyramid Thermoelectric hardness power
Observec (10-B volts)
0 123
:: 120 117 30 ’ 115
100 5.38 96.2 5.00 91.8 4.50 89.0 ’ 4.78
40 117 91.8 50 116 90.4 60 70 80 90
100 110 120 130 150 170 190 220 250 280 310 350 410 470 530 590 680 800 980
117 ~ 91.8 114 1 87.6 113 86.3 114 87.6 113 111 105 108
94.9 83.6 79.6 76.3 70.5 70.5 69.0 61.8 59.5 60.0 55.5 56.7 52.1 50.8 50.4
86.3 83.5 75.3 79.4 61.4 45.4 40.3 35.6 27.8 27.9 25.0 15.7 12.5 13.2
7.0
;:; 0.6 0
4.52 4.42 4.26 3.96 3.66 3.40 3.22 3.00 2.90 2.78 2.56 2.34 2.24 1.90 1.72 1.48 1.42 1.38 1.22 1.08 1.08 1.02 0.96 0.96 0.88*
Per cent total
change on annealing
5.38 - 0.925)
100 92.5 80.8 87.4 81.4 79.2 75.9 68.8 62.0 57.0 52.0 45.8 44.8 42.0 37.0 32.2 29.8 22.2 17.6 12.6 11.1 10.3
6.7 3.5
&5) 0.8 0.8
-1.0
* The asymptotic end value of thermoelectric power obtained from the smoothest curve through experimental points was estimated to be 0.925 x lo-* volts.
Strip reduced 96 per cent by rolling, which recrystal-
lized to cube-texture on annealing, was also made into
a U-shaped specimen, and thermoelectric power again
measured against random-orientation copper reference
leads. Annealing of this strip was effected in boiling
water, measurements being made after successive
five-minute annealing periods until no further change
in properties took place. Towards the end of annealing
the periods were increased, since the rate of change
was slower.
The observed values of hardness and thermo-
electric power are recorded in Tables 2 and 3, from
which it should be noted that the end value of the
thermoelectric power in Table 3 is a small negative
quantity. For the purpose of comparison of rates of
change in hardness and thermoelectric power, the
values of these quantities are also expressed in Tables 2
and 3 as the percentages of the total change on
annealing from initial value to an asymptotic end

78 ACTA METALLURGICA, VOL. 4, 1956
TABLE 3. Diamond pyramid hardness and thermoelectric- power values on annealing at 100°C for H.C. copper strip cold-rolled 96 per cent reduction in thickness
Time of isothermal annealing at 100°C
(min)
0 5
10
;I? 25 30 35 40 45
z 70
:: 100 110 120 130 140 155 175 200 230 215 350 420
1140
Diamond pyramid ’ Thermoelectric hardness power
0
-
bserved (I&P.
5Kg load)
126 125 123 125 123 123 124 121 118 121 106 110 92 82 87 72 59 60 58 54 48 49 48 47 46 45 44 44
L
Per cent total
change on annealing per cent
(126 - 44)
100 98.8 96.3 98.8 96.3 96.3 97.6 93.8 90.2 93.8 75.6 80.5 58.5 46.3 52.4 34.2 18.3 19.5 17.1 12.2 4.9 6.0 4.9
?Z 1:2 0 0
, 1 Per cent
Observed total
(10-E / change on
volts) , annealing per cent
(10.34 + 0.475)
10.34
9.06 8.78
9.40
8.46 8.58
9.30
8.18 7.76
9.50
6.72 5.64
9.16
4.30 3.30 2.50 1.78 1.36 0.98 0.68 0.40 0.14
-0.03 -0.17 -0.28 -0.36 -0.43 -0.52*
88.12
100
85.57 82.58
91.26
83.68 80.00
90.35
76.12 66.39
92.19
56.52 44.14
89.04
34.93 27.50 20.84 16.96 13.45 10.68 8.09 5.12 4.13 2.84 1.80 0.95 0.40
-0.41
* The asymptotic end value of thermoelectric power was estimated to be -0.475 volts.
value derived from a smooth curve through experi-
mental points. Isothermal annealing curves have been
drawn in Fig. 1 from both the hardness and thermo-
electric-power measurements on strip, rolled 50 per
cent. Since, apart from a small initial lag in hardness
values, the corresponding curves for strip, rolled 96
per cent, are exceedingly close to each other, in order
to avoid confusion only the more accurate thermo-
electric-power curve is plotted in Fig. 2.
4. ANALYSIS
Analysis of the recrystallization process by reference
to changes in a secondary property depends on either
the assumption of a linear relation between the
measured value of the property and the corresponding
fraction of metal recrystallized at any stage or on the
experimental determination of the precise relationship.
For a partly recrystallized metal, considered as a
mixture of a residual cold-worked portion with that
which has already transformed to the fully annealed
0 % EMF
. % D.P. HARDNESS I EXPERIMENTAL VALUES
- THEORETICAL CURVE 6 =&, ewat 0 \a I I (HALF LIFE 105min) " -
b0 \
TIME OF ISOTHERMAL ANNEALING AT 180°c- mm
FIG. 1. Isothermal annealing curves of H.C. copper strip cold-rolled 50 per cent reduction in thickness.
state, a linearly related property conforms to the
simple rule of mixtures, so that an observed value is in
simple proportion to the quantities of the two com-
ponents present.
It has already been establishedt3) for the recrystal-
lization of heavily cold-rolled H.C. copper strip, that
apart from a small initial lag, during which no apparent
change in average hardness of the strip occurs with
the first microscopically observed signs of recrystal-
lization, the relation between hardness and fraction
recrystallized is, in fact, linear. No direct calibration
of thermoelectric power was made for the purpose of
the present investigation, although the close agreement
between changes in this property and in hardness
during isothermal annealing of heavily rolled copper
indicates that, in this instance at least, it also is
linearly related with the fraction recrystallized. This
view is in direct opposition to one previously held,tg)
namely that thermoelectric power might actually
indicate the state of recovery of the continuous
unrecrystallized matrix quite independently of the
presence of discrete and therefore disconnected
islands of recrystallized metal.
Crussard and Aubertin,oO) however, have shown
that change in thermoelectric power of tensile
specimens on unloading varies directly with applied
stress and therefore with residual elastic strain. It
thus appears that thermoelectric power provides a
/ 11 . EXPERIMENTAL VALUES
b0
0 50 100 150 200 25O x30 350 400 450 500
TIME OF ISOTHERMAL ANNEALING AT IOO’C - mm
Fm. 2. Isothermal annealing curve of H.C. copper strip cold-rolled 96 per cent reduction in thickness.

RICHARDS, PUGH, AND STOKES: RECOVERY AND RECRYSTALLIZATION 79
t STRAIGHT LINE THROUGH EXPERIMENTAL POINTS INDICATES HALF LIFE VALUE OF IOSmin
sa zz” 2fc VZujl’O EOa 5
M$ $y BU zg ’ ;,‘g 05
a;; 22
loo 200 300 400 500 600 700 800 9m 1000
TIME OF ISOTHERMAL ANNEALING AT 180°C - min
FIG. 3. Isothermal annealing curve of H.C. copper strip cold-rolled 50 per cent reduction in thickness.
means of following changes in lattice strains during
isothermal annealing, and being truly representative
of the average condition of the specimen, observation
of thermoelectric power is ideally suited for rate-
process analysis. The localized nature of the diamond-
pyramid hardness test and the heterogeneous character
of partly annealed metal are responsible, on the other
hand, for a wide statistical fluctuation in results for a
single specimen, which is reflected in the greater
scatter of the observed hardness values about the
estimated annealing curve in Fig. 1. Because of the
relative inaccuracy of hardness determinations, full
mathematical analysis of the kinetics of the isothermal
annealing process is carried out only with the thermo-
electric data.
(a) Recrystallization of Strip Rolled 50 per cent
The plot of residual thermoelectric power of strip
rolled with reduction of 50 per cent against time of
isothermal annealing at 18O”C, Fig. 1, appears to
follow a simple exponential curve, apart from a small,
but significant, deviation in the initial stages. This
deviation is probably connected with the more marked
discontinuity in the hardness curve. To derive the
exponential coefficient of decay of thermoelectric
power with time, the experimental values are plotted
in Fig. 3 on a semi-logarithmic scale. The points fall
almost on a straight line, confirming the exponential
nature of t’he relationship. From the slope of the line,
the decay coefficient is 6.6 x 10e3 min-l, correspond-
ing to a half-value period of 105 minutes. The full
curve in Fig. 1 is in fact the exponential curve of
this half-life. Change in thermoelectric power is
therefore either a simple first-order process or at
least a pseudo first-order process. The significance
of this finding, and the difference in character of the
thermoelectric and hardness isothermal curves, will
be discussed later.
(b) Recrystallization of strip rolled 96 per cent
The thermoelectric-power and hardness curves of
strip rolled with reduction in thickness of 96 per cent
and isothermally annealed at 100°C are, apart from an
initial lag in hardness values, coincident. The curve,
Fig. 2, is clearly more complex than the thermoelectric-
power curve, Fig. 1, for strip rolled 50 per cent. As a
first attempt at analysis, the experimental values of
thermoelectric power were plotted on a semi-loga-
rithmic scale, as in Fig. 4. The appearance of this curve
is suggest’ive of three successive processes. The first is
a rapid process accounting for an initial fall of about
10 per cent of the total change: the order of the
second, accounting for the major proportion of the
100
- EXTRAPOLATION OF LINEAR TAIL OF
50 x x ARITHMETIC DIFFERENCE (Q)-(6)
0.3 0 10 40 60 80 100 120 140 lb0 I80 200 220 240 260 280 300 320 340 360 380 400 420 440
TIME OF ISOTHERMAL ANNEALING AT 100 ‘c - min
FIG. 4. Isothermal annealing curve of H.C. copper strip cold-rolled 96 per cent reduction in thickness.
80 ACTA METALLURGICA, VOL. 4, 1956
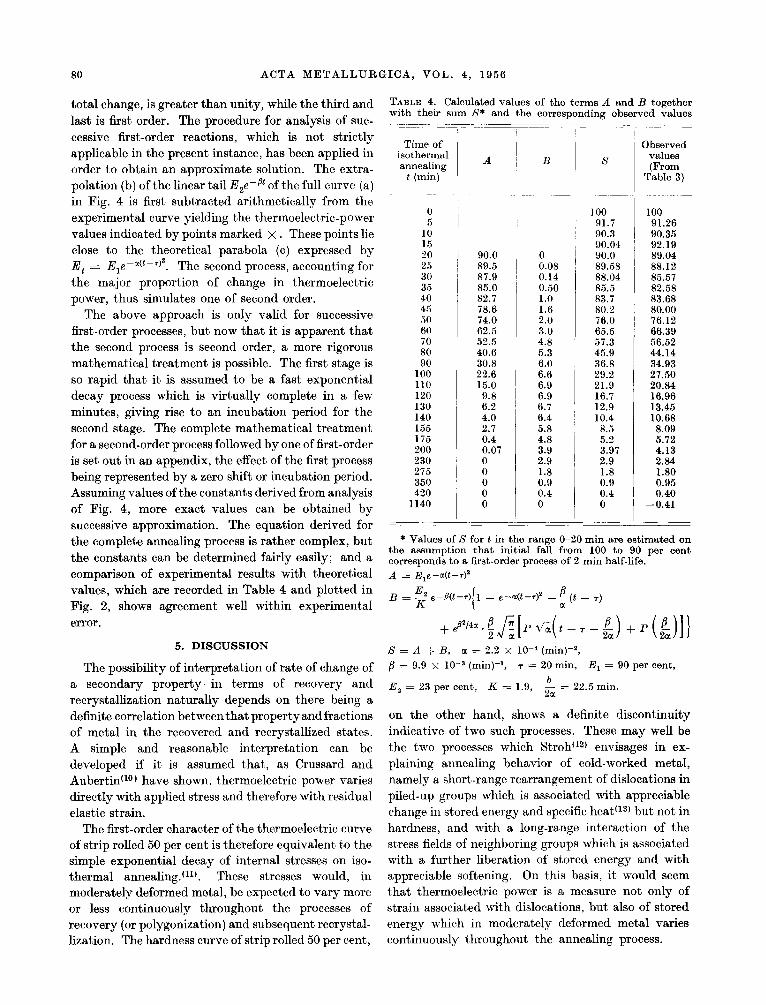
total change, is greater than unity, while the third and
last is first order. The procedure for analysis of suc-
cessive first-order reactions, which is not strictly
applicable in the present instance, has been applied in
order to obtain an approximate solution. The extra-
polation (b) of the linear tail EzePBt of the full curve (a)
in Fig. 4 is first subtracted arithmetically from the
experimental curve yielding the thermoelectric-power
values indicated by points marked x These points lie
close to the theoretical parabola (c) expressed by E = EIe-a(t-@
t Th e second process, accounting for
the major proportion of change in thermoelectric
power, thus simulates one of second order.
The above approach is only valid for successive
first-order processes, but now that it is apparent that
the second process is second order, a more rigorous
mathematical treatment is possible. The first stage is
so rapid that it is assumed to be a fast exponential
decay process which is virtually complete in a few
minutes, giving rise to an incubation period for the
second stage. The complete mathematical treatment
for a second-order process followed by one of first-order
is set out in an appendix, the effect of the first process
being represented by a zero shift or incubation period.
Assuming values of the constants derived from analysis
of Fig. 4, more exact values can be obtained by
successive approximation. The equation derived for
the complete annealing process is rather complex, but
the constants can be determined fairly easily; and a
comparison of experimental results with theoretical
values, which are recorded in Table 4 and plotted in
Fig. 2, shows agreement well within experiment’al
error.
5. DISCUSSION
The possibility of interpretation of rate of change of
a secondary property in terms of recovery and
recrystallization naturally depends on there being a
definite correlation between that property and fractions
of metal in the recovered and recrystallized states.
A simple and reasonable interpretation can be
developed if it is assumed that, as Crussard and
Aubertin(‘O) have shown, thermoelectric power varies
directly with applied stress and therefore with residual
elastic strain.
The first-order character of the thermoelectric curve
of strip rolled 50 per cent is therefore equivalent to the
simple exponential decay of internal stresses on iso-
thermal annealing.(ll). These stresses would, in
moderately deformed metal, be expected to vary more
or less continuously throughout the processes of
recovery (or polygonization) and subsequent recrystal-
lization. The hardness curve of strip rolled 50 per cent,
TABLE 4. Calculated values of the terms A and l3 together with their sum S* and the corresponding observed values
Time of isothermal annealing A
t (min)
0 5
10 15
f: 30 35 40 45 50 60 70 80 90
100 110 120 130 140 155 175 200 230 275 350 420
1140
100 91.26 90.35 92.19
90.0 0 89.04 89.5 0.08 88.12 87.9 0.14 85.57 85.0 0.50 82.58 82.7 83.68 78.6 ::: 80.00 74.0 2.0 76.12 62.5 3.0 66.39 52.5 4.8 56.52 40.6 30.8 :::
44.14 34.93
22.6 6.6 27.50 15.0 6.9 20.84 9.8 6.9 16.96 6.2 6.7 13.45 4.0 6.4 10.68 2.7 5.8 8.09
:::7 4.8 5.72
4.13 0 ;:: 2.84 0 0 A::
1.80 0.95
0 0.4 0.40 0 0 -0.41
100 91.7
1 90.3 90.04 90.0 89.58 88.04 85.5 83.7 80.2 76.0 65.5 57.3 45.9 36.8 29.2 21.9 16.7 12.9 10.4
8.5
K7 2.9 1.8 0.9 0.4 0
* Values of S for t in the range O-20 min are estimated on the assumption that initial fall from 100 to 90 per cent corresponds to a first-order process of 2 min half-life. A = _&e-act-r)*
Observed values (From
Table 3)
B = 2 e-B(t-7) 1 - e--a@-# _ $ (t _ 7) 1
S = A + B, GC = 2.2 x 10d4 (min)-a,
/3 = 9.9 X 10d3 (min)-I, 7 = 20 min, E, = 90 per cent,
Ez = 23 per cent, K = 1.9, & = 22.5 min.
on the other hand, shows a definite discontinuity
indicative of two such processes. These may well be
the two processes which Stroh(12) envisages in ex-
plaining annealing behavior of cold-worked metal,
namely a short-range rearrangement of dislocations in
piled-up groups which is associated with appreciable
change in stored energy and specific heat(13) but not in
hardness, and with a long-range interaction of the
st,ress fields of neighboring groups which is associated
with a further liberation of stored energy and with
appreciable softening. On this basis, it would seem
that thermoelectric power is a measure not only of
strain associated with dislocations, but also of stored
energy which in moderately deformed metal varies
continuously throughout the annealing process.
RICHARDS, PUGH, AND STOKES: RECOVERY AND RECRYSTALLIZATION 81
In rolling, individual crystals are deformed in direct
proportion to the strip itself, so that, wit’h increasing
reduction, initially equi-axed crystals are rolledprogres-
sively thinner, each crystal taking up the approximate
orientation of one component or other of the standard
rolling textures. The small initial fall in thermoelectric
power on annealing of heavily rolled material is, on the
present thesis, equivalent to a decrease in general
lattice distortion with the establishment of dislocation
arrays at the int’erfaces of adjacent crystals. Disloca-
tions of opposite sign would be annihilated at the
interfaces leading to an equilibrium density of disloca-
tions of one sign corresponding to the definite
orientation difference between the various components
of texture, while the dislocations in neighboring
interfaces would be of opposite sign. Further struc-
tural change can now only occur by direct interaction
and cancellation of the dislocation stress fields across
the thickness of individual crystals leading to an
abrupt change in lattice orientation from rolling-
texture to cube-texture. Such a mechanism would
account both for the large change in thermoelectric
power associated with the second process evident from
the t’hermoelectric-power curve, and for its second-
order character.
It has in fact been establishedc3) that, for heavily
rolled copper, a linear relationship exists between
hardness and fraction recrystallized to cube-texture.
The similarity between the hardness and thermo-
electric power curves of strip rolled 96 per cent
indicates that, in this instance, the change in thermo-
electric power is also proportional to fraction recrystal-
lized. The change from rolling-texture to cube-
texture must, of necessity, be one of localized atomic
rearrangement such as nucleation and growth, other-
wise large dimensional changes would be involved. The
formation of cube-texture by annihilation of high-
energy interfaces, however, is equivalent to two-
dimensional growth from predetermined nuclei, which
as Evans(14) has shown is a process of second order.
The final first-order process is merely relief by grain growth of residual stresses at boundaries of cube-
texture grains in slightly different orientations.
Analysis of changes in thermoelectric power and
hardness purely as rate processes, making the basic
assumptions that thermoelectric power is directly
proportional to lattice strain and hardness to fraction
recrystallized, has led to the following general picture
of the annealing behavior of rolled copper strip. From
the hardness curve, annealing of strip rolled with
reduction of 50 per cent occurs by two distinct pro-
cesses, polygonization and recrystallization. Thermo-
electric power, and therefore lattice strain, however,
6
varies more or less continuously in an exponential
manner throughout, since both polygonization and
recrystallization involve essentially similar processes of
migration of dislocations. Annealing of heavily rolled
strip may again be regarded as occurring by poly-
gonization and recrystallization, although polygoni-
zation, being restricted within the boundaries of the
now thin initial grains, is associated with only a small
change in thermoelectric power and lattice strains,
and none in hardness. Most of the change in hardness
and thermoelectric power occurs by a second-order
process which is interpreted as a process of annihi-
lation of stable arrays of dislocations at t’he grain
interfaces by direct interaction of their stress fields.
The findings of the present investigation thus confirm
the earlier observation of Cook and Richardsc3) that
recrystallization of heavily rolled copper is mainly a
second-order process, and establish that the difference
in order found by these authors and by Brindleyc2) is
due to the fact Ohat the findings of the former refer to
heavily rolled copper which recrystallizes to cube-
texture, and of the lat’ter to copper processed in such a
way that it recrystallized in a different manner on
annealing, probably to a retained rolling texture or
perhaps a random texture. Furthermore, the picture
of recrystallizat’ion derived by rate-process analysis is
quite consistent with the structural observations and
nucleation and growth concepts.
ACKNOWLEDGMENTS
The authors wish to thank several of their colleagues
for much valuable discussion, and Dr. N. P. Inglis,
Research Director, for his interest and encouragement.
1.
2.
3.
4.
5.
6.
ii:
9.
:::
12. 13.
14.
REFERENCES
A. KRUPKOWSKI and M. BALICKI, Ann. Akad. Sci. Tech. Vareowie, 4, 270 (1937). G. W. BRINDLEY, Phys. Sot. Bristol Conference Report, 9.5 (1948). M. COOK and T. LL. RICHARDS, J. Inst. Metals, 73, 1 (1946). B. F. DECKER and D. HARKER, TTans. Amer. Inst. Min. Met. Eng9x, 188, 887 (1950). J. E. BURKE and D. TURNBULL, Progress in Metal Physics, 3, 220 (1952). L. M. CLAREBROUGH, M. E. HARGREAVES, and G. W. WEST, Phil. Mug., 44, 913 (1953). W. F. BRANDSMA, 2. Phys., 48, 703 (1928). M. COOK and T. LL. RICHARDS, J. Inst. Metals, 70, 159 (1944). T. LL. RICHARDS. Phvs. Sot. Bristol Conference R~DoI%. 105 (1948). ’ ”
I ,
CH. CRUSSARD and F. AUBERTIN, Rev. Met., 45,402 (1948). W. G. BURGERS, Proc. K. Ned. Akad. Wetensch., 50, 452 (1947). A. N. STROR. P~oc. Rev. Sot., A218. 391 (1953). T. SUZURI, &i. Rel. ‘kee. inst. T’ohoku’ University, 1, 193 (1949). U. R. EVANS, Trans. Faraday Sot., 41, 365 (1945).

82 ACTA METALLURGICA, VOL. 4, 1956
Appendix
SUCCESSIVE RATE PROCESSES
The change in thermoelectric power of H.C. copper- strip cold rolled with a reduction in thickness of 50 per cent, on isothermal annealing, conforms to a first- order process, that is, the thermoelectric power E, at time t can be expressed by the equation
E, = E,,ewmt
where E, is the initial thermoelectric power at time t = 0, and a a constant, the value of which is tem- perature-dependent.
Recrystallization of heavily rolled copper is complex, and an attempt was first made at analysis of the isothermal annealing curve, by following the standard procedure for successive first-order processes, such as a radioactive series for which a product A trans- forms to a product B, and B to C, and so on, the rate of decay of a product at any instant being proportional to the amount present at that instant. The analysis indicated that the recrystallization process of heavily rolled copper did not conform to successive first-order
processes, but rather to a second-order process, followed by one of first order.
The mathematical analysis for successive first-order processes has long been established, but the authors are unaware of a similar treatment for a second-order process followed by one of first order, and t’hey have accordingly developed their own treatment.
ANALYSIS OF SECOND-ORDER FOLLOWED BY
FIRST-ORDER PROCESS
Let product A transform to B, and B to C, and let x, y, z be the amount of each present at time t, so that
x+y+z=1
Let transformation A --f B be a second-order process, so that
5= lee-d2 (1)
where u is a constant. Let B -+ C be a first-order process such that, as a
completely independent process, unit quantity of B
decays according to the relation
y= 1 -e-Bt
where B is a constant.
(2)
Consider now the successive transformations A -+ B --+ C. The rate of decay of A and therefore of formation of B at time t is obtained by differentiation of equation (1). The amount of B formed in time- interval dt, at t, is therefore
2at, * e+@- dt,. (3)
The amount of B formed at t, which subsequent time t is, by combination of
= 2&r * e-&la - e-fl(t-tl) s &,,
remains at
(2) and (3),
and the total amount of y present at time t is therefore
= I
sat, . e-Q . ,-8&t,) . at,,
0
where t, is the variable.
t y= 2ae-pt
s
t,e-b+Bh) . &, (4) 0
Completing the square for the variable exponential coefficient,
s
t y = &. e-Pt. ,P/4a t, . e--cc(t, -B/2ctY . &,
0
and changing the variable from t, to d/b: (tl - #I/2a) = x
J-BI~QG
=e -IQ . ,imaa
The last integral term in this expression corresponds to the error function, or integration of the Gaussian equation for normal distribution of errors, and can be written in a form, such that its value can be derived from standard tables. So that, on replacing
I& (t -/3/2a) for z,
y = ,BV4a . e -I% _e -act - B/2a)8 1 t
0
B
+5 u ,/- [P(t 6 -/3/2&J + P(@&)]] (6)
where P(B/2 v’%) and P(t I&---_B/2 I.&) can be
evaluated from tables. After simplification, equation (6) may be written in the form
y = ,-pt ( 1 _ e-a(tx-;t)
+ t J
i * eBe/4c( [P(t l/O: - j3/2 l/Cr) + P(b/22/Cr)] (7) a 1

RICHARDS, PUGH, AND STOKES: RECOVERY AND RECRYSTALLIZATION 83
But since, as indicated in the text, it is reasonable to
assume that thermoelectric power due to any product
is linearly related with y, the quantity of that product
present, equation (7) may be rewritten
E = E2e-@t 1 _ e-a(t2-;t) (
(8)
where E is the contribution to the observed thermo-
electric power of the product B at any time T, and
E, that of a thermocouple element composed wholly of
product B with respect to the one composed wholly
of the end product C.
It now remains only to demonstrate how the
constants of the equation may be evaluated. By
inspection, it is evident that the expression within
brace brackets of equation (8) increases with time,
and finally approaches a constant value K, when E subsequent’ly decreases according to the relation
E = KE,eeBt.
Identifying this relation with the linear tail of curve (a)
in Fig. 4, the slope of line (b) corresponds to a /I value
of 9 * 9 x 10-a min-l. Some difficulty now arises in
the evaluation of the remaining constants. Firstly, it
is clear from Figs. 2 and 4 that a rapid decay process
precedes the successive second-order and first-order
processes to which the present analysis refers. For
lack of sufficient data, this is presumed to be a simple
first-order process of half-life of about two minutes.
The complete decay of the initial product reduces the
observed thermoelectric power from 100 per cent of
the initial value to 90 per cent; that is, to a value E, corresponding to the thermoelectric power of the
product A, which decays according to the relation
E = E, . e--a(t--7)e,
an incubation period 7 being introduced to represent
the delay caused by the first process. The constants
other than /? of equation (8) are now evaluated by the
method of successive approximation. First, the value
of r is assumed to be approximately 20 min, then a
value for a is calculated for which the value of the
expression reduces to a half in the appropriate time
interval of (t - T) = 80 min. K * E, is now the
thermoelectric power corresponding to the time
r = 20 min on line (b) of Fig. 4. The R.H.S. of
equation (8) can now be evaluated for various times
over the whole isothermal annealing range. K is the
value of the expression in brace brackets of equation
(8) corresponding to very long times. Bearing in mind that the annealing times are taken from t = -r (20 min)
as zero, equation (8), thus evaluated, is plotted as
curve (B) in Fig. 5, and then subtracted arithmetically
from the experimental curve (X) to give curve (A). New values of u and T are now found which satisfy
curve (A), and the procedure repeated until a satis-
factory agreement is obtained. The value of 20 min for 7 was found to be sufficiently accurate, but the
ultimate values of the other constants are, a = 2.2 X 10e4 min-z, /3 = 9.9 X 1O-3 min-l, E, = 90 per cent’, E, = 23 per cent, K = 1.9, and
b/Zcl= 22.5 min. The terms,
A = Eie-“(t-‘? (9)
B = $ * e-p(t-7) (t _ ‘12 _ $ (t _ T)
(10)
are evaluated in Table 4 for times corresponding to
actual annealing periods after allowing for the incuba-
tion period r = 20 min, during which a simple
first-order process of 2-min half-life is assumed to
account for the initial 10 per cent change in thermo-
electric power.
The sum of t’he terms
A+B=S (11)
is plotted as the full curve in Fig. 2, the initial rapid
decay being shown as a broken curve. Apart from
some initial scatter, agreement with observed values
is satisfactory.
00 2s
TIME OF ISOTHERMAL ANNEALING AT IOO’C- min
FIG. 5. Analysis of isothermal annealing curve of H.C. copper strip cold-rolled 96 per cent reduction in thickness.