the joint contribution of sleep, intelligence and motivation to school performance
TRANSCRIPT
Personality and Individual Differences 37 (2004) 95–106www.elsevier.com/locate/paid
The joint contribution of sleep, intelligence and motivationto school performance
Anne Marie Meijer *, Godfried L.H. van den Wittenboer
Faculty of Social and Behavioural Sciences, Department of Education, University of Amsterdam, P.O. Box 94208,
1090 GE Amsterdam, The Netherlands
Received 9 September 2002; received in revised form 8 July 2003; accepted 24 August 2003
Available online 20 October 2003
Abstract
In this study, a structural equation model was used to examine the contribution of sleep duration andsleep quality on school performance in the last two grades of elementary school. Intelligence, achievement
motivation, and test anxiety were used as control variables. Mean age of the 153 children was 11 years and
seven months. The relationship with school performance has been modelled more explicitly by two latent
variables �chronic sleep reduction� and �eagerness�. �Chronic sleep reduction� is indicated by three variables:
usual time in bed during school days, bedtime at the weekend, and allowance to children to set their own
bedtime. The latent variable �eagerness� is related to debilitatory and facilitatory test anxiety and it is in-
fluenced by the observed variable �sleep quality�. The relationship of chronic sleep reduction, eagerness,
achievement motivation, and intelligence with school performance (as shown in the model) demonstratesthat less chronic sleep reduction, greater eagerness, higher achievement motivation and intelligence give rise
to a better school performance. The average contribution of each of these variables is 10%. Together, these
variables explain 43% of the variance in school performance.
� 2003 Elsevier Ltd. All rights reserved.
Keywords: Chronic sleep reduction; Children; School performance; Intelligence; Motivation; Test anxiety
1. Introduction
Multiple factors have shown to determine children�s academic performance (Wang, Haertel,& Walberg, 1990). Intelligence (Lassiter & Bardos, 1995), achievement motivation (Fortier,
* Corresponding author. Tel.: +31-20-525-1572; fax: +31-20-525-1200.
E-mail address: [email protected] (A.M. Meijer).
0191-8869/$ - see front matter � 2003 Elsevier Ltd. All rights reserved.
doi:10.1016/j.paid.2003.08.002
96 A.M. Meijer, G.L.H. van den Wittenboer / Personality and Individual Differences 37 (2004) 95–106
Vallerand, & Guay, 1995), self-esteem, test anxiety (McDonald, 2001; Zohar, 1998), parentaleducation, and family environment (Kurdek & Sinclair, 1988) are only a few of the possiblestudent variables that have been investigated. Studies about the contribution of sleep to schoolperformance of elementary school children are scarce, however. This may be a striking flaw,considering that many parents and teachers take it for granted that a good night rest shouldenhance school performance. Indeed, investigations concerning sleep duration suggest thatshortening of sleep may have a negative influence on school performance of students. Effects ofshortened sleep on daytime functioning are sleepiness, tiredness, difficulty in getting up, andmoodiness as well as diminished attention and concentration difficulties in school (Carskadon,Vieira, & Acebo, 1993; Epstein, Chillag, & Lavie, 1998; Gau & Soong, 1995). Students performingless well at school, also sleep less, have later bedtimes and show more irregular sleep/wakeschedules (Wolfson & Carskadon, 1998). Preliminary results of experiments with delayed schoolstart times suggest that the short-term impact on learning and behaviour has been beneficial(Mitru, Millrood, & Mateika, 2002).
Studies with adults show that partial sleep deprivation (sleep period of <5 h in a 24-h period)has a more profound effect on mood and cognitive performance than sleep deprivation of at leastone night (Pilcher & Huffcutt, 1996). Even restriction of sleep to 6 h per night for 14 consecutivedays produces cognitive performance deficits equivalent to up to 2 nights of total sleep depri-vation (Van Dongen, Maislin, Mullington, & Dinges, 2003) and sleep restriction to 4–5 h pernight during a week shows a cumulative effect on mood disturbance and psychomotor vigilanceperformance (Dinges et al., 1997).
It is also clear that effects of sleep deprivation are task specific. Longer tasks, low demand tasksand tasks requiring intensive concentration are affected most. A lack of motivation may deteri-orate performance (Webb, 1992; Wilkinson, 1968). Both sleep-deprived and sleep-reduced groupsshow problems with distraction (Blagrove, Alexander, & Horne, 1995). For children between10 and 14 years, sleep restriction of 5 h during a night in a sleep laboratory leads to significantlyworse performance in verbal processing, creativity, and abstract thinking (Randazzo, Muehlbach,Schweitzer, & Walsh, 1998). However, rote performance, less complex cognitive functions andfigural creativity are not affected by sleep restriction to <5 h of sleep (Fallone, Acebo, ToddArnedt, Seifer, & Carskadon, 2001; Randazzo et al., 1998). Shorter sleep duration, based onactigraphy for 72 consecutive hours, is associated with memory tasks at the highest load level only(Steenari et al., 2003). Sadeh, Gruber, and Raviv (2003) conclude that effects of modest sleeprestriction concern complex tasks that require executive control. They found that extension ofsleep with an average of 35 min during three days lead to improved memory function as comparedwith sleep restriction or no change in sleep duration. Children with shortened sleep by at least 30min during three days show deteriorated reaction times. The measures used have been found tobe significantly related to achievement tests (Arcia, Ornstein, & Otto, 1991).
Apart from sleep duration, sleep quality may have an effect on school functioning as well. Sleepquality mostly has been defined as difficulty falling asleep and/or maintaining sleep (Costa E.Silva, Chase, Sartorius, & Roth,. 1996). A parameter for sleep quality is sleep efficiency (% realsleep time in 24 h). Sleep quality is not related to sleep duration based on self-report (Meijer,Habekoth�e, & van den Wittenboer, 2000; Totterdell, Reynolds, Parkinson, & Briner, 1994).However, sleep restriction leads to better sleep efficiency (Sadeh et al., 2003). Whether this con-tinues in the long term, is not yet clear. The prevalence of difficulties with initiating and main-
A.M. Meijer, G.L.H. van den Wittenboer / Personality and Individual Differences 37 (2004) 95–106 97
taining sleep varies for preadolescents from 10% to 33% (Meijer et al., 2000). Sleep quality seemsto be related particularly to psychosocial factors: neuroticism (Meijer, Habekoth�e, & van denWittenboer, 2001), psychosomatic symptoms (Tynj€al€a, Kannas, & V€alimaa, 1993), anxiety anddepression (Manni et al., 1997; Morrison, McGee, & Stanton, 1992), and stress (Kataria,Swanson, & Trevathan, 1987; Wolfson et al., 1995). Adults with chronic insomnia show elevatedlevels of sensitivity for anxiety (Vincent & Walker, 2001) and presleep stress enhances sleep-onsetinsomnia (Haynes, Adams, & Franzen, 1981). Dahl (1996) reported also difficulties with focusedattention and Steenari et al. (2003) found associations between sleep quality and incorrect re-sponses in working memory tasks. Besides, sleep quality appears to be related with functioningwell at school and achievement motivation (Meijer et al., 2000). Whether sleep quality influencesschool performance has not yet been investigated.
The aim of this paper is to study the contribution of chronic sleep reduction and sleep quality onschool performance of children in the last two grades of elementary school by means of a structuralequation model (Bollen, 1989). Considering the results of sleep restriction studies, we assume thatschool performance may particularly be affected by chronic sleep reduction. Being the opposite of(long) sleep duration, sleep reduction is indicated here by a combination of three variables: usualtime in bed during school days, bedtime at the weekend and parental permission for children todecide their own bedtime. Based on the relationships of sleep quality with on the one hand anxiety(Vincent &Walker, 2001) and stress (Haynes et al., 1981; Kataria et al., 1987; Wolfson et al., 1995),and on the other hand focused attention (Dahl, 1996) and school functioning (Meijer et al., 2000),it may be supposed that (test) anxiety may deteriorate sleep quality and so school performance. Asintelligence relates positively to academic achievement (Lassiter & Bardos, 1995), it will contributepositively to school performance, as will the achievement motivation to perform well (Fortier et al.,1995). Taking intelligence, achievement motivation, and test anxiety into account, chronic sleepreduction, and indirectly worse sleep quality may contribute to lower school performance.
2. Method
2.1. Subjects
Subjects were 153 children (81 boys, 72 girls) from the seventh (88 children) and eight grades(65 children) of elementary schools. Ages of the children varied from 10 years and four months to13 years and three months (M ¼ 11 years and seven months). Three elementary schools in threecities in The Netherlands participated in our study. The schools are situated in middle-classneighbourhoods. Starting times of school are at 8:30. Most of the children were white, and lived infamilies with two parents (84%). In families of 111 children both parents were employed, in 38families one of the parents was employed, and in four families neither parent was employed.
2.2. Procedure and measures
2.2.1. ProcedureAfter getting informed consent from schools and parents, the researchers made appointments
for the data collection with the teachers of the classes. The questionnaires were completed in the
98 A.M. Meijer, G.L.H. van den Wittenboer / Personality and Individual Differences 37 (2004) 95–106
classroom in a non-demanding situation. The researchers administered all questionnaires in thesame month of the second trimester of the school year. For each class this occurred in themorning.
2.2.2. Measures
Demographic variables. Information regarding age, gender, and family background is providedby means of a questionnaire with closed questions.
School performance. To measure school performance a questionnaire was constructed con-sisting of six close-ended questions with three response categories: unsatisfactory, satisfactory,and good. The children indicated whether their mark on their last report was unsatisfactory,satisfactory or good for Dutch language, English language, Mathematics, Biology, Geography,and History. This resulted in a minimum score of 6 (very bad marks), and a maximum score of18 (very good marks). Cronbach�s alpha for this scale was 0.65.
Sleep. Quality of sleep was measured by subjects� self-ratings on a visual analogue scale. Fol-lowing Totterdell et al. (1994), the children were assessed on aspects of sleep latency, number ofawakenings at night, sleep latency after awakenings, and perception of sleep quality and feelingrested after sleep. These are also criteria for insomnia as provided in the DSM IV (APA, 1994).The scale consists of seven close-ended questions with three ordinal response categories rankedfrom 1 to 3 (see Appendix A). Minimum score is 7 (sleeping badly) and maximum score 21(sleeping well). Cronbach�s alpha for this study was 0.67.
In addition to sleep quality, the questionnaire also contained questions about bedtimes duringschool days and at the weekend, wake-up time during school days, and whether the children wereallowed to decide their own bedtime. The last question could be answered with ‘‘No’’ (1) or ‘‘Yes’’(2). Wake-up time during the weekend was not queried because of the variability of this fromweekend to weekend. Sleep duration was based on the time children usually went to bed duringschool days, until the moment of getting up the next morning. However, because one may notassume that children actually sleep the whole period, we call this �time in bed�. Three indicatorsmeasure chronic sleep reduction: time in bed during schooldays, bedtime at the weekend, andparental permission for children to decide their own bedtime.
Intelligence. Intelligence was measured with the Standard Progressive Matrices (SPM) (Raven,Court, & Raven, 1988). The SPM is ‘‘a test of a person�s capacity at the time of the test to ap-prehend meaningless figures presented for his observation, see the relations between them, con-ceive the nature of the figure completing each system of relations presented, and, by so doing,develop a systematic method of reasoning’’ (Raven et al., 1988, p. 2). The scale consists of 60problems divided into sets of 12. In each set, the first problem is as nearly as possible self-evident.The problems that follow become progressively more difficult. Minimum score of the test is 0 (nocorrect answers) and maximum score is 60. The test is equally useful for persons of all ages,whatever their education, nationality or physical condition. Correlations with actual schoolachievement assessed by school grades generally fall between 0.20 and 0.60 (Raven et al., 1988).The reliability of the test varies from 0.89 to 0.99 (Raven et al., 1988). In our study, incorrect oromitted answers were scored as 0. Cronbach�s alpha in our study was 0.91.
Achievement motivation. Achievement motivation was defined as the tendency to excel in theeyes of beholders or oneself. This concept is measured with the achievement motivation test forchildren (Hermans, 1983). The scale consists of 34 closed questions. The minimum score of the
A.M. Meijer, G.L.H. van den Wittenboer / Personality and Individual Differences 37 (2004) 95–106 99
scale is 0 (low achievement motivation) and the maximum score is 34 (high achievement moti-vation). The reliability of this scale is 0.81 and the scale correlated positively with school marks(r ¼ 0:30) (Hermans, 1983). Fortier et al. (1995) reported correlations from r ¼ 0:21 to r ¼ 0:40between autonomous academic motivation and school performance. Correlation with intelligencevaried between r ¼ 0:15 and r ¼ 0:18 (Hermans, 1983). Cronbach�s alpha in our study was 0.82.
Test anxiety. Test anxiety can be distinguished in facilitatory and debilitatory test anxiety(McDonald, 2001). A moderate degree of arousal or anxiety may be beneficial for performance,whereas anxiety above the optimum level may impair performance. Both were measured here withtwo scales of the achievement motivation test for children (Hermans, 1983). The facilitatory testanxiety scale consists of 18 close-ended questions (e.g.: When I feel a slight tension, (A) I am lesscapable of doing things than otherwise, (B) I am more capable of doing things than otherwise).Minimum score of this scale is 0 (low facilitatory test anxiety) and maximum score 18 (highfacilitatory test anxiety). The reliability of the scale is 0.82. The debilitatory test anxiety scaleconsists of 14 close-ended questions (e.g.: During a test, (A) I am afraid to make mistakes, (B)I am not very afraid to make mistakes). The minimum score of this scale is also 0 (low debilitatorytest anxiety) and the maximum score 14 (high debilitatory test anxiety). The reliability of this scaleis 0.79. Facilitatory test anxiety shows positive correlations with school marks (r ¼ 0:20), whereasdebilitatory test anxiety shows negative relations (r ¼ �0:34) (Hermans, 1983). McDonald (2001)reported correlations from r ¼ �0:20 to r ¼ �0:60. In our study, Cronbach�s alpha was 0.83 forfacilitatory test anxiety and 0.76 for debilitatory test anxiety. Facilitatory and debilitatory testanxiety were negatively correlated with each other (r ¼ �0:59; p < 0:001).
2.3. Statistical analyses
To test the effects of intelligence, achievement motivation, test anxiety, sleep quality and sleepduration on school performance, the covariance matrix of these variables will be analysed bymeans of a �structural equation model�. A structural equation model often consists of a mea-surement model (to be seen as a confirmatory factor analysis for the latent (unobserved) variables)and a path model in which relations between latent variables and observed variables can bespecified. Although such a model, in fact, consists of many regression equations, it will mostly berepresented by a graph in which arrows (paths) designate the direction of the relationship. Anoutgoing arrow from a latent or an observed variable indicates an independent variable in a re-gression equation. An incoming arrow points at the dependent variable of a regression equation.If a model fits well (e.g. if the v2 statistic is not significant), a significant path coefficient means thatthe regression coefficient in the corresponding regression equation differs significantly from zero.
3. Results
3.1. Sleep variables
The children in our study usually go to bed between 19:00 and 24:00 h, with a mean bedtime of20:57 h (SD ¼ 30 min) during school days and of 22:26 h (SD ¼ 55 min) at the weekend. Theywake up between 5:00 and 8:00 h, with a mean of 7:13 h (SD ¼ 26 min). They spent between 6 h
100 A.M. Meijer, G.L.H. van den Wittenboer / Personality and Individual Differences 37 (2004) 95–106
and 25 min and 12 h and 45 min in bed (M ¼ 10 h and 16 min, SD ¼ 40 min). Most children(83.6%) sleep alone in their own bedroom. Only 16 children (10.7%) were allowed to decide theirown bedtime. Three boys used medication for sleep problems. Children, who are allowed to settheir own bedtime, spent a shorter time in bed during schooldays (r ¼ �0:37, p < 0:00). Sleepquality does not show a relation with bedtime during school days (r ¼ 0:08, p > 0:05) and at theweekend (r ¼ �0:04, p > 0:05), or permission to set own bedtime (r ¼ 0:04, p > 0:05).
3.2. Sleep-school performance model
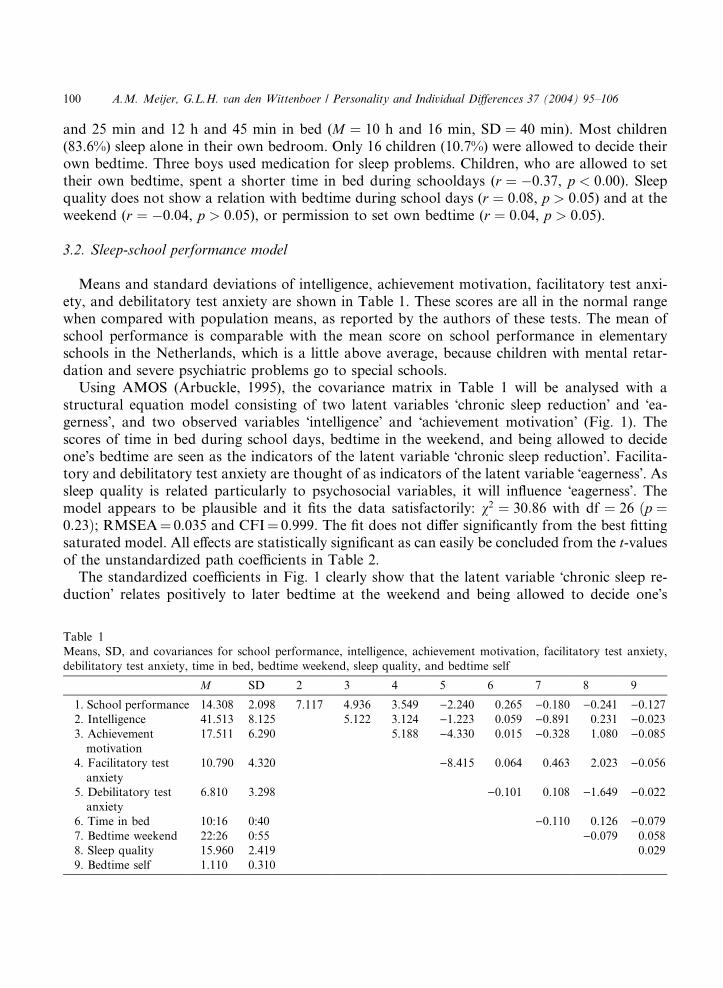
Means and standard deviations of intelligence, achievement motivation, facilitatory test anxi-ety, and debilitatory test anxiety are shown in Table 1. These scores are all in the normal rangewhen compared with population means, as reported by the authors of these tests. The mean ofschool performance is comparable with the mean score on school performance in elementaryschools in the Netherlands, which is a little above average, because children with mental retar-dation and severe psychiatric problems go to special schools.
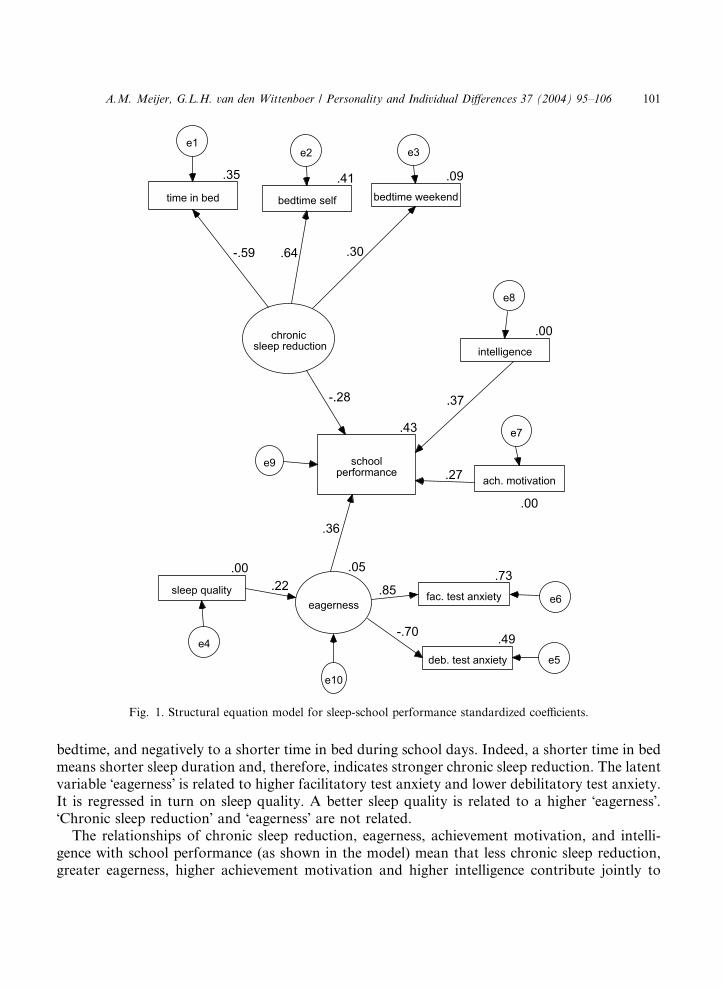
Using AMOS (Arbuckle, 1995), the covariance matrix in Table 1 will be analysed with astructural equation model consisting of two latent variables �chronic sleep reduction� and �ea-gerness�, and two observed variables �intelligence� and �achievement motivation� (Fig. 1). Thescores of time in bed during school days, bedtime in the weekend, and being allowed to decideone�s bedtime are seen as the indicators of the latent variable �chronic sleep reduction�. Facilita-tory and debilitatory test anxiety are thought of as indicators of the latent variable �eagerness�. Assleep quality is related particularly to psychosocial variables, it will influence �eagerness�. Themodel appears to be plausible and it fits the data satisfactorily: v2 ¼ 30:86 with df ¼ 26 ðp ¼0:23Þ; RMSEA¼ 0.035 and CFI¼ 0.999. The fit does not differ significantly from the best fittingsaturated model. All effects are statistically significant as can easily be concluded from the t-valuesof the unstandardized path coefficients in Table 2.
The standardized coefficients in Fig. 1 clearly show that the latent variable �chronic sleep re-duction� relates positively to later bedtime at the weekend and being allowed to decide one�s
Table 1
Means, SD, and covariances for school performance, intelligence, achievement motivation, facilitatory test anxiety,
debilitatory test anxiety, time in bed, bedtime weekend, sleep quality, and bedtime self
M SD 2 3 4 5 6 7 8 9
1. School performance 14.308 2.098 7.117 4.936 3.549 )2.240 0.265 )0.180 )0.241 )0.1272. Intelligence 41.513 8.125 5.122 3.124 )1.223 0.059 )0.891 0.231 )0.0233. Achievement
motivation
17.511 6.290 5.188 )4.330 0.015 )0.328 1.080 )0.085
4. Facilitatory test
anxiety
10.790 4.320 )8.415 0.064 0.463 2.023 )0.056
5. Debilitatory test
anxiety
6.810 3.298 )0.101 0.108 )1.649 )0.022
6. Time in bed 10:16 0:40 )0.110 0.126 )0.0797. Bedtime weekend 22:26 0:55 )0.079 0.058
8. Sleep quality 15.960 2.419 0.029
9. Bedtime self 1.110 0.310
chronic sleep reduction
.09bedtime weekend
e3
.30
.41bedtime self
e2
.64
.35
time in bed
e1
-.59
.05
eagerness
.00
ach. motivation
e7
.73fac. test anxiety e6
.49deb. test anxiety e5
-.70
.00sleep quality
.43
schoolperformance
e8
e4
e9
e10
.00intelligence
.85.22
.27
.37-.28
.36
Fig. 1. Structural equation model for sleep-school performance standardized coefficients.
A.M. Meijer, G.L.H. van den Wittenboer / Personality and Individual Differences 37 (2004) 95–106 101
bedtime, and negatively to a shorter time in bed during school days. Indeed, a shorter time in bedmeans shorter sleep duration and, therefore, indicates stronger chronic sleep reduction. The latentvariable �eagerness� is related to higher facilitatory test anxiety and lower debilitatory test anxiety.It is regressed in turn on sleep quality. A better sleep quality is related to a higher �eagerness�.�Chronic sleep reduction� and �eagerness� are not related.
The relationships of chronic sleep reduction, eagerness, achievement motivation, and intelli-gence with school performance (as shown in the model) mean that less chronic sleep reduction,greater eagerness, higher achievement motivation and higher intelligence contribute jointly to
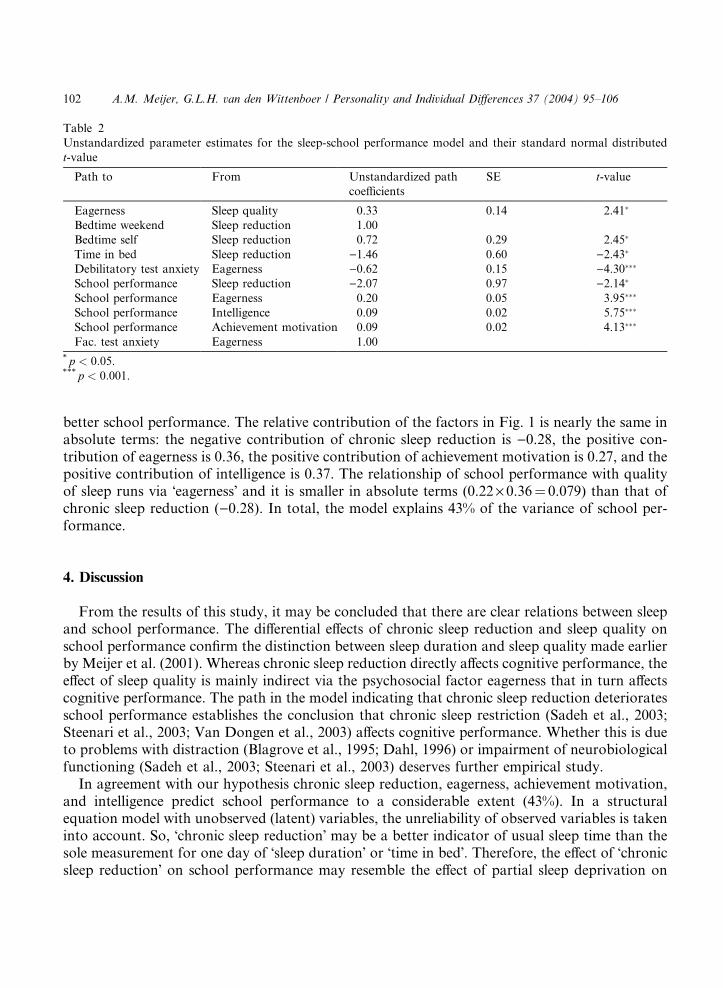
Table 2
Unstandardized parameter estimates for the sleep-school performance model and their standard normal distributed
t-value
Path to From Unstandardized path
coefficients
SE t-value
Eagerness Sleep quality 0.33 0.14 2.41�
Bedtime weekend Sleep reduction 1.00
Bedtime self Sleep reduction 0.72 0.29 2.45�
Time in bed Sleep reduction )1.46 0.60 )2.43�
Debilitatory test anxiety Eagerness )0.62 0.15 )4.30���
School performance Sleep reduction )2.07 0.97 )2.14�
School performance Eagerness 0.20 0.05 3.95���
School performance Intelligence 0.09 0.02 5.75���
School performance Achievement motivation 0.09 0.02 4.13���
Fac. test anxiety Eagerness 1.00* p < 0:05.*** p < 0:001.
102 A.M. Meijer, G.L.H. van den Wittenboer / Personality and Individual Differences 37 (2004) 95–106
better school performance. The relative contribution of the factors in Fig. 1 is nearly the same inabsolute terms: the negative contribution of chronic sleep reduction is )0.28, the positive con-tribution of eagerness is 0.36, the positive contribution of achievement motivation is 0.27, and thepositive contribution of intelligence is 0.37. The relationship of school performance with qualityof sleep runs via �eagerness� and it is smaller in absolute terms (0.22· 0.36¼ 0.079) than that ofchronic sleep reduction ()0.28). In total, the model explains 43% of the variance of school per-formance.
4. Discussion
From the results of this study, it may be concluded that there are clear relations between sleepand school performance. The differential effects of chronic sleep reduction and sleep quality onschool performance confirm the distinction between sleep duration and sleep quality made earlierby Meijer et al. (2001). Whereas chronic sleep reduction directly affects cognitive performance, theeffect of sleep quality is mainly indirect via the psychosocial factor eagerness that in turn affectscognitive performance. The path in the model indicating that chronic sleep reduction deterioratesschool performance establishes the conclusion that chronic sleep restriction (Sadeh et al., 2003;Steenari et al., 2003; Van Dongen et al., 2003) affects cognitive performance. Whether this is dueto problems with distraction (Blagrove et al., 1995; Dahl, 1996) or impairment of neurobiologicalfunctioning (Sadeh et al., 2003; Steenari et al., 2003) deserves further empirical study.
In agreement with our hypothesis chronic sleep reduction, eagerness, achievement motivation,and intelligence predict school performance to a considerable extent (43%). In a structuralequation model with unobserved (latent) variables, the unreliability of observed variables is takeninto account. So, �chronic sleep reduction� may be a better indicator of usual sleep time than thesole measurement for one day of �sleep duration� or �time in bed�. Therefore, the effect of �chronicsleep reduction� on school performance may resemble the effect of partial sleep deprivation on
A.M. Meijer, G.L.H. van den Wittenboer / Personality and Individual Differences 37 (2004) 95–106 103
cognitive performance (Pilcher & Huffcutt, 1996). The contributions of intelligence andachievement motivation to school performance seem comparable with earlier reports (Fortieret al., 1995; Hermans, 1983; McDonald, 2001; Raven et al., 1988).
A limitation of this study may be the use of subjective measures for school performance. In-stead of self-report of grades, standardized scores would have been preferable. Furthermore, timein bed is not comparable with real sleep time. For future studies we, therefore, recommend the useof wrist actigraphy (Sadeh, Raviv, & Gruber, 2000) to investigate the differential influences ofsubjective and objective measures of sleep on school performance. Because chronic sleep reduc-tion in particular seems to influence school performance, measurements should be made over alonger time. To take into account the influence of parental variables on sleep and school per-formance of preadolescents, a future study may include parenting and family organization ascontrol variables. Finally, because our dataset is correlational, real causal conclusions cannot bedrawn. This concerns especially the relationships of �eagerness� with school performance, whichmay be reciprocal, additive and situation specific (Zohar, 1998).
The finding that chronic sleep reduction negatively affects school performance, may not lead tothe reverse conclusion that more sleep improves school performance: the optimal sleep time is notthe longest time in bed. Moreover, there may be individual and developmental differences in sleepdemand (Carskadon et al., 1993). As irregular sleep-wake cycles per se are associated with poorschool performance (Wolfson & Carskadon, 1998), sleep variability deserves particular attention.In sleep restriction studies, which show distinct results for sleep duration, variability may also playa role because of the temporarily change of sleep patterns due to the experimental manipulation.This is not the case in studies in a naturalistic setting (Meijer et al., 2000; Steenari et al., 2003),which show more distinct results for sleep quality. A challenging task for further research is,therefore, to sort out the conditions whereupon in the long run sleep reduction, sleep quality, andsleep variability may affect school performance.
Appendix A
Questions on sleeping.(1) What time do you usually go to bed on the days you have to go to school? Please, try to
describe this as accurately as possible...................................................................................................................
(2) What time do you go to bed at weekends? Please, try to describe this as accurately as possible...................................................................................................................The next questions are about the days on which you have to go to school!
(3) Are you allowed to decide for yourself what time you go to bed?1. No2. Yes
(4) When you�re in bed and the lights are turned off:1. You fall asleep at once.2. You stay awake for a while.3. It takes you a long time to fall asleep.
104 A.M. Meijer, G.L.H. van den Wittenboer / Personality and Individual Differences 37 (2004) 95–106
(5) Do you have a troubled sleep?1. Never2. Sometimes3. Nearly every night
(6) Do you sometimes wake up during the night?1. Never2. Sometimes3. Nearly every night
(7) If you wake up during the night:1. Mostly you do not notice.2. You fall asleep again soon.3. It takes you a while to fall asleep again.
(8) Do you sleep well at night?1. No2. Sometimes3. Yes, always
(9) Do you feel rested at awakening?1. No2. Sometimes3. Yes, always
(10) What time do you wake up in the morning (on days that you have to go to school)? Please tryto describe this as accurately as possible..................................................................................................................
(11) Do you sleep badly?1. No2. Sometimes3. Yes
References
American Psychiatric Association (APA) (1994). Diagnostic and statistical manual of mental disorders (4th ed.).
Washington: American Psychiatric Association.
Arbuckle, J. L. (1995). Amos users� guide. Chicago: SmallWaters Corporation.
Arcia, E., Ornstein, P. A., & Otto, D. A. (1991). Neurobehavioral Evaluation System (NES) and school performance.
Journal of School Psychology, 29, 337–352.
Blagrove, M., Alexander, C., & Horne, J. A. (1995). The effects of chronic sleep reduction on the performance of
cognitive tasks sensitive to sleep deprivation. Applied Cognitive Psychology, 9, 21–40.
Bollen, K. (1989). Structural equations with latent variables. New York: Wiley.
Carskadon, M. A., Vieira, C., & Acebo, C. (1993). Association between puberty and delayed phase preference. Sleep,
16, 258–262.
Costa E. Silva, J. A., Chase, M., Sartorius, N., & Roth, T. (1996). Special report from a symposium held by the World
Health Organization and the World Federation of Sleep Research Societies: an overview of insomnias and related
disorders––recognition, epidemiology, and rational management. Sleep, 19, 412–416.
A.M. Meijer, G.L.H. van den Wittenboer / Personality and Individual Differences 37 (2004) 95–106 105
Dahl, R. E. (1996). The impact of inadequate sleep on children�s daytime cognitive function. Seminars in Pediatric
Neurology, 3, 44–50.
Dinges, D. F., Pack, F., Williams, K., Gillen, K. A., Powell, J. W., Ott, G. E., Aptowicz, C., & Pack, A. I. (1997).
Cumulative sleepiness, mood disturbance, and psychomotor vigilance performance decrements during a week of
sleep restricted to 4–5 h per night. Sleep, 20, 267–277.
Epstein, R., Chillag, N., & Lavie, P. (1998). Starting times of school: effects on daytime functioning of fifth-grade
children in Israel. Sleep, 21, 250–256.
Fallone, G., Acebo, C., Todd Arnedt, J., Seifer, R., & Carskadon, M. A. (2001). Effects of acute sleep restriction
on behavior, sustained attention, and response inhibition in children. Perceptual and Motor Skills, 93, 213–
229.
Fortier, M. S., Vallerand, R. J., & Guay, F. (1995). Academic motivation and school performance: toward a structural
model. Contemporary Educational Psychology, 20, 257–274.
Gau, S. F., & Soong, W. T. (1995). Sleep problems of junior high school students in Taipei. Sleep, 18, 667–673.
Haynes, S. N., Adams, A., & Franzen, M. (1981). The effects of presleep stress on sleep-onset insomnia. Journal of
Abnormal Psychology, 90, 601–606.
Hermans, H. (1983). Van faalangst tot verantwoordelijkheid. Het bevorderen van de motivatie in taaksituaties op school en
in het gezin (From test anxiety to responsibility. Promoting motivation in tasks at school and in the family). Lisse:
Swets & Zeitlinger.
Kataria, S., Swanson, M. S., & Trevathan, G. E. (1987). Persistence of sleep disturbances in preschool children.
Pediatrics, 110, 642–646.
Kurdek, L. A., & Sinclair, R. J. (1988). Relation of eight graders� family structure, gender, and family environment with
academic performance and school behavior. Journal of Educational Psychology, 80, 90–94.
Lassiter, K. S., & Bardos, A. N. (1995). The relationship between young children�s academic achievement and measures
of intelligence. Psychology in the Schools, 32, 170–177.
Manni, R., Ratti, M. T., Marchioni, E., Castelnovo, G., Murelli, R., Sartori, I., Galimberti, C. A., & Tartara, A.
(1997). Poor sleep in adolescents: a study of 869 17-year old Italian secondary school students. Journal of Sleep
Research, 6, 44–49.
McDonald, A. S. (2001). The prevalence and effects of test anxiety in school children. Educational Psychology, 21, 89–
101.
Meijer, A. M., Habekoth�e, H. T., & van den Wittenboer, G. L. H. (2000). Time in bed, quality of sleep and school
functioning of children. Journal of Sleep Research, 9, 145–153.
Meijer, A. M., Habekoth�e, H. T., & van den Wittenboer, G. L. H. (2001). Mental health, parental rules and sleep in pre-
adolescents. Journal of Sleep Research, 10, 297–302.
Mitru, G., Millrood, D. L., & Mateika, J. H. (2002). The impact of sleep on learning and behaviour in adolescents.
Teachers College Record, 104, 704–726.
Morrison, D. N., McGee, R., & Stanton, W. R. (1992). Sleep problems in adolescence. Journal of the American
Academy of Child and Adolescence Psychiatry, 31, 94–98.
Pilcher, J. J., & Huffcutt, A. I. (1996). Effects of sleep deprivation on performance: a meta-analysis. Sleep, 21, 861–867.
Randazzo, A. C., Muehlbach, M. J., Schweitzer, P. K., & Walsh, J. K. (1998). Cognitive function following acute sleep
restriction in children aged 10–14. Sleep, 8, 861–867.
Raven, J. C., Court, J. H., & Raven, J. (1988). Manual for Raven�s progressive matrices and vocabulary scales, standard
progressive matrices, section 3. London: Lewis & Co, LTD.
Sadeh, A., Gruber, R., & Raviv, A. (2003). The effects of sleep restriction and extension on school-age children: what a
difference an hour makes. Child Development, 74, 444–455.
Sadeh, A., Raviv, A., & Gruber, R. (2000). Sleep patterns and sleep disruptions in school-age children. Developmental
Psychology, 36, 291–301.
Steenari, M.-J., Vuontela, V., Paavonen, E. J., Carlson, S., Fj€allberg, M., & Aronen, E. T. (2003). Working memory
and sleep in 6- to 13-year-old schoolchildren. Journal of the American Academy of Child and Adolescence Psychiatry,
42, 85–92.
Totterdell, P., Reynolds, S., Parkinson, B., & Briner, R. B. (1994). Associations of sleep with everyday mood, minor
symptoms and social interaction experience. Sleep, 17, 466–475.
Tynj€al€a, J., Kannas, L., & V€alimaa, R. (1993). How young Europeans sleep. Health Education Research, 8, 69–80.
106 A.M. Meijer, G.L.H. van den Wittenboer / Personality and Individual Differences 37 (2004) 95–106
Van Dongen, H. P. A., Maislin, G., Mullington, J. M., & Dinges, D. F. (2003). The cumulative cost of additional
wakefulness: dose–response effects on neurobehavioral functions and sleep physiology from chronic sleep restriction
and total sleep deprivation. Sleep, 26, 117–126.
Vincent, N., & Walker, J. (2001). Anxiety sensitivity: predictor of sleep-related impairment and medication use in
chronic insomnia. Depression and Anxiety, 14, 238–243.
Wang, M. C., Haertel, G. D., & Walberg, H. J. (1990). What influences learning? A content analysis of review literature.
Journal of Educational Research, 84, 30–43.
Webb, S. P. M. (1992). Sleep, the gentle tyrant. Bolton, MA: Anker Publishing Company.
Wilkinson, R. (1968). Sleep deprivation: performance tests for partial and selective sleep deprivation. In B. Reiss & L.
Abt (Eds.), Progress in clinical psychology (Vol. 8, pp. 28–34). New York: Grune & Stratton.
Wolfson, A. R., & Carskadon, M. A. (1998). Sleep schedules and daytime functioning in adolescents. Child
Development, 69, 875–887.
Wolfson, A. R., Tzischinsky, O., Brown, C., Darley, C., Acebo, C., & Carskadon, M. (1995). Sleep, behavior, and stress
at the transition to senior high school. Journal of Sleep Research, 24, 115.
Zohar, D. (1998). An additive model of test anxiety: role of exam-specific expectations. Journal of Educational
Psychology, 90, 330–340.