the impacts of microfinance: a randomized evaluation of spandana’s program in hyderabad june 8,...
TRANSCRIPT

The Impacts of Microfinance: A Randomized Evaluation of
Spandana’s program in Hyderabad
June 8, 2009
Abhijit BanerjeeEsther Duflo
Rachel GlennersterCynthia Kinnan

The Question • The most visible anti-poverty innovation in past 20 years
• “There is mounting evidence that the availability of financial services for poor households - microfinance - can help achieve the MDGs.” – CGAP
• “Evidence for”– reduction in poverty &hunger– universal primary education– promotion of gender equality & empowerment of women– reduction of child mortality– improvement in maternal health
• “In twenty five years of academic and consulting work in local economic development, my experience has been that the microfinance programs often spell the death of the local economy.” Microfinance critic in FT
Why do we need an evaluation?
Microfinance supporters: people are borrowing and we are making money
Why do we need an evaluation?
No evaluation of apple-sellers. Why us?
Two answers:1. Microfinance is often subsidized, example: India
2. Self-control problems: loans can be tempting debt trap
Why do we need a randomized evaluation?
• Cannot compare recipients with non recipients– MFIs target the poor– More enterprising (or more short-sighted)
might self-select
• Cannot compare recipients before and after– these are potentially enterprising people
• Cannot compare trends for microfinance recipients and non-recipients– Morduch does this and finds a negative impact of
Grameen Bank
What do we already know?
• Much experimental work on how to make microfinance work better:– Group vs. individual liability (Giné and Karlan 2006)– Contract structure (Fischer 2008)– Repayment frequency (Field and Pande 2008)
• Non-experimental evidence on the intensive margin impact of microfinance (Kaboski and Townsend 2008)
• No randomized evaluations of the impact of microcredit• This study: answer some of the basic questions
– business creation– durable goods purchase– consumption smoothing– etc.
Outline
1. Overview of Spandana program and survey
2. What was the take up of microcredit?
3. What impacts of microcredit should we expect?
4. Impact results– Average impact of the program– Different impacts for different groups?– The impact of borrowing
5. Conclusion
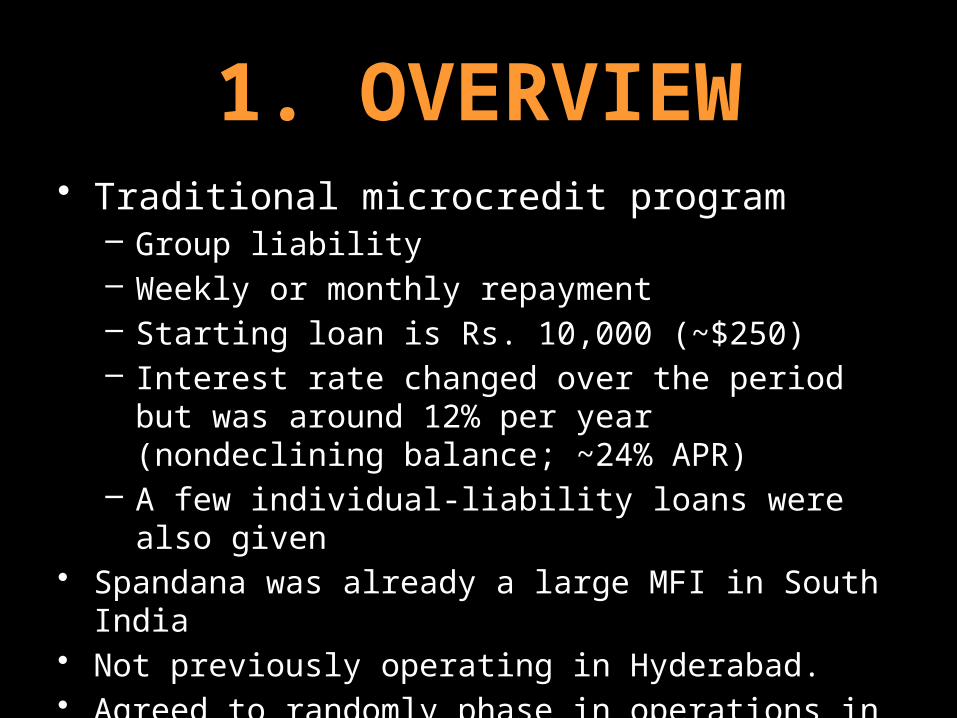
1. OVERVIEW• Traditional microcredit program
– Group liability– Weekly or monthly repayment– Starting loan is Rs. 10,000 (~$250)– Interest rate changed over the period but was around
12% per year (nondeclining balance; ~24% APR) – A few individual-liability loans were also given
• Spandana was already a large MFI in South India• Not previously operating in Hyderabad.• Agreed to randomly phase in operations in Hyderabad.
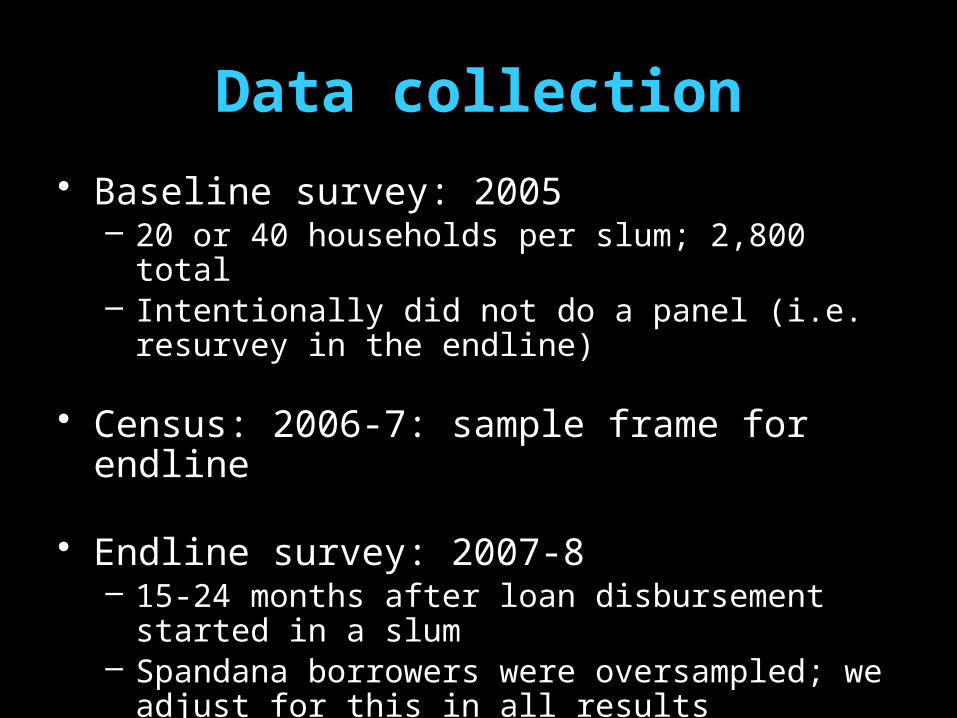
Data collection
• Baseline survey: 2005 – 20 or 40 households per slum; 2,800 total– Intentionally did not do a panel (i.e. resurvey in the
endline)
• Census: 2006-7: sample frame for endline
• Endline survey: 2007-8– 15-24 months after loan disbursement started in a
slum– Spandana borrowers were oversampled; we adjust for
this in all results
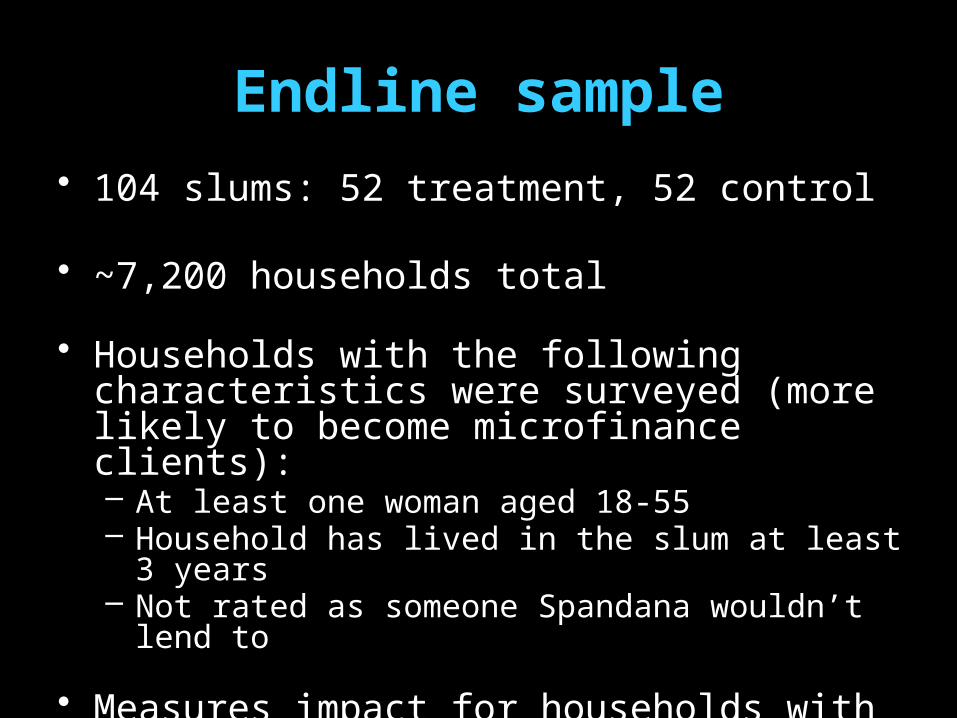
Endline sample
• 104 slums: 52 treatment, 52 control
• ~7,200 households total
• Households with the following characteristics were surveyed (more likely to become microfinance clients):– At least one woman aged 18-55– Household has lived in the slum at least 3 years– Not rated as someone Spandana wouldn’t lend to
• Measures impact for households with these characteristics– results for other types of households could be different
Outcomes
• Baseline and endline surveys:– Household debt– Consumption– Durable purchases
• businesses• household
– Business activities and profits– Decision-making (“empowerment”)– Education, health, etc.
Households at baseline
• Family of 5
• Monthly expenditure of ~Rs 5,000 (~$125)
• 98% of 7-11 year olds, 84% of 12-15 year olds in school
• Borrowing (from friends, moneylenders, etc.) is common (69% of households); average interest rate 3.85% per month
• Almost no MFI borrowing.
Entrepreneurship at baseline• 31% of the households run at least one small business
(vs. OECD average of 12%)– Of these, 9% of households run more than one business
• But these businesses had few…– Specialized skills (mostly general stores, tailors, fruit/vegetable
vendors) – Employees:
• Only 10% have any employees; none has more than 3– Assets
• 20% use no productive assets whatsoever.
• Scale of businesses:– Sales: Rs 13,000 (~$325) per month– Profits: Rs 3,040 (~$75) per month
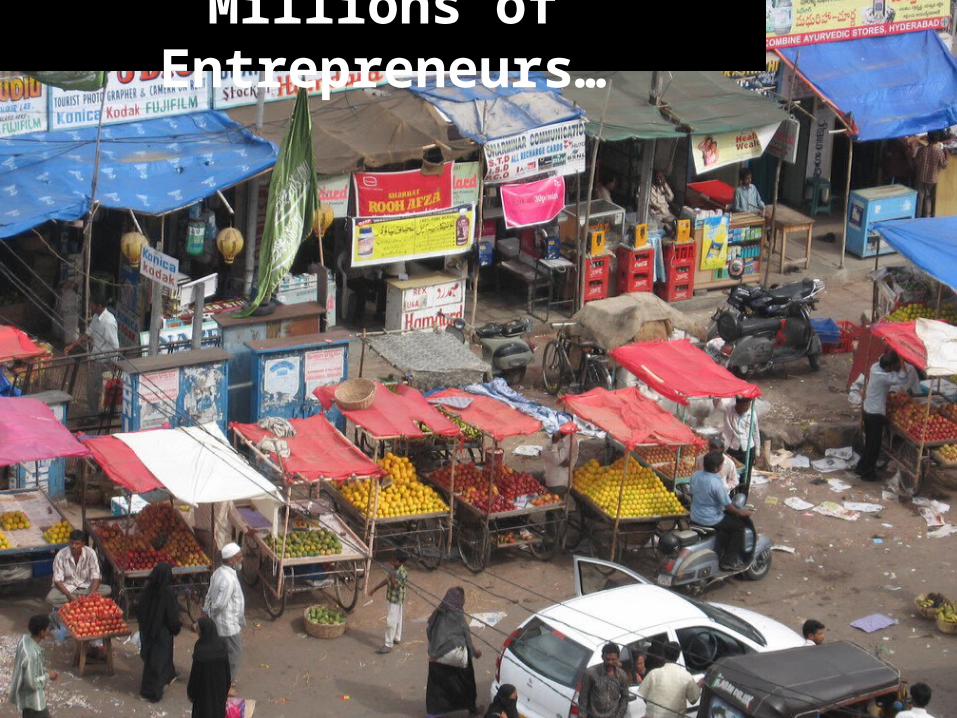
Millions of Entrepreneurs…
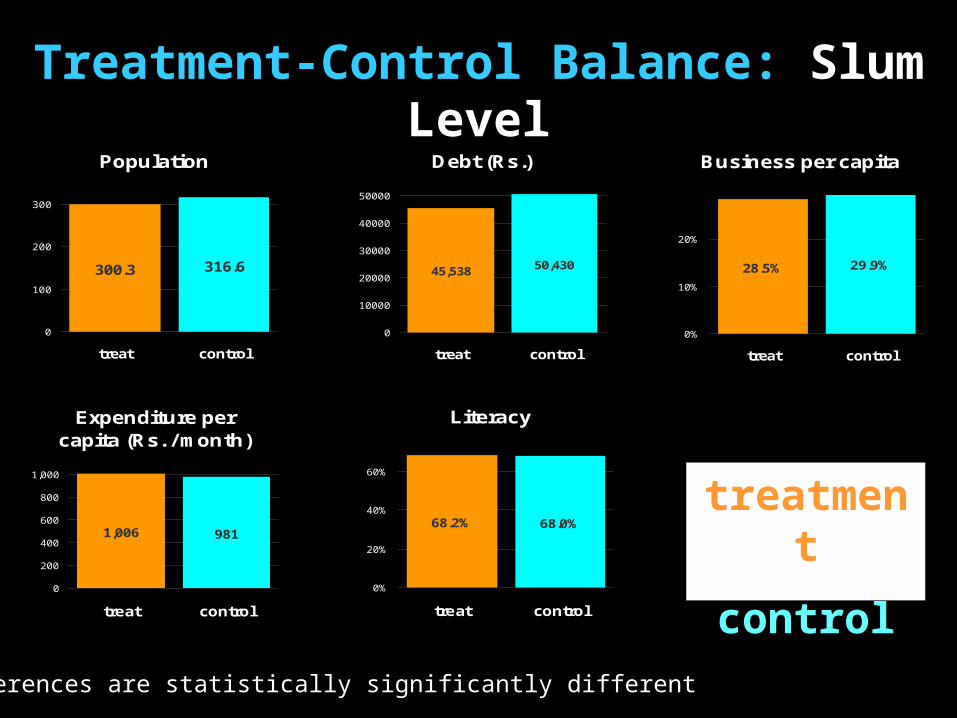
Treatment-Control Balance: Slum LevelPopulation
300.3 316.6
0
100
200
300
treat control
Debt (Rs.)
45,538 50,430
0
10000
20000
30000
40000
50000
treat control
Business per capita
28.5% 29.9%
0%
10%
20%
treat control
Expenditure per capita (Rs. / month)
1,006 981
0
200
400
600
800
1,000
treat control
Literacy
68.2% 68.0%
0%
20%
40%
60%
treat control
treatment
control
No differences are statistically significantly different
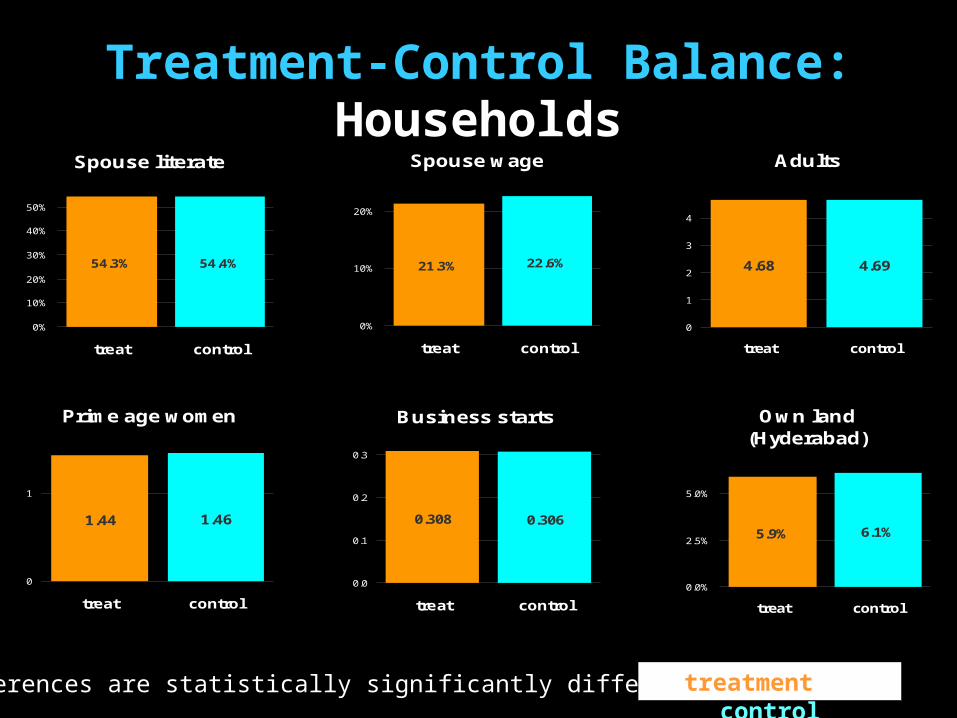
Treatment-Control Balance: Households
No differences are statistically significantly different
Spouse literate
54.3% 54.4%
0%
10%
20%
30%
40%
50%
treat control
Spouse wage
21.3% 22.6%
0%
10%
20%
treat control
Adults
4.68 4.69
0
1
2
3
4
treat control
Prime age women
1.44 1.46
0
1
treat control
Business starts
0.308 0.306
0.0
0.1
0.2
0.3
treat control
Own land (Hyderabad)
5.9% 6.1%
0.0%
2.5%
5.0%
treat control
treatment control
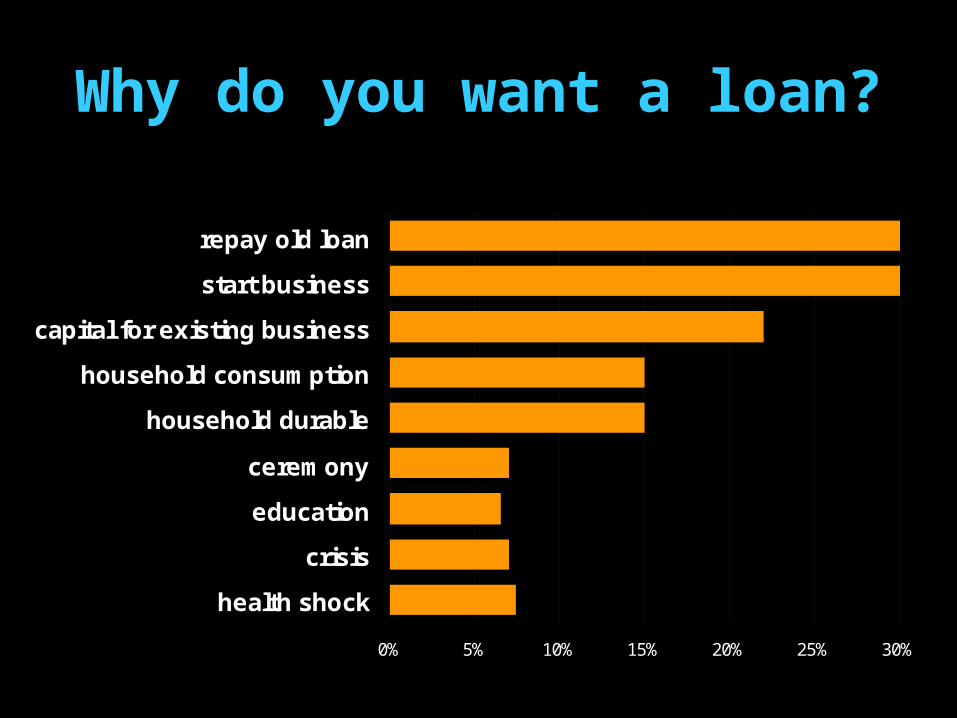
Why do you want a loan?
0% 5% 10% 15% 20% 25% 30%
health shock
crisis
education
ceremony
household durable
household consumption
capital for existing business
start business
repay old loan
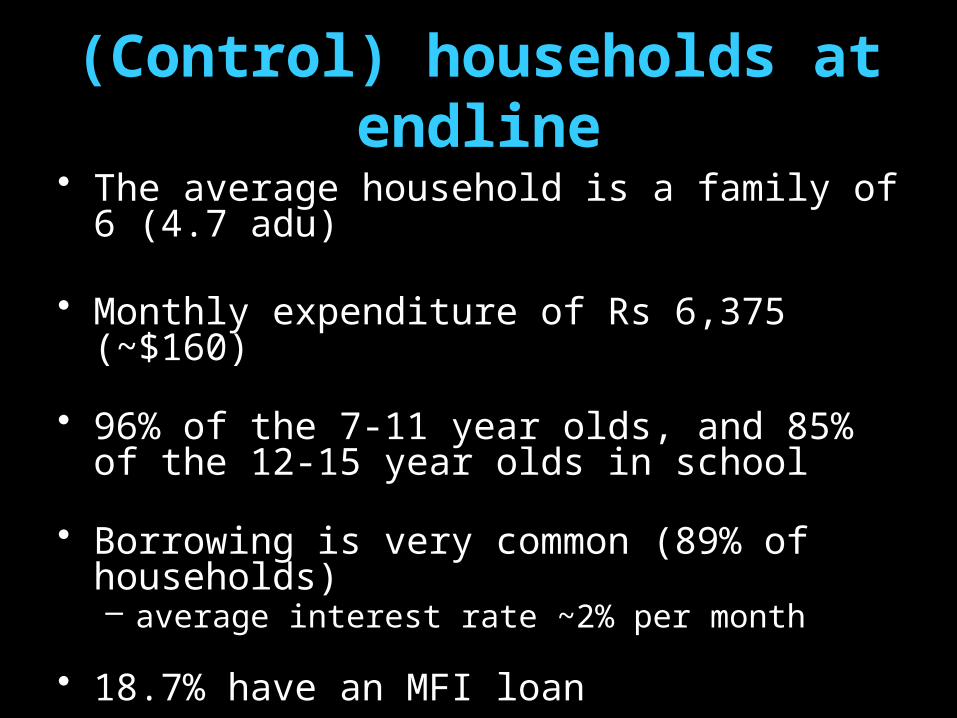
(Control) households at endline
• The average household is a family of 6 (4.7 adu)
• Monthly expenditure of Rs 6,375 (~$160)
• 96% of the 7-11 year olds, and 85% of the 12-15 year olds in school
• Borrowing is very common (89% of households)– average interest rate ~2% per month
• 18.7% have an MFI loan
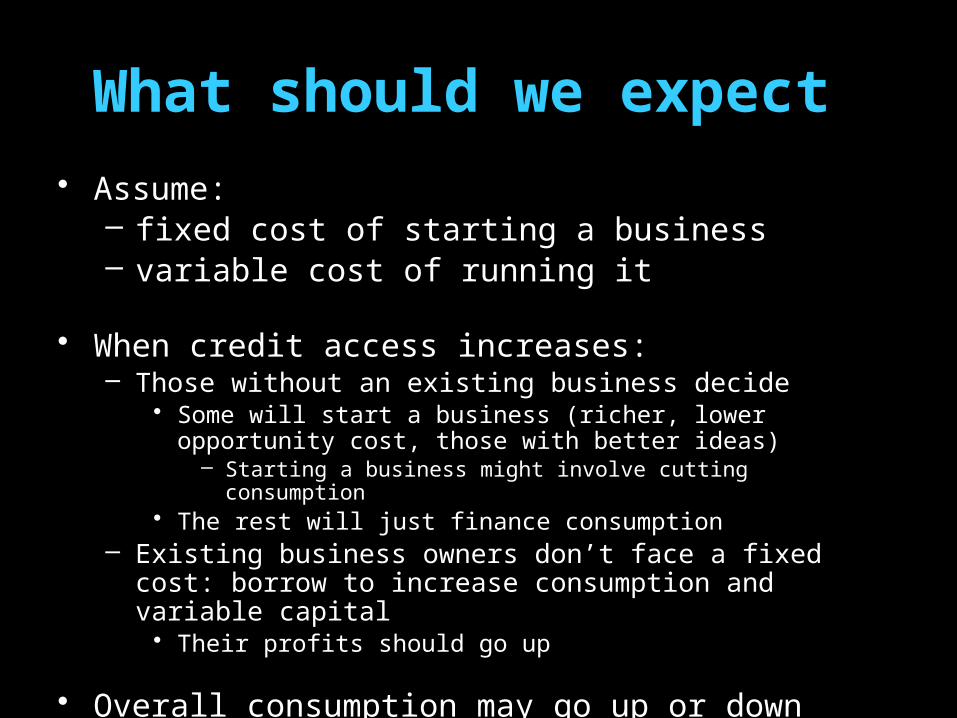
What should we expect
• Assume: – fixed cost of starting a business– variable cost of running it
• When credit access increases:– Those without an existing business decide
• Some will start a business (richer, lower opportunity cost, those with better ideas)
– Starting a business might involve cutting consumption• The rest will just finance consumption
– Existing business owners don’t face a fixed cost: borrow to increase consumption and variable capital
• Their profits should go up
• Overall consumption may go up or down
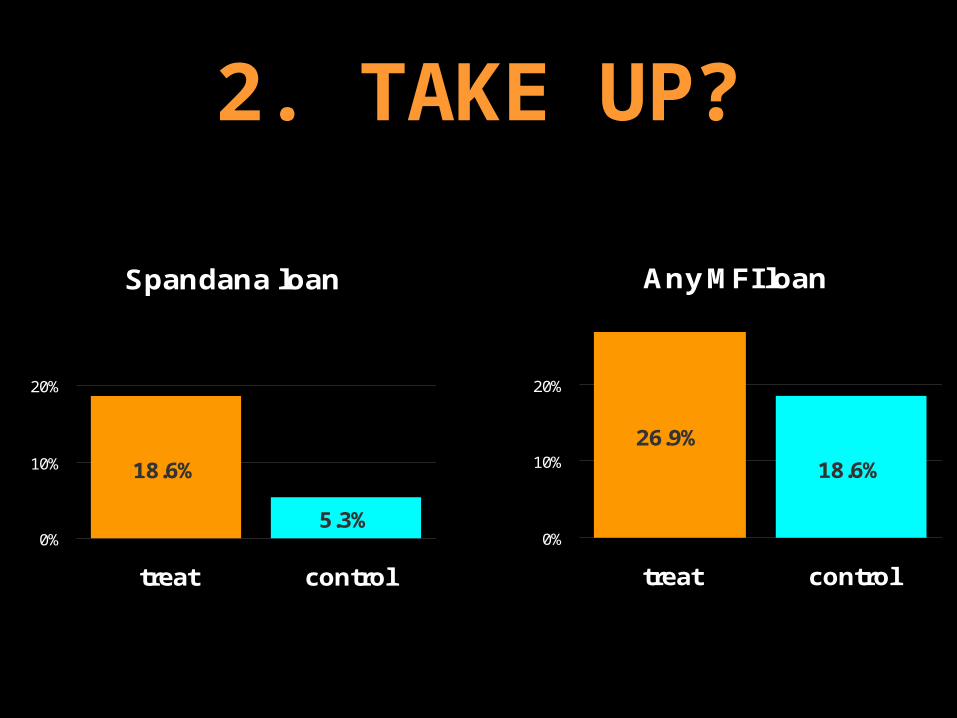
2. TAKE UP?
Any MFI loan
26.9%
18.6%
0%
10%
20%
treat control
Spandana loan
18.6%
5.3%0%
10%
20%
treat control
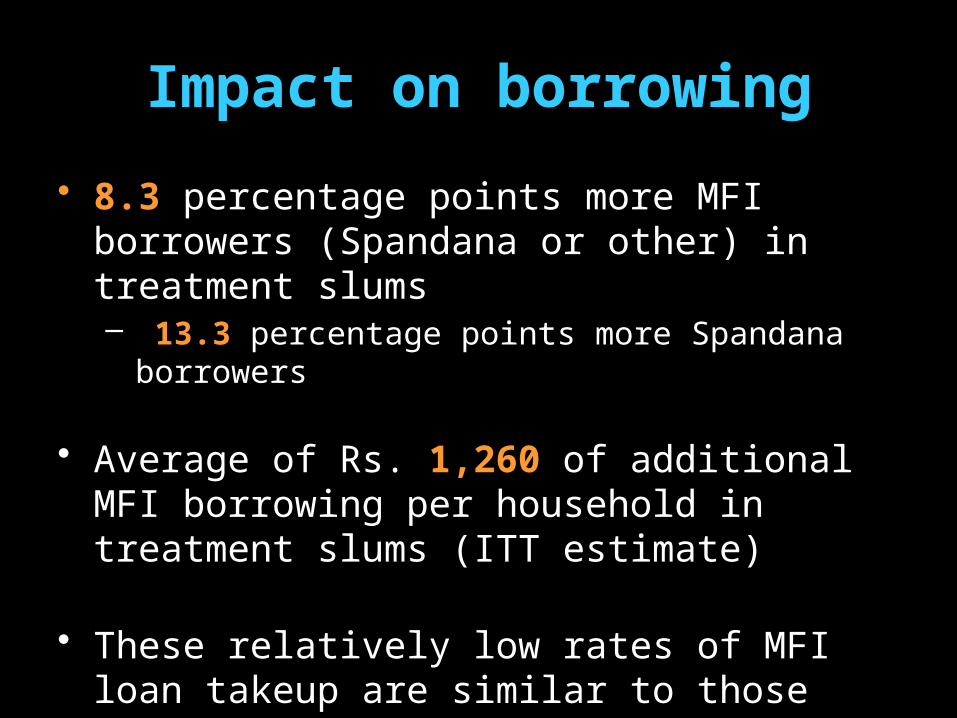
Impact on borrowing
• 8.3 percentage points more MFI borrowers (Spandana or other) in treatment slums– 13.3 percentage points more Spandana borrowers
• Average of Rs. 1,260 of additional MFI borrowing per household in treatment slums (ITT estimate)
• These relatively low rates of MFI loan takeup are similar to those found in other J-PAL projects.
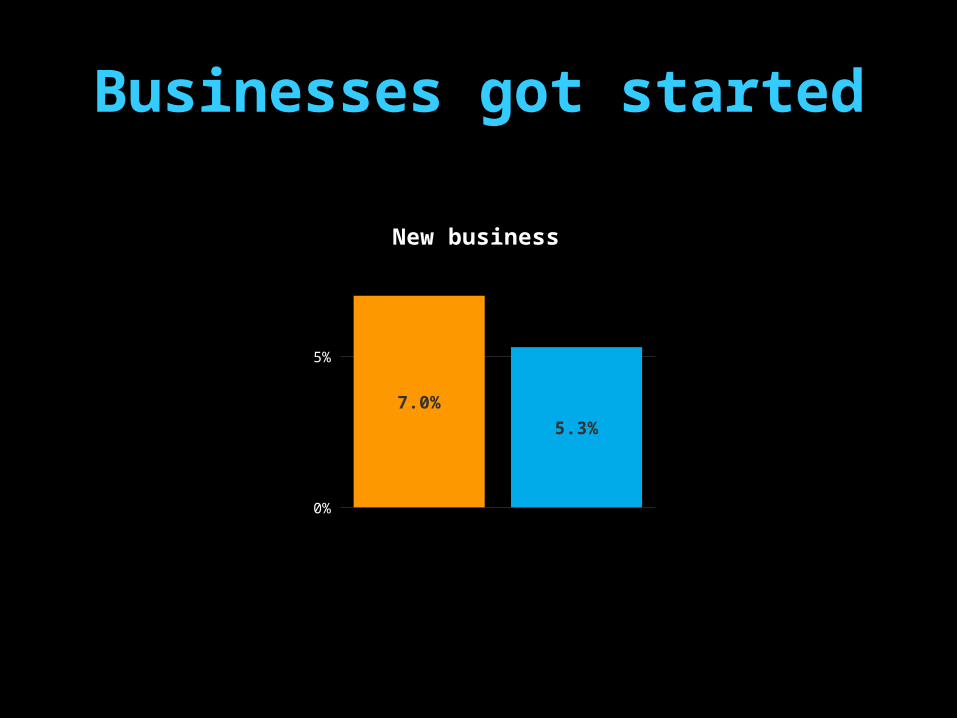
Businesses got started
0%
5%
7.0%
5.3%
New business
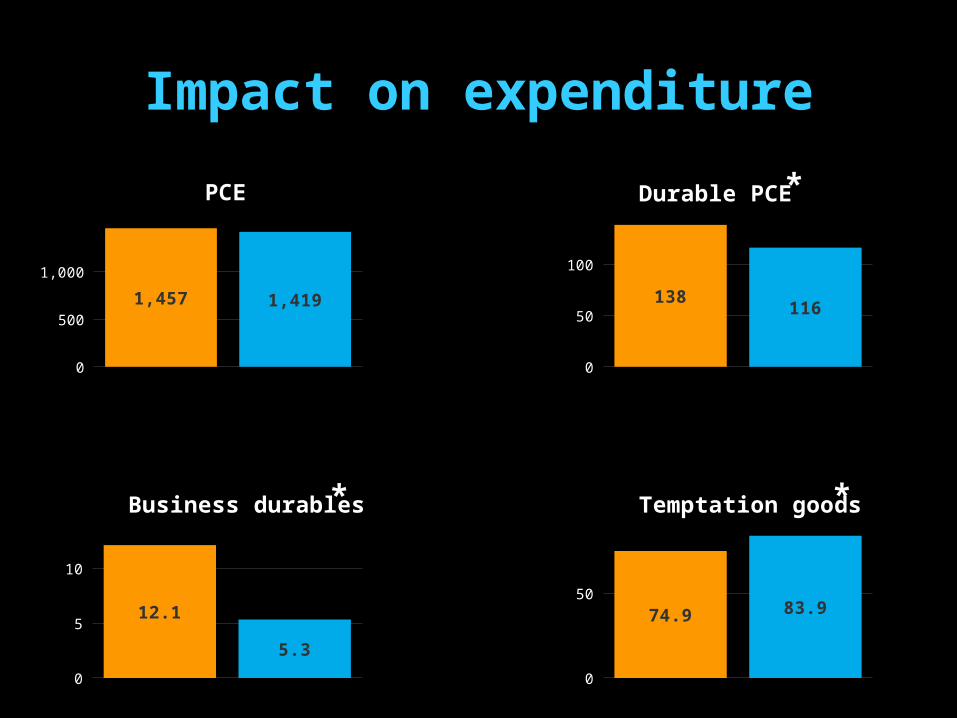
Impact on expenditure
0
500
1,000
1,457 1,419
PCE
0
50
100
138116
Durable PCE
0
5
10
12.1
5.3
Business durables
0
50
74.9 83.9
Temptation goods
*
**
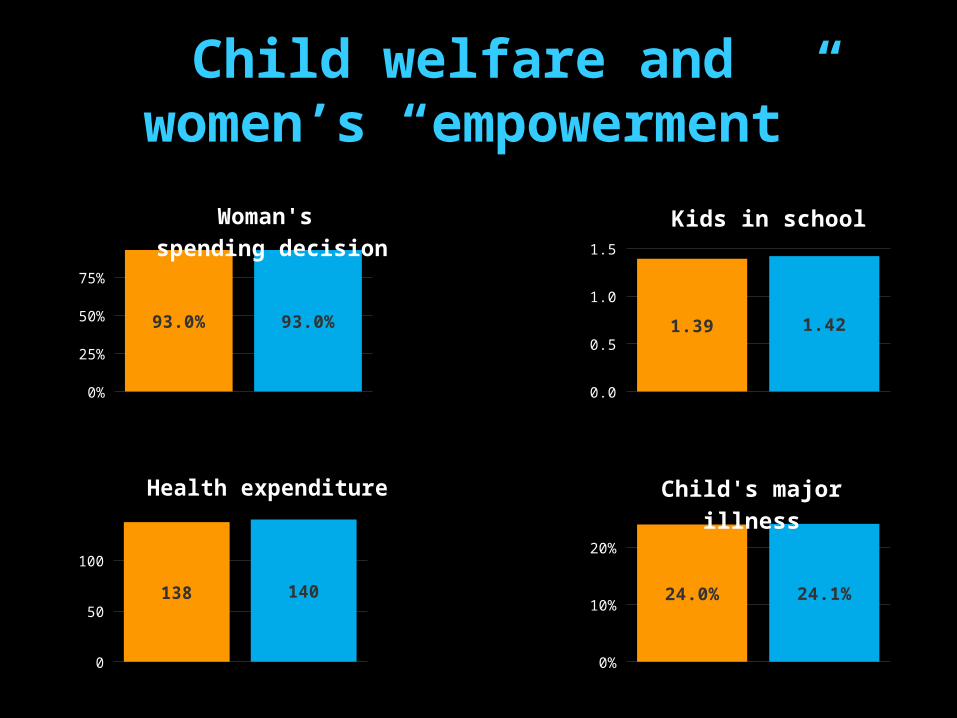
Child welfare and women’s “empowerment”
0%
25%
50%
75%
93.0% 93.0%
Woman's spending decision
0
50
100
138 140
Health expenditure
0%
10%
20%
24.0% 24.1%
Child's major illness
0.0
0.5
1.0
1.5
1.39 1.42
Kids in school
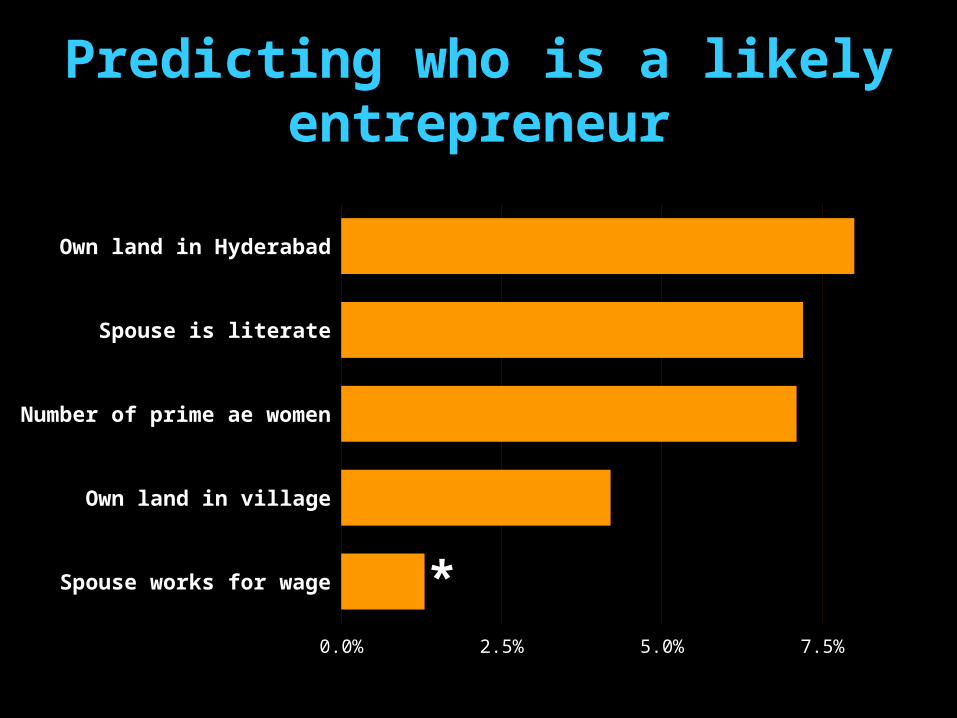
Predicting who is a likely entrepreneur
Spouse works for wage
Own land in village
Number of prime ae women
Spouse is literate
Own land in Hyderabad
0.0% 2.5% 5.0% 7.5%
*
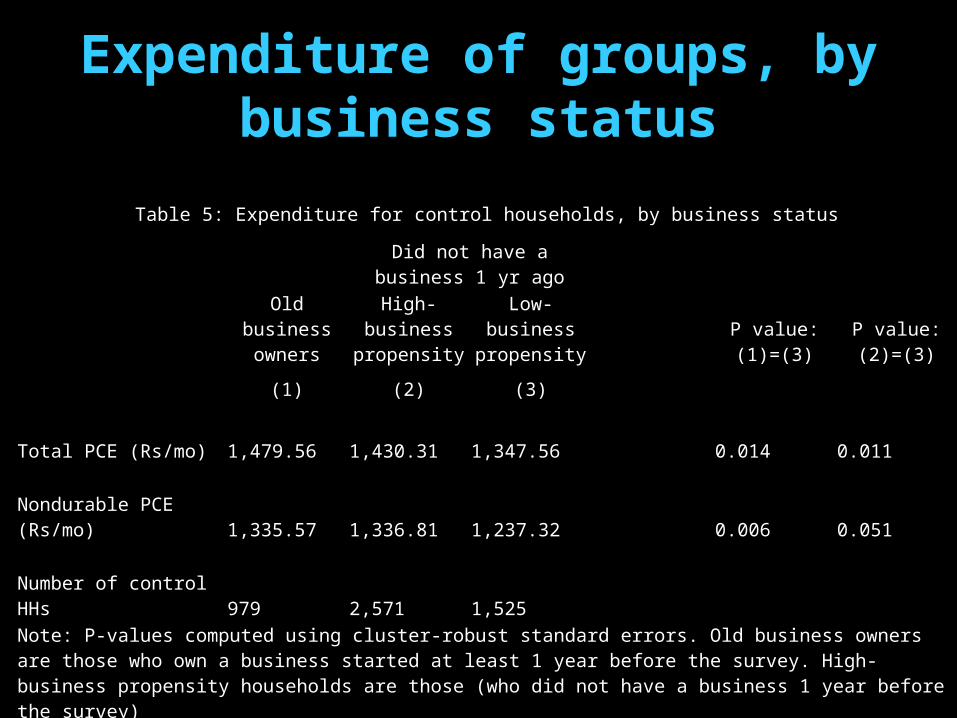
Expenditure of groups, by business status
Table 5: Expenditure for control households, by business status
Did not have a business 1 yr
ago
Old business owners
High-business propensity
Low-business propensity
P value: (1)=(3)
P value: (2)=(3)
(1) (2) (3)
Total PCE (Rs/mo) 1,479.56 1,430.31 1,347.56 0.014 0.011
Nondurable PCE (Rs/mo) 1,335.57 1,336.81 1,237.32 0.006 0.051
Number of control HHs 979 2,571 1,525
Note: P-values computed using cluster-robust standard errors. Old business owners are those who own a business started at least 1 year before the survey. High-business propensity households are those (who did not have a business 1 year before the survey)
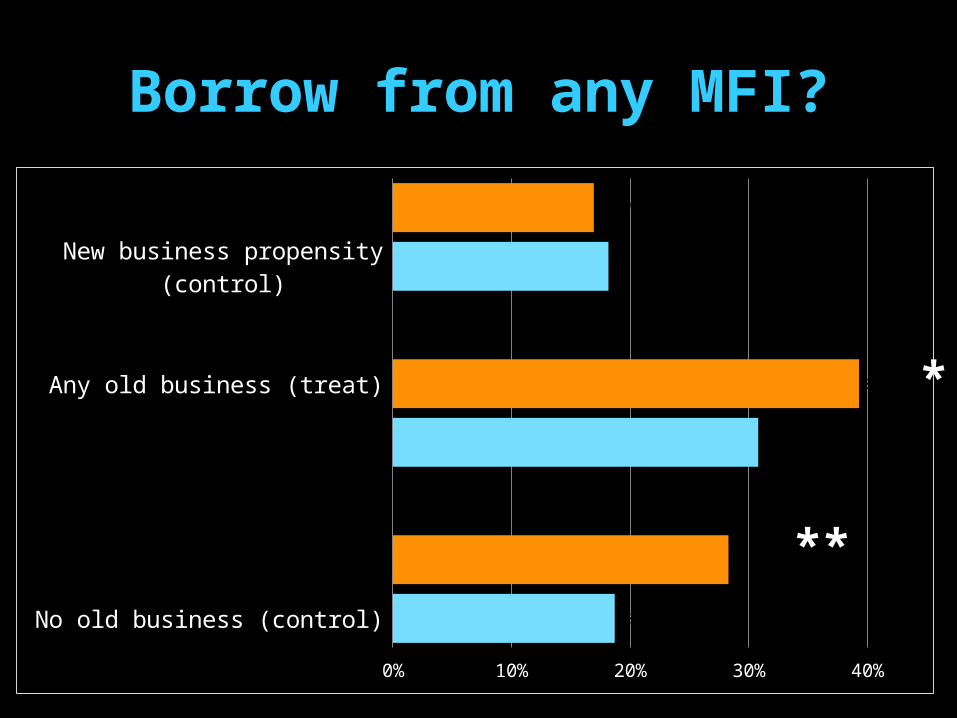
Borrow from any MFI?
No old business (control)
No old business (treat)
Any old business (control)
Any old business (treat)
New business propensity (control)
New business propensity (treat)
0% 10% 20% 30% 40%
18.7%
28.3%
30.8%
39.3%
18.2%
16.9%
**
*
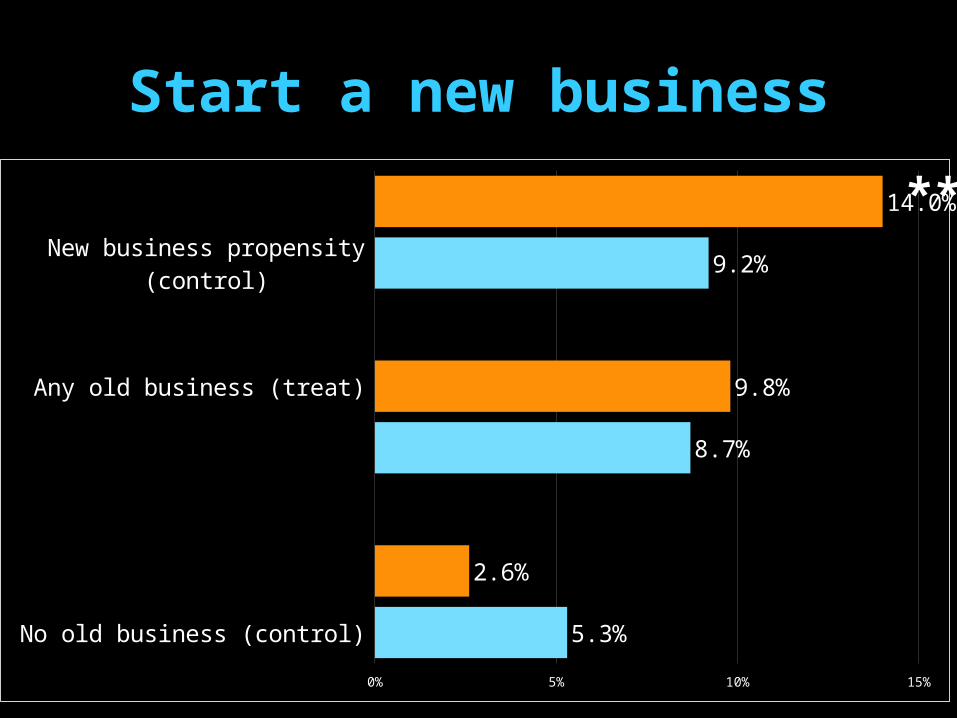
Start a new business
No old business (control)
No old business (treat)
Any old business (control)
Any old business (treat)
New business propensity (control)
New business propensity (treat)
0% 5% 10% 15%
5.3%
2.6%
8.7%
9.8%
9.2%
14.0%**
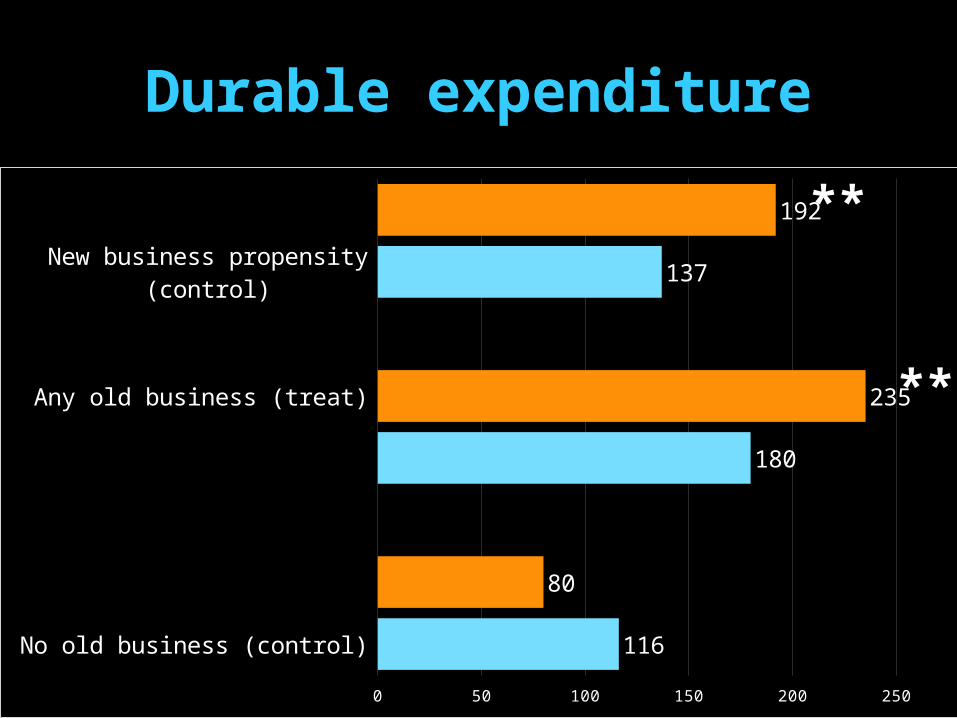
Durable expenditure
No old business (control)
No old business (treat)
Any old business (control)
Any old business (treat)
New business propensity (control)
New business propensity (treat)
0 50 100 150 200 250
116
80
180
235
137
192 **
**
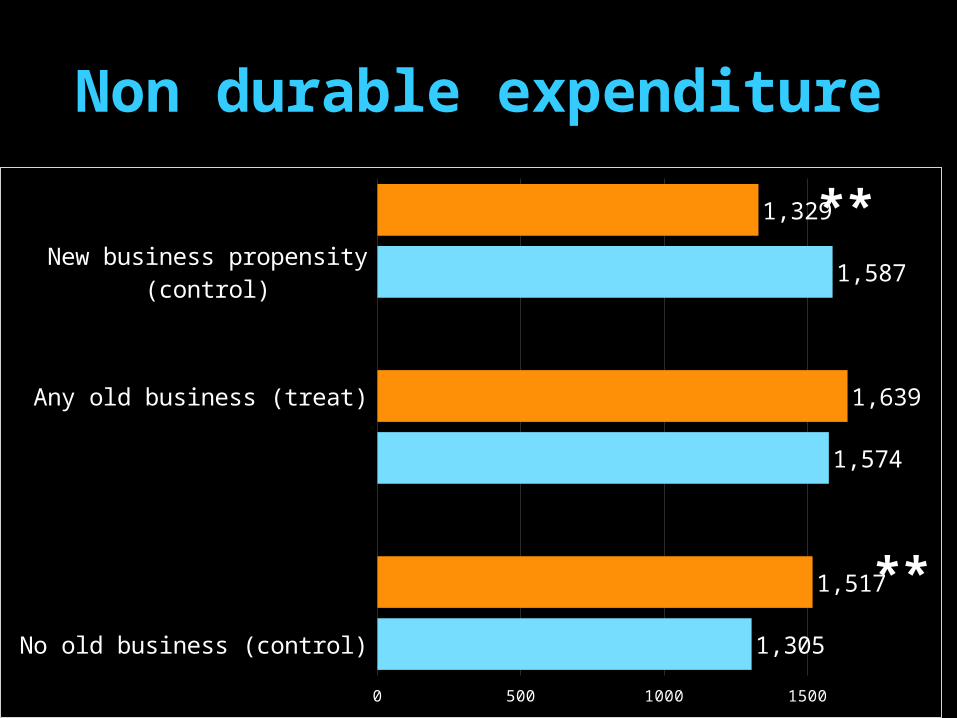
Non durable expenditure
No old business (control)
No old business (treat)
Any old business (control)
Any old business (treat)
New business propensity (control)
New business propensity (treat)
0 500 1000 1500
1,305
1,517
1,574
1,639
1,587
1,329 **
**
Temptation
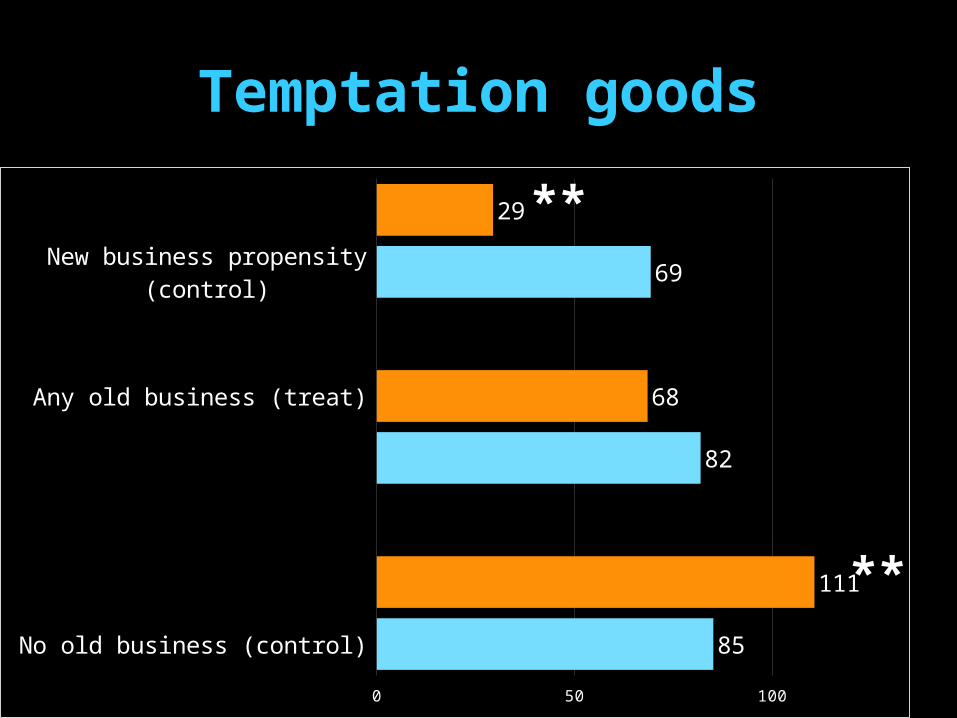
Temptation goods
No old business (control)
No old business (treat)
Any old business (control)
Any old business (treat)
New business propensity (control)
New business propensity (treat)
0 50 100
85
111
82
68
69
29 **
**
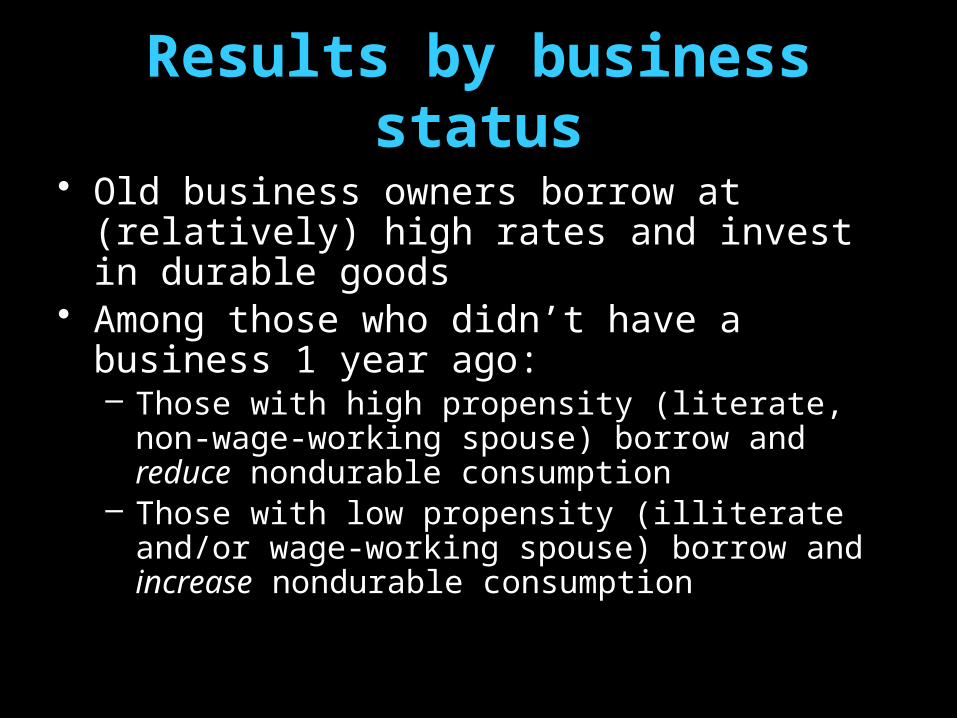
Results by business status
• Old business owners borrow at (relatively) high rates and invest in durable goods
• Among those who didn’t have a business 1 year ago:– Those with high propensity (literate, non-wage-
working spouse) borrow and reduce nondurable consumption
– Those with low propensity (illiterate and/or wage-working spouse) borrow and increase nondurable consumption
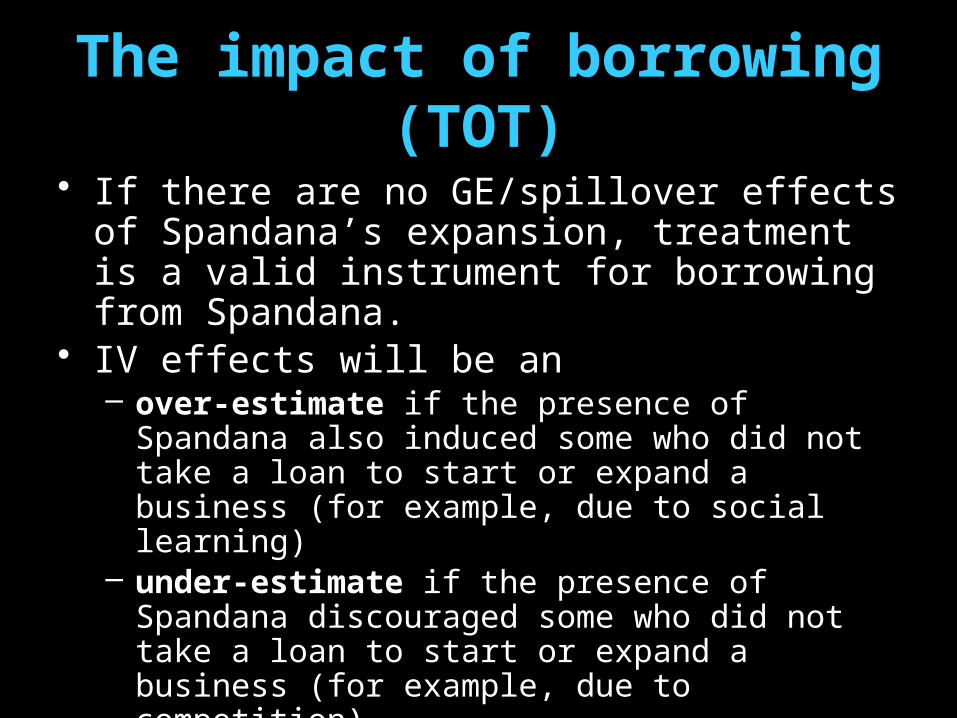
The impact of borrowing (TOT)
• If there are no GE/spillover effects of Spandana’s expansion, treatment is a valid instrument for borrowing from Spandana.
• IV effects will be an – over-estimate if the presence of Spandana also
induced some who did not take a loan to start or expand a business (for example, due to social learning)
– under-estimate if the presence of Spandana discouraged some who did not take a loan to start or expand a business (for example, due to competition)
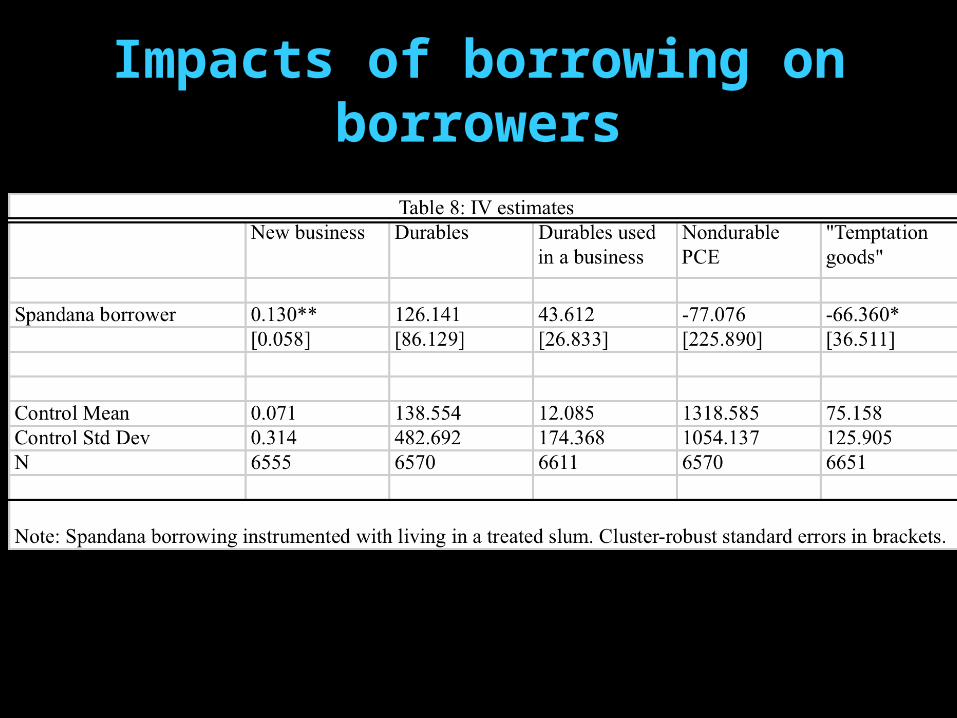
Impacts of borrowing on borrowers
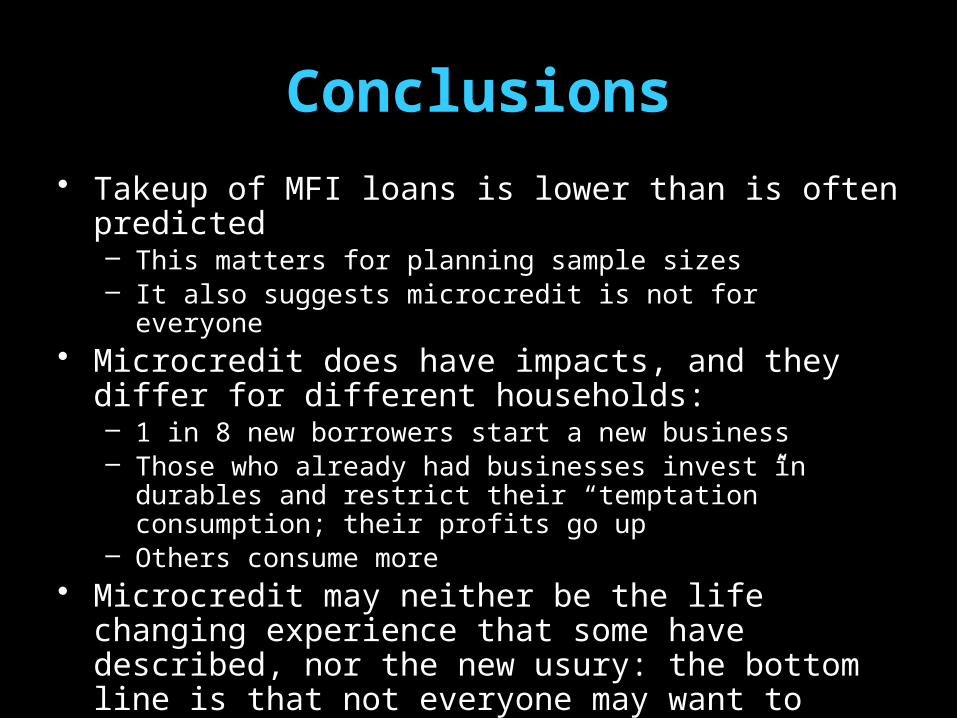
Conclusions
• Takeup of MFI loans is lower than is often predicted– This matters for planning sample sizes– It also suggests microcredit is not for everyone
• Microcredit does have impacts, and they differ for different households: – 1 in 8 new borrowers start a new business– Those who already had businesses invest in durables and
restrict their “temptation” consumption; their profits go up– Others consume more
• Microcredit may neither be the life changing experience that some have described, nor the new usury: the bottom line is that not everyone may want to become an entrepreneur.