the impact of land use/land cover changes on land degradation dynamics: a mediterranean case study
TRANSCRIPT
The Impact of Land Use/Land Cover Changes on LandDegradation Dynamics: A Mediterranean Case Study
S. Bajocco • A. De Angelis • L. Perini •
A. Ferrara • L. Salvati
Received: 10 August 2010 / Accepted: 25 January 2012 / Published online: 15 March 2012
� Springer Science+Business Media, LLC 2012
Abstract In the last decades, due to climate changes, soil
deterioration, and Land Use/Land Cover Changes (LUL-
CCs), land degradation risk has become one of the most
important ecological issues at the global level. Land deg-
radation involves two interlocking systems: the natural
ecosystem and the socio-economic system. The complexity
of land degradation processes should be addressed using a
multidisciplinary approach. Therefore, the aim of this work
is to assess diachronically land degradation dynamics
under changing land covers. This paper analyzes LULCCs
and the parallel increase in the level of land sensitivity to
degradation along the coastal belt of Sardinia (Italy), a
typical Mediterranean region where human pressure affects
the landscape characteristics through fires, intensive agri-
cultural practices, land abandonment, urban sprawl, and
tourism concentration. Results reveal that two factors
mainly affect the level of land sensitivity to degradation in
the study area: (i) land abandonment and (ii) unsustainable
use of rural and peri-urban areas. Taken together, these
factors represent the primary cause of the LULCCs
observed in coastal Sardinia. By linking the structural
features of the Mediterranean landscape with its functional
land degradation dynamics over time, these results con-
tribute to orienting policies for sustainable land manage-
ment in Mediterranean coastal areas.
Keywords Land sensitivity � Land management � Coastal
area � Multi-temporal land cover maps � Sardinia � Italy
Introduction
Land degradation is becoming one of the major environ-
mental issues all over the world and affects also developed
regions like North America, Australia and Southern Europe
(Romm 2011). Land degradation is hence an interactive
process involving multiple causal factors, among which
climate variability, soil quality, and land management play
a significant role (Lambin and others 2001; Reynolds and
Stafford Smith 2002; Geist and Lambin 2004). In the
Mediterranean region, both biophysical variables and
socioeconomic conditions affect land quality, and their
interaction may become extremely complex through space
and time, resulting in typical land degradation patterns
(UNEP 1994; MEA 2005a, b).
In the present study, land degradation is considered as a
process occurring not only in semi-natural areas, but also in
agricultural and peri-urban lands (Bajocco and others
2011). For instance, besides soil erosion, the major land
degradation processes in the Mediterranean basin are soil
sealing, compaction mainly due to agricultural intensifi-
cation, salinization, and contamination due to industrial
activities (Montanarella 2007). Agropastoralism is con-
sidered one of the most important land degradation driving
forces as it acts both directly (e.g., overgrazing) and indi-
rectly generating land cover changes to create new pastures
(Harrington 1981; Valentine 1990; Margaris 1992) and
S. Bajocco (&) � A. De Angelis � L. Perini
Unit for Climatology and Meteorology in Agriculture
(CRA-CMA), Italian National Agricultural Research Council,
Via del Caravita 7a, 00186 Rome, RM, Italy
e-mail: [email protected]
A. Ferrara
Department of Crop Science, University of Basilicata,
Via dell’Ateneo Lucano, Potenza, PZ, Italy
L. Salvati
Centre for Soil-Plant Relationships (CRA-RPS), Italian National
Agricultural Research Council, Via della Navicella 2-4,
00184 Rome, RM, Italy
123
Environmental Management (2012) 49:980–989
DOI 10.1007/s00267-012-9831-8
promoting mechanical tillage to improve forage production
(Perez-Trejo 1994). This is particularly true in specified
Mediterranean areas, such as southern Spain, Sardinia,
Crete, and the Aegean islands, which suffer from long-term
human pressure (e.g., Marathianou and others 2000).
Ancillary land degradation drivers include drought, the
natural or human-induced reduction in vegetation cover,
poor agricultural practices determining soil organic matter
losses, as well as irrational irrigation practices leading to
salinization, which are all factors contributing to increasing
the level of land degradation sensitivity of a region
(Symeonakis and Drake 2004).
In the past, the impact of human activities on the Medi-
terranean landscapes has increased considerably causing,
among others, biodiversity loss, deforestation, and soil ero-
sion (Giordano and Marini 2008). Land Use/Land Cover
Changes (LULCCs) represent one of the most important
consequences of the increasing human pressure (e.g., Con-
acher and Sala 1998), since reflect changes in both the rural
system (e.g., crop intensification vs extensification) and set-
tlement patterns (e.g., littoralisation vs inland depopulation
with the consequent abandonment of cultivated land).
It has been widely studied and demonstrated that during
the last decades the Mediterranean region underwent major
LULCCs as a result of the relocation of people to the
coastal border, forest fires, the abandonment of farms and
grazing land, the rapid expansion of tourism-related
activities, urbanization, deforestation, as well as the
intensification of agriculture (Balabanis and others 2000;
Burke and Thornes 2004; Bonet 2004; Sluiter and de Jong
2007). Many studies demonstrated that LULCCs affect the
level of land sensitivity to degradation often accelerating
land degradation processes (Burke and Thornes 2004;
Drake and Vafeidis 2003; Symeonakis and others 2007).
Examples of the existing nexus between LULCCs and land
degradation sensitivity include
(i) crop intensification determining soil pollution due to
an increase in fertilizer use;
(ii) land abandonment leading to unmanaged vegetation
prone to fire and favoring soil erosion;
(iii) urbanization favoring soil sealing and the consequent
alteration of the hydrogeological cycle; and
(iv) deforestation causing biodiversity loss and habitat
fragmentation.
The European Environmental Agency (2006) published
a well-known report focusing on LULCCs in the Medi-
terranean region. According to this study, population den-
sity on coastal areas is on average 10% higher than inland,
reaching a peak of 50% in some countries. Even more
worrying is the conversion rate of natural coastal areas into
artificial ones, being faster than population increase (Alves
and others 2007). In Italy, especially in southern Italy, this
process impacts on dry landscapes determining loss of
natural areas and biodiversity, soil deterioration, and the
consequent decrease in land productivity and quality
(Salvati and Zitti 2008).
The aim of this study is therefore to analyze main land
degradation processes through the evaluation of the rela-
tionship between LULCCs and land degradation over a
Mediterranean coastal area using multitemporal land cover
(LACOAST (LC) and CORINE Land Cover map (CLC)) and
diachronic land sensitivity maps (according to Environ-
mental Sensitive Areas (ESA) procedure (e.g., Brandt 2005))
within a Geographic Information System (GIS) framework.
In particular, this paper focuses on the coastal area of Sardinia
(Italy), a typical Mediterranean region characterized by
natural and human pressures, including planning deregula-
tion, coastal erosion, tourism concentration, and pressing
urbanization. The methodology illustrated in this paper,
based on modest data requirements and a readily imple-
mented procedure, is a useful tool supporting regional plan-
ning and land management in Mediterranean drylands.
Methodology of the Study
Outline of the Methodology
As clearly stated by Thornes (2004), Otto and others (2007),
and Symeonakis and others (2007), the study of LULCCs
trajectories may provide a meaningful contribution to the
land degradation assessment. This is particularly true in the
Mediterranean region where land degradation is not only
driven by climate change (like in several other regions in
the world, see Sivakumar 2007 for a review), but it depends
specifically on anthropogenic processes (see Wilson and
Juntti 2005). Although a number of EU-funded projects
concentrated on the interrelation between LULCCs and
land degradation (Burke and Thornes 2004), they rarely
referred to land degradation as a dynamic process (Hawkes
2004). Assessing LULCCs trends and determining their
possible impact on the changing level of land sensitivity to
degradation is a relatively new research topic with crucial
policy implications (Geist and Lambin 2004; Otto and
others 2007; Symeonakis and others 2007). As far as we
know, there is no methodology of how to use LULCCs
analysis to assess changes in land degradation sensitivity.
The present study contributes to this deserving need.
Study Area and Data Sets
The Study Area
Sardinia is the second largest island in the Mediterranean
Sea, with an area of roughly 24,000 km2
. It is situated
Environmental Management (2012) 49:980–989 981
123
between 38�510 and 41�150 latitude north and 8�80 and
9�500 east longitude and is one of the twenty Italian
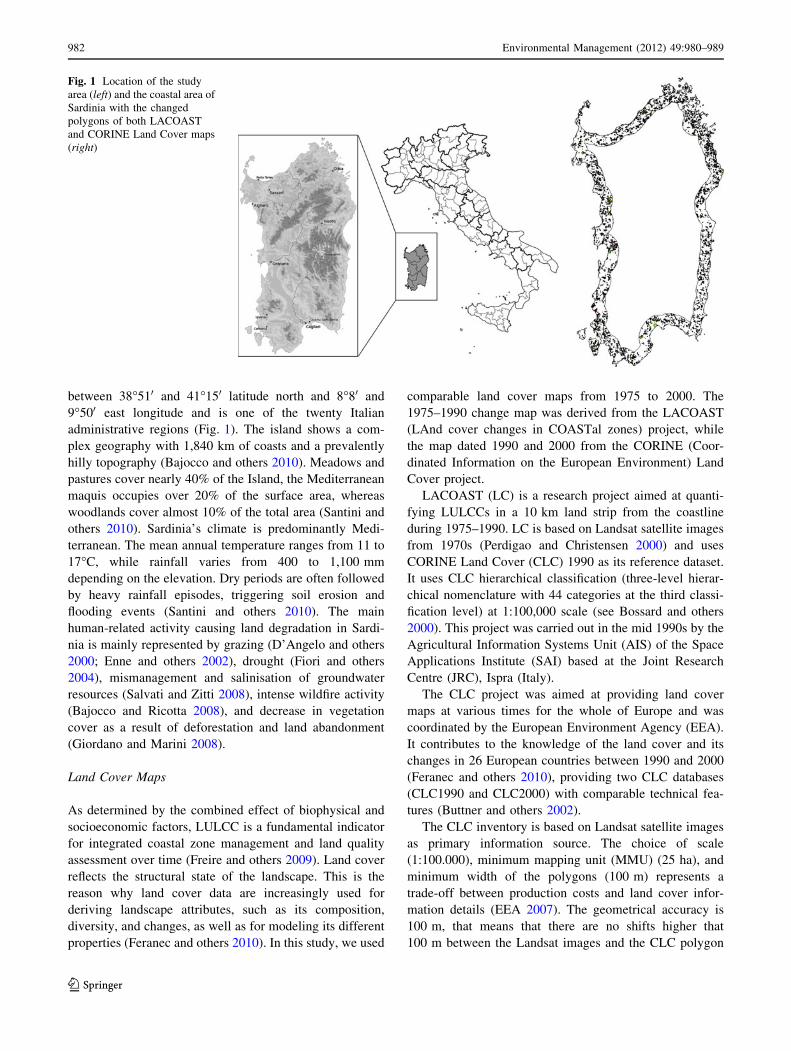
administrative regions (Fig. 1). The island shows a com-
plex geography with 1,840 km of coasts and a prevalently
hilly topography (Bajocco and others 2010). Meadows and
pastures cover nearly 40% of the Island, the Mediterranean
maquis occupies over 20% of the surface area, whereas
woodlands cover almost 10% of the total area (Santini and
others 2010). Sardinia’s climate is predominantly Medi-
terranean. The mean annual temperature ranges from 11 to
17�C, while rainfall varies from 400 to 1,100 mm
depending on the elevation. Dry periods are often followed
by heavy rainfall episodes, triggering soil erosion and
flooding events (Santini and others 2010). The main
human-related activity causing land degradation in Sardi-
nia is mainly represented by grazing (D’Angelo and others
2000; Enne and others 2002), drought (Fiori and others
2004), mismanagement and salinisation of groundwater
resources (Salvati and Zitti 2008), intense wildfire activity
(Bajocco and Ricotta 2008), and decrease in vegetation
cover as a result of deforestation and land abandonment
(Giordano and Marini 2008).
Land Cover Maps
As determined by the combined effect of biophysical and
socioeconomic factors, LULCC is a fundamental indicator
for integrated coastal zone management and land quality
assessment over time (Freire and others 2009). Land cover
reflects the structural state of the landscape. This is the
reason why land cover data are increasingly used for
deriving landscape attributes, such as its composition,
diversity, and changes, as well as for modeling its different
properties (Feranec and others 2010). In this study, we used
comparable land cover maps from 1975 to 2000. The
1975–1990 change map was derived from the LACOAST
(LAnd cover changes in COASTal zones) project, while
the map dated 1990 and 2000 from the CORINE (Coor-
dinated Information on the European Environment) Land
Cover project.
LACOAST (LC) is a research project aimed at quanti-
fying LULCCs in a 10 km land strip from the coastline
during 1975–1990. LC is based on Landsat satellite images
from 1970s (Perdigao and Christensen 2000) and uses
CORINE Land Cover (CLC) 1990 as its reference dataset.
It uses CLC hierarchical classification (three-level hierar-
chical nomenclature with 44 categories at the third classi-
fication level) at 1:100,000 scale (see Bossard and others
2000). This project was carried out in the mid 1990s by the
Agricultural Information Systems Unit (AIS) of the Space
Applications Institute (SAI) based at the Joint Research
Centre (JRC), Ispra (Italy).
The CLC project was aimed at providing land cover
maps at various times for the whole of Europe and was
coordinated by the European Environment Agency (EEA).
It contributes to the knowledge of the land cover and its
changes in 26 European countries between 1990 and 2000
(Feranec and others 2010), providing two CLC databases
(CLC1990 and CLC2000) with comparable technical fea-
tures (Buttner and others 2002).
The CLC inventory is based on Landsat satellite images
as primary information source. The choice of scale
(1:100.000), minimum mapping unit (MMU) (25 ha), and
minimum width of the polygons (100 m) represents a
trade-off between production costs and land cover infor-
mation details (EEA 2007). The geometrical accuracy is
100 m, that means that there are no shifts higher that
100 m between the Landsat images and the CLC polygon
Fig. 1 Location of the study
area (left) and the coastal area of
Sardinia with the changed
polygons of both LACOAST
and CORINE Land Cover maps
(right)
982 Environmental Management (2012) 49:980–989
123
edges. These basic variables are the same for CLC1990 and
CLC2000. The standard CLC nomenclature includes 44
land cover classes and it is standardized for all of Europe
which makes comparison and aggregation at the European
level easier. The classes are grouped in a three-level hier-
archy (Table 1). The five main (level-one) categories are:
(i) artificial surfaces, (ii) agricultural areas, (iii) forests and
semi-natural areas, (iv) wetlands, and (v) water bodies.
The approach of computer assisted visual interpretation
of satellite images was chosen as the CLC mapping
methodology. Raw satellite images were pre-processed and
enhanced to yield a geometrically correct document in
national projection. Ortho-corrected Landsat satellite ima-
ges were provided with an RMSE error below 25 m.
Detailed topographic maps and in some cases orthophotos
were used to achieve this accuracy. Geospatial information
were validated in the field according to sampling proce-
dures. The main CLC technical characteristics are sum-
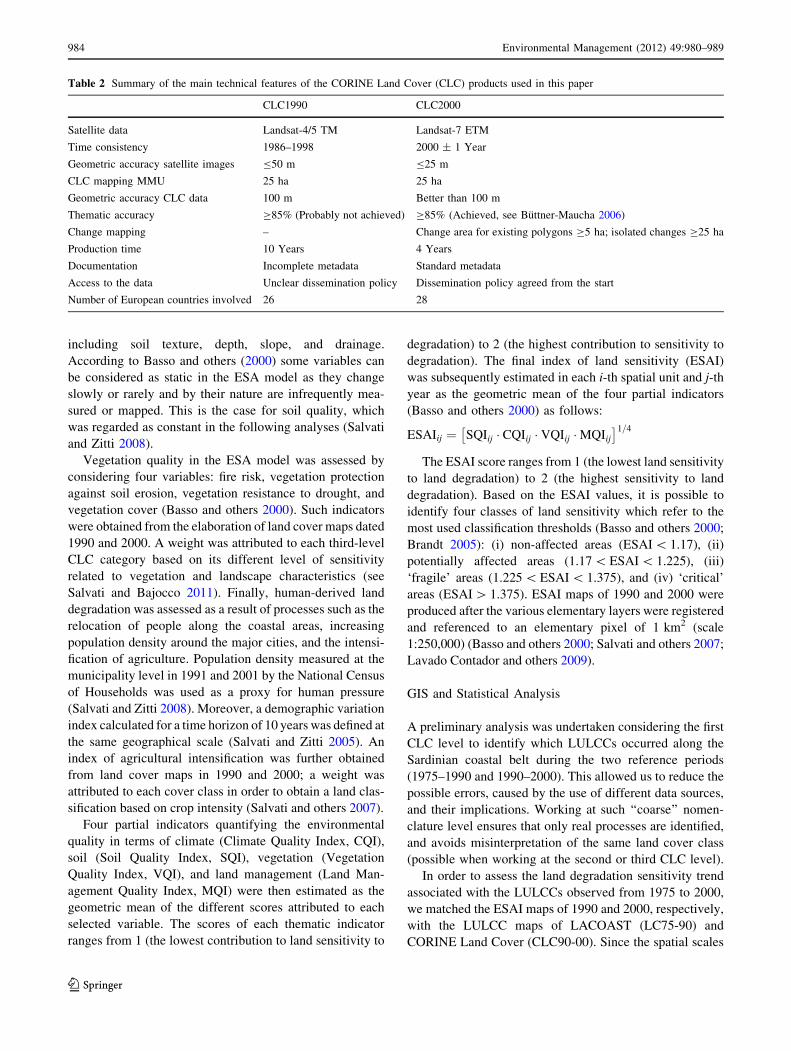
marized in Table 2. As for the CLC change product
(CLC1990–2000), the technical features are the same as for
the CLC basic products (i.e., CLC1990 and CLC2000),
except for the MMU that is 5 ha (Bossard and others 2000).
Environmentally Sensitive Areas Maps
We used the ESA (Environmentally Sensitive Area)
framework to quantify land degradation sensitivity over the
investigated area (Basso and others 2000). This framework
was applied at both regional and local scale in Portugal,
Spain, Italy, and Greece. The procedure is capable of
integrating variables from different data sources. It was
extensively validated in the field in several target sites by
analyzing the correlation between the ESAI and some
indicators of soil quality and physical degradation (Kosmas
and others 1999; Basso and others 2000; Lavado Contador
and others 2009). The methodology is based on more than
ten variables covering different themes, including the
geological, topographical, and climatic conditions, human
pressure, and land mismanagement. A set of sensitivity
scores was assigned to each variable. Scores were derived
from statistical analyses and additional information gath-
ered from the available literature (e.g., Kosmas and others
2000a, b; Lavado Contador and others 2009). For each
theme, a quality indicator was calculated by averaging the
sensitivity scores of the selected variables. A composite
index was then calculated by averaging the values of the
quality indicators.
Climate characteristics were described in the ESA
framework by mean annual rainfall rate, aridity index
(defined as the ratio between annual average rainfall rate
and reference evapotranspiration), and aspect (Sivakumar
2007). The average annual reference evapotranspiration
was calculated using Penman–Monteith formula (Incerti
and others 2007). Climate analysis was carried out for the
periods 1961–1990 and 1971–2000 (Salvati and Zitti
2008). Soil information was obtained from variables
Table 1 CORINE Land Cover map legend
Code Land cover type
111 Continuous urban fabric
112 Discontinuous urban fabric
121 Industrial or commercial units
122 Road and rail networks and associated land
123 Port areas
124 Airports
131 Mineral extraction sites
132 Dump sites
133 Construction sites
141 Green urban areas
142 Sport and leisure facilities
211 Non-irrigated arable land
212 Permanently irrigated land
213 Rice fields
221 Vineyards
222 Fruit trees and berry plantations
223 Olive groves
231 Pastures
241 Annual crops associated with permanent crops
242 Complex cultivation patterns
243 Land principally occupied by agriculture, with significant
areas of natural vegetation
244 Agro-forestry areas
311 Broad-leaved forest
312 Coniferous forest
313 Mixed forest
321 Natural grasslands
322 Moors and heathland
323 Sclerophyllous vegetation
324 Transitional woodland-shrub
331 Beaches, dunes, sands
332 Bare rocks
333 Sparsely vegetated areas
334 Burnt areas
335 Glaciers and perpetual snow
411 Inland marshes
412 Peat bogs
421 Salt marshes
422 Salines
423 Intertidal flats
511 Water courses
512 Water bodies
521 Coastal lagoons
522 Estuaries
523 Sea and ocean
Environmental Management (2012) 49:980–989 983
123
including soil texture, depth, slope, and drainage.
According to Basso and others (2000) some variables can
be considered as static in the ESA model as they change
slowly or rarely and by their nature are infrequently mea-
sured or mapped. This is the case for soil quality, which
was regarded as constant in the following analyses (Salvati
and Zitti 2008).
Vegetation quality in the ESA model was assessed by
considering four variables: fire risk, vegetation protection
against soil erosion, vegetation resistance to drought, and
vegetation cover (Basso and others 2000). Such indicators
were obtained from the elaboration of land cover maps dated
1990 and 2000. A weight was attributed to each third-level
CLC category based on its different level of sensitivity
related to vegetation and landscape characteristics (see
Salvati and Bajocco 2011). Finally, human-derived land
degradation was assessed as a result of processes such as the
relocation of people along the coastal areas, increasing
population density around the major cities, and the intensi-
fication of agriculture. Population density measured at the
municipality level in 1991 and 2001 by the National Census
of Households was used as a proxy for human pressure
(Salvati and Zitti 2008). Moreover, a demographic variation
index calculated for a time horizon of 10 years was defined at
the same geographical scale (Salvati and Zitti 2005). An
index of agricultural intensification was further obtained
from land cover maps in 1990 and 2000; a weight was
attributed to each cover class in order to obtain a land clas-
sification based on crop intensity (Salvati and others 2007).
Four partial indicators quantifying the environmental
quality in terms of climate (Climate Quality Index, CQI),
soil (Soil Quality Index, SQI), vegetation (Vegetation
Quality Index, VQI), and land management (Land Man-
agement Quality Index, MQI) were then estimated as the
geometric mean of the different scores attributed to each
selected variable. The scores of each thematic indicator
ranges from 1 (the lowest contribution to land sensitivity to
degradation) to 2 (the highest contribution to sensitivity to
degradation). The final index of land sensitivity (ESAI)
was subsequently estimated in each i-th spatial unit and j-th
year as the geometric mean of the four partial indicators
(Basso and others 2000) as follows:
ESAIij ¼ SQIij � CQIij � VQIij �MQIij
� �1=4
The ESAI score ranges from 1 (the lowest land sensitivity
to land degradation) to 2 (the highest sensitivity to land
degradation). Based on the ESAI values, it is possible to
identify four classes of land sensitivity which refer to the
most used classification thresholds (Basso and others 2000;
Brandt 2005): (i) non-affected areas (ESAI \ 1.17), (ii)
potentially affected areas (1.17 \ ESAI \ 1.225), (iii)
‘fragile’ areas (1.225 \ ESAI \ 1.375), and (iv) ‘critical’
areas (ESAI [ 1.375). ESAI maps of 1990 and 2000 were
produced after the various elementary layers were registered
and referenced to an elementary pixel of 1 km2 (scale
1:250,000) (Basso and others 2000; Salvati and others 2007;
Lavado Contador and others 2009).
GIS and Statistical Analysis
A preliminary analysis was undertaken considering the first
CLC level to identify which LULCCs occurred along the
Sardinian coastal belt during the two reference periods
(1975–1990 and 1990–2000). This allowed us to reduce the
possible errors, caused by the use of different data sources,
and their implications. Working at such ‘‘coarse’’ nomen-
clature level ensures that only real processes are identified,
and avoids misinterpretation of the same land cover class
(possible when working at the second or third CLC level).
In order to assess the land degradation sensitivity trend
associated with the LULCCs observed from 1975 to 2000,
we matched the ESAI maps of 1990 and 2000, respectively,
with the LULCC maps of LACOAST (LC75-90) and
CORINE Land Cover (CLC90-00). Since the spatial scales
Table 2 Summary of the main technical features of the CORINE Land Cover (CLC) products used in this paper
CLC1990 CLC2000
Satellite data Landsat-4/5 TM Landsat-7 ETM
Time consistency 1986–1998 2000 ± 1 Year
Geometric accuracy satellite images B50 m B25 m
CLC mapping MMU 25 ha 25 ha
Geometric accuracy CLC data 100 m Better than 100 m
Thematic accuracy C85% (Probably not achieved) C85% (Achieved, see Buttner-Maucha 2006)
Change mapping – Change area for existing polygons C5 ha; isolated changes C25 ha
Production time 10 Years 4 Years
Documentation Incomplete metadata Standard metadata
Access to the data Unclear dissemination policy Dissemination policy agreed from the start
Number of European countries involved 26 28
984 Environmental Management (2012) 49:980–989
123
of LULCCs and ESAI maps are different (1:100,000 and
1:250,000 respectively), we re-sampled the ESAI maps
using ArcGIS ‘‘Resample’’ tool (ESRI Inc., Redwoods,
USA) in order to have a reliable comparison between them.
We thus obtained a minimum pixel size (100 m 9 100 m)
comparable with the minimum LULCC polygons width
(100 m).
In order to analyze the relationship between LULCCs
and land degradation sensitivity dynamics, we focused on
the multi-temporal trend of the ESAI values (ESAI90 and
ESAI00) referred only to the LC75-90 polygons. This
analysis enabled us to monitor how the land quality status
varied (improving or worsening) over time in a given area
where LULCCs occurred in the past (Symeonakis and
others 2007). We hence carried out a change detection
analysis of the ESAI trend during 1990–2000 and matched
the results with the LC75-90 map in order to quantify the
ESAI increase (or decrease) associated to each changed
polygon during the investigated time period.
Finally, through the ‘zonal statistics’ ArcGIS tool, we
derived the ESAI90 and ESAI00 average value associated,
respectively, to each LC75-90 and CLC90-00 polygon in
order to identify which LULCCs have led over time to a
different level of land sensitivity to degradation. We
excluded the polygons associated to null ESAI pixels and
to the land cover categories indicating wetlands and water
bodies. We elaborated the LULCC classes at the first and
second CLC levels in order to interpret the results by
reducing the number of records, but still keeping the
information on the landscape variability (Feranec and
others 2010).
Results and Discussion
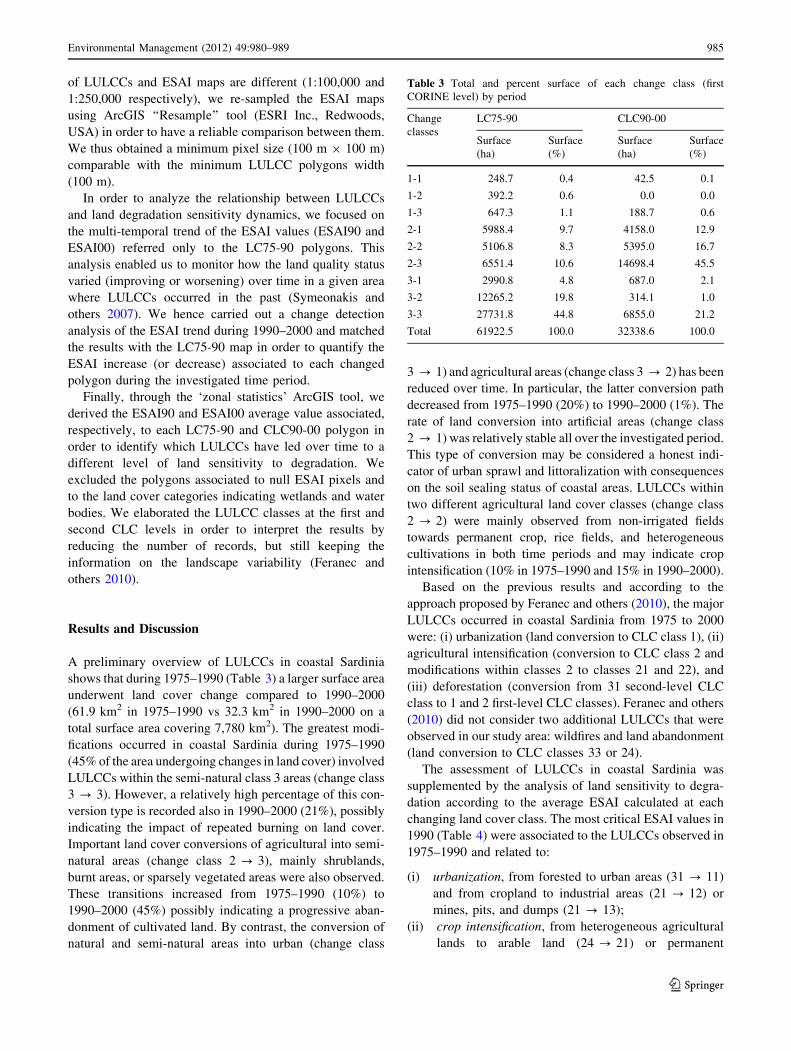
A preliminary overview of LULCCs in coastal Sardinia
shows that during 1975–1990 (Table 3) a larger surface area
underwent land cover change compared to 1990–2000
(61.9 km2 in 1975–1990 vs 32.3 km2 in 1990–2000 on a
total surface area covering 7,780 km2). The greatest modi-
fications occurred in coastal Sardinia during 1975–1990
(45% of the area undergoing changes in land cover) involved
LULCCs within the semi-natural class 3 areas (change class
3 ? 3). However, a relatively high percentage of this con-
version type is recorded also in 1990–2000 (21%), possibly
indicating the impact of repeated burning on land cover.
Important land cover conversions of agricultural into semi-
natural areas (change class 2 ? 3), mainly shrublands,
burnt areas, or sparsely vegetated areas were also observed.
These transitions increased from 1975–1990 (10%) to
1990–2000 (45%) possibly indicating a progressive aban-
donment of cultivated land. By contrast, the conversion of
natural and semi-natural areas into urban (change class
3 ? 1) and agricultural areas (change class 3 ? 2) has been
reduced over time. In particular, the latter conversion path
decreased from 1975–1990 (20%) to 1990–2000 (1%). The
rate of land conversion into artificial areas (change class
2 ? 1) was relatively stable all over the investigated period.
This type of conversion may be considered a honest indi-
cator of urban sprawl and littoralization with consequences
on the soil sealing status of coastal areas. LULCCs within
two different agricultural land cover classes (change class
2 ? 2) were mainly observed from non-irrigated fields
towards permanent crop, rice fields, and heterogeneous
cultivations in both time periods and may indicate crop
intensification (10% in 1975–1990 and 15% in 1990–2000).
Based on the previous results and according to the
approach proposed by Feranec and others (2010), the major
LULCCs occurred in coastal Sardinia from 1975 to 2000
were: (i) urbanization (land conversion to CLC class 1), (ii)
agricultural intensification (conversion to CLC class 2 and
modifications within classes 2 to classes 21 and 22), and
(iii) deforestation (conversion from 31 second-level CLC
class to 1 and 2 first-level CLC classes). Feranec and others
(2010) did not consider two additional LULCCs that were
observed in our study area: wildfires and land abandonment
(land conversion to CLC classes 33 or 24).
The assessment of LULCCs in coastal Sardinia was
supplemented by the analysis of land sensitivity to degra-
dation according to the average ESAI calculated at each
changing land cover class. The most critical ESAI values in
1990 (Table 4) were associated to the LULCCs observed in
1975–1990 and related to:
(i) urbanization, from forested to urban areas (31 ? 11)
and from cropland to industrial areas (21 ? 12) or
mines, pits, and dumps (21 ? 13);
(ii) crop intensification, from heterogeneous agricultural
lands to arable land (24 ? 21) or permanent
Table 3 Total and percent surface of each change class (first
CORINE level) by period
Change
classes
LC75-90 CLC90-00
Surface
(ha)
Surface
(%)
Surface
(ha)
Surface
(%)
1-1 248.7 0.4 42.5 0.1
1-2 392.2 0.6 0.0 0.0
1-3 647.3 1.1 188.7 0.6
2-1 5988.4 9.7 4158.0 12.9
2-2 5106.8 8.3 5395.0 16.7
2-3 6551.4 10.6 14698.4 45.5
3-1 2990.8 4.8 687.0 2.1
3-2 12265.2 19.8 314.1 1.0
3-3 27731.8 44.8 6855.0 21.2
Total 61922.5 100.0 32338.6 100.0
Environmental Management (2012) 49:980–989 985
123
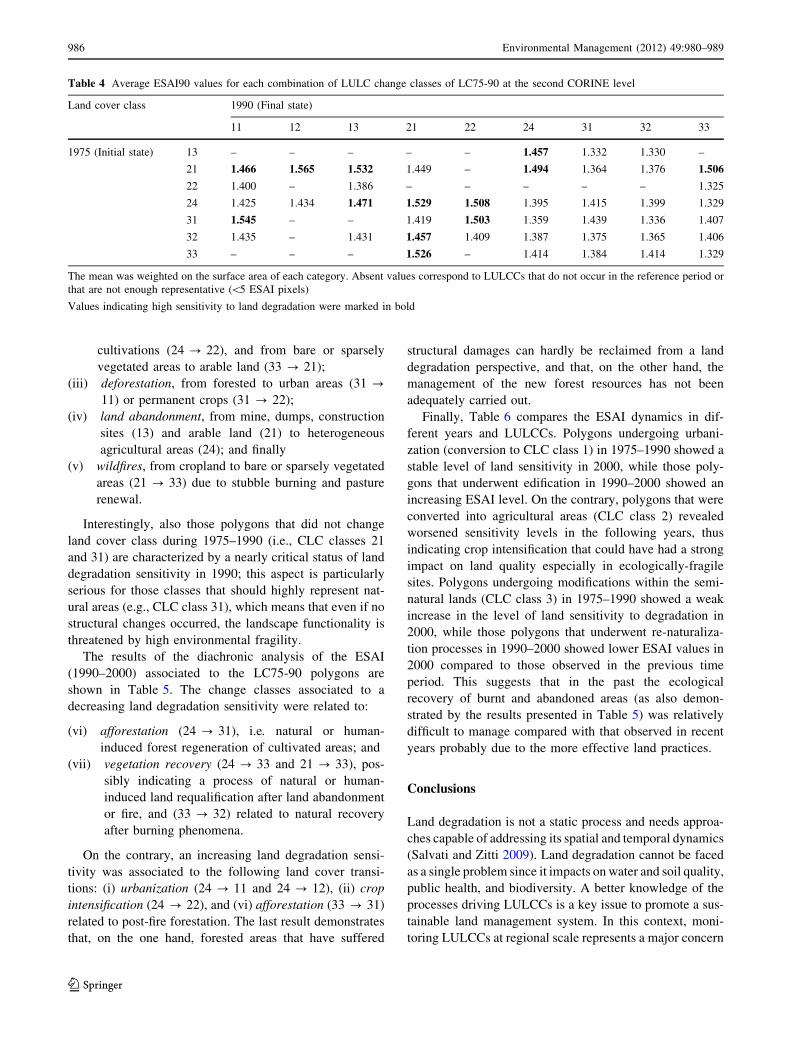
cultivations (24 ? 22), and from bare or sparsely
vegetated areas to arable land (33 ? 21);
(iii) deforestation, from forested to urban areas (31 ?11) or permanent crops (31 ? 22);
(iv) land abandonment, from mine, dumps, construction
sites (13) and arable land (21) to heterogeneous
agricultural areas (24); and finally
(v) wildfires, from cropland to bare or sparsely vegetated
areas (21 ? 33) due to stubble burning and pasture
renewal.
Interestingly, also those polygons that did not change
land cover class during 1975–1990 (i.e., CLC classes 21
and 31) are characterized by a nearly critical status of land
degradation sensitivity in 1990; this aspect is particularly
serious for those classes that should highly represent nat-
ural areas (e.g., CLC class 31), which means that even if no
structural changes occurred, the landscape functionality is
threatened by high environmental fragility.
The results of the diachronic analysis of the ESAI
(1990–2000) associated to the LC75-90 polygons are
shown in Table 5. The change classes associated to a
decreasing land degradation sensitivity were related to:
(vi) afforestation (24 ? 31), i.e. natural or human-
induced forest regeneration of cultivated areas; and
(vii) vegetation recovery (24 ? 33 and 21 ? 33), pos-
sibly indicating a process of natural or human-
induced land requalification after land abandonment
or fire, and (33 ? 32) related to natural recovery
after burning phenomena.
On the contrary, an increasing land degradation sensi-
tivity was associated to the following land cover transi-
tions: (i) urbanization (24 ? 11 and 24 ? 12), (ii) crop
intensification (24 ? 22), and (vi) afforestation (33 ? 31)
related to post-fire forestation. The last result demonstrates
that, on the one hand, forested areas that have suffered
structural damages can hardly be reclaimed from a land
degradation perspective, and that, on the other hand, the
management of the new forest resources has not been
adequately carried out.
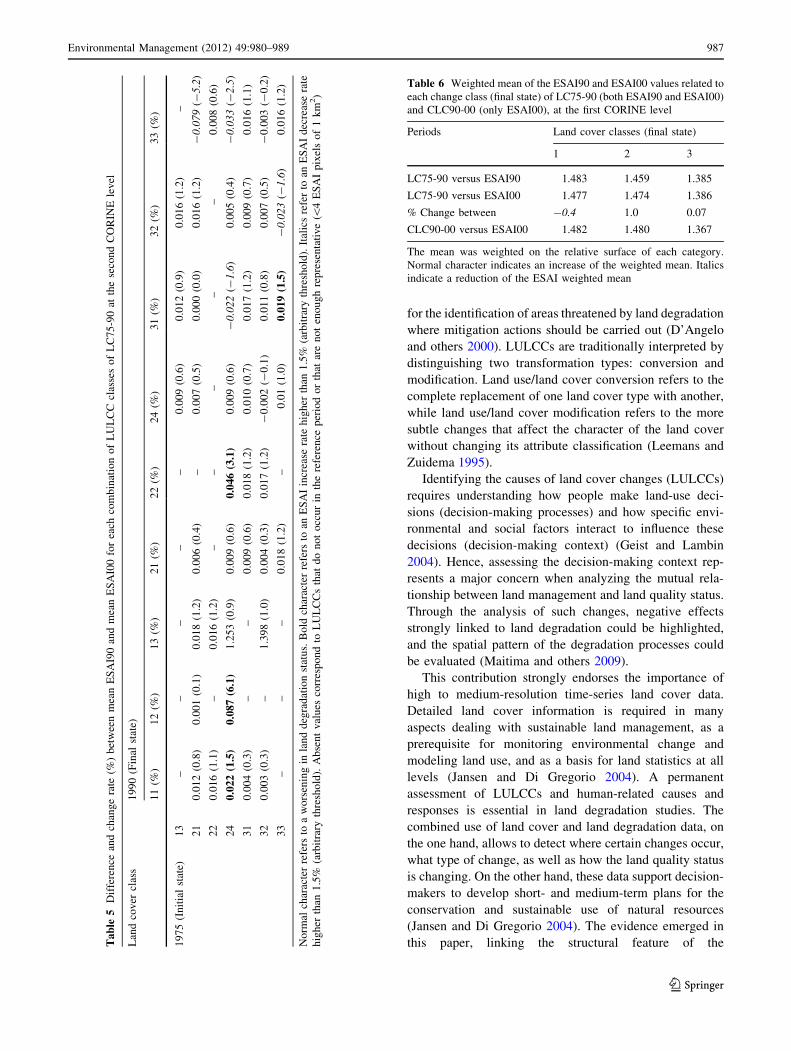
Finally, Table 6 compares the ESAI dynamics in dif-
ferent years and LULCCs. Polygons undergoing urbani-
zation (conversion to CLC class 1) in 1975–1990 showed a
stable level of land sensitivity in 2000, while those poly-
gons that underwent edification in 1990–2000 showed an
increasing ESAI level. On the contrary, polygons that were
converted into agricultural areas (CLC class 2) revealed
worsened sensitivity levels in the following years, thus
indicating crop intensification that could have had a strong
impact on land quality especially in ecologically-fragile
sites. Polygons undergoing modifications within the semi-
natural lands (CLC class 3) in 1975–1990 showed a weak
increase in the level of land sensitivity to degradation in
2000, while those polygons that underwent re-naturaliza-
tion processes in 1990–2000 showed lower ESAI values in
2000 compared to those observed in the previous time
period. This suggests that in the past the ecological
recovery of burnt and abandoned areas (as also demon-
strated by the results presented in Table 5) was relatively
difficult to manage compared with that observed in recent
years probably due to the more effective land practices.
Conclusions
Land degradation is not a static process and needs approa-
ches capable of addressing its spatial and temporal dynamics
(Salvati and Zitti 2009). Land degradation cannot be faced
as a single problem since it impacts on water and soil quality,
public health, and biodiversity. A better knowledge of the
processes driving LULCCs is a key issue to promote a sus-
tainable land management system. In this context, moni-
toring LULCCs at regional scale represents a major concern
Table 4 Average ESAI90 values for each combination of LULC change classes of LC75-90 at the second CORINE level
Land cover class 1990 (Final state)
11 12 13 21 22 24 31 32 33
1975 (Initial state) 13 – – – – – 1.457 1.332 1.330 –
21 1.466 1.565 1.532 1.449 – 1.494 1.364 1.376 1.506
22 1.400 – 1.386 – – – – – 1.325
24 1.425 1.434 1.471 1.529 1.508 1.395 1.415 1.399 1.329
31 1.545 – – 1.419 1.503 1.359 1.439 1.336 1.407
32 1.435 – 1.431 1.457 1.409 1.387 1.375 1.365 1.406
33 – – – 1.526 – 1.414 1.384 1.414 1.329
The mean was weighted on the surface area of each category. Absent values correspond to LULCCs that do not occur in the reference period or
that are not enough representative (\5 ESAI pixels)
Values indicating high sensitivity to land degradation were marked in bold
986 Environmental Management (2012) 49:980–989
123
for the identification of areas threatened by land degradation
where mitigation actions should be carried out (D’Angelo
and others 2000). LULCCs are traditionally interpreted by
distinguishing two transformation types: conversion and
modification. Land use/land cover conversion refers to the
complete replacement of one land cover type with another,
while land use/land cover modification refers to the more
subtle changes that affect the character of the land cover
without changing its attribute classification (Leemans and
Zuidema 1995).
Identifying the causes of land cover changes (LULCCs)
requires understanding how people make land-use deci-
sions (decision-making processes) and how specific envi-
ronmental and social factors interact to influence these
decisions (decision-making context) (Geist and Lambin
2004). Hence, assessing the decision-making context rep-
resents a major concern when analyzing the mutual rela-
tionship between land management and land quality status.
Through the analysis of such changes, negative effects
strongly linked to land degradation could be highlighted,
and the spatial pattern of the degradation processes could
be evaluated (Maitima and others 2009).
This contribution strongly endorses the importance of
high to medium-resolution time-series land cover data.
Detailed land cover information is required in many
aspects dealing with sustainable land management, as a
prerequisite for monitoring environmental change and
modeling land use, and as a basis for land statistics at all
levels (Jansen and Di Gregorio 2004). A permanent
assessment of LULCCs and human-related causes and
responses is essential in land degradation studies. The
combined use of land cover and land degradation data, on
the one hand, allows to detect where certain changes occur,
what type of change, as well as how the land quality status
is changing. On the other hand, these data support decision-
makers to develop short- and medium-term plans for the
conservation and sustainable use of natural resources
(Jansen and Di Gregorio 2004). The evidence emerged in
this paper, linking the structural feature of theTa
ble
5D
iffe
ren
cean
dch
ang
era
te(%
)b
etw
een
mea
nE
SA
I90
and
mea
nE
SA
I00
for
each
com
bin
atio
no
fL
UL
CC
clas
ses
of
LC
75
-90
atth
ese
con
dC
OR
INE
lev
el
Lan
dco
ver
clas
s1
99
0(F
inal
stat
e)
11
(%)
12
(%)
13
(%)
21
(%)
22
(%)
24
(%)
31
(%)
32
(%)
33
(%)
19
75
(In
itia
lst
ate)
13
––
––
–0
.00
9(0
.6)
0.0
12
(0.9
)0
.01
6(1
.2)
–
21
0.0
12
(0.8
)0
.00
1(0
.1)
0.0
18
(1.2
)0
.00
6(0
.4)
–0
.00
7(0
.5)
0.0
00
(0.0
)0
.01
6(1
.2)
-0
.07
9(-
5.2
)
22
0.0
16
(1.1
)–
0.0
16
(1.2
)–
––
––
0.0
08
(0.6
)
24
0.0
22
(1.5
)0
.08
7(6
.1)
1.2
53
(0.9
)0
.00
9(0
.6)
0.0
46
(3.1
)0
.00
9(0
.6)
-0
.02
2(-
1.6
)0
.00
5(0
.4)
-0
.03
3(-
2.5
)
31
0.0
04
(0.3
)–
–0
.00
9(0
.6)
0.0
18
(1.2
)0
.01
0(0
.7)
0.0
17
(1.2
)0
.00
9(0
.7)
0.0
16
(1.1
)
32
0.0
03
(0.3
)–
1.3
98
(1.0
)0
.00
4(0
.3)
0.0
17
(1.2
)-
0.0
02
(-0
.1)
0.0
11
(0.8
)0
.00
7(0
.5)
-0
.00
3(-
0.2
)
33
––
–0
.01
8(1
.2)
–0
.01
(1.0
)0
.01
9(1
.5)
-0
.02
3(-
1.6
)0
.01
6(1
.2)
No
rmal
char
acte
rre
fers
toa
wo
rsen
ing
inla
nd
deg
rad
atio
nst
atu
s.B
old
char
acte
rre
fers
toan
ES
AI
incr
ease
rate
hig
her
than
1.5
%(a
rbit
rary
thre
shold
).It
alic
sre
fer
toan
ES
AI
dec
reas
era
te
hig
her
than
1.5
%(a
rbit
rary
thre
sho
ld).
Ab
sen
tv
alu
esco
rres
po
nd
toL
UL
CC
sth
atd
on
ot
occ
ur
inth
ere
fere
nce
per
iod
or
that
are
no
ten
ou
gh
rep
rese
nta
tiv
e(\
4E
SA
Ip
ixel
so
f1
km
2)
Table 6 Weighted mean of the ESAI90 and ESAI00 values related to
each change class (final state) of LC75-90 (both ESAI90 and ESAI00)
and CLC90-00 (only ESAI00), at the first CORINE level
Periods Land cover classes (final state)
1 2 3
LC75-90 versus ESAI90 1.483 1.459 1.385
LC75-90 versus ESAI00 1.477 1.474 1.386
% Change between -0.4 1.0 0.07
CLC90-00 versus ESAI00 1.482 1.480 1.367
The mean was weighted on the relative surface of each category.
Normal character indicates an increase of the weighted mean. Italics
indicate a reduction of the ESAI weighted mean
Environmental Management (2012) 49:980–989 987
123
Mediterranean landscape with its functional dynamics over
time, provide a simple framework to foresee the land
sensitivity response to changing LULCCs scenarios, and
can effectively contribute to land management policies
targeted to preserve the environmental quality of Medi-
terranean coastal areas. Finally, land cover mapping and
documentation may not provide the ultimate explanation
for all problems related to land degradation and cannot be
an end in itself. Nevertheless, it serves as a stepping stone
for understanding trends and possible causes of LULCCs
and their implications.
Acknowledgments Thanks are due to T. Ceccarelli (CRA-CMA)
who provided technical support and critical reading of the manuscript.
Authors of this paper were partly financed by ‘Agroscenari’ project
(research unit 6a) funded by the Italian Ministry of Agricultural and
Forestry Policies.
References
Alves FL, Silva CP, Pinto P (2007) The Assessment of Coastal Zone
Development at a Regional Level—the case study of the
Portuguese Central Area. Journal of Coastal Research SI50:72–76
Bajocco S, Ricotta C (2008) Evidence of selective burning in Sardinia
(Italy): Which land cover classes do wildfires prefer? Landscape
Ecology 23:241–248
Bajocco S, Rosati L, Ricotta C (2010) Knowing fire incidence
through fuel phenology: a remotely sensed approach. Ecological
Modelling 221:59–66
Bajocco S, Salvati L, Ricotta C (2011) Land degradation vs. fire: a
spiral process? Progress in Physical Geography 35:3–18
Balabanis P, Peter D, Ghazi A, Tsogas M (2000) Mediterranean
desertification research results and policy implications. Proceed-
ings of the international conference, Nov 1996. European
Commission, Luxemburg
Basso F, Bove E, Dumontet S, Ferrara A, Pisante M, Quaranta G,
Taberner M (2000) Evaluating environmental sensitivity at the
basin scale through the use of geographic information systems
and remotely sensed data: an example covering the Agri basin—
Southern Italy. Catena 40:19–35
Bonet A (2004) Secondary succession of semi-arid Mediterranean
old-fields in south-eastern Spain: insights for conservation and
restoration of degraded lands. Journal of Arid Environments
56(2):213–233
Bossard M, Feranec J, Otahel J (2000) CORINE land cover technical
guide—addendum 2000. Technical Report No. 40. European
Environment Agency, Copenhagen, p 105
Brandt J (2005) Land degradation information system to support
National Action Programmes in the Mediterranean (DISMED).
DIS4ME, Land degradation Indicator System for Mediterranean
Europe. www.unibas.it/desertnet/dis4me/using_dis4me/dismed.
htm. Accessed Aug 2010
Burke SM, Thornes JB (2004) A thematic review of EU Mediterra-
nean desertification research in Frameworks III and IV: preface.
Advances in Environmental Monitoring and Modelling 1:1–14
Buttner G, Feranec J, Jaffrain G (2002) CORINE land cover update.
I&CLC2000 project. European Environment Agency. Technical
Guidelines, p 56
Buttner G, Maucha G (2006) The thematic accuracy of Corine land
cover 2000. Assessment using LUCAS (land use/cover area frame
statistical survey). Technical report 7. European Environment
Agency, Copenhagen. http://reports.eea.europa.eu/technical_
report_2006_7/en. Accessed Mar 2012
Conacher AJ, Sala M (1998) Land degradation in Mediterranean
environments of the world. Wiley, Chichester
D’Angelo M, Enne G, Madrau S, Percich S, Previtali F, Pulina G, Zucca
C (2000) Mitigating land degradation in Mediterranean agro-
silvo-pastoral systems: a GIS-based approach. Catena 40:37–49
Drake NA, Vafeidis A (2003) Review of spatial and temporal
methods for assessing land degradation in the Mediterranean.
Advances in Environmental Monitoring and Modelling 1:1–51
EEA (2007) CLC2006 technical guidelines. Technical report 17/2007.
European Environmental Agency, p 66
Enne G, Pulina G, D’Angelo M, Previtali F, Madrau S, Caredda S,
Francesconi AH (2002) Agropastoral activities and land degra-
dation: the case study of Sardinia. In: Thornes J, Brandt J,
Geeson N (eds) Mediterranean desertification—a mosaic of
processes and responses. Wiley, Chichester, pp 71–82
European Environmental Agency (2006) The changing faces of
Europe’s coastal areas. European Environment Agency, Report
No. 6/2006, Copenhagen, p 107
Feranec J, Jaffrain G, Soukup T, Hazeu G (2010) Determining
changes and flows in European landscapes 1990–2000 using
CORINE land cover data. Applied Geography 30:19–35
Fiori M, Motroni A, Duce P, Spano D (2004) A daily water balance
estimate for climate risk evaluation at a local scale. Acta
Horticulturae, vol 664. ISHS. IV international symposium on
irrigation of horticultural crops
Freire S, Santos T, Tenedorio JA (2009) Recent urbanization and land
use/land cover change in Portugal the influence of coastline and
coastal urban centers. Journal of Coastal Research Special Issue
56:1499–1503
Geist HJ, Lambin EF (2004) Dynamic causal patterns of desertifica-
tion. Bioscience 54:817–829
Giordano F, Marini A (2008) A landscape approach for detecting and
assessing changes in an area prone to desertification in Sardinia
(Italy). International Journal of Navigation and Observation. doi:
10.1155/2008/549630
Harrington GN (1981) Grazing arid and semiarid pastures. In: Morley
FHW (ed) Grazing animals. Elsevier, Amsterdam, pp 181–201
Hawkes JC (2004) A review of European Union funded research into
Mediterranean desertification processes. Advances in Environ-
mental Monitoring and Modelling 1:1–39
Incerti G, Feoli E, Giovacchini A, Salvati L, Brunetti A (2007)
Analysis of bioclimatic time series and their neural network-
based classification to characterize drought risk patterns in south
Italy. International Journal of Biometeorology 51:253–263
Jansen LJM, Di Gregorio A (2004) Land Cover Classification System:
Basic concepts, main software functions and overview of the
‘‘land system’’ approach. In: Groom G (ed) Developments in
strategic landscape monitoring for the Nordic countries. Nordic
Council of Ministers of Environment. ANP 2004/705:64–73
Kosmas C, Kirkby M, Geeson N (1999) Manual on key indicators of
desertification and mapping environmental sensitive areas to
desertification. Directorate General, European Commission,
Bruxelles. http://www.kcl.ac.uk/projects/desertlinks/downloads/
publicdownloads/ESA%20Manual.pdf. Accessed Aug 2010
Kosmas C, Danalatos NG, Gerontidis S (2000a) The effect of land
parameters on vegetation performance and degree of erosion
under Mediterranean conditions. Catena 40:3–17
Kosmas C, Gerontidis S, Marathianou M (2000b) The effect of land
use change on soil and vegetation over various lithological
formations on Lesvos. Catena 40:51–68
Lambin EF, Turner BL, Geist HJ, Agbola SB, Angelsen A, Bruce JW,
Coomes OT, Dirzo R, Fischer G, Folke C, George PS,
Homewood K, Imbernon J, Leemans R, Li XB, Moran EF,
Mortimore M, Ramakrishnan PS, Richards JF, Skanes H, Steffen
988 Environmental Management (2012) 49:980–989
123
W, Stone GD, Svedin U, Veldkamp TA, Vogel C, Xu JC (2001)
The causes of land-use and land-cover change: moving beyond
the myths. Global Environmental Change: Human and Policy
Dimensions 11:261–269
Lavado Contador JF, Schnabel S, Gomez Gutierrez A, Pulido
Fernandez M (2009) Mapping sensitivity to land degradation
in Extremadura, SW Spain. Land Degradation and Development
20:129–144
Leemans R, Zuidema G (1995) Evaluating changes in land-cover
and their importance for global change. Trends in Ecology and
Evolution 10:76-81
Maitima JM, Mugathal SM, Reid RS, Gachimbi LN, Majule A,
Lyaruu H, Pomery D, Mathai S, Mugisha S (2009) The linkages
between land use change, land degradation and biodiversity
across East Africa. African Journal of Environmental Science
and Technology 3(10):310–325
Marathianou M, Kosmas C, Gerontidis S, Detsis V (2000) Land-use
evolution and degradation in Lesvos (Greece): a historical
approach. Land Degradation and Development 11(1):63–73
Margaris NS (1992) Primary sector and environment in the Aegean.
Environmental Management 16(5):569–574
Millennium Ecosystem Assessment (MEA) (2005a) Ecosystems and
human well-being: synthesis. World Resources Institute. Island
Press, Washington, DC
Millennium Ecosystem Assessment (MEA) (2005b) Ecosystems and
human well-being: desertification synthesis. World Resources
Institute, Washington, DC
Montanarella L (2007) Trends in land degradation in Europe. In:
Sivakumar MV, N’Diangui N (eds) Climate and land degrada-
tion. Springer, Berlin
Otto R, Krusi BO, Kienast F (2007) Degradation of an arid coastal
landscape in relation to land use changes in southern Tenerife
(Canary Islands). Journal of Arid Environments 70:527–539
Perdigao W, Christensen S (2000) The LaCOAST atlas: land cover
changes in European coastal zones. Joint Research Centre, Ispra
Perez-Trejo F (1994) Desertification and land degradation in the
European Mediterranean, EUR 14850 EN. Report prepared for
the Commission of the European Communities, Brussels
Reynolds JF, Stafford Smith M (eds) (2002) Global desertification:
Do humans cause deserts?. Dahlem University Press, Berlin
Romm J (2011) Desertification: the next dust bowl. Nature
478:450–451
Salvati L, Bajocco S (2011) Land sensitivity to desertification across
Italy: past, present, and future. Applied Geography 31(1):
223–231
Salvati L, Zitti M (2005) Land degradation in the Mediterranean
basin: linking bio-physical and economic factors into an
ecological perspective. Biota 5:67–77
Salvati L, Zitti M (2008) Regional convergence of environmental
variables: empirical evidences from land degradation. Ecological
Economics 68:162–168
Salvati L, Zitti M (2009) Assessing the impact of ecological and
economic factors on land degradation vulnerability through
multiway analysis. Ecological Indicators 9:357–363
Salvati L, Macculi F, Toscano S, Zitti M (2007) Comparing indicators
of intensive agriculture from different statistical sources. Biota
8:51–60
Santini M, Caccamo G, Laurenti A, Noce S, Valentini R (2010) A
multicomponent GIS framework for desertification risk assess-
ment by an integrated index. Applied Geography 30(3):394–415
Sivakumar MVK (2007) Interactions between climate and land
degradation. Agriculture and Forest Meteorology 142:143–155
Sluiter R, de Jong SM (2007) Spatial patterns of Mediterranean land
abandonment and related land cover transitions. Landscape
Ecology 22:559–576
Symeonakis E, Drake N (2004) Monitoring desertification and land
degradation over sub-Saharan Africa. International Journal of
Remote Sensing 25:573–592
Symeonakis E, Calvo-Cases A, Arnau-Rosalen E (2007) Land use
change and land degradation in southeastern Mediterranean
Spain. Environmental Management 40:80–94
Thornes JB (2004) Stability and instability in the management of
Mediterranean desertification. In: Wainwright J, Mulligan M
(eds) Environmental modelling: findings implicity in complex-
ity. Wiley, Chichester, pp 303–315
UNEP (1994) United Nations Convention to combat desertification in
those countries experiencing serious drought and/or desertifica-
tion, particularly Africa. UNEP, Geneva
Valentine JF (1990) Grazing management. Academic Press, San
Diego
Wilson G, Juntti M (2005) Unravelling desertification: policies and
actor networks in southern Europe. Wageningen Academic
Publishers, Wageningen
Environmental Management (2012) 49:980–989 989
123