the impact of athletic performance on alumni giving: an ... · the impact of athletic performance...
TRANSCRIPT
The Impact of Athletic Performance on Alumni Giving:
An Analysis of Micro Data
by
Jonathan Meer, Stanford University Harvey S. Rosen, Princeton University
CEPS Working Paper No. 162
March 2008
Acknowledgements: We are grateful to B. Douglas Bernheim, William G. Bowen, Ronald Ehrenberg, Caroline Hoxby, Donna Lawrence, Brian McDonald, Darwin Miller, Lorin Maurer, C. Rob Orr, Julie Shadle, members of Princeton’s Public Finance Working Group, members of Stanford’s Labor Reading Group, and two referees for useful suggestions. Zhihao Zhang provided excellent research assistance. This research was supported in part by Princeton’s Center for Economic Policy Studies and in part by the Stanford Institute for Economic Policy Research.

Abstract
The Impact of Athletic Performance on Alumni Giving: An Analysis of Micro Data
An ongoing controversy in the literature on the economics of higher education centers on whether the success of a school’s athletic program affects alumni donations. This paper uses a unique data set to investigate this issue. The data contain detailed information about donations made by alumni of a selective research university as well as a variety of their economic and de-mographic characteristics. One important question is how to characterize the success of an athlet-ic program. We focus not only on the performance of the most visible teams, football and bas-ketball, but also on the success of the team on which he or she played as an undergraduate. One of our key findings is that the impact of athletic success on donations differs for men and women. When a male graduate’s former team wins its conference championship, his dona-tions for general purposes increase by about 7 percent and his donations to the athletic program increase by about the same percentage. Football and basketball records generally have small and statistically insignificant effects; in some specifications, a winning basketball season reduces do-nations. For women there is no statistically discernible effect of a former team’s success on cur-rent giving; as is the case for men, the impacts of football and basketball, while statistically sig-nificant in some specifications, are not important in magnitude. Another novel result is that for males, varsity athletes whose teams were successful when they were undergraduates subsequent-ly make larger donations to the athletic program. For example, if a male alumnus’s team won its conference championship during his senior year, his subsequent giving to the athletic program is about 8 percent a year higher, ceteris paribus. Jonathan Meer Harvey S. Rosen Department of Economics Department of Economics Stanford University Princeton University Stanford, CA 94305 Princeton, NJ 08544

1. Introduction
The role of athletics on college campuses has been a matter of intense controversy for
years. As the two authoritative books by William Bowen and his colleagues (Bowen and Levin
[2005], Shulman and Bowen [2002]) make clear, athletics affects nearly every facet of campus
life. The impact of sports on university finances has been a particularly contentious issue. The
focus of this paper is on one important aspect of this topic, namely, whether winning teams in-
duce alumni to make more donations, and if so, whether these donations go to the support of the
university as a whole or only to the athletic program.
A considerable amount of empirical work has been done on this topic. Papers typically
analyze data at the institutional level and focus mainly on the impact of major sports such as
football and men’s basketball. While interesting and informative, such studies may leave out an
important part of the picture. To see why, note that previous research has documented that partic-
ipation in varsity athletics is positively correlated with subsequent giving (Clotfelter [2003], Du-
gan et al. [1999], Meer and Rosen [forthcoming]). The usual assumption is that this correlation
arises because participation in varsity sports increases the affinity that students feel for their col-
lege (Monks [2003]). If affection for the team on which an undergraduate played affects his or
her attitude toward the institution, then the subsequent success of that team might affect giving
behavior. Studies using institutional-level data cannot investigate this phenomenon. Neither can
such data allow one to address the closely related question of whether the performance of an
alumnus’s team at the time he or she was an undergraduate affects subsequent giving.
This paper uses a unique data set to estimate how alumni contributions to a selective re-
search university are affected by the performance of its athletic teams. The proprietary data pro-
vided by this university, henceforth referred to as Anon U, contain detailed information about

2
donations made by alumni as well as a variety of their economic and demographic characteris-
tics. In particular, we know on which teams, if any, each alumnus participated when he or she
was an undergraduate. We then gathered data on the performance of each of these teams, allow-
ing us to examine the relationship between performance and an individual’s donations.
In Section 2 we briefly review some pertinent research in this area. Section 3 describes
the data and econometric framework. The results are presented in Section 4. We find that for
males, donations for both general purposes and for the athletic program increase with the success
of the alumnus’s former team. Further, male varsity athletes whose teams were successful when
they were upperclassmen subsequently make larger donations to the athletic program. The results
for females are quite different. Neither the contemporaneous performance of their former team
nor its performance when they were undergraduates affects giving for either general purposes or
for the athletic program. Section 5 discusses the sensitivity of the results to alternative specifica-
tions of the model. The results are robust to the exclusion of outliers and to the inclusion of fixed
effects. Section 6 concludes with a summary and suggestions for future research.
2. Previous Literature
There is an extensive literature on the relationship between athletic success and alumni
giving (see Frank [2004] and Litan et al. [2003]). We provide a brief review that focuses on me-
thodological issues.
Several studies examine time series of overall giving at an individual institution and how
it varies with the success of major sports teams (Goff [2004], Grimes and Chressanthis [1994]).
The advantage of this approach is that one need not be concerned about biases that might emerge
from jointly analyzing institutions that are very different with respect to the role played by athlet-

3
ics. A drawback is that it may be difficult to disentangle the impact of team performance in a
given year from any other variable that might have been influencing the giving environment in
that year. An alternative and more common approach is to pool time series data on a group of
institutions. (See, for example, Turner, Meserve and Bowen [2001], Cunningham and Cochi-
Ficano [2002], Litan et al. [2003], and Humphreys and Mondello [2005].) Typically, a measure
of alumni giving is regressed on some measure of sports success, such as the football team’s
record, other variables that vary with time, a fixed effect for the institution, and time effects. A
number of papers distinguish between general purpose giving and giving to support athletic pro-
grams. The distinction is important because an increase in total giving that goes to support athlet-
ic programs may have a different impact on the institution than an increase that increases support
for general purposes.
The literature shows that few results hold in general. Turner, Meserve and Bowen [2001],
for example, find that a winning football season can either increase or decrease giving depending
on whether the institution is in Division I-A (which consists of athletic scholarship granting insti-
tutions with high minimum football game attendance), whether the school is a small liberal arts
college, and so on. Interestingly, their results suggest that it is not clear that a winning football
season increases giving to a school’s athletic program, let alone giving to support other programs
in the institution (p. 822). More generally, taken as a group, the findings in the literature are in-
conclusive. As Kahn [2007, p. 222] notes, the estimates are sensitive to which variables are in-
cluded, whether the model includes university fixed effects, how athletic success is defined,
whether the sample includes public or private universities, and so on.
One could reasonably conclude from this lack of robustness that the usual assumptions
needed for identification when pooling data from different institutions may not be valid in this

4
context. However, as already noted, analyzing aggregate time series data from a single institution
has its own problems. A more sensible approach is to analyze decision-making at a single institu-
tion, but at the individual level. Using micro data confers other benefits that are not available in
either the time series or panel analyses of aggregate data. First, we can learn more about which
team’s performance is relevant. The usual assumption is that only the football team’s record is
important, as well as perhaps one or two other major sports such as men’s basketball. But alumni
may develop affinities to the teams on which they played as undergraduates—to a former rower,
for instance, the performance of the crew team may be more important than that of the football
team. Second, with micro data one can learn how characteristics of alumni such as gender inte-
ract with team performance in the determination of giving. Third, such data allow us to control as
thoroughly as possible for other attributes that may confound the relationship between athletics
and giving, such as academic performance.
3. Data and Econometric Model
3.1 Data
Our primary data source is the administrative archives of Anon U’s Development Office,
which contain information on all alumni donations, both to general funds and to athletic pro-
grams, from 1983 to 2006. The data are proprietary and sensitive, and individuals’ names were
stripped from the records before being made available to us. Our unit of observation is a yearly
giving opportunity. For example, if an individual has been an alumna for 5 years, she accounts
for 5 giving opportunities in our analysis, starting in the first fiscal year after graduation. Mul-
tiple gifts for the same purpose in the same year are summed together. The Development Office
data also include information on academic major, extracurricular activities when the alumnus

5
was an undergraduate, post graduate education, occupation, residence, and whether he or she is
married to another graduate of Anon U. The information on extracurricular activities is quite de-
tailed, including every varsity team on which the alumnus played as an undergraduate. We were
able to determine each team’s conference finish in every year, using publicly available data.1
Anon U’s Registrar supplemented these data with information on SAT scores, academic
honors, ethnicity, type of high school, summary evaluations made by the Admissions Office dur-
ing the application process, and grade point average. The Registrar’s data are available only for
the classes of 1972 and onwards, so we restrict our analysis to this group of individuals. Our ba-
sic analysis sample has 293,683 observations on 18,892 alumni for males and 156,226 observa-
tions on 11,930 alumnae for females. There are 7,228 male former athletes with 107,948 asso-
ciated observations, while female former athletes number 3,542, with 42,978 associated observa-
tions. The mean number of observations per individual is 9.9.
As noted above, in our context it is critical to distinguish between general giving and giv-
ing to athletic programs.2 We therefore analyze the amounts donated in any given year for both
general funds and the athletic program.3 The means and standard deviations of each of these va-
riables are detailed in Table 1. The unconditional mean gift for general purposes (in 2006 dol-
lars) is $507 with a standard deviation of $53,669. The mean gift for men is $531 (s.d. =
$18,662), while the mean gift for women $463 (s.d. = $87,410). The mean gift to the athletic
program is $57 (standard deviation = $1,920); the figure for men is $63 (s.d. = $1,825), while for
women, it is $43 (s.d. = $2,141). The relatively large standard deviations for these variables re-
1 For alumni who were on multiple teams, the team whose season was more successful in a given year is designated as the “own team” in that year. 2 We define giving to the athletic program as consisting of gifts earmarked for booster or friends groups, athletics prizes, awards, and coaching, as well as gifts to the athletic department and athletic facilities construction and main-tenance. Gifts earmarked for club and intramural sports or recreational athletics are considered to be “general pur-pose.” 3 Pledges without an associated gift are not counted.

6
flect the presence of enormous outliers. To reduce the likelihood that outliers drive our results,
we take the log of the amount given.4 In addition, we also estimate our models without the top 1
percent of the observations, and find that the results are essentially unchanged. With respect to
the probability of giving, about 56 percent of the giving opportunities result in a donation for
general purposes and 14 percent for the athletic program. Donation rates for men and women are
fairly similar; 54.9 percent of giving opportunities for men result in a donation for general pur-
poses; for women, the figure is 57.9 percent. The corresponding figures for donations to the ath-
letic program are 14.9 percent for men and 11.2 percent for women.
An important question is how to measure team performance. One’s initial inclination
might be to use the team’s won-loss record. However, many sports (such as golf or track) rarely
engage in head-to-head competition, instead competing at invitationals with many teams. There-
fore, conference championships seem to be the best measure of a team’s performance against
rivals. We lag team championships by one year because most athletic gifts are made early in the
fiscal (and school) year, prior to the start of most teams’ seasons.5 About 11 percent of the ob-
servations are associated with an alumnus’s own team winning a conference championship.
Men’s and women’s teams are roughly equally successful, with 11.6 percent of men’s observa-
tions and 10.7 percent of women’s observations associated with conference championships.
Most of the remaining explanatory variables are dichotomous. We include an indicator
for whether an alumnus was a varsity athlete as an undergraduate. The literature consistently
shows that alumni giving is heavily influenced by the affinity that they develop for their schools
4 A logarithmic transformation presents problems for observations that take a value of zero. As noted below, we set 164 gifts for general purposes that are greater than zero but less than or equal to $1.00 equal to $1.01. Therefore, observations for which there is no giving are associated with $1, whose logarithm is zero. There are no gift amounts in that range for athletic purposes. 5 When both current and lagged performance are included, current performance tends to be small and insignificant, while lagged performance maintains its explanatory power. We also investigated specifications in which additional lags of performance were included. No consistent results emerged from this exercise.
7
as undergraduates, and participation in varsity sports is one way in which such an affinity devel-
ops. (See, for example, Clotfelter [2001], Monks [2003].) About 34 percent of our observations
are associated with alumni who were varsity athletes (36.9 percent for men and 28.0 percent for
women). Perhaps, though, the impact of varsity athletic participation depends on how successful
one’s team was—being on a perennial loser might not engender the same kind of warm feelings
as being part of a winning effort. If so, then performance of an alumnus’s team when he or she
was an undergraduate should be considered. We therefore augment our model with a series of
dichotomous variables that take a value of one if the alumnus’s team won its conference cham-
pionship during his or her freshman, sophomore, junior, and senior years, respectively.
We also include other information about the alumni, including years since graduation,
gender, ethnicity, SAT scores, ranking of the candidate by the admissions office when they ap-
plied to Anon U, course of study, and post-baccalaureate education.
Following Bristol [1991] and Ehrenberg and Smith [2003], the model has a set of indica-
tors for the general economic environment that might affect giving by all alumni, including the
percentage change in the S&P 500, GDP, the unemployment rate, and the maximal marginal per-
sonal income tax rate. An alternative strategy to account for such factors would be to include
time effects; this is not feasible because some of our specifications include variables that sum to
the same value for every individual in a given year.
3.2 Econometric Model
We consider first the question of whether in a given year, athletic performance affects the
amounts of money that an alumnus donates for general purposes and to the athletic program.6 In
this context, we face two issues that arise in all studies of donative behavior that use individual
6 One might argue that causation runs in the other direction--higher donations lead to better performance, through, for example, the purchase of better training equipment. Because we measure how giving in this year is affected by athletic performance in the previous year, this possibility seems unlikely to be important.

8
data. First, a substantial number of the observations are zero; second, there are a few very large
outliers. For example, the three largest gifts in our sample are $3.2, $6.2, and $34.5 million. To
address the first issue, we estimate each relationship with a Tobit model, which explicitly ac-
counts for censoring.7 The second problem suggests that we transform the data to reduce the in-
fluence of outliers; we take logarithms. Because the logarithm of zero is not defined, we set the
164 positive gifts for general purposes that were less than or equal to one dollar equal to one dol-
lar and one cent (there were no gifts to athletics in that range).8 In effect, then, we have censor-
ing at the point where the logarithm of the gift is equal to zero, and can then apply a Tobit model
straightforwardly. There is, of course, some arbitrariness to this procedure. To assess its robust-
ness, we also estimate the models in levels, eliminating the top one percent of the observations in
order to reduce the impact of outliers. As shown below, the substantive results with respect to the
impact of athletic performance variables are not affected.9
To estimate the model for athletic giving, we use only the sample of former varsity ath-
letes, as they make the vast majority of gifts to athletics.10 As stressed above, it is not clear what
dimension of athletic performance is most relevant - the alumnus’s team when he or she was an
undergraduate or the performance of the most visible sports, football and men’s basketball. Our
specification includes all of these variables on the right hand side.11 To test whether former ath-
7 We present Tobit estimates for both giving for general purposes and giving to the athletic program. We do not present Tobit results for total giving as well. This would be logically inconsistent—if the variables Y and Z can both be modeled as Tobits, then Y+Z cannot. 8 No changes emerge when these observations are simply deleted. 9 The Tobit estimates allow us to calculate not only the marginal effects of the right hand side variables on the un-conditional amount of giving, but also on the probability of being censored, that is, the probability of making a gift. These marginal effects and their standard errors are the same up to a constant of proportionality. In Table 2, that constant is 6.3 for Column (1), 4.5 for Column (2), 6.1 for Column (3), and 3.8 for Column (4). 10 21,791 of the 22,797 gifts to the athletic program are from former athletes. Many of the remainder seem to be from alumni parents of current students who are not athletes themselves; we would not expect their giving to react to team performance. 11 A possible additional measure would be the overall performance of all teams while the alumnus was an undergra-duate. However, this variable is collinear with the class effects, so both cannot be included. If we were to include

9
letes react differently to changes in the football and men’s basketball teams’ performances, we
include an interaction between the indicator for having been a varsity athlete and the perfor-
mance of football and men’s basketball, respectively. We also include the other variables de-
scribed above: a set of team effects (equal to one if the alumnus was on the associated team, and
zero otherwise), a set of the alumnus’s personal characteristics, and a set of annual variables that
characterize the state of the macroeconomic environment. In addition, the model includes loca-
tion effects (state or foreign country of residence in that year), and class effects (equal to one if
the alumnus graduated in a given year and zero otherwise). The class effects control for common
influences on alumni in the same class, such as the political milieu when they were undergra-
duates, the presence of certain professors or administrators, and so on. Given a Tobit specifica-
tion, donations for individual i in year t, Git, can be written:
Git = max[0, β1*OwnTeamWoni,t-1 + β2*Basketballt-1 + β3*Footballt-1 + β4*Athletei*Basketballt-1 +
β6*Athletei* Footballt-1 + γ*UndergradPerformancei + θ*Teami + δ*Xit + λ*Classi +ω*Yeart],
where OwnTeamWoni,t-1 equals one if the individual’s former team won its conference championship in
the prior year, Basketballt-1 equals one if the basketball team won its conference championship in the prior
year, Footballt-1 equals one if the football team won its conference championship in the prior year,12 Ath-
letei equals one if the individual was a varsity athlete, UndergradPerformancei is a vector of dichotomous
variables indicating whether the individual’s varsity team won its conference championship in each of the
years he or she was an undergraduate, Team, Class and Year are team, class, and year effects, and Xit is a
set of personal characteristics, some of which vary with time. The standard errors are adjusted for
clustering within individuals.
overall performance, then we would be attributing all factors unique to a given class’s undergraduate experience to athletic performance. 12 Former members of the football team are only affected through their own-team championship variable; that is, for these alumni OwnTeamWon is equal to one if they won their conference championship, but Football is not. Mem-bers of the men’s basketball team are treated symmetrically.

10
A consistent result in the literature is that patterns of charitable giving tend to differ by
gender (Andreoni and Vesterlund [2001]). We therefore estimate our models separately for men
and women.
4. Results
Table 2 shows our basic results for males (in columns (1) and (2) and females (in col-
umns (3) and (4)) In addition to the variables listed in the tables, the models include the other
right hand side variables mentioned in the previous section, which are suppressed for brevity.
4.1 Males
Column (1) shows the incremental effects on the log of the amount of giving for general
purposes.13 Marginal effects are calculated at the mean, except for binary variables, for which
marginal effects measure the change from 0 to 1. When an alumnus’s former team wins a confe-
rence championship, his giving increases by a statistically significant 7.0 percent. This strikes us
as a quantitatively substantial effect. An interesting question is whether this effect varies by
sport, and if so, do “individual” sports like swimming differ from “team” sports like crew. There
are no clear patterns among different types of teams. Perhaps this is not surprising. At the end of
the day, a team is still the sum of its members, and members of “individual” sports can develop
as much loyalty to their teams as members of “team” sports.
We turn next to the performance of the football and basketball teams. We find that the
impact of football success does in fact depend on whether the alumnus was formerly an athlete.
For non-athletes, the effect is statistically insignificant. For former athletes, the effect is given by
the sum of the main effect and the interaction, which is statistically different from zero (p =
13 Note that the reference group in this case consists of both former athletes whose team did not win a championship and non-athletes. When the reference group is limited to former athletes whose teams were unsuccessful, the coeffi-cient on a conference championship is nearly identical to this figure.
11
0.019). However, the magnitude of the sum, 0.047, is smaller than the own-team effect. The bas-
ketball team’s record has a negative effect on the amount given (-2.5 percent) for those who are
not former athletes; for former athletes, the magnitude is close to zero and statistically insignifi-
cant (p = 0.68). These results echo those of Turner, Meserve and Bowen [2001], who found that
the magnitude and even sign of the impact of a winning season for a visible team are not robust
with respect to choice of sample. They conjecture that when alumni see success among these
teams, they may believe that the school is spending too much on the athletic program, and there-
fore reduce their giving (p. 824). Without taking a strong stance, since the effect is small, we
note that such a phenomenon might explain our finding. The last four coefficients in column (1)
indicate that the performance of one’s team as an undergraduate exerts no statistically discernible
impact on the amount of giving for general purposes.
Column (2) shows the results for the log of donations to the athletic program. Giving to
athletics increases by about 7.6 percent when an alumnus’s former team wins a conference
championship. A successful football season has a negative effect, and a successful basketball
season has a positive effect. The reasons behind these opposing signs are unclear.
The performance of the alumnus’s team as an undergraduate has a substantial effect on
the amount of subsequent giving to the athletic program. A conference win in the senior year, for
example, increases subsequent giving by 8.0 percent each year. The negative effect of a fresh-
man year conference championship may arise from the pressure that these athletes feel to sustain
their success. The four coefficients on undergraduate performance are jointly significant (p =
0.0019).
4.2 Females

12
The results for women are in columns (3) and (4) of Table 2. Reading across the first
rows, we see that the coefficients on the own team’s record are small and statistically insignifi-
cant. The success of an alumna’s former team affects neither her giving for general purposes nor
to the athletic program. The football team’s record has no discernible effect on giving, while a
successful basketball season results in small but statistically significant decreases in giving for
general purposes. Finally, unlike the case for males, when an alumna’s team was successful
when she was an undergraduate, it generally has no impact on her subsequent giving to the ath-
letic program. Comparing the first two columns in Table 2 with the second 2 columns, it would
be fair to say that athletic performance, both contemporaneous and when the student was an un-
dergraduate, is a less important determinant of giving for women than it is for men.
4.3 Intertemporal Considerations
The coefficients in the first row of Table 2 indicate that, at least for males, the perfor-
mance of an alumnus’s former team in a given year increases his donations that year. Perhaps,
though, this merely represents a reallocation of a fixed amount of lifetime giving across time ra-
ther than an actual increase in giving. To investigate this possibility, we estimate a cross-
sectional analogue to our panel model, with the total present value of lifetime giving as the de-
pendent variable. The total number of wins of the alumnus’s own team since graduation is signif-
icant, indicating that lifetime giving is increased by athletic success. Thus, our estimates are not
just isolating an intertemporal shift in giving.
5. Alternative Specifications
In order to assess the robustness of our results, we estimated a number of alternative spe-
cifications of our model.
13
Removing outliers. As is the case at most universities, a few large gifts account for a dis-
proportionate share of total donations to Anon U. For example, the top one percent of positive
gifts for general purposes accounted for 70.1 percent of the total in 2006; the corresponding fig-
ure for athletic gifts was 62.3 percent of the total. This raises the possibility that our results are
being driven by just a few observations. Our use of logs for the left hand side variables attenuates
the impact of outliers, but as another check, we re-estimate the Tobit models with the top one
percent of donations in each category deleted from the sample. The results are in Table 3a (col-
umns (1a) and (2a)) for men and Table 3b (columns (1b) and (2b)) for women. When we com-
pare these results to their counterparts in Table 2, we see that the estimates are similar. In partic-
ular, the current performance of a former athlete’s team has a significantly positive effect on both
giving for general purposes and athletic giving for men, but no statistically discernible effect for
women. Also, the performance of an alumnus’s team when he was an undergraduate increases
his subsequent giving to the athletic program, but this is not the case for alumnae.
Levels versus logs. A related question is whether the substantive results would change if
we analyzed the level of donations as opposed to the logs. The last two columns of Tables 3a and
3b present the results when the Tobit model is estimated in levels, again deleting the top one per-
cent of the donations in each category. If we compare these results to their counterparts in the
first two columns in Tables 3a and 3b, respectively, we see that the signs and patterns of statis-
tical significance are similar. Our qualitative results are not sensitive to the distinction between
logs and levels.
Fixed effects and permanent income. A drawback to our data set is that it includes no in-
formation on income or wealth. One way to deal with this issue begins with the hypothesis that
giving depends on the alumnus’s permanent income. If so, then a sensible approach is fixed ef-

14
fects estimation, which controls for any attributes of an alumnus that do not change over time (or
at least over the length of our sample period). Indeed, a fixed effects model takes into account
any time-invariant unobservable variables that might drive giving, such as affinity to Anon U,
generosity, quality of undergraduate experience, and so on. Estimating fixed effects with Tobit is
cumbersome. Therefore, we use ordinary least squares. The results are reported in Table 4. Com-
paring the results for men to those in Table 2, we see that they are remarkably robust. In particu-
lar, the magnitudes of the coefficients on own-team performance are very similar. The impact of
football success on giving for general purposes in the fixed effects model is somewhat larger
than in Table 2, but the results are still quite close. In the same way, a comparison of Table 2 and
the last two columns of Table 4 indicates that fixed effects estimation does not lead to any sub-
stantial changes for women. We conclude that unobserved differences across individuals are not
driving our results.
Substitution between athletic and general purpose giving. Our specification does not pro-
vide a direct way to determine whether athletic giving and giving for general purposes are substi-
tutes. To investigate this issue, we examine the allocation of giving by the subsample of alumni
who were varsity athletes and made a positive gift to Anon U in a given year. Specifically, we
estimate a regression of the proportion of giving that went to the athletic program on the same
right hand side variables as in column (2) of Table 2.14 For men, the coefficient on own team’s
record is small but precisely estimated, 0.0151 (s.e. = 0.00284). Thus, if an alumnus’s former
team wins its conference championship, the proportion of his or her gift that goes to athletics in-
creases by only 1.5 percentage points. For women, the effect is tiny and insignificant (-0.00086,
s.e. = 0.00273). The impact of football and men’s basketball is significant for both men and
women, with football having a negative effect and basketball having a positive effect. The coef- 14 Because the variable is bounded between zero and one, we use two-limit Tobit estimation.
15
ficients are fairly small, around one percentage point. With respect to the undergraduate athletic
experience, a freshman year conference win for men reduces the proportion going to athletics by
1.5 percentage points (s.e. = 0.00314), while junior and senior year wins are positive and signifi-
cant, about 1.8 percentage points each. For women, only a junior year conference championship
is positive and significant. Thus, conference championships during an alumnus’s years as an up-
perclassman shift the proportion of giving to athletics permanently. But the amounts involved are
not substantial--out of a total gift of $100 from a male, winning a conference championship as a
senior shifts $1.84 to athletics. We conclude that in our data, shifting between giving for general
purposes and the athletic program is not an important phenomenon.
Time varying coefficients. Our specification implicitly assumes that the effect of athletic
success does not depend on the passage of time. It is the same regardless of the number of years
since the alumnus graduated and regardless of the calendar year. It could be, though, that the in-
fluence of the athletic program changes with time. One can imagine affinity to one’s team either
increasing or decreasing with the passage of years. In the same way, it is possible that because of
other changes taking place over time (for example, more televised sports available over cable),
the impact of athletics at one’s alma mater has changed. To investigate these possibilities, we
estimated variants of our basic models in which we interacted the team success variables with
years since graduation and with a time trend. We were unable to isolate any robust results with
respect to the passage of time on the impact of athletic success for either men or women.
5. Summary and Conclusions
We use data on individual alumni from a selective university to estimate the impact of
athletic success upon donative behavior. Previous attempts to analyze this question have relied
upon institutional level data; the use of micro data allows us to document the importance of sev-
16
eral variables that simply cannot be investigated with aggregate data. For example, previous stu-
dies have focused on the records of the most visible sports, football and men’s basketball. Our
data allow us to examine the impact of the team on which the alumnus participated. We find that
football and men’s basketball are less important as determinants of giving than the success of an
alumnus’s own team. Moreover, among former male athletes, donations to the athletic program
depend on the success of the alumnus’s team when he was an undergraduate.
Of course, using data from a single institution comes with a price: it is not clear whether
our results would generalize to other schools. In particular, at schools with more visible football
and basketball programs, the effects of success for those teams might be larger and more robust.
That said, there is no reason to believe that former athletes at such institutions fail to develop an
affinity for their own teams—our results on the importance of own-team championships could
very well generalize. To the extent that this is true and universities care about turning their un-
dergraduates into future donors, it would seem that universities should nurture broad varsity ath-
letic programs. To the contrary, though, many schools have been cutting less visible men’s teams
in order to focus more closely on football.15 Hence, examining the degree to which our findings
generalize to, for example, large state universities with popular football programs, is an impor-
tant subject for future research.
15 See, for example,Vegosen [2007].
17
References
Andreoni, James and Lisa Vesterlund. “Which is the Fairer Sex? Gender Differences in Altruism.” Quarterly Journal of Economics. Vol. 116, No. 1, p. 293. Feb 2001. Bowen, William G. and Sarah E. Levin, Reclaiming the Game: College Sports and Edu-cational Values, Princeton University Press, 2005.
Bristol, Ralph, “How Much Will Alumni Give in the Future?” Planning for Higher Edu-cation 20, Winter 1991-92, pp. 1-12.
Clotfelter, Charles, “Who Are the Alumni Donors? Giving by Two Generations of Alum-ni from Selective Colleges,” Nonprofit Management and Leadership 12, Winter 2001, pp. 119-138.
Clotfelter, Charles, “Alumni Giving to Elite Private Colleges and Universities ,” Econom-ics of Education Review 22, 2003, pp. 109-120.
Cunningham, Brendan M. and Carlena K. Cochi-Ficano, “The Determinants of Donative Revenue Flows from Alumni of Higher Education: An Empirical Inquiry,” The Journal of Hu-man Resources 37, Summer 2002, pp. 540-569. Dugan, Kelly, Charles H. Mullin and John J. Siegfried, “Undergraduate Financial Aid and Subsequent Alumni Giving Behavior,” Working Paper, Vanderbilt University, 1999.
Ehrenberg, Ronald and Christopher L. Smith, “The Sources and Uses of Annual Giving at Private Research Universities,” Economics of Education Review 22, June 2003, pp. 223-341.
Frank, Robert H., “Challenging the Myth: A Review of the Links Among College Athlet-ic Success, Student Quality, and Donations,” Cornell University, Working Paper, May 2004. Goff, Brian, “Effects of University Athletics on the University: A Review and Extension of Empirical Assessment,” in Fizel, John and Rodney Fort (eds), Economics of College Sports, Praeger Publishers, 2004, pp. 65-85. Grimes, Paul W. and George A Chressanthis, Alumni Contributions to Academics: The Role of Intercollegiate Sports and NCAA Sanctions,” American Journal of Economics and Soci-ology 53, January 1994. Humphreys, Brad R. and Michael Mondello, “More Evidence on Intercollegiate Athletic Success and Donations,” Florida State University, Working Paper, April 2005. Kahn, Lawrence M, “Cartel Behavior and Amateurism in College Sports,” Journal of Economic Perspectives 21, No. 1, Winter 2007, pp. 209-226.

18
Litan, Robert E., Jonathan M. Orszag, and Peter R. Orszag, “The Empirical Effects of Collegiate Athletics: An Interim Report,” Sebago Associates, Working Paper, August 2003. Monks, James, “Patterns of Giving to One’s Alma Mater among Young Graduates from Selective Institutions,” Economics of Education Review 22, 2003, pp. 121-130. Meer, Jonathan and Harvey S. Rosen, “Altruism and the Child-Cycle of Alumni Giving,” American Economic Journal: Economic Policy, forthcoming. Shulman, James L. and William G. Bowen, The Game of Life: College Sports and Educa-tional Values, Princeton University Press, 2002. Turner, Sarah, Lauren A. Meserve and William G. Bowen, “Winning and Giving: Foot-ball Results and Alumni Giving at Selective Private Colleges and Universities,” Social Science Quarterly, December 2001, pp. 812-826. Vegosen, Jon, “Starve Football, Feed Athletics,” New York Times, January 28, 2007, http://www.nytimes.com/2007/01/28/opinion/nyregionopinions/28NJvegosen.html

19
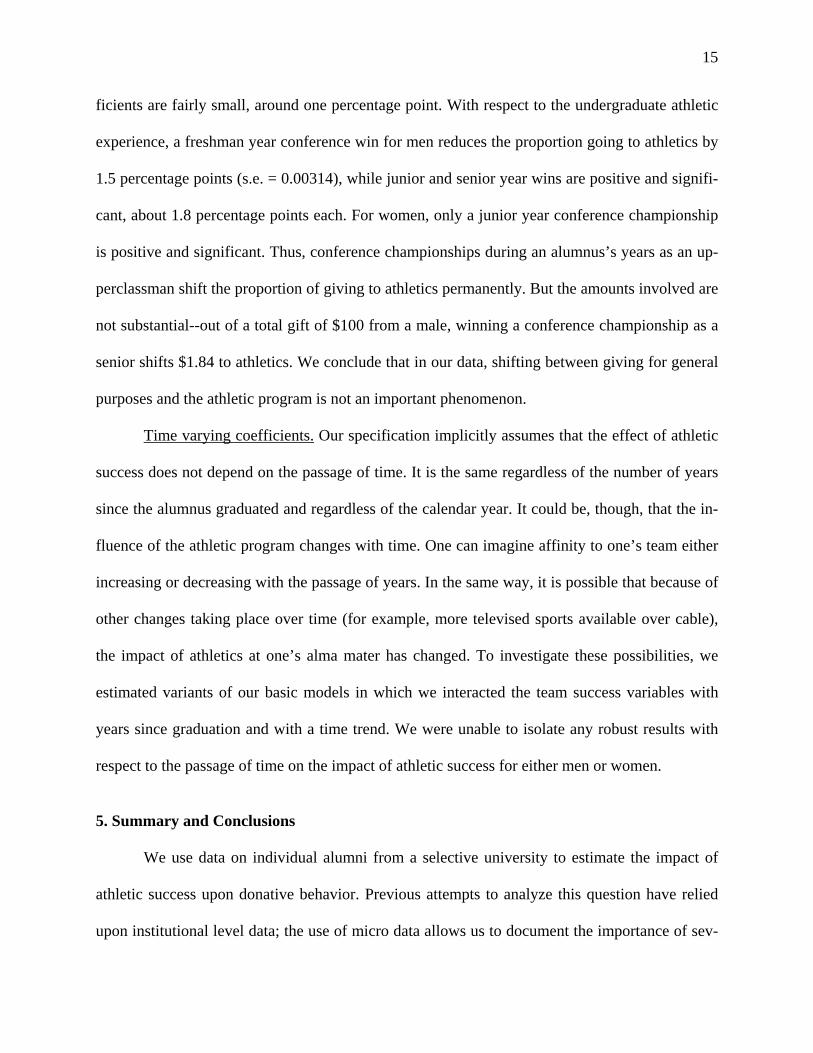
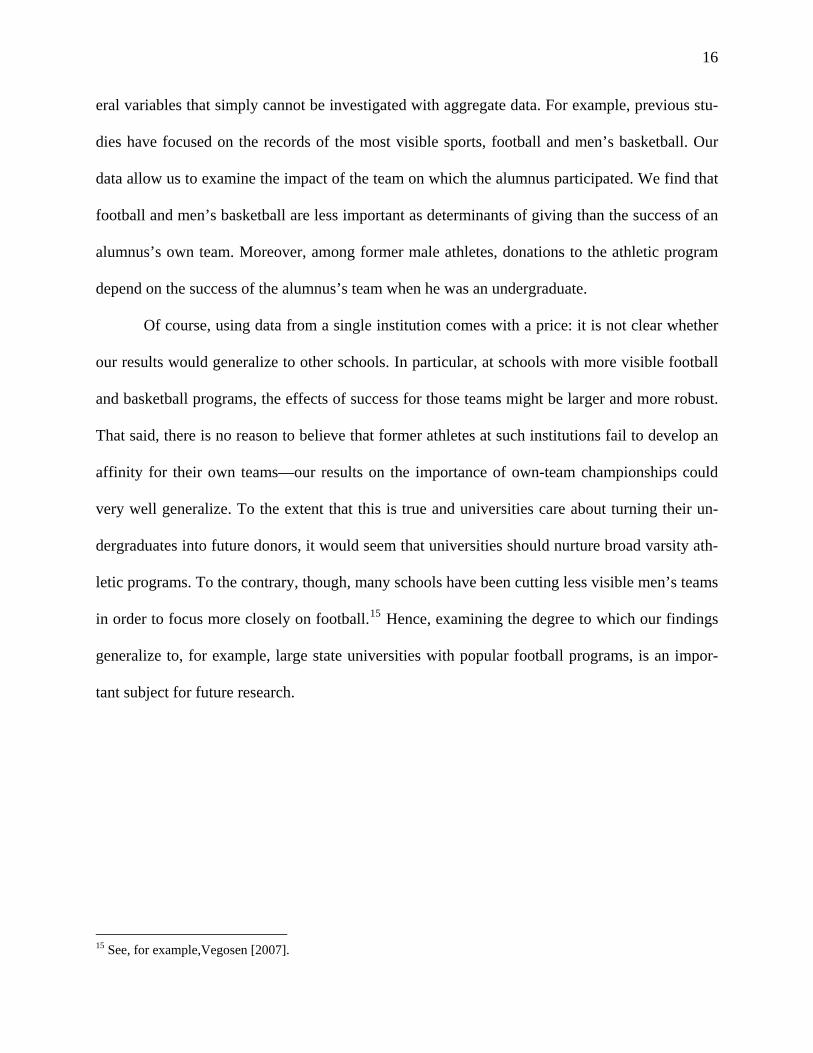
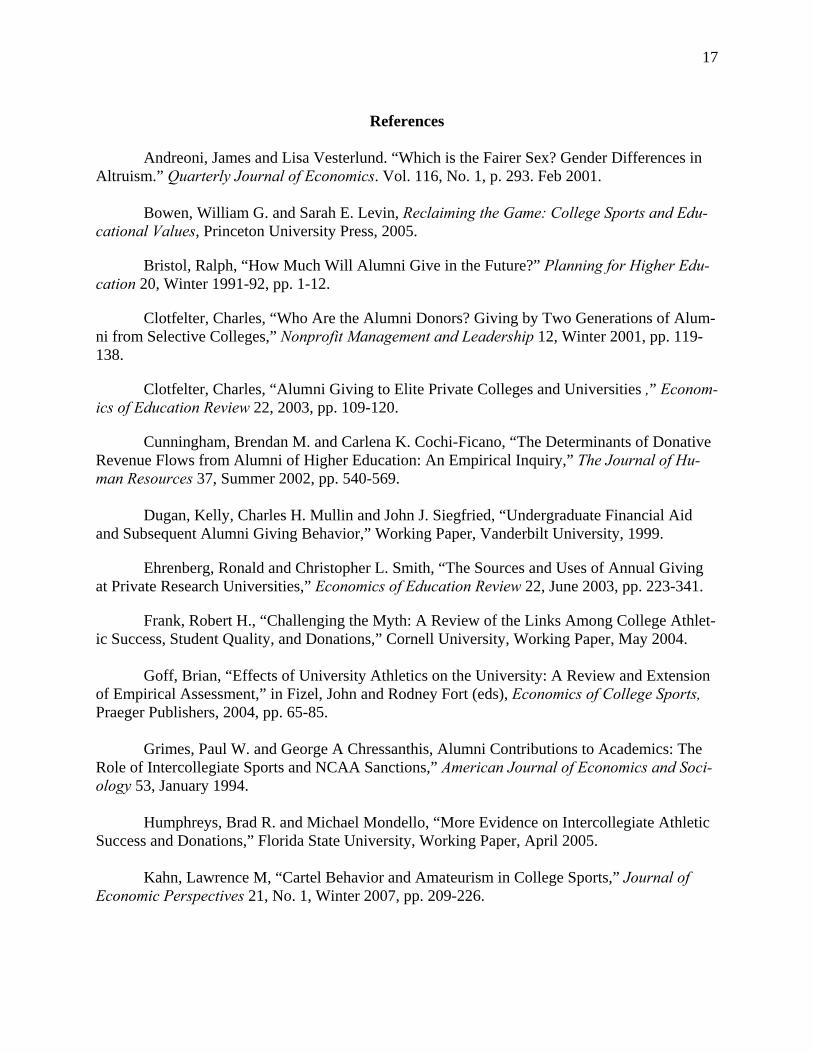
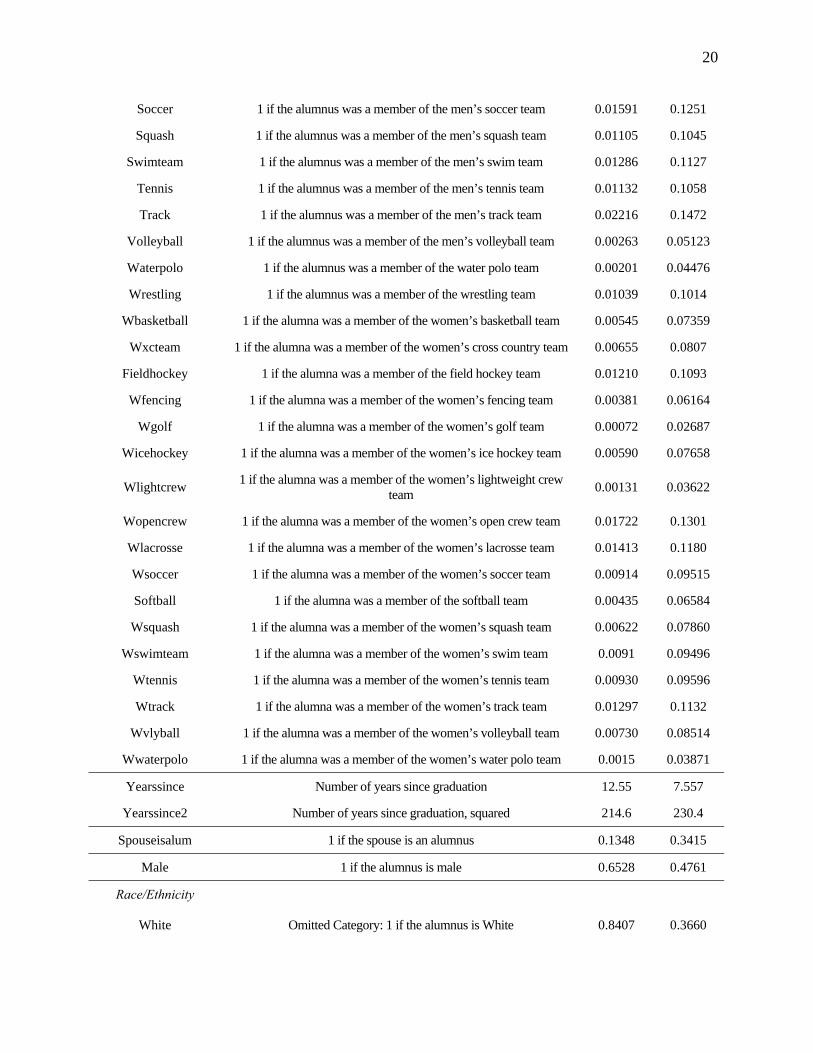
Table 1* Variable Definitions and Summary Statistics
Variable Description Mean Standard Deviation
DidGenlGive 1 if any donation for general purposes given in year 0.5595 0.4965
DidAthGive** 1 if any donation for athletic purposes given in year 0.1388 0.3458
GenlGive Total giving for non-athletic purposes for year in 2006 dollars 507.0 53670
AthGive** Total giving for athletic purposes for year in 2006 dollars 57.32 1921
LogGenlGive Log of non-athletic giving in year in 2006 dollars 2.486 2.455
LogAthGive** Log of athletic giving in year in 2006 dollars 0.6427 1.657
OwnTeamRec*** 1 if the alumnus’s own team won the conference championship in the previous year 0.1126 0.3161
FootballRec 1 if the football team won the conference championship in the pre-vious year, unless the alumnus was a football player 0.114 0.317
BasketballRec 1 if the men’s basketball team won the conference championship in the previous year, unless the alumnus was a male basketball player 0.443 0.497
FreshmanRec 1 if the alumnus’s team won the conference championship during the alumnus’s freshman year 0.08098 0.2728
SophomoreRec 1 if the alumnus’s team won the conference championship during the alumnus’s sophomore year 0.08365 0.2769
JuniorRec 1 if the alumnus’s team won the conference championship during the alumnus’s junior year 0.08573 0.2800
SeniorRec 1 if the alumnus’s team won the conference championship during the alumnus’s senior year 0.09199 0.2890
Athlete 1 if the alumnus played a varsity sport 0.3366 0.4726
Basketball 1 if the alumnus was a member of the men’s basketball team 0.01497 0.1214
Baseball 1 if the alumnus was a member of the baseball team 0.01627 0.1265
Hvycrew 1 if the alumnus was a member of the men’s heavyweight crew team 0.02579 0.1585
Lightcrew 1 if the alumnus was a member of the men’s lightweight crew team 0.02225 0.1475
Xcteam 1 if the alumnus was a member of men’s cross country team 0.01079 0.1033
Fencing 1 if the alumnus was a member of the men’s fencing team 0.01407 0.1178
Football 1 if the alumnus was a member of the football team 0.05169 0.2214
Golf 1 if the alumnus was a member of the men’s golf team 0.00725 0.08481
Icehockey 1 if the alumnus was a member of the men’s ice hockey team 0.01351 0.1155
Lacrosse 1 if the alumnus was a member of the men’s lacrosse team 0.02069 0.1424
20
Soccer 1 if the alumnus was a member of the men’s soccer team 0.01591 0.1251
Squash 1 if the alumnus was a member of the men’s squash team 0.01105 0.1045
Swimteam 1 if the alumnus was a member of the men’s swim team 0.01286 0.1127
Tennis 1 if the alumnus was a member of the men’s tennis team 0.01132 0.1058
Track 1 if the alumnus was a member of the men’s track team 0.02216 0.1472
Volleyball 1 if the alumnus was a member of the men’s volleyball team 0.00263 0.05123
Waterpolo 1 if the alumnus was a member of the water polo team 0.00201 0.04476
Wrestling 1 if the alumnus was a member of the wrestling team 0.01039 0.1014
Wbasketball 1 if the alumna was a member of the women’s basketball team 0.00545 0.07359
Wxcteam 1 if the alumna was a member of the women’s cross country team 0.00655 0.0807
Fieldhockey 1 if the alumna was a member of the field hockey team 0.01210 0.1093
Wfencing 1 if the alumna was a member of the women’s fencing team 0.00381 0.06164
Wgolf 1 if the alumna was a member of the women’s golf team 0.00072 0.02687
Wicehockey 1 if the alumna was a member of the women’s ice hockey team 0.00590 0.07658
Wlightcrew 1 if the alumna was a member of the women’s lightweight crew team 0.00131 0.03622
Wopencrew 1 if the alumna was a member of the women’s open crew team 0.01722 0.1301
Wlacrosse 1 if the alumna was a member of the women’s lacrosse team 0.01413 0.1180
Wsoccer 1 if the alumna was a member of the women’s soccer team 0.00914 0.09515
Softball 1 if the alumna was a member of the softball team 0.00435 0.06584
Wsquash 1 if the alumna was a member of the women’s squash team 0.00622 0.07860
Wswimteam 1 if the alumna was a member of the women’s swim team 0.0091 0.09496
Wtennis 1 if the alumna was a member of the women’s tennis team 0.00930 0.09596
Wtrack 1 if the alumna was a member of the women’s track team 0.01297 0.1132
Wvlyball 1 if the alumna was a member of the women’s volleyball team 0.00730 0.08514
Wwaterpolo 1 if the alumna was a member of the women’s water polo team 0.0015 0.03871
Yearssince Number of years since graduation 12.55 7.557
Yearssince2 Number of years since graduation, squared 214.6 230.4
Spouseisalum 1 if the spouse is an alumnus 0.1348 0.3415
Male 1 if the alumnus is male 0.6528 0.4761
Race/Ethnicity
White
Omitted Category: 1 if the alumnus is White
0.8407
0.3660

21
Amerind 1 if the alumnus is a Native American 0.00333 0.05759
Black 1 if the alumnus is Black 0.06033 0.2381
Hispanic 1 if the alumnus is Hispanic 0.03610 0.1865
Asian 1 if the alumnus is Asian 0.06292 0.2428
Secondary Schooling
Public
Omitted Category: 1 if the alumnus attended public school
0.5747
0.4944
Boarding 1 if the alumnus attended boarding school 0.1407 0.3477
Private 1 if the alumnus attended private school 0.2673 0.4425
Schloth 1 if the alumnus attended another type of school 0.01737 0.1306
SATmath SAT math score. Scores prior to 1996 are adjusted to reflect re-centering of the scoring scale. 703.2 75.49
SATverbal SAT verbal score. Scores prior to 1996 are adjusted to reflect recentering of the scoring scale. 702.2 75.10
Admissions Office “Non-Academic”
Ranking
A
Omitted Category: 1 if the alumnus received the highest non-academic ranking from the admissions office 0.03378 0.1807
B 1 if the alumnus received the second highest non-academic ranking from the admissions office 0.4798 0.4996
C 1 if the alumnus received the third highest non-academic ranking from the admissions office 0.4087 0.4916
D 1 if the alumnus received the fourth highest non-academic ranking from the admissions office 0.07395 0.2617
E 1 if the alumnus received the fifth highest non-academic ranking from the admissions office 0.00381 0.06159
Admissions Office “Academic” Ranking
A
Omitted Category: 1 if the alumnus received the highest academic ranking from the admissions office 0.1501 0.3572
B 1 if the alumnus received the second highest academic ranking from the admissions office 0.4262 0.4945
C 1 if the alumnus received the third highest academic ranking from the admissions office 0.2727 0.4453
D 1 if the alumnus received the fourth highest academic ranking from the admissions office 0.1432 0.3503
E 1 if the alumnus received the fifth highest academic ranking from the admissions office 0.00784 0.08817
Clubsport 1 if the alumnus played on a club team 0.1222 0.3275

22
Honors 1 if the alumnus graduated magna, summa, or cum laude 0.4571 0.4982
Greek 1 if the alumnus was a member of a fraternity or sorority 0.7405 0.4383
Major
Molbio Omitted Category: 1 if the alumnus majored in molecular biology 0.02179 0.1460
Small Social Science 1 if the alumnus majored in Anthropology, Urban Studies, or So-ciology. 0.02849 0.1664
English 1 if the alumnus majored in English 0.1097 0.3126
Economics 1 if the alumnus majored in Economics 0.08041 0.2719
Public Policy 1 if the alumnus majored in Public Policy 0.06041 0.2382
Political Science 1 if the alumnus majored in Political Science 0.08731 0.2823
Psychology 1 if the alumnus majored in Psychology 0.04767 0.2131
History 1 if the alumnus majored in History 0.1207 0.3258
MAE 1 if the alumnus majored in Mechanical/Aerospace Engineering 0.03569 0.1855
EE/CS 1 if the alumnus majored in Electrical Engineering or Computer Science 0.05383 0.2257
Arch & Civ 1 if the alumnus majored in Architecture or Civil Engineering 0.07145 0.2576
Small Humanities 1 if the alumnus majored in Art, Art History, Classics, East Asian Studies, Linguistics, Music, Near Eastern Studies, Philosophy,
Religion, or Languages and Literature departments 0.1149 0.3189
Small Engineering 1 if the alumnus majored in “Engineering”, Operations Research and Financial Engineering, or Chemical Engineering 0.03085 0.1729
Small Sciences 1 if the alumnus majored in Applied Mathematics, Astrophysics, Biochemistry, Biology, Chemistry, Ecology and Evolutionary
Biology, Geology, Mathematics, Physics, or Statistics 0.1367 0.3436
Minor
No Minor Omitted Category: 1 if the alumnus received no minor 0.7856 0.4104
African/African-American Studies
1 if the alumnus received a minor in African or African-American Studies 0.02007 0.1402
American Studies 1 if the alumnus received a minor in American Studies 0.02385 0.1526
Latin 1 if the alumnus received a minor in Latin 0.00153 0.03913
Finance 1 if the alumnus received a minor in Finance 0.00232 0.04812
Theater 1 if the alumnus received a minor in Theater 0.0132 0.1141
Public Policy 1 if the alumnus received a minor in Public Policy 0.05176 0.2215
Other Engineering 1 if the alumnus received a minor in Architecture, Basic Engineer-ing, Bioengineering, Electrical Engineering, Geological Engineer-
ing, Management, Materials Sciences, or Robotics. 0.01869 0.1354

23
Other Sciences 1 if the alumnus received a minor in Applied and Computational Mathematics, Biophysics, Cognitive Studies, Environmental Stu-
dies, Science in Human Affairs, or Neuroscience. 0.02694 0.1619
Other Humanities 1 if the alumnus received a minor in a humanities field 0.05208 0.2222
Teaching 1 if the alumnus received a teaching certificate 0.01358 0.1157
Reunion 1 if the year after graduation is some multiple of 5 0.1889 0.3914
Post Baccalaureate Education
NoPostAB
Omitted Category: 1 if the alumnus has no advanced degree 0.5246 0.4994
PhD 1 if the alumnus has a Ph.D. or equivalent degree 0.06743 0.2508
Masters 1 if the alumnus has a masters 0.1413 0.3483
JD 1 if the alumnus has a JD 0.1060 0.3078
MDDDS 1 if the alumnus has a medical degree 0.06399 0.2447
MBA 1 if the alumnus has an MBA 0.09670 0.2956
Annual Variables†
SPChange
Percent change in the S&P 500 index 0.09854 0.1538
Election 1 if a presidential election year 0.2565 0.4367
GDP Gross domestic product in billions of 2000 dollars 8745 1654
Unemp Unemployment rate 5.654 1.154
TopRate Maximum personal income tax rate 0.3794 0.04490 *Except where otherwise noted, figures are based on 449,909 observations on gift-giving from 1983 to 2006. 30,822 alumni who graduated from 1972 to 2004 are represented. We set gifts for general purposes that are greater than zero but less than or equal to $1.00 equal to $1.01. Therefore, observations for which there is no giving are asso-ciated with $1, whose logarithm is zero. **Based only on the sample of alumni athletes. There are 150,923 observations on gift-giving from 1983 to 2006. 10,774 alumni athletes who graduated from 1972 to 2004 are represented. ***The variables in this block are defined over the entire sample. Hence, a value of zero occurs either if an individ-ual was not a varsity athlete or the individual was a varsity athlete and his or her team did not win a conference championship. †These variables are based on annual data. The figures presented here weight the annual values by the number of observations in each year.

24
Table 2* Determinants of Giving for General Purposes and for the Athletic Program
Males Females
Variable
(1) Amount of gift for general purposes
(logs)
(2) Amount of gift to
the athletic program (logs)
(3) Amount of gift for general purposes
(logs)
(4) Amount of gift to the athletic pro-
gram (logs)
Own team’s record 0.07031 (0.01735)
0.07638 (0.01056)
-0.00535 (0.02543)
-0.00627 (0.01422)
Football team’s record
0.01360 (0.01383)
-0.03966 (0.01374)
-0.02053 (0.01701)
-0.04224 (0.04281)
Athlete* Football team’s record
0.03473 (0.02719) - 0.02647
(0.03592) -
Basketball team’s record
-0.02503 (0.01042)
0.04460 (0.00793)
-0.03858 (0.01191)
0.02239 (0.0214)
Athlete * Basketball team’s record
0.02515 (0.02205) - 0.04732
(0.02911) -
Freshman Year Conference Win
-0.07597 (0.063)
-0.07797 (0.03238)
0.1408 (0.07784)
0.04961 (0.05245)
Sophomore Year Conference Win
0.07111 (0.06401)
0.03152 (0.03533)
0.03201 (0.08037)
0.00496 (0.03021)
Junior Year Conference Win
0.04129 (0.06437)
0.06772 (0.0378)
-0.08784 (0.07641)
0.07775 (0.07559)
Senior Year Conference Win
0.02301 (0.06268)
0.08098 (0.03548)
0.00814 (0.07333)
-0.00287 (0.02781)
* Columns (1) and (3) show the incremental effects on the logarithm of amount of the gift in a given year for general purposes for men and women, respectively. Columns (2) and (4) show the incremental effects on the logarithm of amount of the gift to the athletic program for men and women, respectively. The figures are marginal effects gener-ated by a Tobit model. Columns (1) is based on the overall male sample of 293,683 observations, while column (3) uses the overall female sample of 156,226 observations. Columns (2) uses the male athlete-only sample, with 107,946 observations, while columns (4) uses the female athlete-only sample, with 42,978 observations. The figures in parentheses are standard errors; coefficients that are statistically significant at the 5% level are italicized. Standard errors are adjusted for clustering based on individuals. In addition to the variables listed, the regressions include the variables listed in the Appendix, as well as team effects, location effects, and class effects, which are not reported for brevity. Full results are available upon request.

25
Table 3a* Determinants of Giving for General Purposes and for the Athletic Program (Males)
(Top One Percent of Donations in Each Category Omitted from Sample)
Variable
(1a) Amount of gift for general purposes
(logs)
(2a) Amount of gift to the
athletic program (logs)
(3a) Amount of gift for general purposes
(levels)
(4a) Amount of gift to
the athletic program ( levels)
Own team’s record 0.06152 (0.01672)
0.07461 (0.0104)
7.335 (2.749)
4.972 (0.7028)
Football team’s record
0.01309 (0.01338)
-0.04172 (0.01356)
0.4856 (2.012)
-2.029 (0.8359)
Athlete* Football team’s record
0.03999 (0.0261) - 6.195
(3.963) -
Basketball team’s record
-0.02765 (0.01)
0.04306 (0.00784)
0.6403 (1.536)
2.947 (0.5130)
Athlete * Basketball team’s record
0.02881 (0.02101) - -0.2286
(3.048) -
Freshman Year Conference Win
-0.07925 (0.05884)
-0.07827 (0.03177)
-7.535 (7.704)
-5.083 (2.014)
Sophomore Year Conference Win
0.05095 (0.05979)
0.02527 (0.03459)
3.462 (7.647)
2.483 (2.315)
Junior Year Conference Win
0.03563 (0.06051)
0.06802 (0.0372)
8.107 (7.999)
4.058 (2.356)
Senior Year Conference Win
0.00778 (0.05899)
0.07972 (0.03491)
0.8286 (7.736)
5.630 (2.300)

26
Table 3b* Determinants of Giving for General Purposes and for the Athletic Program (Females)
(Top One Percent of Donations in Each Category Omitted from Sample)
Variable
(1b) Amount of gift for general purposes
(logs)
(2b) Amount of gift to the
athletic program (logs)
(3b) Amount of gift for general purposes
(levels)
(4b) Amount of gift to
the athletic program ( levels)
Own team’s record -0.00614 (0.02404)
-0.00778 (0.01491)
-0.5058 (2.180)
-0.4879 (0.8509)
Football team’s record
-0.00311 (0.01624)
-0.0414 (0.04215)
-0.7120 (1.414)
-1.886 (2.111)
Athlete* Football team’s record
0.01691 (0.03338) - 5.963
(3.171) -
Basketball team’s record
-0.03857 (0.0113)
0.02172 (0.02091)
-2.955 (1.077)
1.065 (1.122)
Athlete * Basketball team’s record
0.04266 (0.02701) - 5.011
(2.491) -
Freshman Year Conference Win
0.13102 (0.07169)
0.05017 (0.05257)
8.216 (6.143)
3.002 (3.305)
Sophomore Year Conference Win
0.01368 (0.07407)
0.00358 (0.02957)
6.820 (6.836)
1.270 (1.983)
Junior Year Conference Win
-0.06768 (0.07103)
0.07387 (0.07236)
-4.938 (6.480)
2.489 (2.867)
Senior Year Conference Win
0.00039 (0.06835)
-0.00269 (0.02742)
0.8622 (6.053)
0.5888 (1.479)
*The estimates in this table remove the top one percent of the positive gifts given to the athletic program and the top one percent of the positive gifts for general purposes. Columns (1a and b) and (2a and b) show the incremental ef-fects on the logarithm of amount of the gift in a given year for general purposes and to the athletic program, respec-tively. Columns (3a and b) and (4a and b) show the incremental effects on the dollar amount of gifts made in a given year for general purposes and to the athletic program, respectively. All results report marginal effects generated by a Tobit model. Columns (1a) and (3a) use the overall male sample of 291,987 observations, while columns (1b) and (3b) use the overall female sample of 155,292 observations. Columns (2a) and (4a) use the male athlete-only sam-ple, with 107,785 observations, while columns (2b) and (4b) use the female athlete-only sample, with 42,931 obser-vations. The figures in parentheses are standard errors; coefficients that are statistically significant at the 5% level are italicized. Standard errors are adjusted for clustering based on individuals. In addition to the variables listed, the regressions include the variables listed in Table 1, team effects, location effects, and class effects, which are not re-ported for brevity. Full results are available upon request.

27
Table 4* Fixed Effects Estimates
Males Females
Variable
(1) Amount of gift for general purposes
(logs)
(2) Amount of gift to
the athletic program(logs)
(3) Amount of gift for general purposes
(logs)
(4) Amount of gift to
the athletic program(logs)
Own team’s record 0.06913 (0.01300)
0.06711 (0.01046)
0.01583 (0.01815)
0.01883 (0.01338)
Football team’s record
0.02485 (0.01243)
-0.0253 (0.01465)
-0.00357 (0.01564)
-0.0564 (0.01927)
Athlete* Football team’s record
-0.01299 (0.02156) - -0.04187
(0.02861) -
Basketball team’s record
-0.00651 (0.00800)
0.05571 (0.009)
-0.01435 (0.00970)
0.03497 (0.01205)
Athlete * Basket-ball team’s record
-0.01013 (0.01352) - -0.01814
(0.01801) -
* Columns (1) and (3) shows the incremental effects on the logarithm of amount of the gift in a given year for gen-eral purposes for males and females, respectively. Columns (2) and (4) shows the incremental effects on the loga-rithm of amount of the gift to the athletic program. All columns report marginal effects generated by ordinary least squares with fixed effects. Column (1) is based on the overall male sample of 293,683 observations, while column (3) uses the overall female sample of 156,226 observations. Column (2) uses the male athlete-only sample, with 107,946 observations, while column (4) uses the female athlete-only sample, with 42,978 observations. The figures in parentheses are standard errors; coefficients that are statistically significant at the 5% level are italicized. Standard errors are adjusted for clustering based on individuals. In addition to the variables listed, the regressions include years since graduation and its quadratic, an indicator for reunion year and the time-varying annual variables listed in Table 1, which are not reported for brevity. Full results are available upon request.