the human capital consequences of civil war: … human capital consequences of civil war: evidence...
TRANSCRIPT
The Human Capital Consequences of Civil War:Evidence from Guatemala∗
Rubiana Chamarbagwala†
Indiana University
Hilcıas E. Moran‡
Indiana University and Banco de Guatemala
September, 2008
Abstract
We combine data from the 2002 National Population Census and the distribu-tion of the number of victims and human rights violations across 22 departmentsto examine how the worst period of the civil war in Guatemala, between 1979 and1984, affected human capital accumulation. The year of birth and the departmentof birth jointly determine an individual’s exposure to the worst period of the civilwar. Specifically, the identification strategy exploits variation in the war’s inten-sity across departments and which cohorts were school age during the war. Wefind a strong negative impact of the civil war on female education, with exposedgirls completing 0.44 years less schooling than non-exposed girls. Given an averageof 3.65 years of schooling for females, this represents a 12 percent decline. Thisimpact is stronger for older female cohorts exposed to the war, who completed0.64 years less schooling, a decline of 17 percent. Older males exposed to the warwere less likely to complete grades 7 to 12. However, older females exposed to thewar experienced a larger decline in completing grades 4 to 12. These effects arerobust to the inclusion of indicators for department of residence, year of birth, andcontrols for differential trends in human development in war affected and peacefuldepartments of Guatemala.
JEL Codes: I20, J13, J16, O12, O15Keywords: Civil War, Human Capital Accumulation, Education, Guatemala
∗We would like to thank Maynor Cabrera at the Central American Institute for Fiscal Studies forassistance in providing the data. The views expressed here are of the authors only and do not necessarilyreflect the views of the Banco de Guatemala.†Corresponding Author: Department of Economics, Wylie Hall, Room 105, 100 S. Woodlawn, Indi-
ana University, Bloomington, IN 47405. E-mail: [email protected].‡Departamento de Investigaciones Economicas, 7a. Av. 22-01, zona 1, Banco de Guatemala,
Guatemala City, Guatemala. E-mail: [email protected].
1

1 Introduction
The microeconomic impact of war on civilian populations can be substantial and per-
sistent. Not only can people living in war zones suffer injuries and have their property
destroyed, they may also be displaced from their homes, lose their means of survival,
or be unable to attend school, all of which may result in a permanent decline in their
productivity and earnings. Understanding which economic consequences of conflict are
more profound or persistent is important for implementing post-conflict reconstruction
effectively. Moreover, since war costs tend to be disproportionately borne by the poor
and most vulnerable populations, conflict may intensify poverty and inequality (Quinn
et al. 2007). Thus, evidence of the negative consequences of war can help identify those
populations that reconstruction policy should target. This paper examines how the
worst period of the civil war in Guatemala (1979-1984) affected human capital accu-
mulation of the population living in high war intensity departments and which social
groups were worst affected.
There is a large literature that examines the aggregate effects of armed conflict on
investment, income, and growth.1 One set of studies finds that populations quickly
recover back to pre-war trends. Cities that experienced heavy bombing during World
War II were indistinguishable from those that were not bombed 20 to 25 years after the
war in Japan (Davis & Weinstein 2002) and in Germany (Brakman et al. 2004). After
the Vietnam War, Miguel & Roland (2005) find that physical infrastructure, education,
and poverty levels all converged across regions within 25 years.
The cross-country literature also finds rapid recovery of postwar economies (Organski
& Kugler 1977, 1980, Przeworski et al. 2000). Compared to currency crises, banking
crises, and sudden shifts in executive power, Cerra & Saxena (2008) find that while
civil wars cause the largest short-run fall in output (six percent on average), output
1See Blattman & Miguel (2008) for an extensive survey of the causes and effects of civil war.
2
also rebounds quickly only in the case of civil war, recovering half of the fall within a
decade. In countries affected by civil war, economic, social, and political development
are also found to improve steadily after a war (Chen et al. 2008). Evidence on the
short-run effects of war and violence also exists. Abadie & Gardeazabal (2003) find that
terrorist violence in the Basque region of Spain significantly reduced economic growth
relative to it’s neighboring regions. Justino & Verwimp (2006) find that 20 percent of
the Rwandan population moved into poverty after the genocide. In a study of African
countries affected by internal armed conflicts, Stewart et al. (2001) find that primary
school enrollments decreased in only three out of eighteen countries, but improved in
five during civil conflicts and that on average, girls fared better than boys since boys
often serve in the army.
The recent availability of data from war regions has resulted in a growing empirical
literature that estimates the microeconomic effects of war on income, poverty, wealth,
health, and education, for both combatants and civilians. The long-term health effects
of war appear to be significant. Alderman et al. (2004) find that young children who
suffered from war-related malnutrition in Zimbabwe are significantly shorter as adults
and that this may affect their lifetime labor productivity. Akresh et al. (2007) find a
negative relationship between height-for-age z-scores and exposure to the Rwandan civil
war, the effect being particularly strong for girls. In a similar paper, Akresh et al. (2008)
find that an additional month of war exposure in rural Burundi decreases childrens’
height-for-age z-scores compared to non-exposed children.
There is growing body of research that estimates the impact of war on schooling and
labor market outcomes. Examining the effect of Uganda’s civil conflict on combatants,
Blattman & Annan (2007) find that male youth who were recruited into armed groups
received less schooling, are less likely to have a skilled job, and also earn lower wages.
de Walque (2006) finds that individuals with an urban, educated background were more
3
likely to have died during the Cambodian genocide period of 1975-1978 and as a result,
males of school age during that period have less education than previous or subsequent
cohorts. Akresh & de Walque (2008) find a strong negative impact of the Rwandan
genocide on schooling, with children exposed to the civil war experiencing an 18.3 percent
decline in their average years of education. The authors find a stronger negative effect for
males and for the non-poor. For Central Asia, Shemyakina (2006) finds that adolescent
Tajik girls whose homes were destroyed during the civil war are less likely to obtain
secondary education and that this affects their wages. Unlike Stewart et al. (2001),
de Walque (2006), and Akresh & de Walque (2008), Shemyakina (2006) finds that the
civil war in Tajikistan only decreased school enrollments of 12-16 year old girls living in
high conflict intensity areas but had no significant impact on the education of boys or
younger children.
In this paper, we examine the impact of the worst period of the Guatemalan civil war
(1979-1984) on childrens human capital accumulation. From 1960 to 1996, Guatemala
experienced a 36-year civil war. The worst period of the war began in 1979 and ended
in 1984, during which over 90 percent of the total human rights violations were com-
mitted. According to the Commission for Historical Clarification (CEH) and Recovery
of Historical Memory Project (REMHI), roughly 200,000 individuals lost their lives or
disappeared, more than 500,000 people or 8.3 percent of the 1983 population were dis-
placed, and many Mayan villages were completely destroyed as a result of the civil war
(Commission for Historical Clarification 1999, Archdiocese of Guatemala 1999, Perera
& Chauche 1995)2. Of the cases of human rights violations documented by the CEH,
83 percent of fully identified victims were Mayan and 17 percent were Ladino.3 Even
2The CEH was sponsored by the United Nations whereas the REMHI was sponsored by the Arch-diocese of Guatemala.
3According to the Guatemalan population census of 2002, 41 percent of the total population wasself-identified as Mayan and 59 percent was self-identified as Ladinos. Mayan refers to the native orindigenous population and Ladinos are a socio-ethnic category that in the Guatemalan case, representsa mix between Spanish and Mayans.
4
though the civil war in Guatemala lasted from 1960 to 1996, it began as a military rebel-
lion that intensified during the 1970s. The period between 1960 and 1978 was relatively
peaceful, until the worst period of the war began in 1979 and lasted until 1984. From
1985 onwards, the violence declined rapidly, until the war ended in 1996. Most human
rights violations were committed by the state against the civilian population and left
a large number of children orphaned and abandoned. Families and communities lost
property and their means of survival. The increase in military spending diverted nec-
essary investments of public resources away from health and education, resulting in the
abandonment of social development.4 This accelerated the deterioration of health and
educational conditions in those areas most severely affected by the confrontation. In
addition, the destruction of physical assets, including private and community property,
and the loss of infrastructure, such as bridges and electrical towers, also represented
considerable losses and amounted to over 6 percent of the country’s 1990 gross domestic
product. These material losses frequently involved the total destruction of family cap-
ital, especially among Mayan families, and particularly in the west and north-west of
Guatemala.
We use the 2002 National Population Census and the distribution of the number
of victims and human rights violations across departments to examine the magnitude
of the war’s effect on years of schooling and grade completion and identify the groups
which were most affected by the war. The empirical identification strategy exploits
variation in the war’s intensity across departments and which cohorts were school age
during the war. Our results show a strong negative impact of the civil war on female
education, with girls exposed to the 1979-1984 war during school age completing 0.44
years less schooling than non-exposed girls, which constitutes a 12 percent decline. This
impact is stronger for older female cohorts exposed to the war, who completed 0.64 years
4In 1985, public investment in physical capital reached its lowest level in the last 40 years andrepresented only 2 percent of the country’s GDP.
5
less schooling, a decline of 17 percent. Older males exposed to the war were less likely
to complete grades 7 to 12. However, older females exposed to the war experienced a
larger decline in completing grades 4 to 12. These effects are robust to the inclusion of
indicators for department of residence and year of birth. Besides these controls, all our
regressions include interactions between year of birth indicators and the availability of
basic services in a department prior to the war, thereby controlling for different trends
in human development in war affected and peaceful departments of Guatemala.
Our results show that the Guatemalan civil war had a negative impact on the human
capital accumulation of both males and females who were of school age during the
worst period of the war and suggests that the war may have had long-term economic
consequences by lowering the adult wages and labor productivity of these individuals.
In addition, the war appears to have intensified both regional and gender disparities in
human capital accumulation. In 2002, 18 years after the worst period of the civil war
ended, individuals in low war intensity departments had on average 1.83 years more
schooling than those in high war intensity departments. Female education continued to
lag behind male education even in 2002 throughout the entire country but especially so
in departments that had experienced more fighting between 1979 and 1984.
This paper is structured as follows. Section 2 describes the historical context and
impact of the civil war. Section 3 describes the data and empirical identification strategy.
Section 4 presents the results and Section 5 concludes.
2 Civil War in Guatemala
2.1 Political History
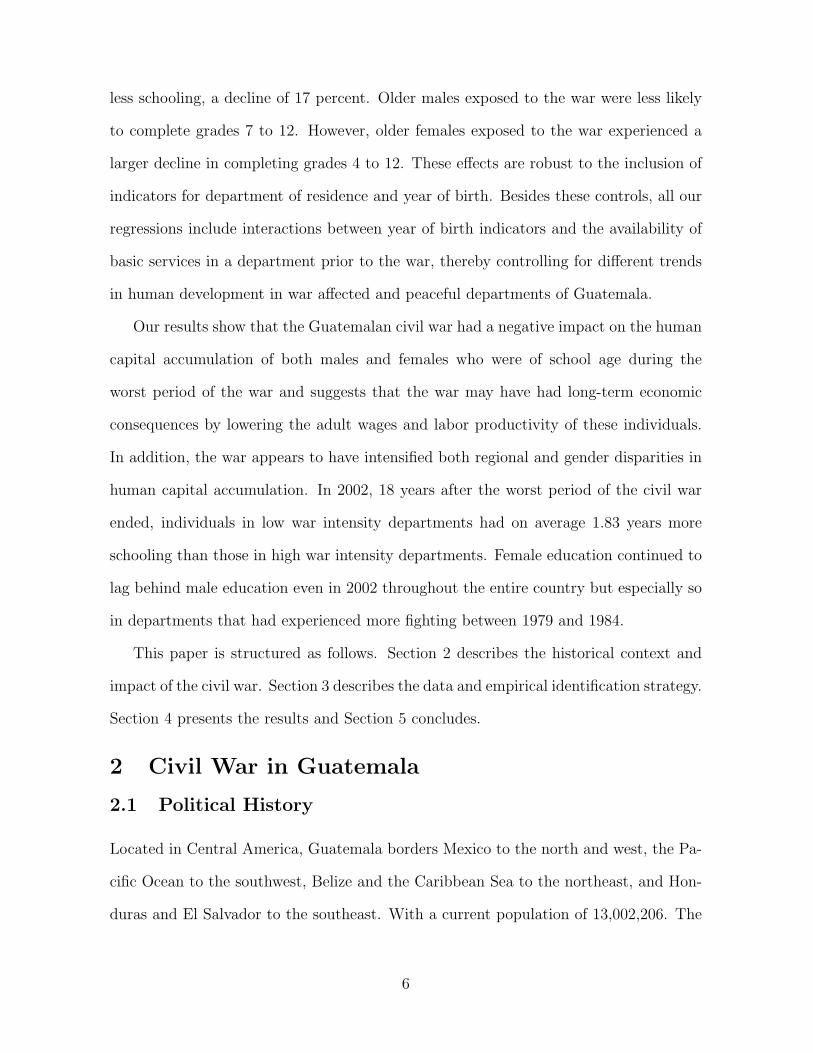
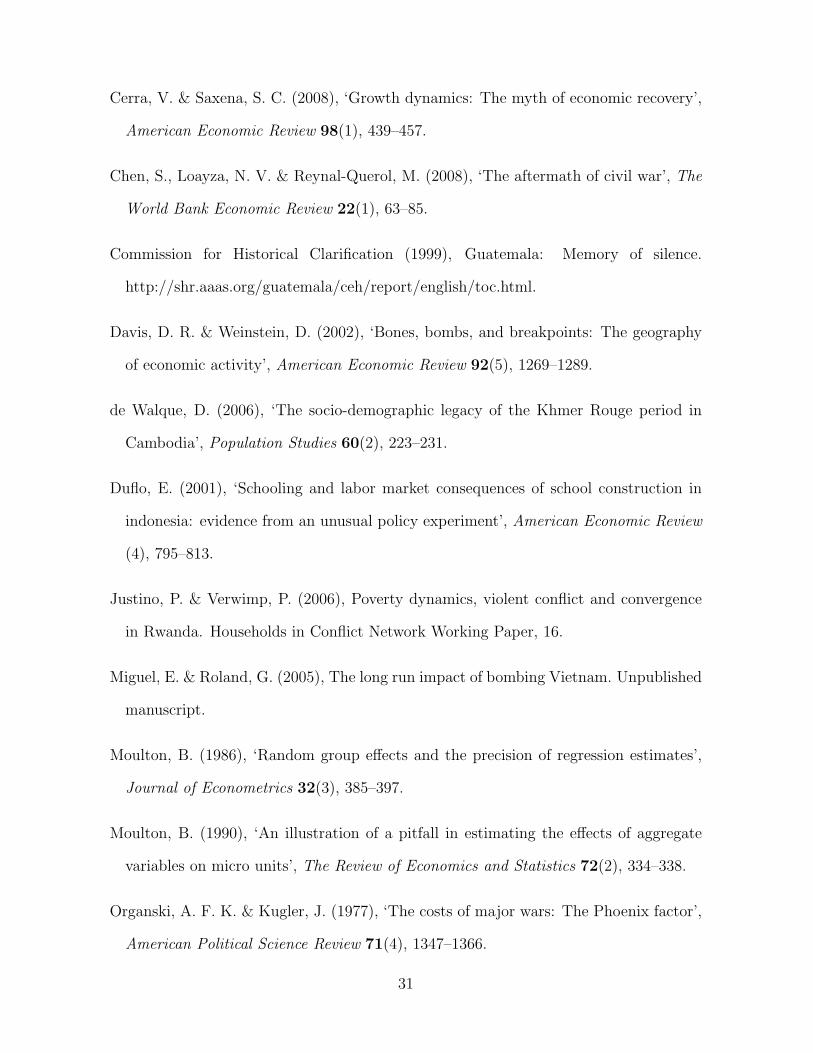
Located in Central America, Guatemala borders Mexico to the north and west, the Pa-
cific Ocean to the southwest, Belize and the Caribbean Sea to the northeast, and Hon-
duras and El Salvador to the southeast. With a current population of 13,002,206. The
6
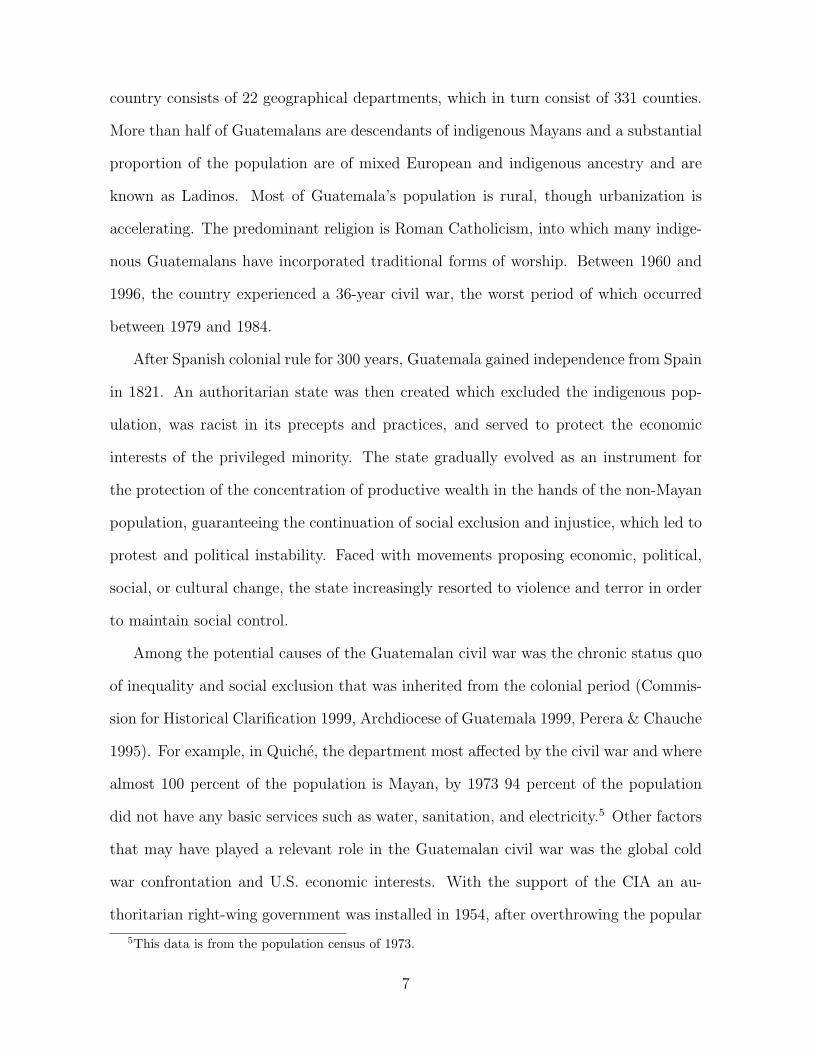
country consists of 22 geographical departments, which in turn consist of 331 counties.
More than half of Guatemalans are descendants of indigenous Mayans and a substantial
proportion of the population are of mixed European and indigenous ancestry and are
known as Ladinos. Most of Guatemala’s population is rural, though urbanization is
accelerating. The predominant religion is Roman Catholicism, into which many indige-
nous Guatemalans have incorporated traditional forms of worship. Between 1960 and
1996, the country experienced a 36-year civil war, the worst period of which occurred
between 1979 and 1984.
After Spanish colonial rule for 300 years, Guatemala gained independence from Spain
in 1821. An authoritarian state was then created which excluded the indigenous pop-
ulation, was racist in its precepts and practices, and served to protect the economic
interests of the privileged minority. The state gradually evolved as an instrument for
the protection of the concentration of productive wealth in the hands of the non-Mayan
population, guaranteeing the continuation of social exclusion and injustice, which led to
protest and political instability. Faced with movements proposing economic, political,
social, or cultural change, the state increasingly resorted to violence and terror in order
to maintain social control.
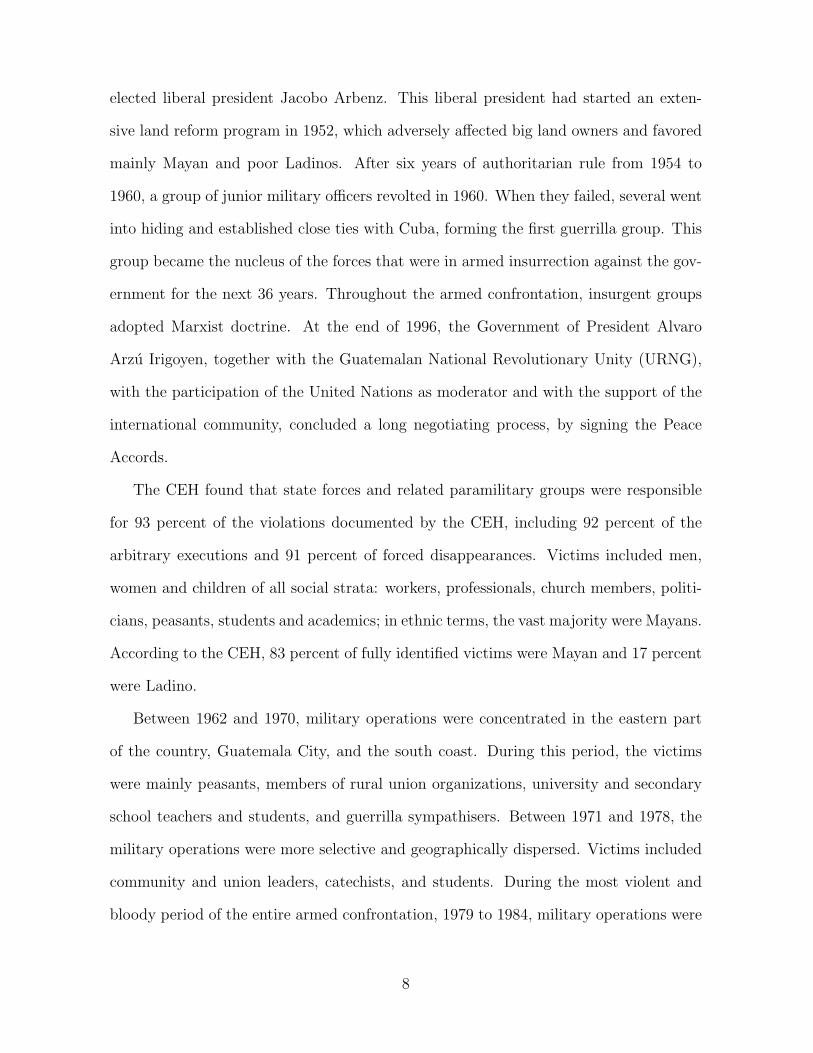
Among the potential causes of the Guatemalan civil war was the chronic status quo
of inequality and social exclusion that was inherited from the colonial period (Commis-
sion for Historical Clarification 1999, Archdiocese of Guatemala 1999, Perera & Chauche
1995). For example, in Quiche, the department most affected by the civil war and where
almost 100 percent of the population is Mayan, by 1973 94 percent of the population
did not have any basic services such as water, sanitation, and electricity.5 Other factors
that may have played a relevant role in the Guatemalan civil war was the global cold
war confrontation and U.S. economic interests. With the support of the CIA an au-
thoritarian right-wing government was installed in 1954, after overthrowing the popular
5This data is from the population census of 1973.
7
elected liberal president Jacobo Arbenz. This liberal president had started an exten-
sive land reform program in 1952, which adversely affected big land owners and favored
mainly Mayan and poor Ladinos. After six years of authoritarian rule from 1954 to
1960, a group of junior military officers revolted in 1960. When they failed, several went
into hiding and established close ties with Cuba, forming the first guerrilla group. This
group became the nucleus of the forces that were in armed insurrection against the gov-
ernment for the next 36 years. Throughout the armed confrontation, insurgent groups
adopted Marxist doctrine. At the end of 1996, the Government of President Alvaro
Arzu Irigoyen, together with the Guatemalan National Revolutionary Unity (URNG),
with the participation of the United Nations as moderator and with the support of the
international community, concluded a long negotiating process, by signing the Peace
Accords.
The CEH found that state forces and related paramilitary groups were responsible
for 93 percent of the violations documented by the CEH, including 92 percent of the
arbitrary executions and 91 percent of forced disappearances. Victims included men,
women and children of all social strata: workers, professionals, church members, politi-
cians, peasants, students and academics; in ethnic terms, the vast majority were Mayans.
According to the CEH, 83 percent of fully identified victims were Mayan and 17 percent
were Ladino.
Between 1962 and 1970, military operations were concentrated in the eastern part
of the country, Guatemala City, and the south coast. During this period, the victims
were mainly peasants, members of rural union organizations, university and secondary
school teachers and students, and guerrilla sympathisers. Between 1971 and 1978, the
military operations were more selective and geographically dispersed. Victims included
community and union leaders, catechists, and students. During the most violent and
bloody period of the entire armed confrontation, 1979 to 1984, military operations were
8
concentrated in Quiche, Huehuetenango, Chimaltenango, Alta and Baja Verapaz, the
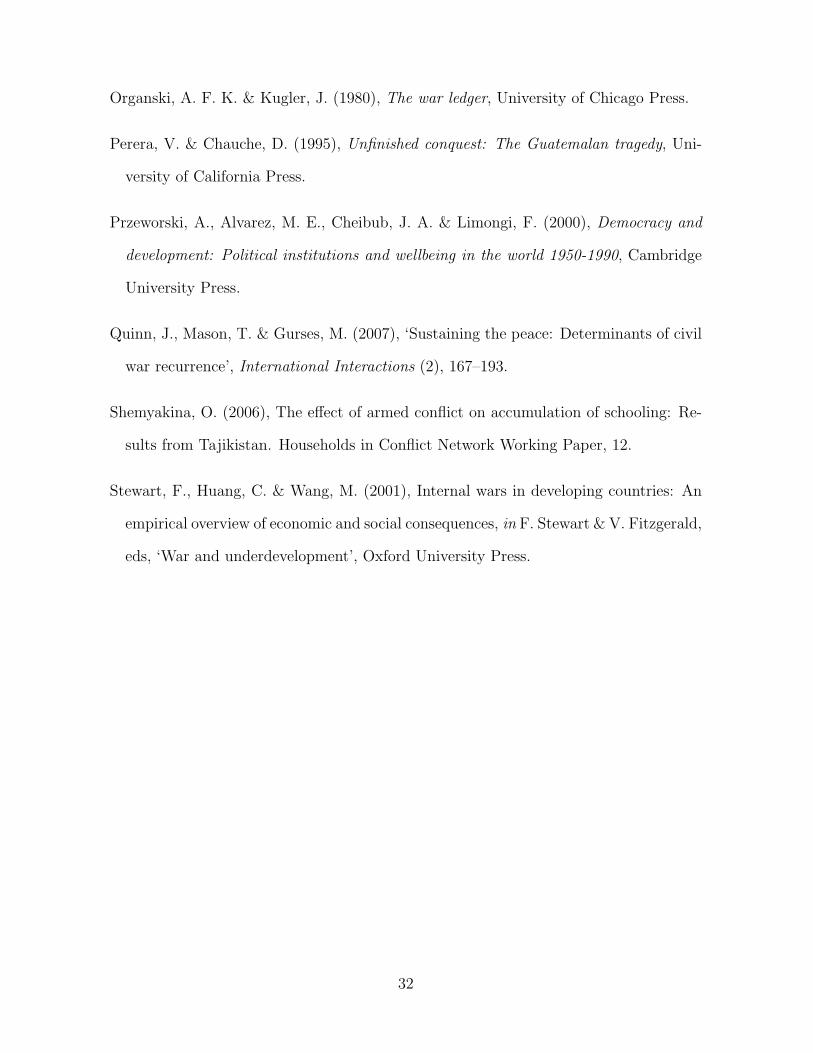
south coast, and the capital. During this period, 91 percent of the total human rights vi-
olations were committed, the victims being mainly Mayan and to a lesser extent Ladino.
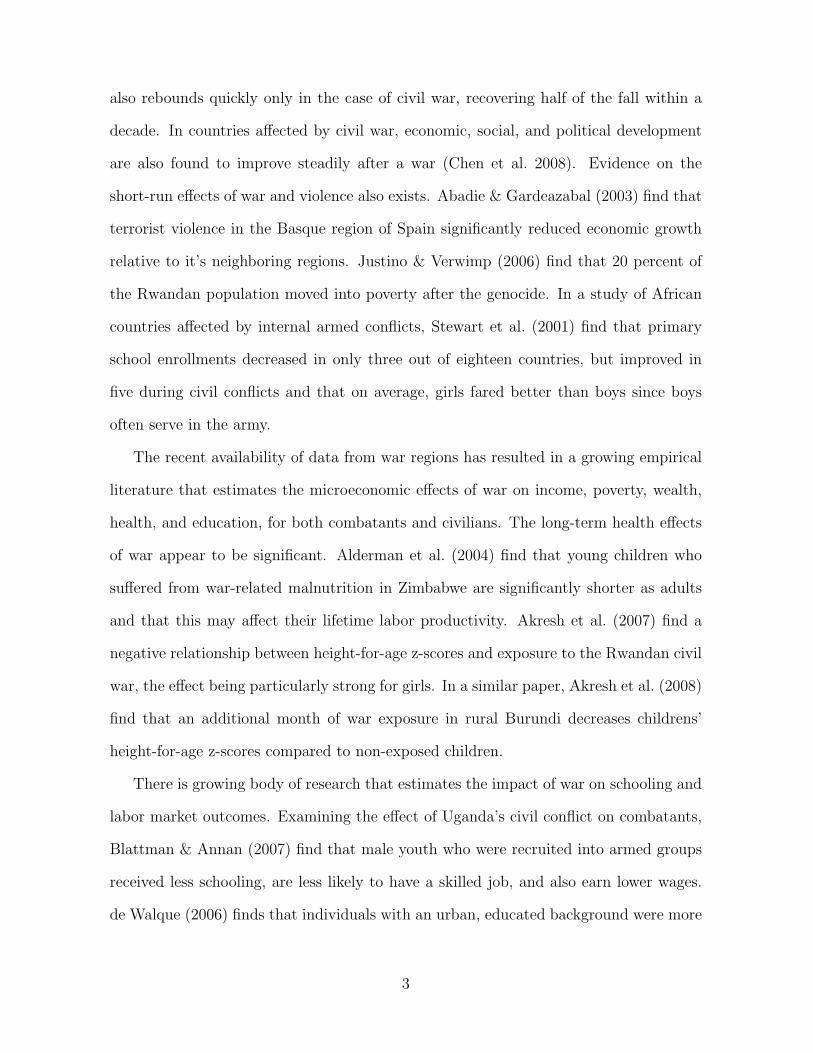
Figure 2, which shows the number of human rights violations committed by the state
and guerrillas over the 1960-1996 period, reveals the sharp increase in these violations
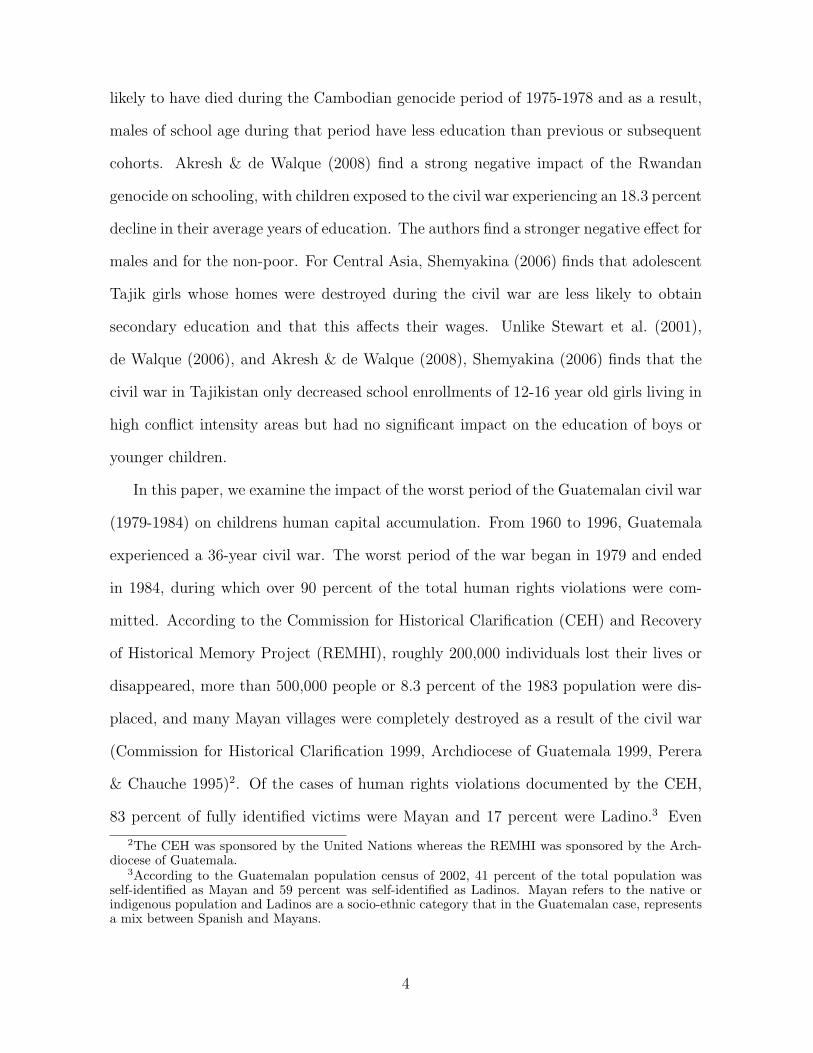
between 1979 and 1984. Figure 3 shows the geographical distribution of the victims
of the civil war across Guatemala’s 22 departments. With almost 96 victims per 1000
population, Quiche experienced the worst of the war, followed by Baha Verapaz, Alta
Verapaz, Peten, and Huehuetenango. During the final period, 1985 to 1996, operations
were selective and affected the Mayan and Ladino population to a similar extent.
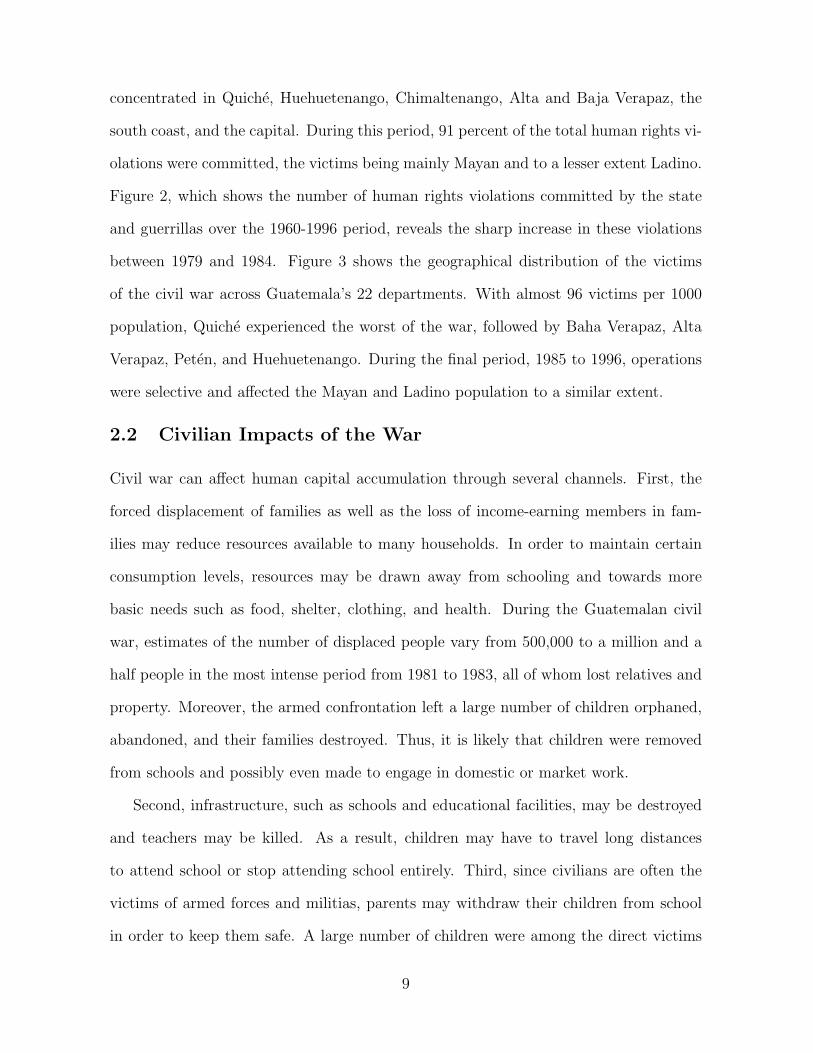
2.2 Civilian Impacts of the War
Civil war can affect human capital accumulation through several channels. First, the
forced displacement of families as well as the loss of income-earning members in fam-
ilies may reduce resources available to many households. In order to maintain certain
consumption levels, resources may be drawn away from schooling and towards more
basic needs such as food, shelter, clothing, and health. During the Guatemalan civil
war, estimates of the number of displaced people vary from 500,000 to a million and a
half people in the most intense period from 1981 to 1983, all of whom lost relatives and
property. Moreover, the armed confrontation left a large number of children orphaned,
abandoned, and their families destroyed. Thus, it is likely that children were removed
from schools and possibly even made to engage in domestic or market work.
Second, infrastructure, such as schools and educational facilities, may be destroyed
and teachers may be killed. As a result, children may have to travel long distances
to attend school or stop attending school entirely. Third, since civilians are often the
victims of armed forces and militias, parents may withdraw their children from school
in order to keep them safe. A large number of children were among the direct victims
9
of arbitrary execution, forced disappearance, torture, rape, and other violations of their
fundamental rights during the civil war in Guatemala. This may have induced parents
to stop sending their children to school. Finally, the expected returns to schooling may
fall as a result of civil wars, which may discourage parents from sending their children
to school. The destruction of existing industries and lack of creation of new industries
may result in a scarcity of skilled jobs, making parents redistribute household resources
away from individuals with lower expected returns and toward those with higher ones.
Armed conflict may have a stronger impact on certain groups of individuals. While
previous analyses of school enrollments have found that males fare particularly badly
since they are more likely to become combatants (Stewart et al. 2001, de Walque 2006,
Akresh & de Walque 2008), it is also possible that the most vulnerable groups in the
population may be affected the most. For example, Shemyakina (2006)’s study finds
that females rather than males received less secondary education in Tajikistan as a
result of the civil war. This paper finds similar results for females exposed to the worst
period of the civil war in Guatemala. Since girls in Guatemala receive less schooling
on average, get married at an early age, and usually engage in household chores and
child rearing rather than market work, they may be more likely to receive less schooling
than boys, especially when resources become scarce. Parents may also withdraw their
daughters from school in order to protect them from being sexually assaulted, raped,
and harassed. Since women are often over-represented amongst the poor and because
we find a more pronounced negative impact of the war on female schooling, our results
show that armed conflict in Guatemala worsened the position of women amongst the
poorest groups by deteriorating their educational attainment.
10
3 Data and Estimation
3.1 Data
In this paper we attempt to measure the effect that Guatemala’s civil war had on the
educational achievements of cohorts who were exposed to the worst period of the war
(1979-1984). We use several sources of data, including the 2002 National Population
Census, which was published by the Instituto Nacional de Estadistica, Guatemala. From
the 2002 Census we get information on an individual’s department of birth and current
department of residence. Due to the massive population displacement that occurred
during the civil war, we restrict our analysis to individuals who had the same department
of birth and department of residence at the time of the Census in 2002.6 Including only
non-displaced individuals and those who did not migrate out of their department since
their birth allows us to identify the department in which they lived during their school
age. Restricting our sample to non-displaced and non-migrant individuals may, however,
lead us to underestimate the effect of the civil war on schooling outcomes since displaced
individuals and those who chose to move may have been more negatively affected by the
war than non-displaced ones. We address this issue in Section 4.4. In order to allow for
completion of education by 2002, we include individuals who were born between 1950
and 1977. The youngest cohort – i.e. those who were born in 1977 – were 25 years old
in 2002 and therefore had the opportunity to complete college by the time of the 2002
census.
We use the 2002 Census to measure years of schooling and grade completion rates.
Table 1 reports the average years of schooling and grade completion rates for all individ-
uals born between 1950 and 1977 and separately for females and males. In Guatemala,
primary school consists of grades 1 to 6, secondary school of grades 7 to 9, and high
6Restricting the sample to those who had the same county of birth and county of current residenceprovides very similar results, which are available from the authors upon request.
11

school includes grades 10 to 12.7 Individuals who were born between 1950 and 1960
were 19 to 29 years old in 1979, when the worst period of the civil war began, and were
therefore not exposed to this period of the war when they were school age. However,
individuals born between 1961 and 1977 were exposed to the worst period of the war
during some or all of their primary, secondary, and high school years.
Since individuals born between 1961 and 1966 were exposed to the war during sec-
ondary and high school age, they may have been less likely to complete post-primary
education. The oldest individuals in this cohort (those born in 1961) were 18 years old
in 1979 and were exposed to the 1979-1984 period of the civil war during only 1 year of
high school whereas the youngest among this cohort (those born in 1966) were 13 years
old in 1979 and 18 years old in 1984 and were in secondary or high school during the en-
tire period between 1979 and 1984. Given that the majority of individuals in Guatemala
have no schooling or complete only some primary school and that completion of primary
school is necessary for post-primary education, individuals who were primary school age
for even some period between 1979 and 1984 (those born between 1967 and 1977) may
have experienced the biggest impact of the war. The oldest in this cohort (those born
in 1967) were 12 years old in 1979 and exposed to the war during one year of primary
school and most of their secondary and high school years. The youngest among this
cohort (those born in 1977) were 7 years old in 1984 and of primary school age during
only 1 year of the worst period of the civil war.
As Table 1 shows, educational attainment improved over time for all individuals,
males, and females. The average years of schooling increased by 44 percent, from 3.6 to
5.2 for individuals born between 1950-1960 and 1967-1977. The proportion of individuals
completing grades 1 to 12 increased substantially for each successive cohort. A similar
pattern is observed for males and females. The increase in educational attainment
7Children usually attend primary school when they are between 7 and 12 years old, secondary schoolwhen they are 13 to 15 years old, and high school when they are between 16 and 18 years old.
12
presented in Table 1 most likely reflects the general tendency in developing countries
for schooling outcomes to improve over time and suggests that children who were school
age during the worst period of Guatemala’s civil war (1979-1984) did not attain less
schooling on average than those who had completed school age by 1979.
Two data sources provide information on the geographical intensity of the civil war in
Guatemala. The first data source is from the Recovery of Historical Memory Project and
provides the number of victims in each of the country’s 22 departments (Archdiocese of
Guatemala 1999). The second source is from the Commission of Historical Clarification
and provides the number of human rights violations and acts of violence across these 22
departments (Commission for Historical Clarification 1999). Using the total population
in each department from the 1983 National Population Census, the year closest to the
1979-1984 period, we calculate the number of victims and human rights violations per
1000 population in these departments.8
As can be seen in Figure 3, the six departments with the highest number of vic-
tims per 1000 population include Quiche, Baha Verapaz, Alta Verapaz, Peten, Hue-
huetenango, and San Marcos. The highest number of human rights violations per 1000
population occurred in Quiche, Baha Verapaz, Huehuetenango, Alta Verapaz, Chimalte-
nango, and Peten. We categorize as high war intensity departments the five departments
that fall in both categories – namely, Quiche, Baha Verapaz, Alta Verapaz, Peten, Hue-
huetenango – and the remaining 17 departments as low war intensity. Table 2 includes
the average educational attainment in low and high war intensity departments for all
three cohorts and shows a large gap in education between the two groups for all three
cohorts.
From the 1973 National Population Census, we obtain information on the level of
human development in the country’s 22 departments prior to the start of the worst
8The 1983 Census was administered and published by the Direccion General de Estadısticas,Guatemala.
13
period of the war.9 This information includes the proportion of households without
any access to water, sanitation, and electricity. We use this information to control for
different trends in human development in high and low war intensity departments before
the worst period of the war occurred in 1979. As discussed in the next section, ignoring
these differential trends may bias our empirical results.
3.2 Empirical Analysis
The year of birth and the department of birth jointly determine an individual’s exposure
to the worst period of the civil war (1979-1984). The identification strategy therefore
exploits variation in the war’s intensity across departments and which cohorts were
school age during the war. This identification strategy can be illustrated using a two-
by-two difference-in-differences table. In Table 3, Panel A shows the average years
of schooling for individuals exposed to the worst period of the civil war (1979-1984)
when they were school age (those born between 1961 and 1977) and individuals who
had completed school age by 1979 (those born between 1950 and 1960). Columns 1
and 2 show the average years of schooling for individuals in the 5 high intensity war
departments and 17 low intensity war departments, respectively.
Educational attainment is higher for cohorts that were exposed compared to those
that were not exposed to the worst period of the civil war in both high and low intensity
war departments. This is consistent with the increasing trend in educational attainment
in developing countries. Moreover, schooling in high war intensity departments is lower
than that in low war intensity departments for both cohorts, indicating a higher level
of schooling in low war intensity departments for cohorts who were school age before
and after 1979. Calculating the difference-in-differences estimator indicates a decline of
0.36 years of schooling for the exposed cohort in high war intensity departments and the
result is significant at the 1 percent level. Given an average of 3.92 years of schooling in
9The 1973 Census was administered and published by the Direccion General de Estadısticas,Guatemala.
14
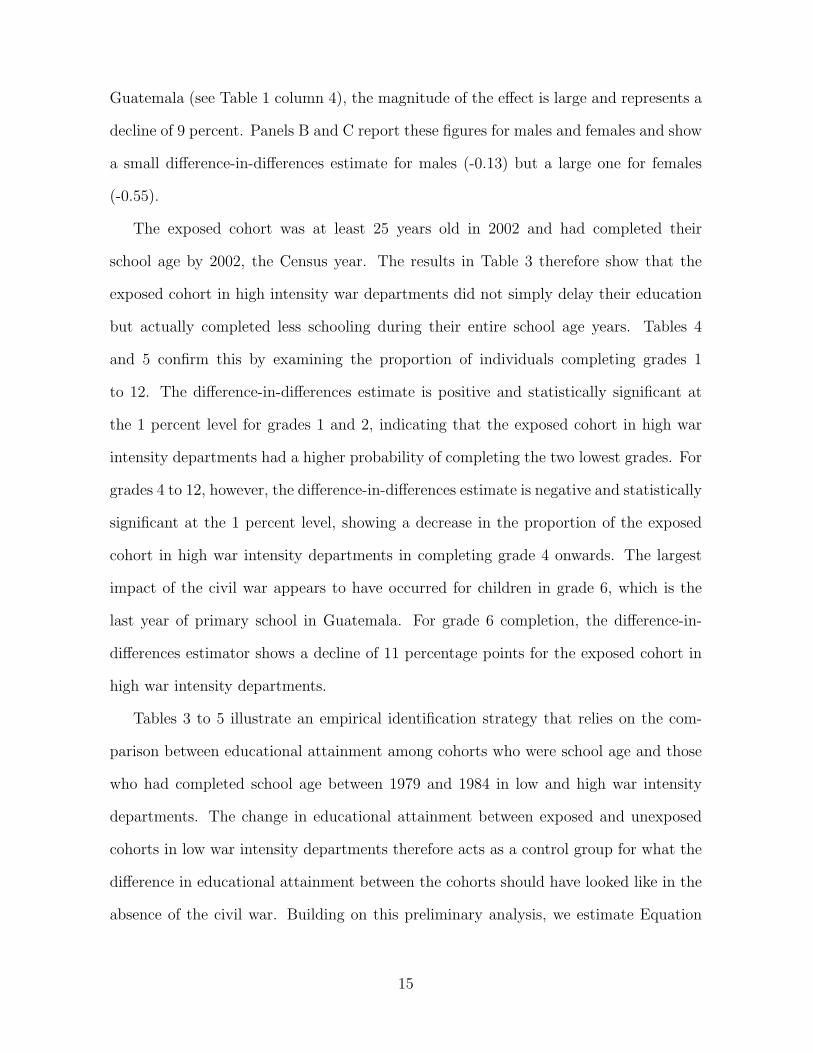
Guatemala (see Table 1 column 4), the magnitude of the effect is large and represents a
decline of 9 percent. Panels B and C report these figures for males and females and show
a small difference-in-differences estimate for males (-0.13) but a large one for females
(-0.55).
The exposed cohort was at least 25 years old in 2002 and had completed their
school age by 2002, the Census year. The results in Table 3 therefore show that the
exposed cohort in high intensity war departments did not simply delay their education
but actually completed less schooling during their entire school age years. Tables 4
and 5 confirm this by examining the proportion of individuals completing grades 1
to 12. The difference-in-differences estimate is positive and statistically significant at
the 1 percent level for grades 1 and 2, indicating that the exposed cohort in high war
intensity departments had a higher probability of completing the two lowest grades. For
grades 4 to 12, however, the difference-in-differences estimate is negative and statistically
significant at the 1 percent level, showing a decrease in the proportion of the exposed
cohort in high war intensity departments in completing grade 4 onwards. The largest
impact of the civil war appears to have occurred for children in grade 6, which is the
last year of primary school in Guatemala. For grade 6 completion, the difference-in-
differences estimator shows a decline of 11 percentage points for the exposed cohort in
high war intensity departments.
Tables 3 to 5 illustrate an empirical identification strategy that relies on the com-
parison between educational attainment among cohorts who were school age and those
who had completed school age between 1979 and 1984 in low and high war intensity
departments. The change in educational attainment between exposed and unexposed
cohorts in low war intensity departments therefore acts as a control group for what the
difference in educational attainment between the cohorts should have looked like in the
absence of the civil war. Building on this preliminary analysis, we estimate Equation
15
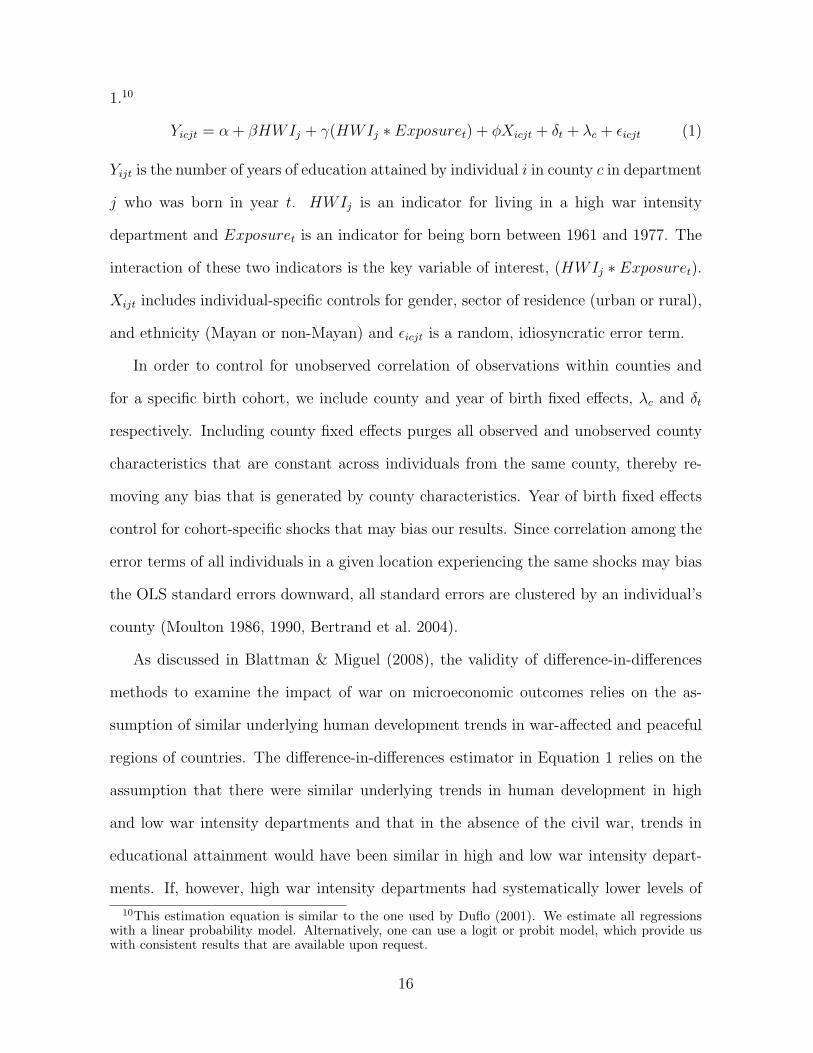
1.10
Yicjt = α + βHWIj + γ(HWIj ∗ Exposuret) + φXicjt + δt + λc + εicjt (1)
Yijt is the number of years of education attained by individual i in county c in department
j who was born in year t. HWIj is an indicator for living in a high war intensity
department and Exposuret is an indicator for being born between 1961 and 1977. The
interaction of these two indicators is the key variable of interest, (HWIj ∗ Exposuret).
Xijt includes individual-specific controls for gender, sector of residence (urban or rural),
and ethnicity (Mayan or non-Mayan) and εicjt is a random, idiosyncratic error term.
In order to control for unobserved correlation of observations within counties and
for a specific birth cohort, we include county and year of birth fixed effects, λc and δt
respectively. Including county fixed effects purges all observed and unobserved county
characteristics that are constant across individuals from the same county, thereby re-
moving any bias that is generated by county characteristics. Year of birth fixed effects
control for cohort-specific shocks that may bias our results. Since correlation among the
error terms of all individuals in a given location experiencing the same shocks may bias
the OLS standard errors downward, all standard errors are clustered by an individual’s
county (Moulton 1986, 1990, Bertrand et al. 2004).
As discussed in Blattman & Miguel (2008), the validity of difference-in-differences
methods to examine the impact of war on microeconomic outcomes relies on the as-
sumption of similar underlying human development trends in war-affected and peaceful
regions of countries. The difference-in-differences estimator in Equation 1 relies on the
assumption that there were similar underlying trends in human development in high
and low war intensity departments and that in the absence of the civil war, trends in
educational attainment would have been similar in high and low war intensity depart-
ments. If, however, high war intensity departments had systematically lower levels of
10This estimation equation is similar to the one used by Duflo (2001). We estimate all regressionswith a linear probability model. Alternatively, one can use a logit or probit model, which provide uswith consistent results that are available upon request.
16
development than low war intensity departments prior to 1979, then poor educational
attainment of the exposed cohort in high war intensity departments may not reflect the
direct impact of the war but the declining socio-economic conditions that contributed to
the civil war in the first place. Given the availability of census data both before and after
the 1979-1984 period of Guatemala’s civil war, we use data on pre-war levels of human
development from the 1973 Census to examine the effect of the war on human capital
accumulation despite varying pre-war trends in high and low war intensity departments.
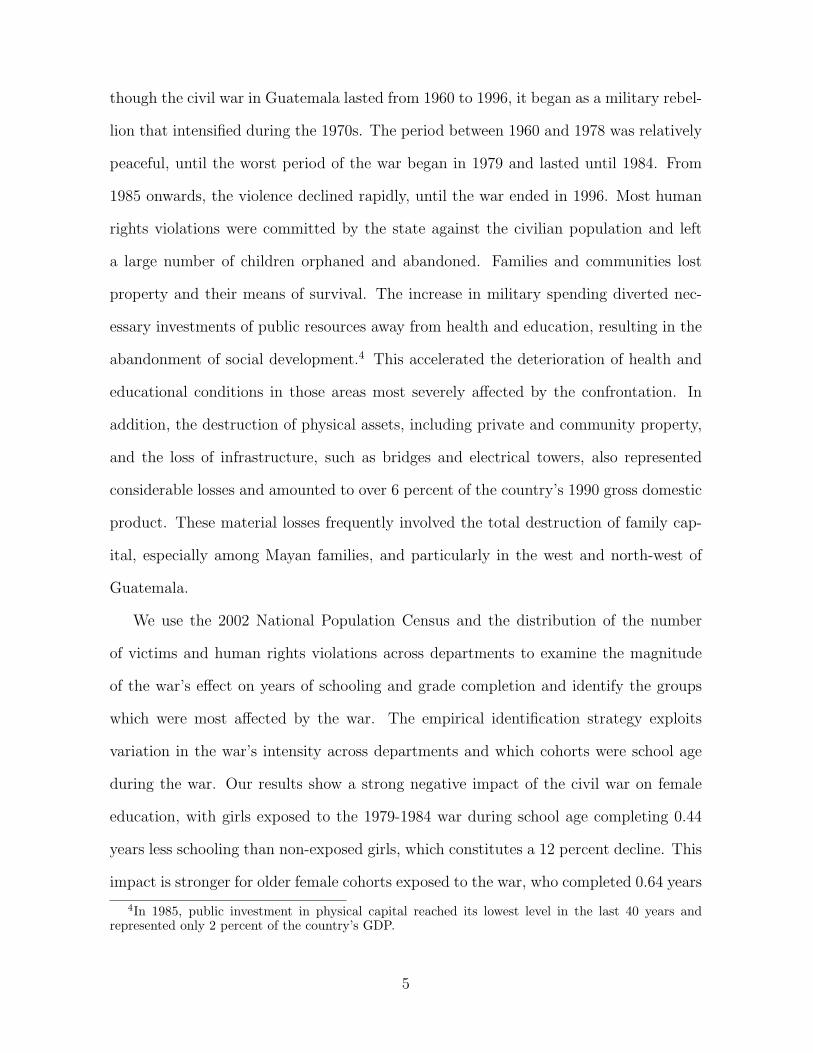
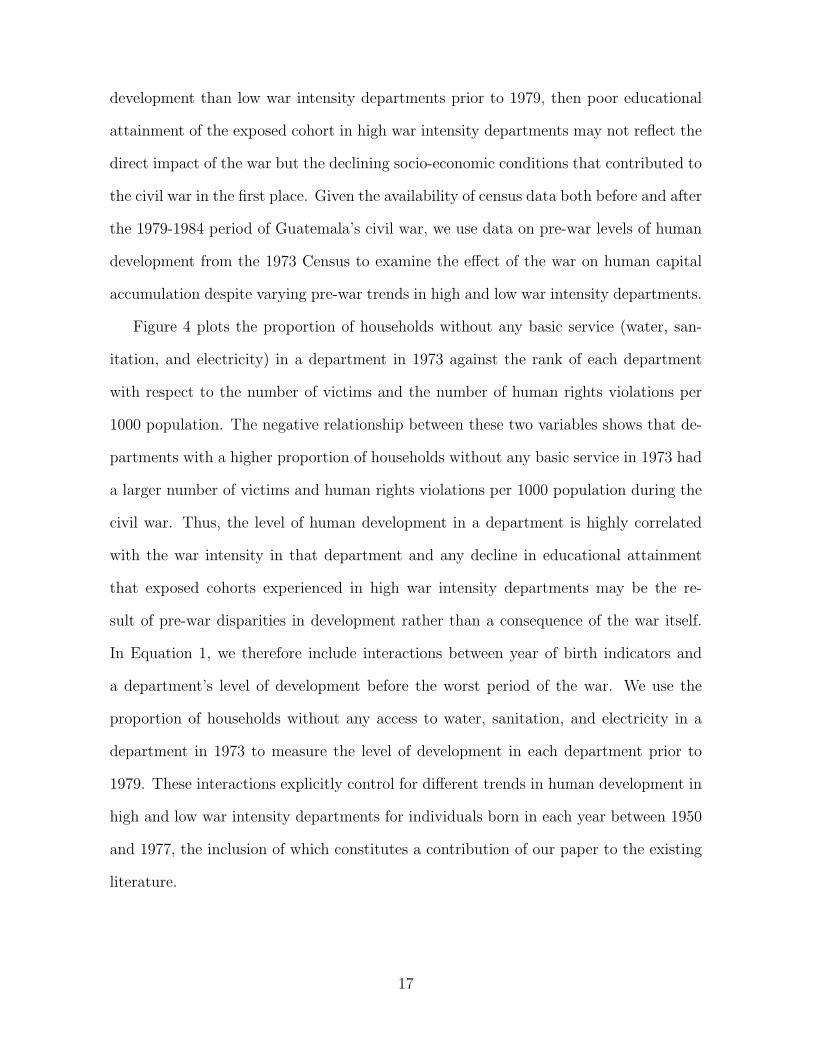
Figure 4 plots the proportion of households without any basic service (water, san-
itation, and electricity) in a department in 1973 against the rank of each department
with respect to the number of victims and the number of human rights violations per
1000 population. The negative relationship between these two variables shows that de-
partments with a higher proportion of households without any basic service in 1973 had
a larger number of victims and human rights violations per 1000 population during the
civil war. Thus, the level of human development in a department is highly correlated
with the war intensity in that department and any decline in educational attainment
that exposed cohorts experienced in high war intensity departments may be the re-
sult of pre-war disparities in development rather than a consequence of the war itself.
In Equation 1, we therefore include interactions between year of birth indicators and
a department’s level of development before the worst period of the war. We use the
proportion of households without any access to water, sanitation, and electricity in a
department in 1973 to measure the level of development in each department prior to
1979. These interactions explicitly control for different trends in human development in
high and low war intensity departments for individuals born in each year between 1950
and 1977, the inclusion of which constitutes a contribution of our paper to the existing
literature.
17
4 Results
4.1 Baseline Difference-in-Differences Estimation
Table 6 presents regression results for Equation 1 using years of education as the depen-
dent variable. The difference-in-differences estimate is the coefficient of the interaction
between an indicator for the exposed cohort (individuals born between 1961 and 1977)
and an indicator for whether or not the individual lives in a high war intensity depart-
ment. We restrict our analysis to individuals who have the same department of birth
and residence in 2002 and limit the sample to individuals who were born between 1950
and 1977.11
Columns (1), (3), (5), and (7) of Table 6 present results of regressions that don’t
control for differential human development trends in high and low war intensity depart-
ments whereas columns (2), (4), (6), and (8) show results of regressions that explicitly
control for these differential trends by including interactions between year of birth indi-
cators and the availability of basic services in a department in 1973. There is very little
difference in the magnitude and significance of the difference-in-differences estimates
with and without controls for differential trends in human development across the 22
departments. This suggests that our results are not being driven by different pre-war
trends in human development in high and low war intensity departments.
Column (2) Table 6 shows a negative impact of the civil war of -0.24 years of ed-
ucation, which is slightly smaller than the corresponding estimate in Table 3 that was
obtained without any controls. The difference-in-differences regression coefficient is sig-
nificant at the 1 percent level. Within a given department and for an individual of
a given age, being of school age in a high war intensity department during the worst
11Restricting the sample to those who had the same county of birth and county of residence in 2002provides qualitatively similar results. We don’t include individuals born after 1977 because they maynot have completed their education by the census year, 2002. The youngest individuals in our sample– those born in 1977 – were 25 years old in 2002 and therefore had the opportunity to complete evencollege education. The results are qualitatively similar if we increase the sample to include individualsborn between 1940 and 1977 or between 1930 and 1977.
18
period of Guatemala’s civil war (1979-1984) implies significantly lower schooling. That
this effect is robust to the inclusion of interactions between year of birth indicators and
the availability of basic services in a department in 1973, suggests that this effect is
not driven by differential human development trends in high and low war intensity de-
partments that existed prior to the 1979-1984 period of the war. Rather, the civil war
between 1979 and 1984 appears to have contributed to lower educational attainment of
exposed cohorts in high war intensity departments.
In order to explore the heterogeneity of the impact of the civil war , in columns (3)
and (4) we interact the difference-in-differences variable with female, rural, and Mayan
indicators. According to the CEH and REMHI, rural areas and Mayan communities
experienced the worst effects of the war, which suggests that these groups may have fared
particularly badly with respect to educational attainment. As explained in Section 2.2,
there may be gender differences in the effect of civil war on education outcomes. Since
males become combatants, boys may be more likely to receive less schooling. On the
other hand, due to less participation in market work as adults and lower expected returns
to education for females as well as the security risks that are borne disproportionately
by females, schooling of girls may be affected more by civil war.
Columns (3) and (4) show that the civil war only had an effect on the years of
schooling of females and no effect on males. Moreover, we find no statistically significant
difference between the years schooling of urban and rural individuals or between Mayans
and non-Mayans for the exposed cohort. We explore this result further by estimating
separate regressions for females and males in columns (5) to (8) and find that females
who were of school age in high war intensity departments between 1979 and 1984 received
0.44 less years of schooling, which given an average of 3.65 years of schooling for females
in the entire census (see Table 1 column 4), represents a decline of 12 percent. The
interactions of the difference-in-differences variable with rural and Mayan indicators are
19
statistically insignificant, showing that rural and Mayan females did not receive less
schooling than their urban and non-Mayan counterparts. Our results therefore contrast
with those of Stewart et al. (2001), de Walque (2006) and Akresh & de Walque (2008),
who find a more pronounced effect of civil war on the education of boys, but are similar
to Shemyakina (2006)’s findings for Tajikistan.
That we find no effect of the civil war on years of schooling of males suggests that
even though boys may be expected to attain less schooling during a civil war as a result
of becoming combatants, girls may receive less education when household property is lost
and economic resources become more scarce. Parents may redistribute scarce resources
away from girls, who are more likely to engage in household chores and child-rearing as
adults, and towards boys, who as adults are more likely to engage in market work and
become sole or principal income earners in their families. Parents may also stop sending
their daughters to school due to security fears since females are at greater risk of being
sexually assaulted, raped, and harassed during a civil war.
4.2 Younger and Older Exposed Cohorts
The previous section showed that the civil war decreased schooling of females but not
males, indicating a reallocation of scarce household resources towards safer and higher
expected returns, namely the education of boys. In this section, we examine how the civil
war affected younger and older cohorts that were exposed to it, allowing us to understand
the mechanism of this reallocation. To explore the heterogeneity of the impact of the
war on older and younger exposed cohorts, we divide the cohort exposed to the civil
war during school age into two groups. The older cohort consists of individuals born
between 1961 and 1966, who were secondary and/or high school age between 1979 and
1984. The younger cohort consists of individuals who were born between 1967 and 1977
and therefore were in primary school during at least part of the worst period of the
civil war from 1979 to 1984. The majority of individuals in Guatemala obtain either
20
no education or some primary education, with less than 25 percent of the population
receiving more than primary education. Moreover, completion of primary school is
necessary for post-primary education. Thus, individuals who were primary school age –
i.e. those born between 1967 and 1977 – may have experienced a larger negative impact
of the war.
Table 7 reports results of estimating an equation similar to Equation 1 with indicators
for two groups of exposed cohorts – one born between 1961 and 1966 and the other born
between 1967 and 1977. The difference-in-differences variables include interactions of
these two cohorts with the indicator for whether or not the individual lives in a high war
intensity department. Column (2) shows a smaller effect of the civil war on the older
cohort (-0.24) and a slightly larger effect for the younger cohort (-0.34), a result which
is not surprising given that the majority of the population does not attain post-primary
schooling. In columns (3) and (4) we interact the difference-in-differences variables
with female, rural, and Mayan indicators. Similar to the results in Table 6, we find a
statistically significant negative impact of the war only for females and on both older
and younger female cohorts, both coefficients of which have similar magnitudes (-0.21
and -0.25). Also similar to the results presented in Table 6, we find no statistically
significant difference between the schooling of urban and rural individuals or between
Mayans and non-Mayans for both older and younger exposed cohorts.
Estimating separate regressions for females and males in columns (5) to (8), we find
no effect of the war on the schooling of males. For females, we find a large effect for those
born between 1961 and 1966 and a statistically insignificant effect for those born between
1967 and 1977. This result contrasts with those reported in columns (3) and (4) for the
full sample and is also contrary to our expectation that primary school age children may
have fared worse than post-primary school age children. Females born between 1961 and
1966 who lived in high war intensity departments received 0.64 less years of schooling,
21
a decline of 17 percent. Again, we find no statistically significant difference between the
schooling of urban and rural females and males or between Mayans and non-Mayans for
both older and younger exposed female and male cohorts.
That the civil war had the most pronounced negative impact on the schooling of
older girls exposed to the war suggests that the war imposed a negative shock on af-
fected households, and that scarce household resources were redistributed towards safer
investments, such as the education of boys and basic education for young girls. We
explore this hypothesis further in the next section by examining grade completion sep-
arately for males and females.
4.3 Grade Completion
Following the same logic as Table 7, Tables 8 and 9 report results for completion of each
grade from 1 to 12. The objective of this analysis is to determine at which grade level
the civil war had the largest negative impact and for which groups.
Individuals born between 1961 and 1966 had already completed grades 1 to 6 and
were secondary and/or high school age during the 1979-1984 period of the war. We
therefore expect to find a strong negative impact of the war on completion of secondary
and high school grades for this cohort, but not on completion of primary grades. Row
(1) in Tables 8 and 9 shows that males born between 1961 and 1966 in high war intensity
departments had a higher probability of completing grades 1 to 3 and a lower probability
of completing grades 7 to 12. While females born between 1961 and 1966 in high war
intensity departments had a higher probability of completing grades 1 and 2, they were
less likely to complete grades 4 to 12. The magnitude of these coefficients is larger for
females than for males and peak for females completing grades 7 to 9. These results are
consistent with those found in Table 7 where older females exposed to the war received
0.64 less years of schooling. However, unlike the results reported in Table 7, where
no impact of the war was found on males, these results show that older males also
22
experienced less schooling, being less likely to complete each grade in secondary and
high school by roughly 4 percentage points.
The coefficient on the interaction between the difference-in-differences indicator for
the older cohort and the rural dummy variable (row (3) in Tables 8 and 9) shows that
older rural males were less likely to complete grades 1 to 5. This result is not surprising
given that rural areas experienced more fighting than urban ones and that males usually
become combatants. Since males born between 1961 and 1966 were of primary school
age before 1979, this result cannot be attributed to the effect of the worst period of the
civil war, but instead may be due to the deteriorating situation in rural areas during
the period leading up to 1979-1984. Among the older cohort exposed to the war, rural
females were less likely to complete grades 1 to 3 and more likely to complete grades 7
to 11 compared to their urban counterparts.
The coefficient on the interaction between the difference-in-differences indicator for
the older cohort and the Mayan dummy (row (5) in Tables 8 and 9) shows that Mayan
boys were less likely to complete grades 1 to 3 whereas Mayan girls were less likely to
complete grades 1 and 2. Again, this result cannot be attributed to the effect of the
worst period of the civil war since the older cohort was of primary school age before
1979, and like the result for rural areas (row (3)) most likely reflects the deteriorating
circumstances of the Mayan population prior to their 1979-1984 period. This effect
reverses at higher grades, which is surprising. The likelihood of completing grades 7 to
12 was higher for Mayan girls compared to non-Mayans among the older exposed cohort.
The finding that at higher grades, rural and Mayan females were more likely to
complete secondary and high school grades compared to their urban and non-Mayan
counterparts among the older exposed cohort is surprising for two reasons. First, the
urban and non-Mayan population in Guatemala are wealthier and more privileged than
the rural and Mayan population. Second, according to the CEH and REMHI, the
23
majority of victims of the civil war were rural and Mayan people (Commission for
Historical Clarification 1999, Archdiocese of Guatemala 1999).12 The war therefore
appears to have narrowed the gap between urban and rural as well as between Mayan
and non-Mayan schooling outcomes among older girls who were exposed to the war.
This result, however, may be driven by our focus on only non-displaced and non-migrant
individuals. It is likely that those individuals who were displaced or chose to move away
as a result of the war were more affected by the fighting and violence. If non-displaced
and non-migrant rural and Mayan families were socio-economically better off than their
displaced and migrant counterparts, then the effect of the war on these individuals may
indeed be smaller than on their urban and non-Mayan counterparts.
Moving on to the younger exposed cohort, namely those who were born between
1967 and 1977 in high war intensity departments, these individuals were primary school
age during the worst period of the war. They may have, therefore, not only received
less primary schooling but also received less secondary and high school education due
to less primary schooling. Row (2) in Tables 8 and 9 show that boys in the younger
exposed cohort were more likely to complete grades 1 to 3 but less likely to complete
grades 9 to 12. The coefficient of the difference-in-differences variable for the younger
exposed male cohort is statistically insignificant for all other grades. Girls in the younger
exposed cohort were more likely to complete grade 1 but less likely to complete grades 4
to 6. Completion of secondary and high school grades were not affected for the younger
exposed female cohort. The interaction of the difference-in-differences variable for the
younger exposed cohort with the rural dummy (row (4) in Tables 8 and 9) shows that
rural females were less likely to complete grades 1 to 4, thus widening the urban-rural
schooling gap for younger females. Similar to the results presented in Table 7, the effect
of the war on grade completion of the younger exposed cohort is smaller in magnitude
12This result is similar to Akresh & de Walque (2008), who find the strongest negative shock ofRwanda’s genocide on schooling of children in non-poor households.
24
compared to the older exposed cohort.
The results for grade completion reinforce the hypothesis that the civil war acted
as a negative shock on households and show that in addition to reallocating resources
away from older girls in grades 4 and above, households also diverted resources away
from educating older boys in secondary and high school. These results also show that
households shifted resources towards educating younger boys in grades 1, 2, and 3 and
younger girls in grade 1.
Using the difference-in-differences coefficients for older and younger exposed cohorts
(from rows (1) and (2) of Tables 8 and 9) and the average proportion of males and females
who completed each grade, Table 10 presents the percent decline in the proportion of
males and females who completed each grade that is predicted by our estimation.13
The percent decline in grade completion is larger for the older exposed cohort than the
younger one and largest for older exposed females. Older males exposed to the war
were less likely to complete grades 7 to 12, the largest decline of 33 percent occurring
for completion of grade 11. Older females were less likely to complete grades 4 to 12,
their decline in completing grades 7 to 12 being much larger than those for older males
and ranging from a 10 percent fall in completing grade 4 to a 49 percent decrease in
completing grade 11.
4.4 Results for Migrant and Non-Migrant Individuals
As discussed in Section 3.1, restricting our estimation sample to only non-displaced and
non-migrant individuals allows us to identify the department in which they lived during
their school age but may lead us to underestimate the effect of the civil war on schooling
outcomes. This may happen if displaced and migrant individuals were more negatively
affected by the war than non-displaced and non-migrant people.
To check the validity of this argument, we estimated all regressions using the full
13A percent change of 0 corresponds to a statistically insignificant difference-in-differences coefficientfrom Tables 8 and 9.
25
sample – i.e. both displaced/migrant and non-displaced/non-migrant individuals – and
report the results for years of schooling in Tables 11 and 12. The results are very similar
for the full sample. While the magnitude of the difference-in-difference coefficients is
smaller with the full sample, the level of significance is the same.
The coefficient estimates being smaller for the full sample compared to the non-
migrant sample suggests that the civil war did not have a worse effect on the schooling
of displaced and migrant individuals and that we are not underestimating the educa-
tional impact of the war by restricting our sample to the non-displaced and non-migrant
population.
5 Conclusion
In this paper, we investigate the impact of the worst period of Guatemala’s civil war
(1979-1984) on educational outcomes of individuals. The empirical identification strat-
egy uses a difference-in-differences approach by comparing the difference in the schooling
of cohorts who were school age between 1979 and 1984 with those who had completed
school age by 1979 in departments that experienced high and low war intensity. Be-
sides including fixed effects for an individuals department of residence and year of birth,
we also include interactions between year of birth indicators and the availability of ba-
sic services in a department prior to the war. These interactions allow us to control
for differences in pre-war levels of human development in high and low war intensity
departments, that may have influenced levels and trends in educational attainment in
these departments even in the absence of the war.
We find that females who were born between 1961 and 1977 in high war intensity
departments experienced 0.44 years less schooling, a 12 percent decline relative to the
average educational attainment. This impact is stronger for older female cohorts exposed
to the war (those born between 1961 and 1966), who completed 0.64 years less schooling,
26
a decline of 17 percent. Older males exposed to the war were less likely to complete
grades 7 to 12. However, older females exposed to the war experienced a larger decline
in completing grades 4 to 12.
Understanding the mechanisms by which civil war affects human capital formation
and accumulation is important in formulating effective post-war policies to protect indi-
viduals from the negative consequences of wars. While our analysis does indicate some
likely mechanisms through which households responded to the civil war, our data does
not allow us to address whether or not it was through orphanhood that exposed school
age children received less education. As discussed in 2.2, civil war can result in the dis-
placement of families and the loss of property and means of livelihood. It can cause the
destruction of schools and infrastructure and delay the construction of new schools due
to the loss of capital and human resources. It can also heighten security fears, especially
for girls. Moreover, the destruction of existing industries and lack of development of
new ones may reduce the expected returns to education for both boys and girls. All
these factors may discourage investment in human capital during a civil war and result
in low levels of human capital formation and accumulation among individuals exposed
to war.
Our results suggest that the worst period of Guatemala’s civil war may have acted
as a negative shock to households in high war intensity departments. Due to loss of
property and the massive displacement of families, households may have reallocated
limited resources towards providing young boys, and to a less extent young girls, with
at least some primary education. While both boys and girls received less secondary and
high school education as a result of the war, this effect was more pronounced for females
for whom expected returns to education are generally lower and security fears higher.
That the war had its worst effect on females indicates that it worsened the position of
women amongst the poorest groups by deteriorating their educational attainment. Our
27
results also show that at higher grades, rural and Mayan females were better off than
their urban and non-Mayan counterparts. The war therefore appears to have narrowed
the gap between urban and rural as well as between Mayan and non-Mayan schooling
outcomes among older girls who were exposed to the war, thus reducing the educational
gaps between these groups.
Even though the destruction of schooling infrastructure may be responsible for worse
educational outcomes during and after a civil war, we find that young boys exposed to
the war were more likely to complete grades 1 to 3. Moreover, the largest negative effects
of the war are found for older males and females in completing high school grades. Both
these results indicate that it was not the destruction of schooling infrastructure that
was primarily responsible for the decline in educational attainment. More likely, a lower
probability of progressing from one grade to another rather than not attaining any
education appears to have driven lower schooling as a result of Guatemala’s civil war.
Our results indicate that exposure to the 1979-1984 period of Guatemala’s civil war
had a large, negative, and long-term effect on the education of boys and particularly
girls who were of secondary and high school age. These results can be explained by
a combination of factors. First, a large number of educated individuals were killed
during the war. Second, and more importantly, households experienced a negative
shock through the loss of property, their means of livelihood and wealth, and the death
of income-earning family members. As a result, resources may have been diverted from
education in general and the schooling of older boys and particularly older girls.
If the civil war in Guatemala disproportionately killed educated individuals, we
would overestimate the true effect of the war on the educational attainment of survivors.
According to the CEH, REMHI, and Perera & Chauche (1995), a large proportion of
college students were killed during the earlier years of the war since they supported the
rural Mayans. Our results could therefore be partly a result of this. However, college
28
students were mostly targeted during the 1960s and early 1970s, the period leading up
to and well before the worst period of the civil war in 1979 (Commission for Historical
Clarification 1999, Archdiocese of Guatemala 1999, Perera & Chauche 1995). As the war
progressed during the mid-1970s and peaked between 1979 and 1984, uneducated rural
Mayans became the focus of military operations and constituted roughly 83 percent of
all victims of the war. Since our analysis focuses on individuals who were born between
1961 and 1977, the oldest cohort was between 18 and 23 years old from 1979 to 1984
and was school age before 1979. There is no evidence that school age children were
disproportionately killed between 1979 and 1984, making it unlikely that the death
of educated individuals are driving our results. Rather, the disproportionate killing
of uneducated rural and Mayan civilians, together with the killing of college students
before 1979-1984, suggests that our results are, at least to some extent, due to negative
income shocks experienced by families during the war. These families appear to have
reallocated scarce household resources away from educating older children, especially
older girls.
Table 13 reveals sharp differences in the average years of schooling and proportion of
individuals completing grades 1 to 12 between high and low war intensity departments
even in 2002, 18 years after the worst period of the civil war ended.14 While gender
differences exist in all departments, they are stronger in those that experienced a high
level of conflict between 1979 and 1984. Regional disparities between high and low war
intensity departments also exist, the greatest differentials being for females in primary
school grades. Given the already unbalanced levels of human development and educa-
tional attainment in high and low war intensity departments that existed prior to 1979,
the worst period of the war between 1979 and 1984 appears to have intensified both
regional and gender disparities in human capital accumulation, which still existed at the
time of the census in 2002.
14Data for all cohorts and migrant and non-migrant individuals are used to construct Table 13.
29
References
Abadie, A. & Gardeazabal, J. (2003), ‘The economic costs of conflict: A case study of
the Basque country’, American Economic Review 93(1), 112–132.
Akresh, R., Bundervoet, T. & Verwimp, P. (2007), Civil war, crop failure, and child
stunting in Rwanda. Households in Conflict Network Working Paper, 19.
Akresh, R., Bundervoet, T. & Verwimp, P. (2008), ‘Health and civil war in Burundi’,
Journal of Human Resources forthcoming.
Akresh, R. & de Walque, D. (2008), Armed conflict and schooling: Evidence from the
1994 Rwandan genocide. Households in Conflict Network Working Paper, 47.
Alderman, H., Hoddinott, J. & Kinsey, B. (2004), ‘Long term consequences of early
childhood malnutrition’, Oxford Economic Papers 58(3), 450–474.
Archdiocese of Guatemala (1999), Guatemala never again!, Orbis.
Bertrand, M., Duflo, E. & Mullainathan, S. (2004), ‘How much should we trust
difference-in-differences estimates?’, Quarterly Journal of Economics 119(1), 249–
275.
Blattman, C. & Annan, J. (2007), ‘The consequences of child soldiering’. Households in
Conflict Network Working Paper, 22.
Blattman, C. & Miguel, E. (2008), ‘Civil war’, Journal of Economic Literature forth-
coming.
Brakman, S., Garretsen, H. & Schramm, M. (2004), ‘The strategic bombing of cities
in Germany in World War II and its impact on city growth’, Journal of Economic
Geography 4(1), 1–18.
30
Cerra, V. & Saxena, S. C. (2008), ‘Growth dynamics: The myth of economic recovery’,
American Economic Review 98(1), 439–457.
Chen, S., Loayza, N. V. & Reynal-Querol, M. (2008), ‘The aftermath of civil war’, The
World Bank Economic Review 22(1), 63–85.
Commission for Historical Clarification (1999), Guatemala: Memory of silence.
http://shr.aaas.org/guatemala/ceh/report/english/toc.html.
Davis, D. R. & Weinstein, D. (2002), ‘Bones, bombs, and breakpoints: The geography
of economic activity’, American Economic Review 92(5), 1269–1289.
de Walque, D. (2006), ‘The socio-demographic legacy of the Khmer Rouge period in
Cambodia’, Population Studies 60(2), 223–231.
Duflo, E. (2001), ‘Schooling and labor market consequences of school construction in
indonesia: evidence from an unusual policy experiment’, American Economic Review
(4), 795–813.
Justino, P. & Verwimp, P. (2006), Poverty dynamics, violent conflict and convergence
in Rwanda. Households in Conflict Network Working Paper, 16.
Miguel, E. & Roland, G. (2005), The long run impact of bombing Vietnam. Unpublished
manuscript.
Moulton, B. (1986), ‘Random group effects and the precision of regression estimates’,
Journal of Econometrics 32(3), 385–397.
Moulton, B. (1990), ‘An illustration of a pitfall in estimating the effects of aggregate
variables on micro units’, The Review of Economics and Statistics 72(2), 334–338.
Organski, A. F. K. & Kugler, J. (1977), ‘The costs of major wars: The Phoenix factor’,
American Political Science Review 71(4), 1347–1366.
31
Organski, A. F. K. & Kugler, J. (1980), The war ledger, University of Chicago Press.
Perera, V. & Chauche, D. (1995), Unfinished conquest: The Guatemalan tragedy, Uni-
versity of California Press.
Przeworski, A., Alvarez, M. E., Cheibub, J. A. & Limongi, F. (2000), Democracy and
development: Political institutions and wellbeing in the world 1950-1990, Cambridge
University Press.
Quinn, J., Mason, T. & Gurses, M. (2007), ‘Sustaining the peace: Determinants of civil
war recurrence’, International Interactions (2), 167–193.
Shemyakina, O. (2006), The effect of armed conflict on accumulation of schooling: Re-
sults from Tajikistan. Households in Conflict Network Working Paper, 12.
Stewart, F., Huang, C. & Wang, M. (2001), Internal wars in developing countries: An
empirical overview of economic and social consequences, in F. Stewart & V. Fitzgerald,
eds, ‘War and underdevelopment’, Oxford University Press.
32
Figure 1: Map of Guatemala
33
Figure 2: Number of Killings and Disappearances in Guatemala: 1960-1996
05,
000
10,0
0015
,000
20,0
0025
,000
1960-1968 1969-1978 1979-1984 1985-1990 1991-1996
34
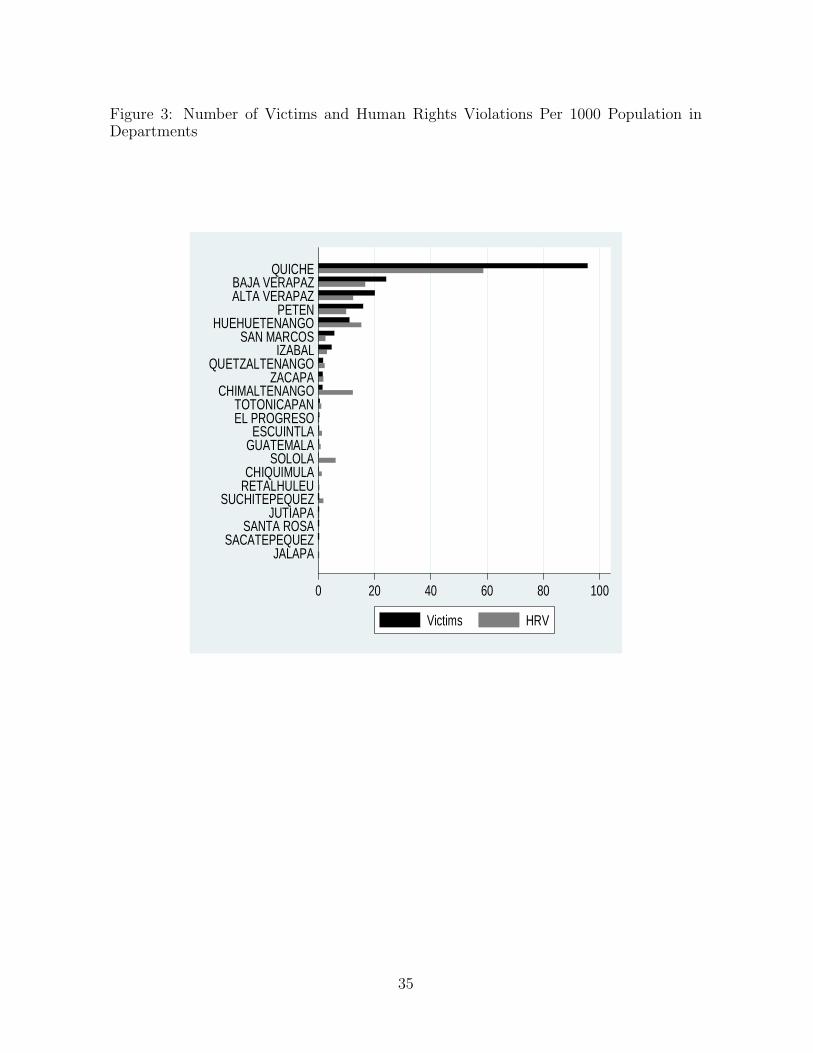
Figure 3: Number of Victims and Human Rights Violations Per 1000 Population inDepartments
0 20 40 60 80 100
JALAPASACATEPEQUEZ
SANTA ROSAJUTIAPA
SUCHITEPEQUEZRETALHULEUCHIQUIMULA
SOLOLAGUATEMALAESCUINTLA
EL PROGRESOTOTONICAPAN
CHIMALTENANGOZACAPA
QUETZALTENANGOIZABAL
SAN MARCOSHUEHUETENANGO
PETENALTA VERAPAZBAJA VERAPAZ
QUICHE
Victims HRV
35
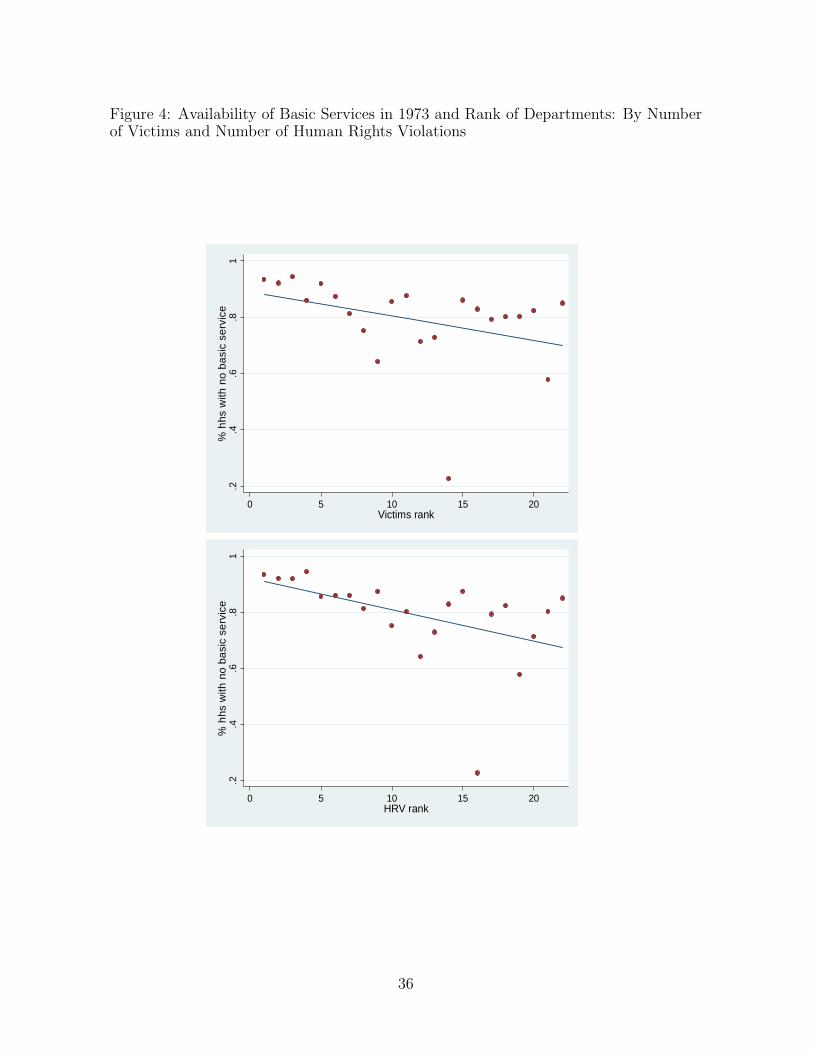
Figure 4: Availability of Basic Services in 1973 and Rank of Departments: By Numberof Victims and Number of Human Rights Violations
.2
.4.6
.81
% h
hs w
ith n
o ba
sic
serv
ice
0 5 10 15 20Victims rank
.2.4
.6.8
1%
hhs
with
no
basi
c se
rvic
e
0 5 10 15 20HRV rank
36
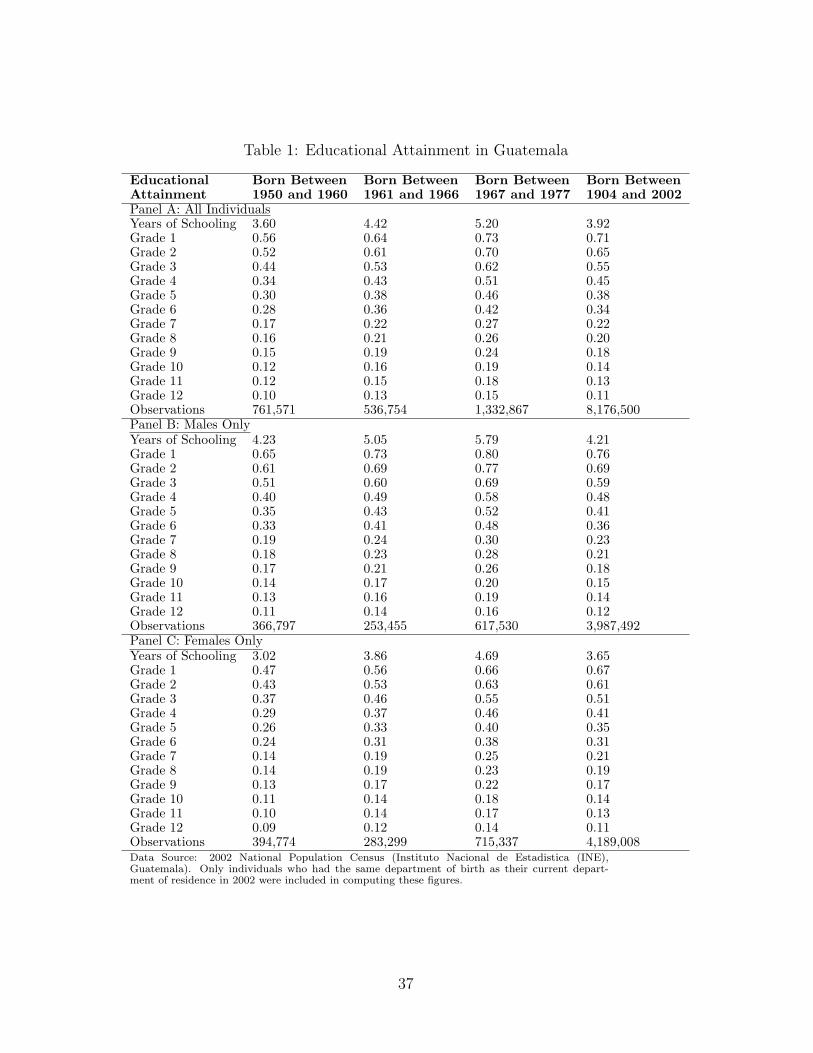
Table 1: Educational Attainment in Guatemala
Educational Born Between Born Between Born Between Born BetweenAttainment 1950 and 1960 1961 and 1966 1967 and 1977 1904 and 2002Panel A: All IndividualsYears of Schooling 3.60 4.42 5.20 3.92Grade 1 0.56 0.64 0.73 0.71Grade 2 0.52 0.61 0.70 0.65Grade 3 0.44 0.53 0.62 0.55Grade 4 0.34 0.43 0.51 0.45Grade 5 0.30 0.38 0.46 0.38Grade 6 0.28 0.36 0.42 0.34Grade 7 0.17 0.22 0.27 0.22Grade 8 0.16 0.21 0.26 0.20Grade 9 0.15 0.19 0.24 0.18Grade 10 0.12 0.16 0.19 0.14Grade 11 0.12 0.15 0.18 0.13Grade 12 0.10 0.13 0.15 0.11Observations 761,571 536,754 1,332,867 8,176,500Panel B: Males OnlyYears of Schooling 4.23 5.05 5.79 4.21Grade 1 0.65 0.73 0.80 0.76Grade 2 0.61 0.69 0.77 0.69Grade 3 0.51 0.60 0.69 0.59Grade 4 0.40 0.49 0.58 0.48Grade 5 0.35 0.43 0.52 0.41Grade 6 0.33 0.41 0.48 0.36Grade 7 0.19 0.24 0.30 0.23Grade 8 0.18 0.23 0.28 0.21Grade 9 0.17 0.21 0.26 0.18Grade 10 0.14 0.17 0.20 0.15Grade 11 0.13 0.16 0.19 0.14Grade 12 0.11 0.14 0.16 0.12Observations 366,797 253,455 617,530 3,987,492Panel C: Females OnlyYears of Schooling 3.02 3.86 4.69 3.65Grade 1 0.47 0.56 0.66 0.67Grade 2 0.43 0.53 0.63 0.61Grade 3 0.37 0.46 0.55 0.51Grade 4 0.29 0.37 0.46 0.41Grade 5 0.26 0.33 0.40 0.35Grade 6 0.24 0.31 0.38 0.31Grade 7 0.14 0.19 0.25 0.21Grade 8 0.14 0.19 0.23 0.19Grade 9 0.13 0.17 0.22 0.17Grade 10 0.11 0.14 0.18 0.14Grade 11 0.10 0.14 0.17 0.13Grade 12 0.09 0.12 0.14 0.11Observations 394,774 283,299 715,337 4,189,008Data Source: 2002 National Population Census (Instituto Nacional de Estadistica (INE),Guatemala). Only individuals who had the same department of birth as their current depart-ment of residence in 2002 were included in computing these figures.
37
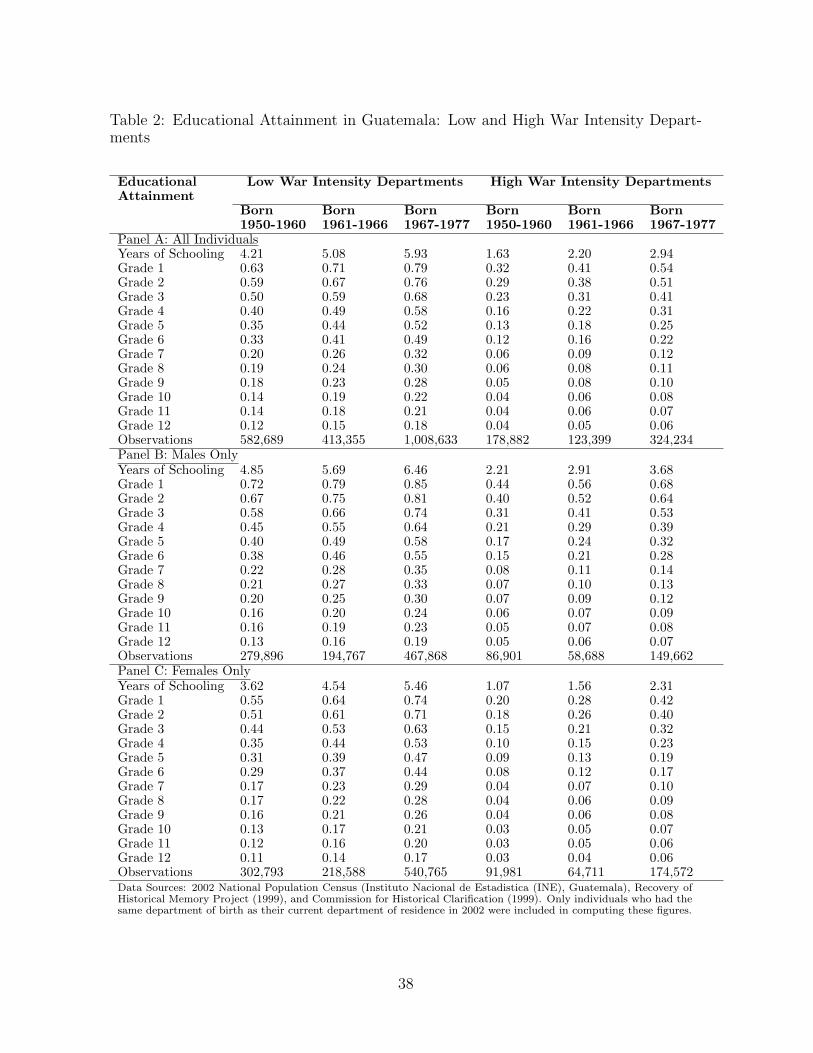
Table 2: Educational Attainment in Guatemala: Low and High War Intensity Depart-ments
Educational Low War Intensity Departments High War Intensity DepartmentsAttainment
Born Born Born Born Born Born1950-1960 1961-1966 1967-1977 1950-1960 1961-1966 1967-1977
Panel A: All IndividualsYears of Schooling 4.21 5.08 5.93 1.63 2.20 2.94Grade 1 0.63 0.71 0.79 0.32 0.41 0.54Grade 2 0.59 0.67 0.76 0.29 0.38 0.51Grade 3 0.50 0.59 0.68 0.23 0.31 0.41Grade 4 0.40 0.49 0.58 0.16 0.22 0.31Grade 5 0.35 0.44 0.52 0.13 0.18 0.25Grade 6 0.33 0.41 0.49 0.12 0.16 0.22Grade 7 0.20 0.26 0.32 0.06 0.09 0.12Grade 8 0.19 0.24 0.30 0.06 0.08 0.11Grade 9 0.18 0.23 0.28 0.05 0.08 0.10Grade 10 0.14 0.19 0.22 0.04 0.06 0.08Grade 11 0.14 0.18 0.21 0.04 0.06 0.07Grade 12 0.12 0.15 0.18 0.04 0.05 0.06Observations 582,689 413,355 1,008,633 178,882 123,399 324,234Panel B: Males OnlyYears of Schooling 4.85 5.69 6.46 2.21 2.91 3.68Grade 1 0.72 0.79 0.85 0.44 0.56 0.68Grade 2 0.67 0.75 0.81 0.40 0.52 0.64Grade 3 0.58 0.66 0.74 0.31 0.41 0.53Grade 4 0.45 0.55 0.64 0.21 0.29 0.39Grade 5 0.40 0.49 0.58 0.17 0.24 0.32Grade 6 0.38 0.46 0.55 0.15 0.21 0.28Grade 7 0.22 0.28 0.35 0.08 0.11 0.14Grade 8 0.21 0.27 0.33 0.07 0.10 0.13Grade 9 0.20 0.25 0.30 0.07 0.09 0.12Grade 10 0.16 0.20 0.24 0.06 0.07 0.09Grade 11 0.16 0.19 0.23 0.05 0.07 0.08Grade 12 0.13 0.16 0.19 0.05 0.06 0.07Observations 279,896 194,767 467,868 86,901 58,688 149,662Panel C: Females OnlyYears of Schooling 3.62 4.54 5.46 1.07 1.56 2.31Grade 1 0.55 0.64 0.74 0.20 0.28 0.42Grade 2 0.51 0.61 0.71 0.18 0.26 0.40Grade 3 0.44 0.53 0.63 0.15 0.21 0.32Grade 4 0.35 0.44 0.53 0.10 0.15 0.23Grade 5 0.31 0.39 0.47 0.09 0.13 0.19Grade 6 0.29 0.37 0.44 0.08 0.12 0.17Grade 7 0.17 0.23 0.29 0.04 0.07 0.10Grade 8 0.17 0.22 0.28 0.04 0.06 0.09Grade 9 0.16 0.21 0.26 0.04 0.06 0.08Grade 10 0.13 0.17 0.21 0.03 0.05 0.07Grade 11 0.12 0.16 0.20 0.03 0.05 0.06Grade 12 0.11 0.14 0.17 0.03 0.04 0.06Observations 302,793 218,588 540,765 91,981 64,711 174,572Data Sources: 2002 National Population Census (Instituto Nacional de Estadistica (INE), Guatemala), Recovery ofHistorical Memory Project (1999), and Commission for Historical Clarification (1999). Only individuals who had thesame department of birth as their current department of residence in 2002 were included in computing these figures.
38
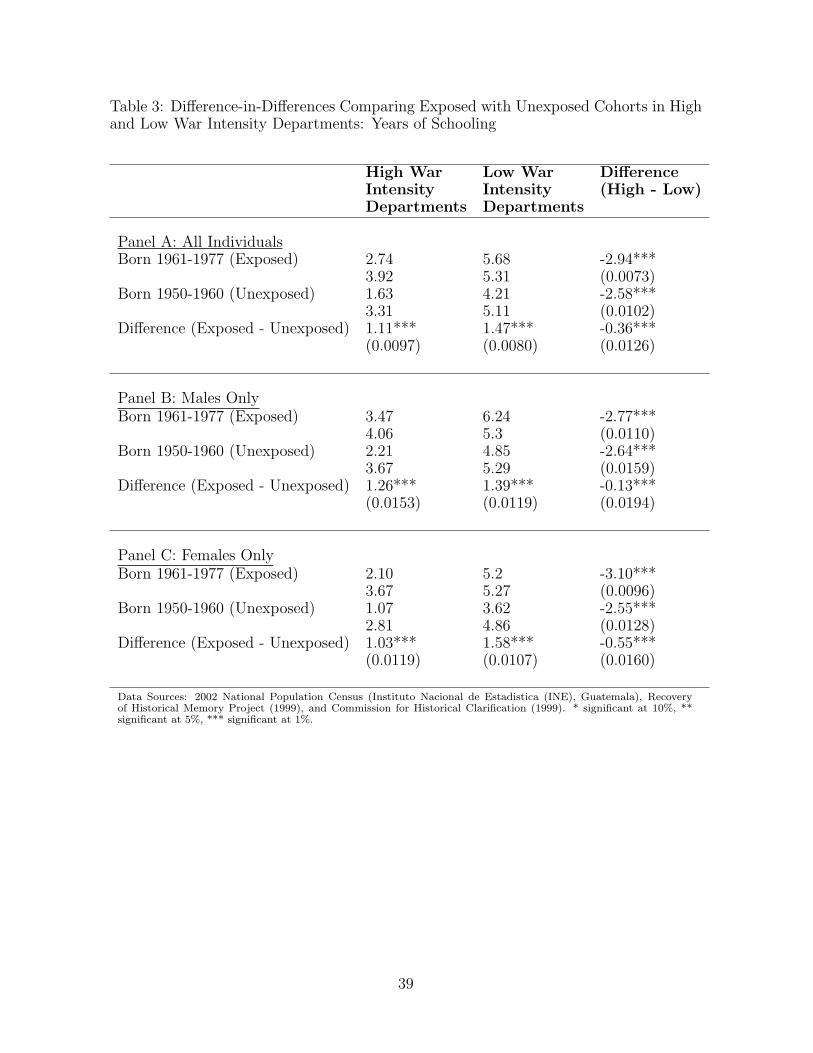
Table 3: Difference-in-Differences Comparing Exposed with Unexposed Cohorts in Highand Low War Intensity Departments: Years of Schooling
High War Low War DifferenceIntensity Intensity (High - Low)Departments Departments
Panel A: All IndividualsBorn 1961-1977 (Exposed) 2.74 5.68 -2.94***
3.92 5.31 (0.0073)Born 1950-1960 (Unexposed) 1.63 4.21 -2.58***
3.31 5.11 (0.0102)Difference (Exposed - Unexposed) 1.11*** 1.47*** -0.36***
(0.0097) (0.0080) (0.0126)
Panel B: Males OnlyBorn 1961-1977 (Exposed) 3.47 6.24 -2.77***
4.06 5.3 (0.0110)Born 1950-1960 (Unexposed) 2.21 4.85 -2.64***
3.67 5.29 (0.0159)Difference (Exposed - Unexposed) 1.26*** 1.39*** -0.13***
(0.0153) (0.0119) (0.0194)
Panel C: Females OnlyBorn 1961-1977 (Exposed) 2.10 5.2 -3.10***
3.67 5.27 (0.0096)Born 1950-1960 (Unexposed) 1.07 3.62 -2.55***
2.81 4.86 (0.0128)Difference (Exposed - Unexposed) 1.03*** 1.58*** -0.55***
(0.0119) (0.0107) (0.0160)
Data Sources: 2002 National Population Census (Instituto Nacional de Estadistica (INE), Guatemala), Recoveryof Historical Memory Project (1999), and Commission for Historical Clarification (1999). * significant at 10%, **significant at 5%, *** significant at 1%.
39
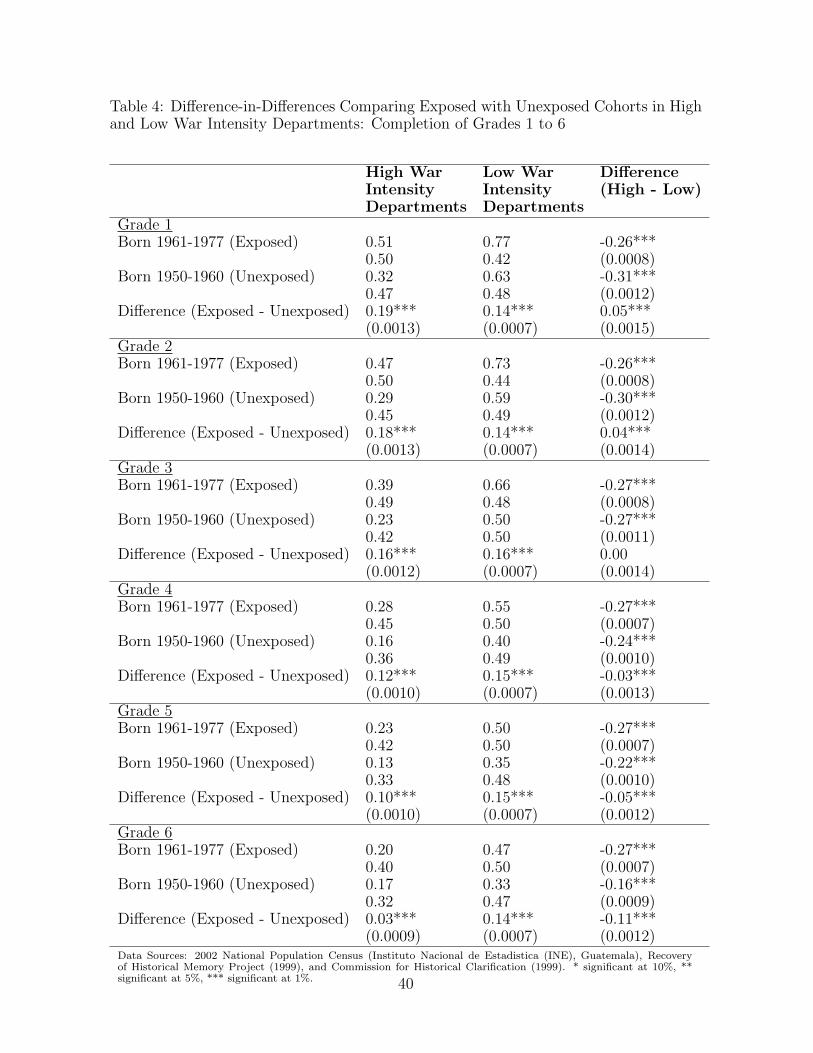
Table 4: Difference-in-Differences Comparing Exposed with Unexposed Cohorts in Highand Low War Intensity Departments: Completion of Grades 1 to 6
High War Low War DifferenceIntensity Intensity (High - Low)Departments Departments
Grade 1Born 1961-1977 (Exposed) 0.51 0.77 -0.26***
0.50 0.42 (0.0008)Born 1950-1960 (Unexposed) 0.32 0.63 -0.31***
0.47 0.48 (0.0012)Difference (Exposed - Unexposed) 0.19*** 0.14*** 0.05***
(0.0013) (0.0007) (0.0015)Grade 2Born 1961-1977 (Exposed) 0.47 0.73 -0.26***
0.50 0.44 (0.0008)Born 1950-1960 (Unexposed) 0.29 0.59 -0.30***
0.45 0.49 (0.0012)Difference (Exposed - Unexposed) 0.18*** 0.14*** 0.04***
(0.0013) (0.0007) (0.0014)Grade 3Born 1961-1977 (Exposed) 0.39 0.66 -0.27***
0.49 0.48 (0.0008)Born 1950-1960 (Unexposed) 0.23 0.50 -0.27***
0.42 0.50 (0.0011)Difference (Exposed - Unexposed) 0.16*** 0.16*** 0.00
(0.0012) (0.0007) (0.0014)Grade 4Born 1961-1977 (Exposed) 0.28 0.55 -0.27***
0.45 0.50 (0.0007)Born 1950-1960 (Unexposed) 0.16 0.40 -0.24***
0.36 0.49 (0.0010)Difference (Exposed - Unexposed) 0.12*** 0.15*** -0.03***
(0.0010) (0.0007) (0.0013)Grade 5Born 1961-1977 (Exposed) 0.23 0.50 -0.27***
0.42 0.50 (0.0007)Born 1950-1960 (Unexposed) 0.13 0.35 -0.22***
0.33 0.48 (0.0010)Difference (Exposed - Unexposed) 0.10*** 0.15*** -0.05***
(0.0010) (0.0007) (0.0012)Grade 6Born 1961-1977 (Exposed) 0.20 0.47 -0.27***
0.40 0.50 (0.0007)Born 1950-1960 (Unexposed) 0.17 0.33 -0.16***
0.32 0.47 (0.0009)Difference (Exposed - Unexposed) 0.03*** 0.14*** -0.11***
(0.0009) (0.0007) (0.0012)Data Sources: 2002 National Population Census (Instituto Nacional de Estadistica (INE), Guatemala), Recoveryof Historical Memory Project (1999), and Commission for Historical Clarification (1999). * significant at 10%, **significant at 5%, *** significant at 1%. 40
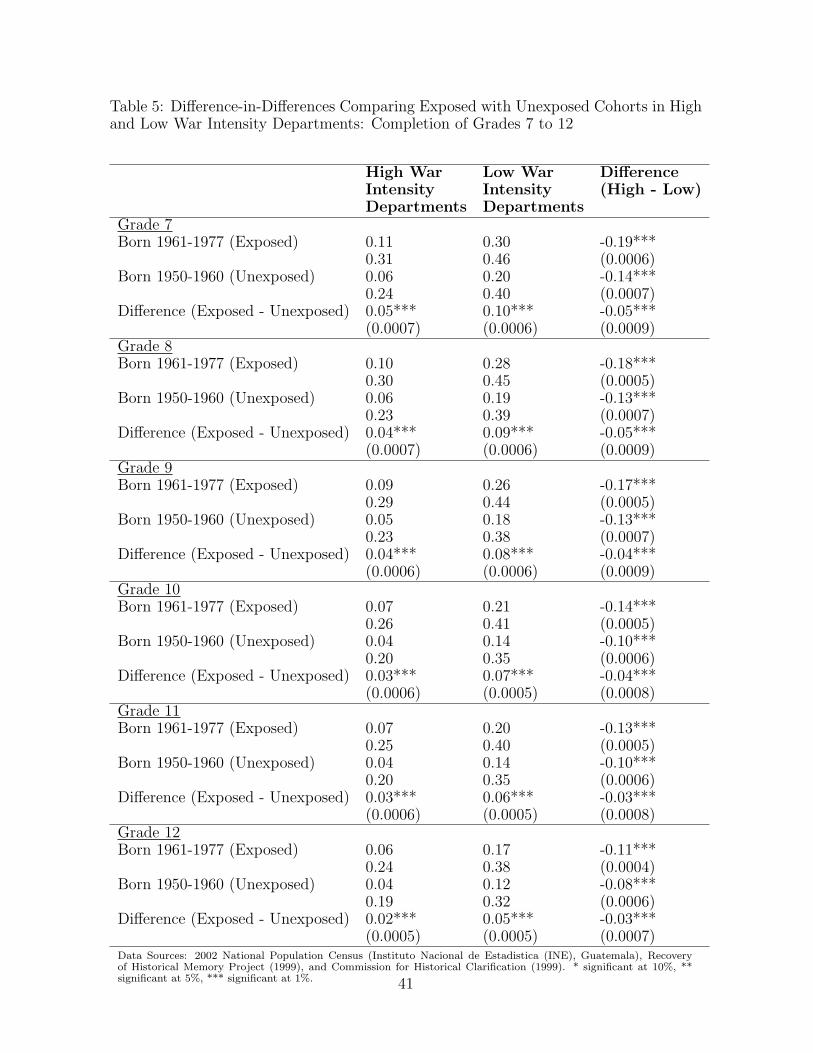
Table 5: Difference-in-Differences Comparing Exposed with Unexposed Cohorts in Highand Low War Intensity Departments: Completion of Grades 7 to 12
High War Low War DifferenceIntensity Intensity (High - Low)Departments Departments
Grade 7Born 1961-1977 (Exposed) 0.11 0.30 -0.19***
0.31 0.46 (0.0006)Born 1950-1960 (Unexposed) 0.06 0.20 -0.14***
0.24 0.40 (0.0007)Difference (Exposed - Unexposed) 0.05*** 0.10*** -0.05***
(0.0007) (0.0006) (0.0009)Grade 8Born 1961-1977 (Exposed) 0.10 0.28 -0.18***
0.30 0.45 (0.0005)Born 1950-1960 (Unexposed) 0.06 0.19 -0.13***
0.23 0.39 (0.0007)Difference (Exposed - Unexposed) 0.04*** 0.09*** -0.05***
(0.0007) (0.0006) (0.0009)Grade 9Born 1961-1977 (Exposed) 0.09 0.26 -0.17***
0.29 0.44 (0.0005)Born 1950-1960 (Unexposed) 0.05 0.18 -0.13***
0.23 0.38 (0.0007)Difference (Exposed - Unexposed) 0.04*** 0.08*** -0.04***
(0.0006) (0.0006) (0.0009)Grade 10Born 1961-1977 (Exposed) 0.07 0.21 -0.14***
0.26 0.41 (0.0005)Born 1950-1960 (Unexposed) 0.04 0.14 -0.10***
0.20 0.35 (0.0006)Difference (Exposed - Unexposed) 0.03*** 0.07*** -0.04***
(0.0006) (0.0005) (0.0008)Grade 11Born 1961-1977 (Exposed) 0.07 0.20 -0.13***
0.25 0.40 (0.0005)Born 1950-1960 (Unexposed) 0.04 0.14 -0.10***
0.20 0.35 (0.0006)Difference (Exposed - Unexposed) 0.03*** 0.06*** -0.03***
(0.0006) (0.0005) (0.0008)Grade 12Born 1961-1977 (Exposed) 0.06 0.17 -0.11***
0.24 0.38 (0.0004)Born 1950-1960 (Unexposed) 0.04 0.12 -0.08***
0.19 0.32 (0.0006)Difference (Exposed - Unexposed) 0.02*** 0.05*** -0.03***
(0.0005) (0.0005) (0.0007)Data Sources: 2002 National Population Census (Instituto Nacional de Estadistica (INE), Guatemala), Recoveryof Historical Memory Project (1999), and Commission for Historical Clarification (1999). * significant at 10%, **significant at 5%, *** significant at 1%. 41
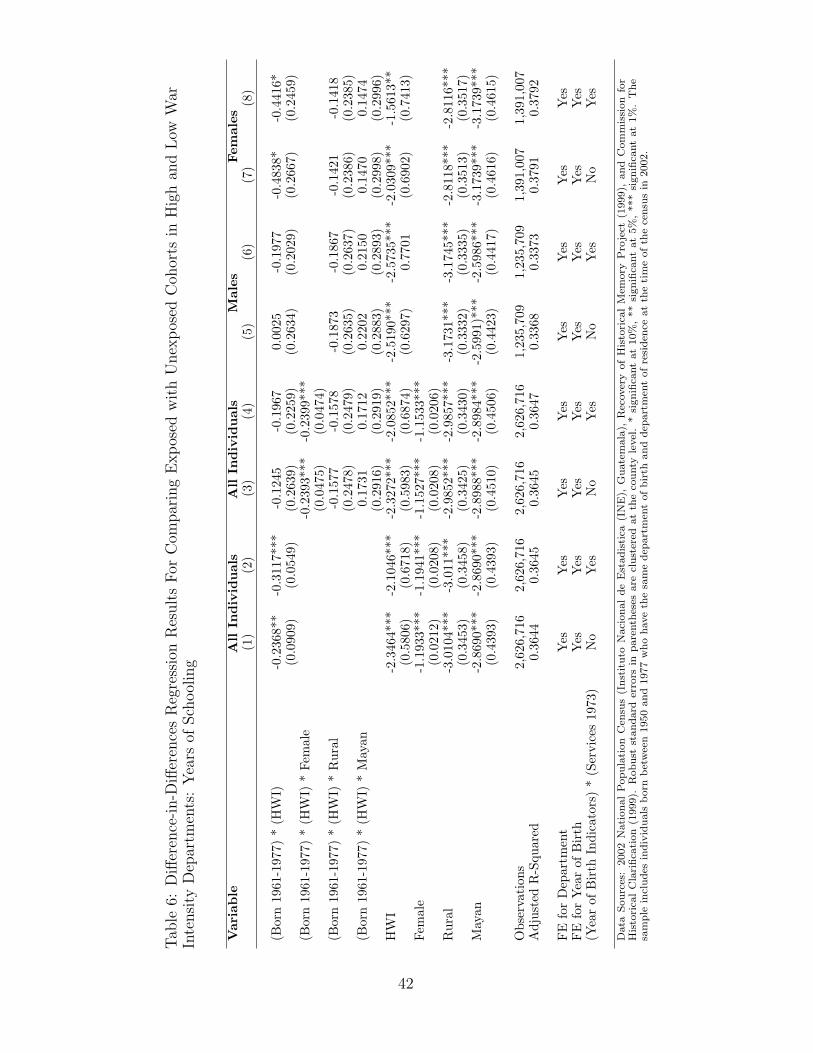
Tab
le6:
Diff
eren
ce-i
n-D
iffer
ence
sR
egre
ssio
nR
esult
sF
orC
ompar
ing
Exp
osed
wit
hU
nex
pos
edC
ohor
tsin
Hig
han
dL
owW
arIn
tensi
tyD
epar
tmen
ts:
Yea
rsof
Sch
ool
ing
Var
iable
All
Indiv
idual
sA
llIn
div
idual
sM
ales
Fem
ales
(1)
(2)
(3)
(4)
(5)
(6)
(7)
(8)
(Bor
n19
61-1
977)
*(H
WI)
-0.2
368*
*-0
.311
7***
-0.1
245
-0.1
967
0.00
25-0
.197
7-0
.483
8*-0
.441
6*(0
.090
9)(0
.054
9)(0
.263
9)(0
.225
9)(0
.263
4)(0
.202
9)(0
.266
7)(0
.245
9)(B
orn
1961
-197
7)*
(HW
I)*
Fem
ale
-0.2
393*
**-0
.239
9***
(0.0
475)
(0.0
474)
(Bor
n19
61-1
977)
*(H
WI)
*R
ural
-0.1
577
-0.1
578
-0.1
873
-0.1
867
-0.1
421
-0.1
418
(0.2
478)
(0.2
479)
(0.2
635)
(0.2
637)
(0.2
386)
(0.2
385)
(Bor
n19
61-1
977)
*(H
WI)
*M
ayan
0.17
310.
1712
0.22
020.
2150
0.14
700.
1474
(0.2
916)
(0.2
919)
(0.2
883)
(0.2
893)
(0.2
998)
(0.2
996)
HW
I-2
.346
4***
-2.1
046*
**-2
.327
2***
-2.0
852*
**-2
.519
0***
-2.5
735*
**-2
.030
9***
-1.5
613*
*(0
.580
6)(0
.671
8)(0
.598
3)(0
.687
4)(0
.629
7)0.
7701
(0.6
902)
(0.7
413)
Fem
ale
-1.1
933*
**-1
.194
1***
-1.1
527*
**-1
.153
3***
(0.0
212)
(0.0
208)
(0.0
208)
(0.0
206)
Rur
al-3
.010
4***
-3.0
11**
*-2
.985
2***
-2.9
857*
**-3
.173
1***
-3.1
745*
**-2
.811
8***
-2.8
116*
**(0
.345
3)(0
.345
8)(0
.342
5)(0
.343
0)(0
.333
2)(0
.333
5)(0
.351
3)(0
.351
7)M
ayan
-2.8
690*
**-2
.869
0***
-2.8
988*
**-2
.898
4***
-2.5
991)
***
-2.5
986*
**-3
.173
9***
-3.1
739*
**(0
.439
3)(0
.439
3)(0
.451
0)(0
.450
6)(0
.442
3)(0
.441
7)(0
.461
6)(0
.461
5)
Obs
erva
tion
s2,
626,
716
2,62
6,71
62,
626,
716
2,62
6,71
61,
235,
709
1,23
5,70
91,
391,
007
1,39
1,00
7A
djus
ted
R-S
quar
ed0.
3644
0.36
450.
3645
0.36
470.
3368
0.33
730.
3791
0.37
92
FE
for
Dep
artm
ent
Yes
Yes
Yes
Yes
Yes
Yes
Yes
Yes
FE
for
Yea
rof
Bir
thY
esY
esY
esY
esY
esY
esY
esY
es(Y
ear
ofB
irth
Indi
cato
rs)
*(S
ervi
ces
1973
)N
oY
esN
oY
esN
oY
esN
oY
es
Data
Sou
rces
:2002
Nati
on
al
Pop
ula
tion
Cen
sus
(In
stit
uto
Naci
on
al
de
Est
ad
isti
ca(I
NE
),G
uate
mala
),R
ecover
yof
His
tori
cal
Mem
ory
Pro
ject
(1999),
an
dC
om
mis
sion
for
His
tori
cal
Cla
rifi
cati
on
(1999).
Rob
ust
stan
dard
erro
rsin
pare
nth
eses
are
clu
ster
edat
the
cou
nty
level
.*
sign
ifica
nt
at
10%
,**
sign
ifica
nt
at
5%
,***
sign
ifica
nt
at
1%
.T
he
sam
ple
incl
ud
esin
div
idu
als
born
bet
wee
n1950
an
d1977
wh
oh
ave
the
sam
ed
epart
men
tof
bir
than
dd
epart
men
tof
resi
den
ceat
the
tim
eof
the
cen
sus
in2002.
42
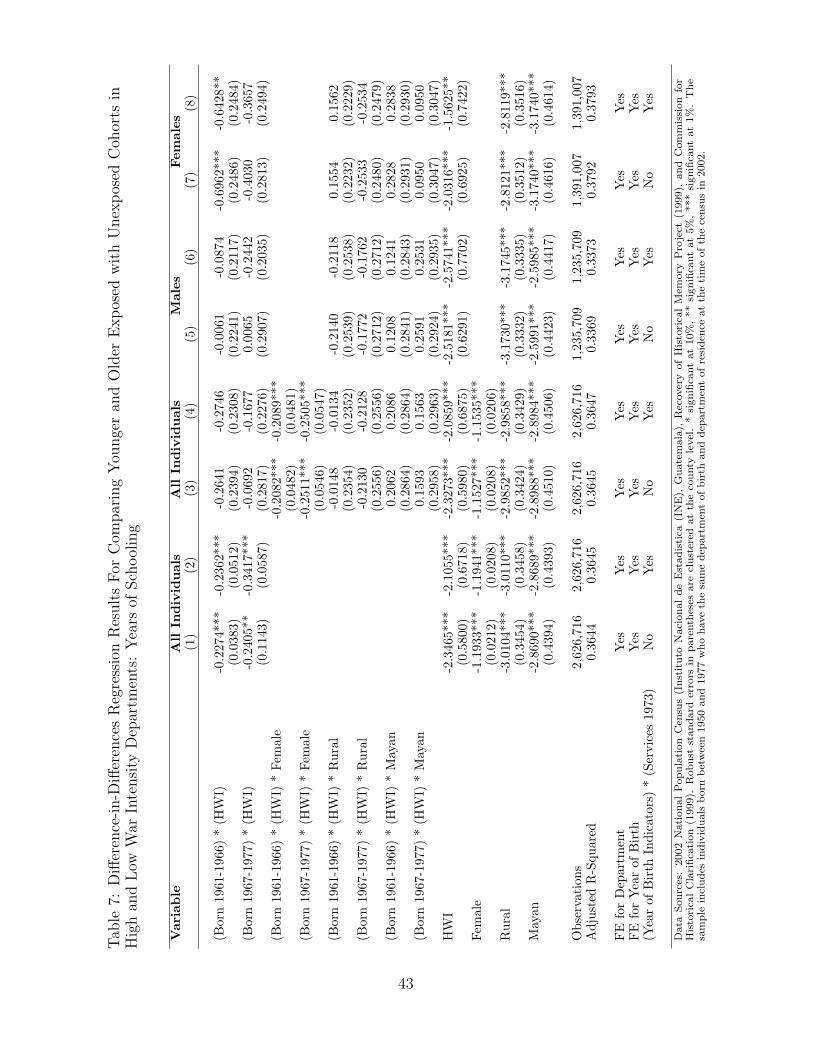
Tab
le7:
Diff
eren
ce-i
n-D
iffer
ence
sR
egre
ssio
nR
esult
sF
orC
ompar
ing
You
nge
ran
dO
lder
Exp
osed
wit
hU
nex
pos
edC
ohor
tsin
Hig
han
dL
owW
arIn
tensi
tyD
epar
tmen
ts:
Yea
rsof
Sch
ool
ing
Var
iable
All
Indiv
idual
sA
llIn
div
idual
sM
ales
Fem
ales
(1)
(2)
(3)
(4)
(5)
(6)
(7)
(8)
(Bor
n19
61-1
966)
*(H
WI)
-0.2
274*
**-0
.236
2***
-0.2
641
-0.2
746
-0.0
061
-0.0
874
-0.6
962*
**-0
.642
8**
(0.0
383)
(0.0
512)
(0.2
394)
(0.2
308)
(0.2
241)
(0.2
117)
(0.2
486)
(0.2
484)
(Bor
n19
67-1
977)
*(H
WI)
-0.2
405*
*-0
.341
7***
-0.0
692
-0.1
677
0.00
65-0
.244
2-0
.403
0-0
.365
7(0
.114
3)(0
.058
7)(0
.281
7)(0
.227
6)(0
.290
7)(0
.203
5)(0
.281
3)(0
.249
4)(B
orn
1961
-196
6)*
(HW
I)*
Fem
ale
-0.2
082*
**-0
.208
9***
(0.0
482)
(0.0
481)
(Bor
n19
67-1
977)
*(H
WI)
*Fe
mal
e-0
.251
1***
-0.2
505*
**(0
.054
6)(0
.054
7)(B
orn
1961
-196
6)*
(HW
I)*
Rur
al-0
.014
8-0
.013
4-0
.214
0-0
.211
80.
1554
0.15
62(0
.235
4)(0
.235
2)(0
.253
9)(0
.253
8)(0
.223
2)(0
.222
9)(B
orn
1967
-197
7)*
(HW
I)*
Rur
al-0
.213
0-0
.212
8-0
.177
2-0
.176
2-0
.253
3-0
.253
4(0
.255
6)(0
.255
6)(0
.271
2)(0
.271
2)(0
.248
0)(0
.247
9)(B
orn
1961
-196
6)*
(HW
I)*
May
an0.
2062
0.20
860.
1208
0.12
410.
2828
0.28
38(0
.286
4)(0
.286
4)(0
.284
1)(0
.284
3)(0
.293
1)(0
.293
0)(B
orn
1967
-197
7)*
(HW
I)*
May
an0.
1593
0.15
630.
2591
0.25
310.
0950
0.09
50(0
.295
8)(0
.296
3)(0
.292
4)(0
.293
5)(0
.304
7)(0
.304
7)H
WI
-2.3
465*
**-2
.105
5***
-2.3
273*
**-2
.085
9***
-2.5
181*
**-2
.574
1***
-2.0
316*
**-1
.562
5**
(0.5
800)
(0.6
718)
(0.5
980)
(0.6
875)
(0.6
291)
(0.7
702)
(0.6
925)
(0.7
422)
Fem
ale
-1.1
933*
**-1
.194
1***
-1.1
527*
**-1
.153
5***
(0.0
212)
(0.0
208)
(0.0
208)
(0.0
206)
Rur
al-3
.010
4***
-3.0
110*
**-2
.985
2***
-2.9
858*
**-3
.173
0***
-3.1
745*
**-2
.812
1***
-2.8
119*
**(0
.345
4)(0
.345
8)(0
.342
4)(0
.342
9)(0
.333
2)(0
.333
5)(0
.351
2)(0
.351
6)M
ayan
-2.8
690*
**-2
.868
9***
-2.8
988*
**-2
.898
4***
-2.5
991*
**-2
.598
5***
-3.1
740*
**-3
.174
0***
(0.4
394)
(0.4
393)
(0.4
510)
(0.4
506)
(0.4
423)
(0.4
417)
(0.4
616)
(0.4
614)
Obs
erva
tion
s2,
626,
716
2,62
6,71
62,
626,
716
2,62
6,71
61,
235,
709
1,23
5,70
91,
391,
007
1,39
1,00
7A
djus
ted
R-S
quar
ed0.
3644
0.36
450.
3645
0.36
470.
3369
0.33
730.
3792
0.37
93
FE
for
Dep
artm
ent
Yes
Yes
Yes
Yes
Yes
Yes
Yes
Yes
FE
for
Yea
rof
Bir
thY
esY
esY
esY
esY
esY
esY
esY
es(Y
ear
ofB
irth
Indi
cato
rs)
*(S
ervi
ces
1973
)N
oY
esN
oY
esN
oY
esN
oY
es
Data
Sou
rces
:2002
Nati
on
al
Pop
ula
tion
Cen
sus
(In
stit
uto
Naci
on
al
de
Est
ad
isti
ca(I
NE
),G
uate
mala
),R
ecover
yof
His
tori
cal
Mem
ory
Pro
ject
(1999),
an
dC
om
mis
sion
for
His
tori
cal
Cla
rifi
cati
on
(1999).
Rob
ust
stan
dard
erro
rsin
pare
nth
eses
are
clu
ster
edat
the
cou
nty
level
.*
sign
ifica
nt
at
10%
,**
sign
ifica
nt
at
5%
,***
sign
ifica
nt
at
1%
.T
he
sam
ple
incl
ud
esin
div
idu
als
born
bet
wee
n1950
an
d1977
wh
oh
ave
the
sam
ed
epart
men
tof
bir
than
dd
epart
men
tof
resi
den
ceat
the
tim
eof
the
cen
sus
in2002.
43
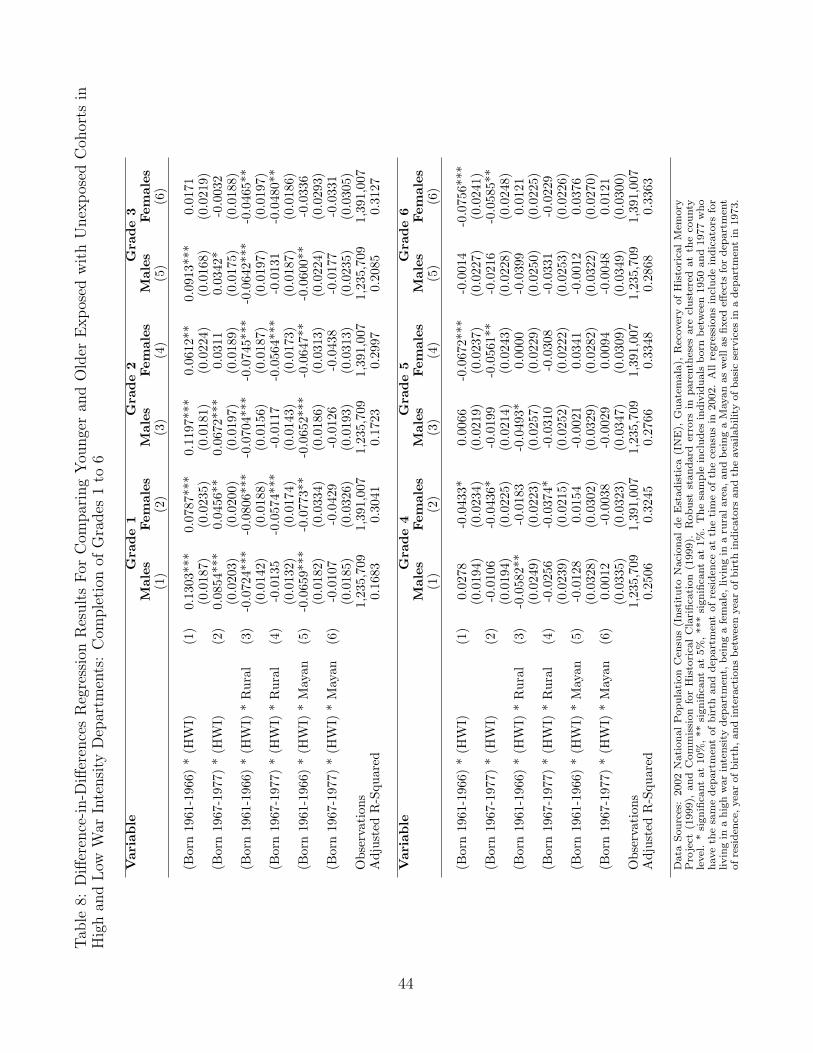
Tab
le8:
Diff
eren
ce-i
n-D
iffer
ence
sR
egre
ssio
nR
esult
sF
orC
ompar
ing
You
nge
ran
dO
lder
Exp
osed
wit
hU
nex
pos
edC
ohor
tsin
Hig
han
dL
owW
arIn
tensi
tyD
epar
tmen
ts:
Com
ple
tion
ofG
rades
1to
6
Var
iable
Gra
de
1G
rade
2G
rade
3M
ales
Fem
ales
Mal
esFem
ales
Mal
esFem
ales
(1)
(2)
(3)
(4)
(5)
(6)
(Bor
n19
61-1
966)
*(H
WI)
(1)
0.13
03**
*0.
0787
***
0.11
97**
*0.
0612
**0.
0913
***
0.01
71(0
.018
7)(0
.023
5)(0
.018
1)(0
.022
4)(0
.016
8)(0
.021
9)(B
orn
1967
-197
7)*
(HW
I)(2
)0.
0854
***
0.04
56**
0.06
72**
*0.
0311
0.03
42*
-0.0
032
(0.0
203)
(0.0
200)
(0.0
197)
(0.0
189)
(0.0
175)
(0.0
188)
(Bor
n19
61-1
966)
*(H
WI)
*R
ural
(3)
-0.0
724*
**-0
.080
6***
-0.0
704*
**-0
.074
5***
-0.0
642*
**-0
.046
5**
(0.0
142)
(0.0
188)
(0.0
156)
(0.0
187)
(0.0
197)
(0.0
197)
(Bor
n19
67-1
977)
*(H
WI)
*R
ural
(4)
-0.0
135
-0.0
574*
**-0
.011
7-0
.056
4***
-0.0
131
-0.0
480*
*(0
.013
2)(0
.017
4)(0
.014
3)(0
.017
3)(0
.018
7)(0
.018
6)(B
orn
1961
-196
6)*
(HW
I)*
May
an(5
)-0
.065
9***
-0.0
773*
*-0
.065
2***
-0.0
647*
*-0
.060
0**
-0.0
336
(0.0
182)
(0.0
334)
(0.0
186)
(0.0
313)
(0.0
224)
(0.0
293)
(Bor
n19
67-1
977)
*(H
WI)
*M
ayan
(6)
-0.0
107
-0.0
429
-0.0
126
-0.0
438
-0.0
177
-0.0
331
(0.0
185)
(0.0
326)
(0.0
193)
(0.0
313)
(0.0
235)
(0.0
305)
Obs
erva
tion
s1,
235,
709
1,39
1,00
71,
235,
709
1,39
1,00
71,
235,
709
1,39
1,00
7A
djus
ted
R-S
quar
ed0.
1683
0.30
410.
1723
0.29
970.
2085
0.31
27
Var
iable
Gra
de
4G
rade
5G
rade
6M
ales
Fem
ales
Mal
esFem
ales
Mal
esFem
ales
(1)
(2)
(3)
(4)
(5)
(6)
(Bor
n19
61-1
966)
*(H
WI)
(1)
0.02
78-0
.043
3*0.
0066
-0.0
672*
**-0
.001
4-0
.075
6***
(0.0
194)
(0.0
234)
(0.0
219)
(0.0
237)
(0.0
227)
(0.0
241)
(Bor
n19
67-1
977)
*(H
WI)
(2)
-0.0
106
-0.0
436*
-0.0
199
-0.0
561*
*-0
.021
6-0
.058
5**
(0.0
194)
(0.0
225)
(0.0
214)
(0.0
243)
(0.0
228)
(0.0
248)
(Bor
n19
61-1
966)
*(H
WI)
*R
ural
(3)
-0.0
582*
*-0
.018
3-0
.049
3*0.
0000
-0.0
399
0.01
21(0
.024
9)(0
.022
3)(0
.025
7)(0
.022
9)(0
.025
0)(0
.022
5)(B
orn
1967
-197
7)*
(HW
I)*
Rur
al(4
)-0
.025
6-0
.037
4*-0
.031
0-0
.030
8-0
.033
1-0
.022
9(0
.023
9)(0
.021
5)(0
.025
2)(0
.022
2)(0
.025
3)(0
.022
6)(B
orn
1961
-196
6)*
(HW
I)*
May
an(5
)-0
.012
80.
0154
-0.0
021
0.03
41-0
.001
20.
0376
(0.0
328)
(0.0
302)
(0.0
329)
(0.0
282)
(0.0
322)
(0.0
270)
(Bor
n19
67-1
977)
*(H
WI)
*M
ayan
(6)
0.00
12-0
.003
8-0
.002
90.
0094
-0.0
048
0.01
21(0
.033
5)(0
.032
3)(0
.034
7)(0
.030
9)(0
.034
9)(0
.030
0)O
bser
vati
ons
1,23
5,70
91,
391,
007
1,23
5,70
91,
391,
007
1,23
5,70
91,
391,
007
Adj
uste
dR
-Squ
ared
0.25
060.
3245
0.27
660.
3348
0.28
680.
3363
Data
Sourc
es:
2002
Nati
on
al
Pop
ula
tion
Cen
sus
(In
stit
uto
Naci
on
al
de
Est
ad
isti
ca(I
NE
),G
uate
mala
),R
ecover
yof
His
tori
cal
Mem
ory
Pro
ject
(1999),
an
dC
om
mis
sion
for
His
tori
cal
Cla
rifi
cati
on
(1999).
Rob
ust
stan
dard
erro
rsin
pare
nth
eses
are
clu
ster
edat
the
cou
nty
level
.*
sign
ifica
nt
at
10%
,**
sign
ifica
nt
at
5%
,***
sign
ifica
nt
at
1%
.T
he
sam
ple
incl
ud
esin
div
idu
als
born
bet
wee
n1950
an
d1977
wh
oh
ave
the
sam
ed
epart
men
tof
bir
than
dd
epart
men
tof
resi
den
ceat
the
tim
eof
the
cen
sus
in2002.
All
regre
ssio
ns
incl
ud
ein
dic
ato
rsfo
rlivin
gin
ah
igh
war
inte
nsi
tyd
epart
men
t,b
ein
ga
fem
ale
,livin
gin
aru
ral
are
a,
an
db
ein
ga
Mayan
as
wel
las
fixed
effec
tsfo
rd
epart
men
tof
resi
den
ce,
yea
rof
bir
th,
an
din
tera
ctio
ns
bet
wee
nyea
rof
bir
thin
dic
ato
rsan
dth
eavailab
ilit
yof
basi
cse
rvic
esin
ad
epart
men
tin
1973.
44
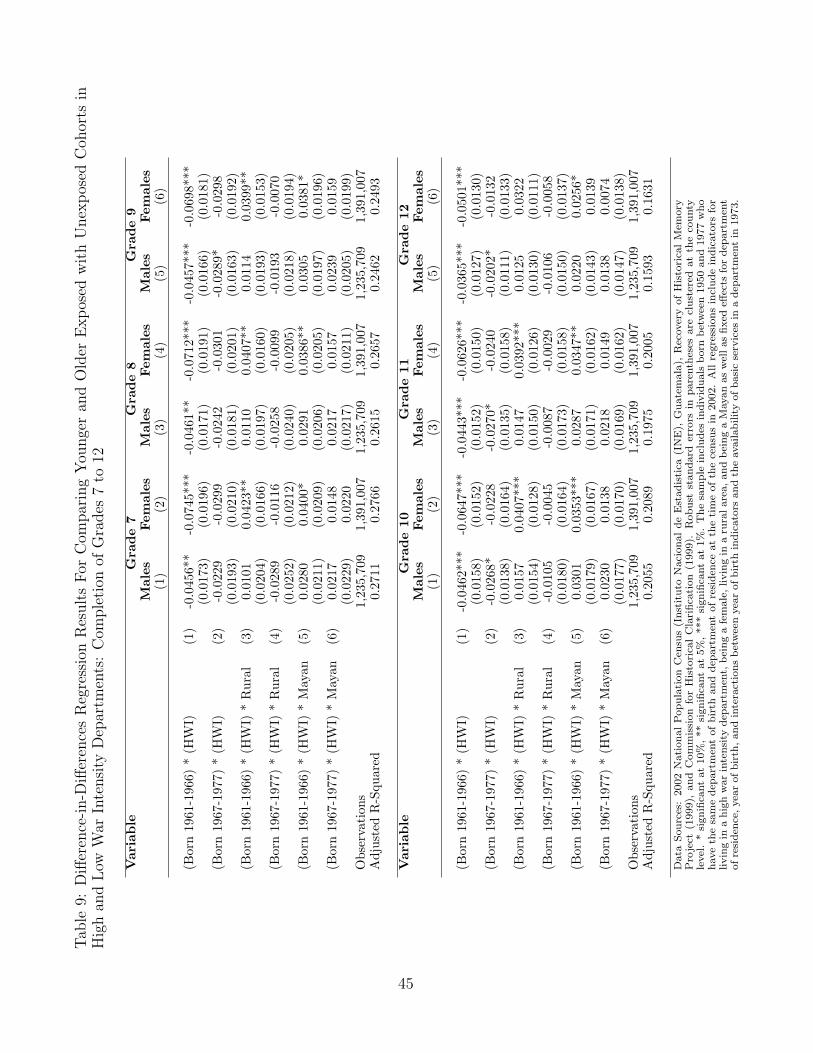
Tab
le9:
Diff
eren
ce-i
n-D
iffer
ence
sR
egre
ssio
nR
esult
sF
orC
ompar
ing
You
nge
ran
dO
lder
Exp
osed
wit
hU
nex
pos
edC
ohor
tsin
Hig
han
dL
owW
arIn
tensi
tyD
epar
tmen
ts:
Com
ple
tion
ofG
rades
7to
12
Var
iable
Gra
de
7G
rade
8G
rade
9M
ales
Fem
ales
Mal
esFem
ales
Mal
esFem
ales
(1)
(2)
(3)
(4)
(5)
(6)
(Bor
n19
61-1
966)
*(H
WI)
(1)
-0.0
456*
*-0
.074
5***
-0.0
461*
*-0
.071
2***
-0.0
457*
**-0
.069
8***
(0.0
173)
(0.0
196)
(0.0
171)
(0.0
191)
(0.0
166)
(0.0
181)
(Bor
n19
67-1
977)
*(H
WI)
(2)
-0.0
229
-0.0
299
-0.0
242
-0.0
301
-0.0
289*
-0.0
298
(0.0
193)
(0.0
210)
(0.0
181)
(0.0
201)
(0.0
163)
(0.0
192)
(Bor
n19
61-1
966)
*(H
WI)
*R
ural
(3)
0.01
010.
0423
**0.
0110
0.04
07**
0.01
140.
0399
**(0
.020
4)(0
.016
6)(0
.019
7)(0
.016
0)(0
.019
3)(0
.015
3)(B
orn
1967
-197
7)*
(HW
I)*
Rur
al(4
)-0
.028
9-0
.011
6-0
.025
8-0
.009
9-0
.019
3-0
.007
0(0
.025
2)(0
.021
2)(0
.024
0)(0
.020
5)(0
.021
8)(0
.019
4)(B
orn
1961
-196
6)*
(HW
I)*
May
an(5
)0.
0280
0.04
00*
0.02
910.
0386
**0.
0305
0.03
81*
(0.0
211)
(0.0
209)
(0.0
206)
(0.0
205)
(0.0
197)
(0.0
196)
(Bor
n19
67-1
977)
*(H
WI)
*M
ayan
(6)
0.02
170.
0148
0.02
170.
0157
0.02
390.
0159
(0.0
229)
0.02
20(0
.021
7)(0
.021
1)(0
.020
5)(0
.019
9)O
bser
vati
ons
1,23
5,70
91,
391,
007
1,23
5,70
91,
391,
007
1,23
5,70
91,
391,
007
Adj
uste
dR
-Squ
ared
0.27
110.
2766
0.26
150.
2657
0.24
620.
2493
Var
iable
Gra
de
10G
rade
11G
rade
12M
ales
Fem
ales
Mal
esFem
ales
Mal
esFem
ales
(1)
(2)
(3)
(4)
(5)
(6)
(Bor
n19
61-1
966)
*(H
WI)
(1)
-0.0
462*
**-0
.064
7***
-0.0
443*
**-0
.062
6***
-0.0
365*
**-0
.050
1***
(0.0
158)
(0.0
152)
(0.0
152)
(0.0
150)
(0.0
127)
(0.0
130)
(Bor
n19
67-1
977)
*(H
WI)
(2)
-0.0
268*
-0.0
228
-0.0
270*
-0.0
240
-0.0
202*
-0.0
132
(0.0
138)
(0.0
164)
(0.0
135)
(0.0
158)
(0.0
111)
(0.0
133)
(Bor
n19
61-1
966)
*(H
WI)
*R
ural
(3)
0.01
570.
0407
***
0.01
470.
0392
***
0.01
250.
0322
(0.0
154)
(0.0
128)
(0.0
150)
(0.0
126)
(0.0
130)
(0.0
111)
(Bor
n19
67-1
977)
*(H
WI)
*R
ural
(4)
-0.0
105
-0.0
045
-0.0
087
-0.0
029
-0.0
106
-0.0
058
(0.0
180)
(0.0
164)
(0.0
173)
(0.0
158)
(0.0
150)
(0.0
137)
(Bor
n19
61-1
966)
*(H
WI)
*M
ayan
(5)
0.03
010.
0353
***
0.02
870.
0347
**0.
0220
0.02
56*
(0.0
179)
(0.0
167)
(0.0
171)
(0.0
162)
(0.0
143)
0.01
39(B
orn
1967
-197
7)*
(HW
I)*
May
an(6
)0.
0230
0.01
380.
0218
0.01
490.
0138
0.00
74(0
.017
7)(0
.017
0)(0
.016
9)(0
.016
2)(0
.014
7)(0
.013
8)O
bser
vati
ons
1,23
5,70
91,
391,
007
1,23
5,70
91,
391,
007
1,23
5,70
91,
391,
007
Adj
uste
dR
-Squ
ared
0.20
550.
2089
0.19
750.
2005
0.15
930.
1631
Data
Sourc
es:
2002
Nati
on
al
Pop
ula
tion
Cen
sus
(In
stit
uto
Naci
on
al
de
Est
ad
isti
ca(I
NE
),G
uate
mala
),R
ecover
yof
His
tori
cal
Mem
ory
Pro
ject
(1999),
an
dC
om
mis
sion
for
His
tori
cal
Cla
rifi
cati
on
(1999).
Rob
ust
stan
dard
erro
rsin
pare
nth
eses
are
clu
ster
edat
the
cou
nty
level
.*
sign
ifica
nt
at
10%
,**
sign
ifica
nt
at
5%
,***
sign
ifica
nt
at
1%
.T
he
sam
ple
incl
ud
esin
div
idu
als
born
bet
wee
n1950
an
d1977
wh
oh
ave
the
sam
ed
epart
men
tof
bir
than
dd
epart
men
tof
resi
den
ceat
the
tim
eof
the
cen
sus
in2002.
All
regre
ssio
ns
incl
ud
ein
dic
ato
rsfo
rlivin
gin
ah
igh
war
inte
nsi
tyd
epart
men
t,b
ein
ga
fem
ale
,livin
gin
aru
ral
are
a,
an
db
ein
ga
Mayan
as
wel
las
fixed
effec
tsfo
rd
epart
men
tof
resi
den
ce,
yea
rof
bir
th,
an
din
tera
ctio
ns
bet
wee
nyea
rof
bir
thin
dic
ato
rsan
dth
eavailab
ilit
yof
basi
cse
rvic
esin
ad
epart
men
tin
1973.
45
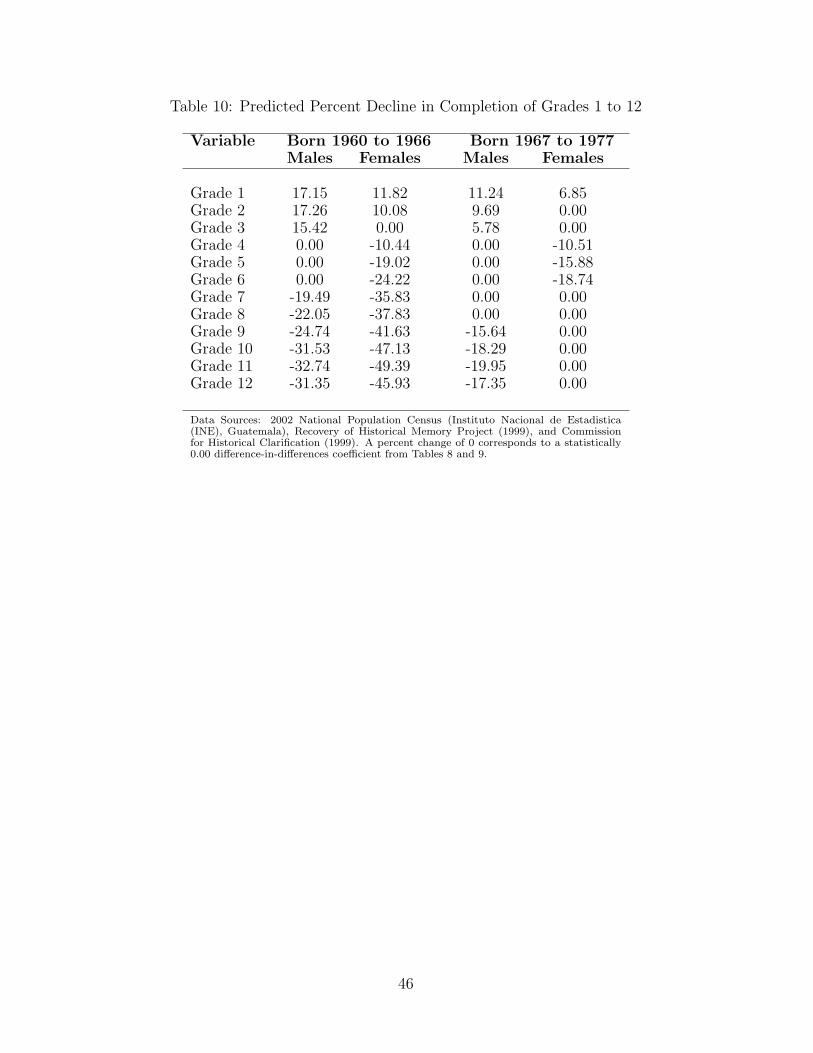
Table 10: Predicted Percent Decline in Completion of Grades 1 to 12
Variable Born 1960 to 1966 Born 1967 to 1977Males Females Males Females
Grade 1 17.15 11.82 11.24 6.85Grade 2 17.26 10.08 9.69 0.00Grade 3 15.42 0.00 5.78 0.00Grade 4 0.00 -10.44 0.00 -10.51Grade 5 0.00 -19.02 0.00 -15.88Grade 6 0.00 -24.22 0.00 -18.74Grade 7 -19.49 -35.83 0.00 0.00Grade 8 -22.05 -37.83 0.00 0.00Grade 9 -24.74 -41.63 -15.64 0.00Grade 10 -31.53 -47.13 -18.29 0.00Grade 11 -32.74 -49.39 -19.95 0.00Grade 12 -31.35 -45.93 -17.35 0.00
Data Sources: 2002 National Population Census (Instituto Nacional de Estadistica(INE), Guatemala), Recovery of Historical Memory Project (1999), and Commissionfor Historical Clarification (1999). A percent change of 0 corresponds to a statistically0.00 difference-in-differences coefficient from Tables 8 and 9.
46
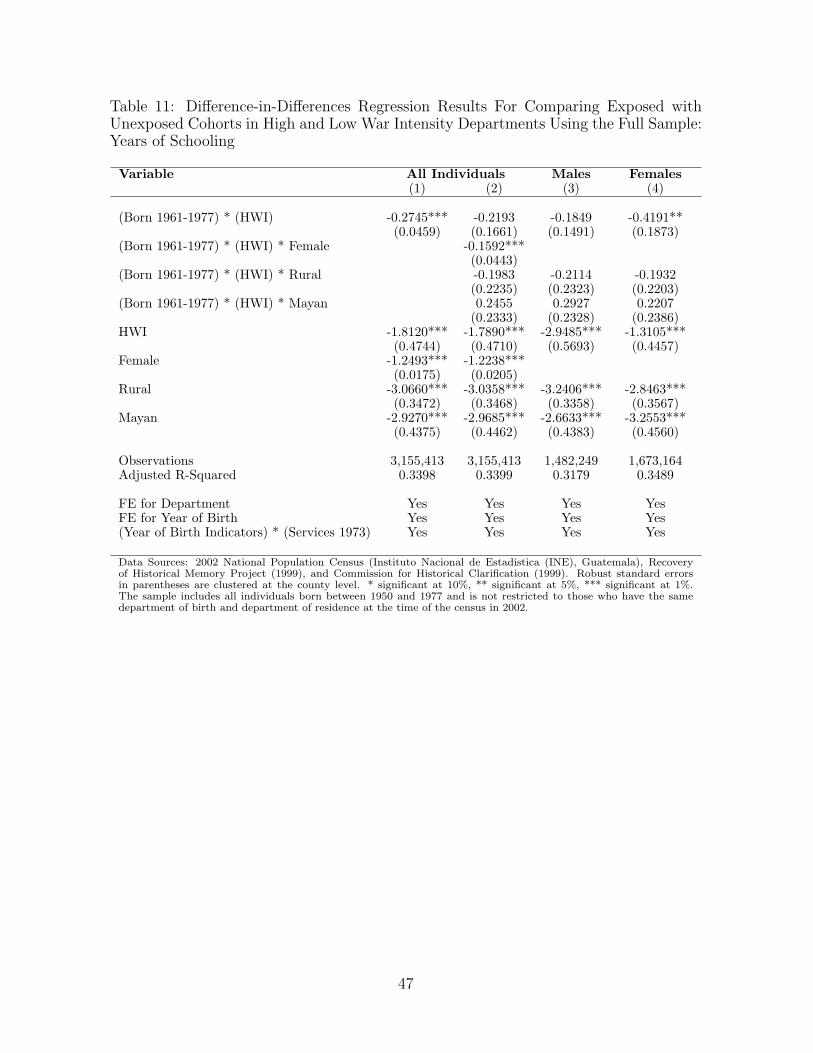
Table 11: Difference-in-Differences Regression Results For Comparing Exposed withUnexposed Cohorts in High and Low War Intensity Departments Using the Full Sample:Years of Schooling
Variable All Individuals Males Females(1) (2) (3) (4)
(Born 1961-1977) * (HWI) -0.2745*** -0.2193 -0.1849 -0.4191**(0.0459) (0.1661) (0.1491) (0.1873)
(Born 1961-1977) * (HWI) * Female -0.1592***(0.0443)
(Born 1961-1977) * (HWI) * Rural -0.1983 -0.2114 -0.1932(0.2235) (0.2323) (0.2203)
(Born 1961-1977) * (HWI) * Mayan 0.2455 0.2927 0.2207(0.2333) (0.2328) (0.2386)
HWI -1.8120*** -1.7890*** -2.9485*** -1.3105***(0.4744) (0.4710) (0.5693) (0.4457)
Female -1.2493*** -1.2238***(0.0175) (0.0205)
Rural -3.0660*** -3.0358*** -3.2406*** -2.8463***(0.3472) (0.3468) (0.3358) (0.3567)
Mayan -2.9270*** -2.9685*** -2.6633*** -3.2553***(0.4375) (0.4462) (0.4383) (0.4560)
Observations 3,155,413 3,155,413 1,482,249 1,673,164Adjusted R-Squared 0.3398 0.3399 0.3179 0.3489
FE for Department Yes Yes Yes YesFE for Year of Birth Yes Yes Yes Yes(Year of Birth Indicators) * (Services 1973) Yes Yes Yes Yes
Data Sources: 2002 National Population Census (Instituto Nacional de Estadistica (INE), Guatemala), Recoveryof Historical Memory Project (1999), and Commission for Historical Clarification (1999). Robust standard errorsin parentheses are clustered at the county level. * significant at 10%, ** significant at 5%, *** significant at 1%.The sample includes all individuals born between 1950 and 1977 and is not restricted to those who have the samedepartment of birth and department of residence at the time of the census in 2002.
47
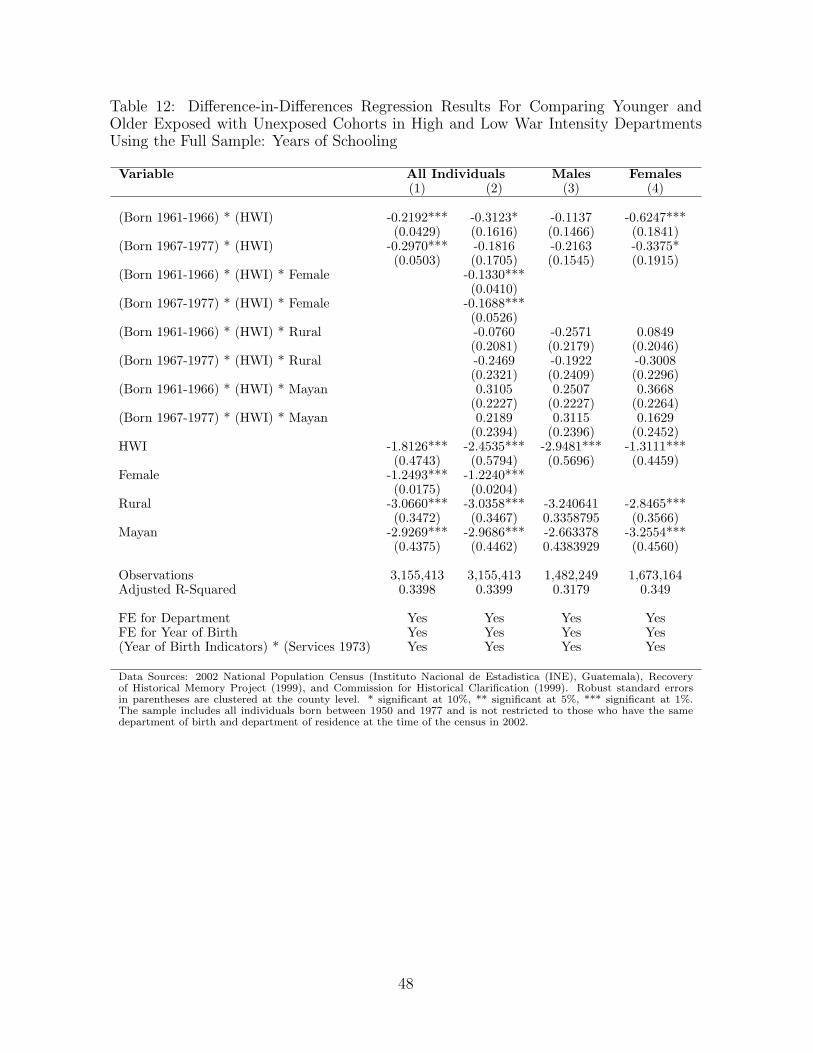
Table 12: Difference-in-Differences Regression Results For Comparing Younger andOlder Exposed with Unexposed Cohorts in High and Low War Intensity DepartmentsUsing the Full Sample: Years of Schooling
Variable All Individuals Males Females(1) (2) (3) (4)
(Born 1961-1966) * (HWI) -0.2192*** -0.3123* -0.1137 -0.6247***(0.0429) (0.1616) (0.1466) (0.1841)
(Born 1967-1977) * (HWI) -0.2970*** -0.1816 -0.2163 -0.3375*(0.0503) (0.1705) (0.1545) (0.1915)
(Born 1961-1966) * (HWI) * Female -0.1330***(0.0410)
(Born 1967-1977) * (HWI) * Female -0.1688***(0.0526)
(Born 1961-1966) * (HWI) * Rural -0.0760 -0.2571 0.0849(0.2081) (0.2179) (0.2046)
(Born 1967-1977) * (HWI) * Rural -0.2469 -0.1922 -0.3008(0.2321) (0.2409) (0.2296)
(Born 1961-1966) * (HWI) * Mayan 0.3105 0.2507 0.3668(0.2227) (0.2227) (0.2264)
(Born 1967-1977) * (HWI) * Mayan 0.2189 0.3115 0.1629(0.2394) (0.2396) (0.2452)
HWI -1.8126*** -2.4535*** -2.9481*** -1.3111***(0.4743) (0.5794) (0.5696) (0.4459)
Female -1.2493*** -1.2240***(0.0175) (0.0204)
Rural -3.0660*** -3.0358*** -3.240641 -2.8465***(0.3472) (0.3467) 0.3358795 (0.3566)
Mayan -2.9269*** -2.9686*** -2.663378 -3.2554***(0.4375) (0.4462) 0.4383929 (0.4560)
Observations 3,155,413 3,155,413 1,482,249 1,673,164Adjusted R-Squared 0.3398 0.3399 0.3179 0.349
FE for Department Yes Yes Yes YesFE for Year of Birth Yes Yes Yes Yes(Year of Birth Indicators) * (Services 1973) Yes Yes Yes Yes
Data Sources: 2002 National Population Census (Instituto Nacional de Estadistica (INE), Guatemala), Recoveryof Historical Memory Project (1999), and Commission for Historical Clarification (1999). Robust standard errorsin parentheses are clustered at the county level. * significant at 10%, ** significant at 5%, *** significant at 1%.The sample includes all individuals born between 1950 and 1977 and is not restricted to those who have the samedepartment of birth and department of residence at the time of the census in 2002.
48
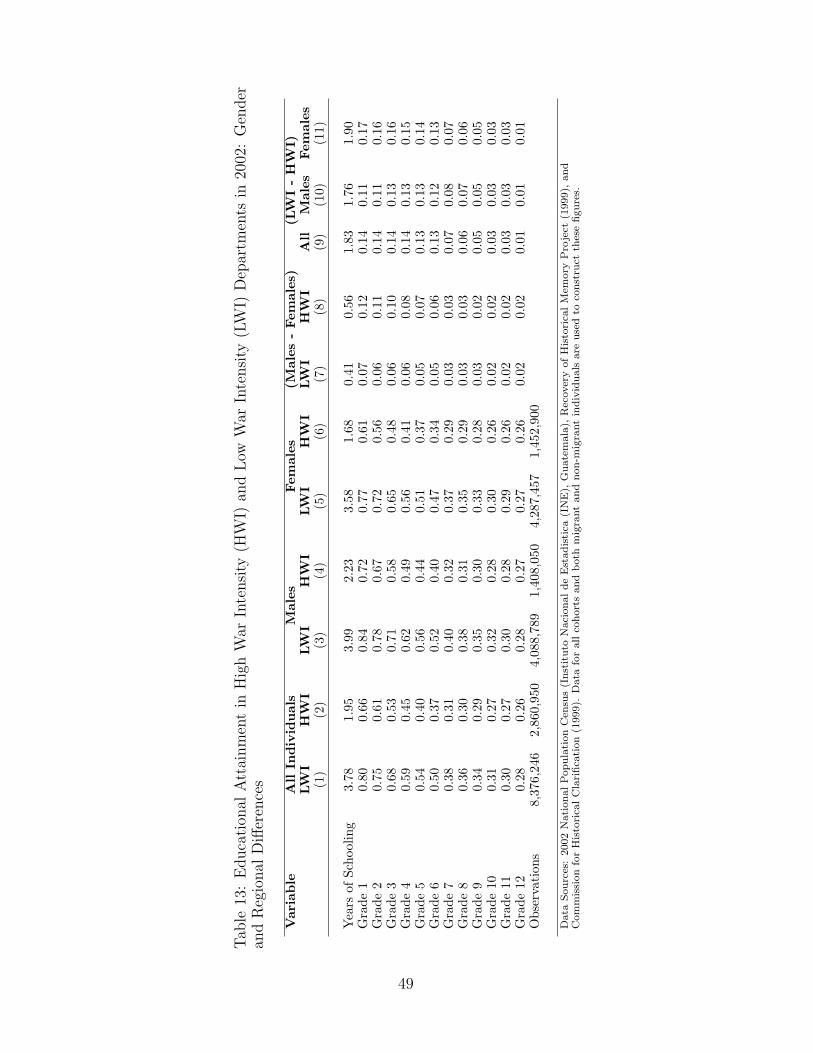
Tab
le13
:E
duca
tion
alA
ttai
nm
ent
inH
igh
War
Inte
nsi
ty(H
WI)
and
Low
War
Inte
nsi
ty(L
WI)
Dep
artm
ents
in20
02:
Gen
der
and
Reg
ional
Diff
eren
ces
Var
iable
All
Indiv
idual
sM
ales
Fem
ales
(Mal
es-
Fem
ales
)(L
WI
-H
WI)
LWI
HW
ILW
IH
WI
LWI
HW
ILW
IH
WI
All
Mal
esFem
ales
(1)
(2)
(3)
(4)
(5)
(6)
(7)
(8)
(9)
(10)
(11)
Yea
rsof
Scho
olin
g3.
781.
953.
992.
233.
581.
680.
410.
561.
831.
761.
90G
rade
10.
800.
660.
840.
720.
770.
610.
070.
120.
140.
110.
17G
rade
20.
750.
610.
780.
670.
720.
560.
060.
110.
140.
110.
16G
rade
30.
680.
530.
710.
580.
650.
480.
060.
100.
140.
130.
16G
rade
40.
590.
450.
620.
490.
560.
410.
060.
080.
140.
130.
15G
rade
50.
540.
400.
560.
440.
510.
370.
050.
070.
130.
130.
14G
rade
60.
500.
370.
520.
400.
470.
340.
050.
060.
130.
120.
13G
rade
70.
380.
310.
400.
320.
370.
290.
030.
030.
070.
080.
07G
rade
80.
360.
300.
380.
310.
350.
290.
030.
030.
060.
070.
06G
rade
90.
340.
290.
350.
300.
330.
280.
030.
020.
050.
050.
05G
rade
100.
310.
270.
320.
280.
300.
260.
020.
020.
030.
030.
03G
rade
110.
300.
270.
300.
280.
290.
260.
020.
020.
030.
030.
03G
rade
120.
280.
260.
280.
270.
270.
260.
020.
020.
010.
010.
01O
bser
vati
ons
8,37
6,24
62,
860,
950
4,08
8,78
91,
408,
050
4,28
7,45
71,
452,
900
Data
Sou
rces
:2002
Nati
on
al
Pop
ula
tion
Cen
sus
(In
stit
uto
Naci
on
al
de
Est
ad
isti
ca(I
NE
),G
uate
mala
),R
ecover
yof
His
tori
cal
Mem
ory
Pro
ject
(1999),
an
dC
om
mis
sion
for
His
tori
cal
Cla
rifi
cati
on
(1999).
Data
for
all
coh
ort
san
db
oth
mig
rant
an
dn
on
-mig
rant
ind
ivid
uals
are
use
dto
con
stru
ctth
ese
figu
res.
49