the hollow perpetuation promise - marshberry · organic growth study: now open ... counterpoint...
TRANSCRIPT

n Don’t Let TAXES DRIVE
How You Run Your Businessn Talent, Culture, and
TECHNOLOGYn The Tax Man
COMES CALLINGn Driving New BUSINESSn Broker TEAR SHEET
D e c e m b e r| 2 0 1 6J a n u a r y| 2 0 1 7
www.MarshBerry.com
helping clients learn, improve and realize their value
Are you willing to fight to make the promise of internal perpetuation a reality?
The Hollow Perpetuation Promise

n PG. 4 The Hollow Perpetuation Promise
n PG. 6 Metric of the Month • Driving New Business
n PG. 11 Don’t Let Taxes Drive How You Run Your Business
n PG. 12 Talent, Culture, and Technology
n PG. 14 The Tax Man Comes Calling
n PG. 16 Quarter in Review Q&A
n PG. 17 The Broker Tear Sheet
n PG. 20 On the Horizon
TABLE OF CONTENTS
CONTRIBUTING AUTHORSMEGAN BOSMA, Senior Vice President
COURTNEY FERRARA, Senior Consultant
CHRISTINA MORAN, Business Unit Manager
JUSTIN NOCKENGUST, Financial Analyst
SWAR PATEL, Data Analyst
WAYNE WALKOTTEN, Executive Vice President
JOHN WEPLER, Chairman & CEO
Let’s talk.
Engage with MarshBerry
28601 Chagrin Blvd., Ste. 400, Woodmere, OH 44122
www.marshberry.com
@marshberryinc
facebook.com/MarshBerry
linkedin.com/company/marshberry
December/January Spotlight
The MarshBerry 2017 Organic Growth Study: NOW OPENMarshBerry’s 2017 Organic Growth Survey is now open. By participating in the survey by February 10, 2017, you’ll receive one complimentary download of the report in early summer of 2017.The study, which only takes 30 minutes to complete, compiles anonymous general agency information — as well as employee and production data. Data will be aggregated, analyzed, and distilled into the 2017 MarshBerry Organic Growth Trends report.
The final report will provide an overview and highlight key trends in organic growth strategies for insurance agencies. As a participant in the study, you will receive one complimentary download of the report*.
Survey responses should come from one of the following: CEO/President, CFO, Sales Executive/Manager, or Head of Sales.
To take the study today, log on to www.MarshBerry.com/2017Growth.*Only fully completed survey responses, and those who provide their email address, are eligible for one complimentary PDF copy of the MarshBerry 2016 Insurance Agency Organic Growth Trends report. Partial completes are not guaranteed to receive a complimentary report.
4 December 2016 • January 2017 | CounterPoint
Securities offered through MarshBerry Capital, Inc., Member FINRA and SIPC, and an affiliate of Marsh, Berry & Company, Inc. 28601 Chagrin Blvd., Suite 400, Woodmere, Ohio 44122 •440.354.3230
Are you willing to fight to make the promise of internal perpetuation a reality?
by John Wepler, Chairman & CEO440.392.6572 | [email protected]
The Hollow Perpetuation Promise
5CounterPoint | December 2016 • January 2017
According to MarshBerry’s proprietary database, and other publicly available databases, more than 3,000 insurance agencies have sold over the past ten years. MarshBerry advised on more than 400 of these deals, or an average of three per month.
Given our experience, we believe that we know better than anyone why agency owners choose to sell. While some of the continued consolidation reflects those taking advantage of opportunity or those suffering despair, many times consolidation can be blamed on leadership throwing in the towel given an awareness that perpetuation is not possible. Despite the fact that private ownership is often promoted to the community, insurance companies, personnel and the public, we believe that over 75% of insurance agencies will likely not perpetuate internally. Many agency owners have daydreamed about passing the torch to the next generation, but they have not made the necessary preparations to make independence possible. A sale may force you to come face to face with “The Hollow Perpetuation Promise.” The day you told the world that you did something you promised you would never do; sell to a third party.
Following are areas of focus that we believe will help those that want to fight to make internal perpetuation a reality.
Recruiting to replace talentToo many agency owners perceive perpetuation as a single transaction.
Perpetuation should be viewed as a continuous process with neither a beginning nor an end. Without question, the most important ingredient in the process is the people. To maintain the right people, an agency must be committed to continuously reinvesting in the staff. Create, implement and reinforce a reinvestment culture in your organization.
Reinvestment should not be taken lightly, given the hiring results produced by the average agency. According to MarshBerry’s proprietary financial management system, Perspectives for High Performance (“PHP”), of the producers hired by our clients during 2004, only 20% remained during the year 2014. Even fewer demonstrated performance that justified an ownership interest. Of the 20% that remained employed after ten years, less than 1/5 became owners. In other words, only 3.3% of the producers hired in 2004 actually became owners over a ten-year period. If your success is twice as good as the average, it still is not good enough. We believe that agency owners need to implement a process-driven, recruiting, onboarding, training, mentoring and accountability system that results in a 50% success ratio, at a minimum, if you have any hope of developing a staff capable of making a market for retiring principals.
To properly develop a staff capable of supporting a perpetuation process, it is important to continuously evaluate the importance and age of each staff member. Recruiting should be tailored to replace talent and key relationships long before a transfer of ownership takes place. Furthermore, there should be a concerted effort to stagger the ages of shareholders to help prevent the agency from being saddled with too much debt when a buy-out does occur.
Producer retention through ownershipWe are seeing that locating, attracting, hiring and developing quality producers is the most difficult challenge facing the industry.
Perhaps the second largest hurdle is developing a process that will weed out nonperformers and provide enough incentive to retain those who do perform. Agencies that have built a culture around clearly defined expectations, holding employees accountable, rewarding performance and communicating criteria that warrants ownership tend to attract people with drive and entrepreneurial spirit. Compared with other agencies, we see that these agencies typically have better success in locating, attracting and retaining quality.
If constructed with the proper foresight, staff incentives can help perpetuation candidates accumulate financial capacity to assist in perpetuation. The opportunity to earn ownership may also encourage quality employees to remain at the agency. An effective incentive system also should include financial disincentives to prompt nonperformers to look elsewhere for work.
Many agency owners feel that producers can be recruited and retained without providing an ownership incentive. We have seen that rewarding performance through commission
Securities offered though MarshBerry Capital, Inc., Member FINRA and SIPC, and an affiliate of Marsh, Berry & Co., Inc. 28601 Chagrin Blvd., Suite 400, Woodmere, Ohio 44122, 440-354-3230
6 December 2016 • January 2017 | CounterPoint
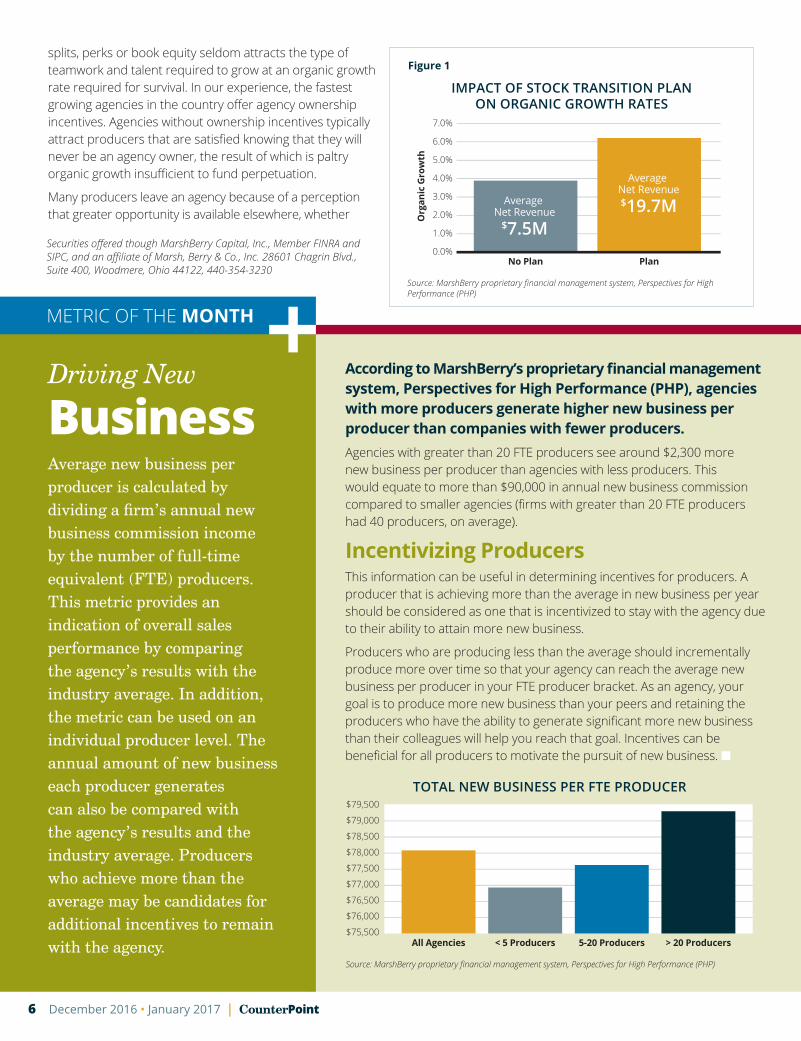
splits, perks or book equity seldom attracts the type of teamwork and talent required to grow at an organic growth rate required for survival. In our experience, the fastest growing agencies in the country offer agency ownership incentives. Agencies without ownership incentives typically attract producers that are satisfied knowing that they will never be an agency owner, the result of which is paltry organic growth insufficient to fund perpetuation.
Many producers leave an agency because of a perception that greater opportunity is available elsewhere, whether
Driving New
Business Average new business per producer is calculated by dividing a firm’s annual new business commission income by the number of full-time equivalent (FTE) producers. This metric provides an indication of overall sales performance by comparing the agency’s results with the industry average. In addition, the metric can be used on an individual producer level. The annual amount of new business each producer generates can also be compared with the agency’s results and the industry average. Producers who achieve more than the average may be candidates for additional incentives to remain with the agency.
According to MarshBerry’s proprietary financial management system, Perspectives for High Performance (PHP), agencies with more producers generate higher new business per producer than companies with fewer producers. Agencies with greater than 20 FTE producers see around $2,300 more new business per producer than agencies with less producers. This would equate to more than $90,000 in annual new business commission compared to smaller agencies (firms with greater than 20 FTE producers had 40 producers, on average).
Incentivizing ProducersThis information can be useful in determining incentives for producers. A producer that is achieving more than the average in new business per year should be considered as one that is incentivized to stay with the agency due to their ability to attain more new business.
Producers who are producing less than the average should incrementally produce more over time so that your agency can reach the average new business per producer in your FTE producer bracket. As an agency, your goal is to produce more new business than your peers and retaining the producers who have the ability to generate significant more new business than their colleagues will help you reach that goal. Incentives can be beneficial for all producers to motivate the pursuit of new business. n
METRIC OF THE MONTH
TOTAL NEW BUSINESS PER FTE PRODUCER
Source: MarshBerry proprietary financial management system, Perspectives for High Performance (PHP)
Source: MarshBerry proprietary financial management system, Perspectives for High Performance (PHP)
Figure 1
IMPACT OF STOCK TRANSITION PLAN ON ORGANIC GROWTH RATES
Securities offered though MarshBerry Capital, Inc., Member FINRA and SIPC, and an affiliate of Marsh, Berry & Co., Inc. 28601 Chagrin Blvd., Suite 400, Woodmere, Ohio 44122, 440-354-3230
7CounterPoint | December 2016 • January 2017
that opportunity is money, resources or ownership. Producers in agencies that do not believe in sharing ownership, often lobby for higher commission splits because they attach security to their compensation as no retirement asset is being built through agency ownership. We have seen that producers in such a situation also tend to have inflated lifestyles to make them feel more comfortable calling on clients and prospects that do own a business. In general, producers justifiably have little confidence that owners will eventually broaden ownership. In many agencies, ownership is stuck in a perpetual filibuster where promises made are not kept. We believe that agency owners should clearly define the criteria and process to become an owner in order to prevent resentment and loss of perpetuation talent.
Remove barriers to cash flowNext to people, in our opinion, the most important component to perpetuation is building a cash flow plan.
Available cash flow must exceed the debt service associated with purchasing a retiring shareholder’s interest. As the debt to a shareholder is retired, the agency needs to remain in trust, continue reinvesting in the staff, cover existing expenses and retire any other debt on the books.
To maximize cash flow, an agency should detect and eliminate any current practices that restrict cash flow. Common examples are inflated producer compensation, misaligned roles and responsibilities, non-performing producers not held accountable, an unproductive staff and creeping expense ratios generated by a lack of growth. When it comes to productivity, make a simple calculation. Take your revenue and divide by $200,000. In our opinion, if the resulting number is less than your current staff, you have too many people. You are probably past due on trimming the rose bush so that it may bloom again.
Relinquish stock graduallyPerpetuation requires an orderly transfer of stock over time. Slowly reducing the ownership interest of the
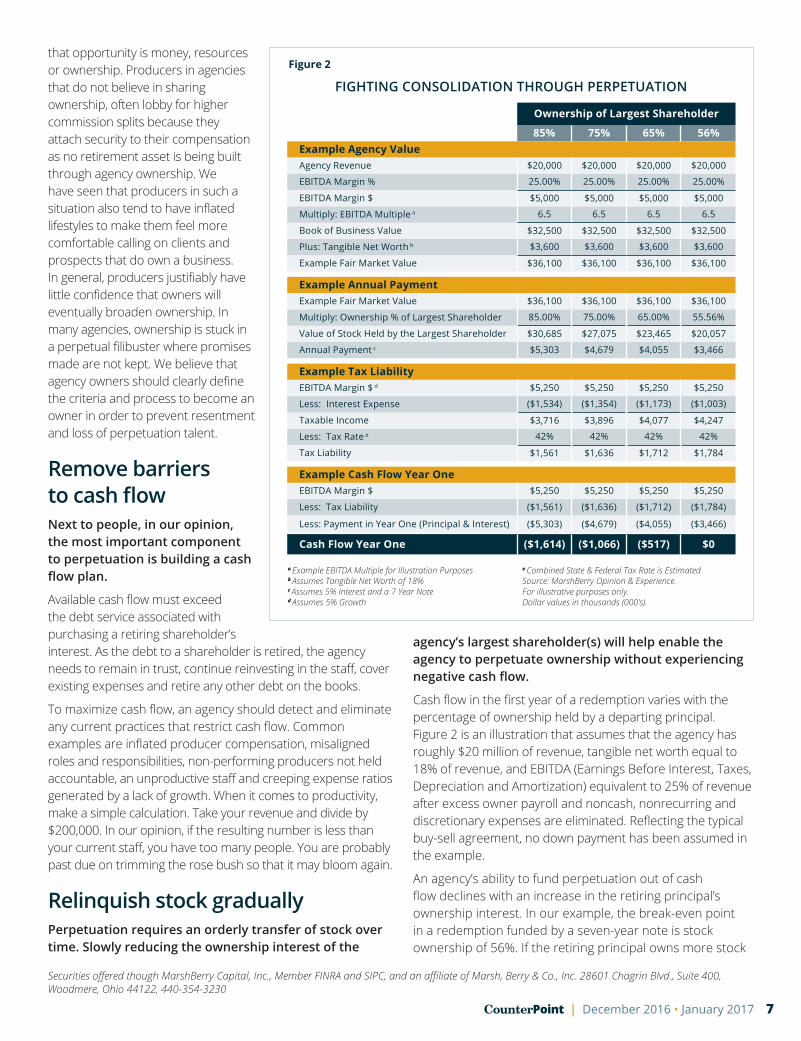
Figure 2
a Example EBITDA Multiple for Illustration Purposesb Assumes Tangible Net Worth of 18%c Assumes 5% Interest and a 7 Year Noted Assumes 5% Growth
e Combined State & Federal Tax Rate is Estimated Source: MarshBerry Opinion & Experience. For illustrative purposes only. Dollar values in thousands (000’s).
FIGHTING CONSOLIDATION THROUGH PERPETUATION
Ownership of Largest Shareholder
85% 75% 65% 56%Example Agency ValueAgency Revenue $20,000 $20,000 $20,000 $20,000
EBITDA Margin % 25.00% 25.00% 25.00% 25.00%
EBITDA Margin $ $5,000 $5,000 $5,000 $5,000
Multiply: EBITDA Multiple a 6.5 6.5 6.5 6.5
Book of Business Value $32,500 $32,500 $32,500 $32,500
Plus: Tangible Net Worth b $3,600 $3,600 $3,600 $3,600
Example Fair Market Value $36,100 $36,100 $36,100 $36,100
Example Annual PaymentExample Fair Market Value $36,100 $36,100 $36,100 $36,100
Multiply: Ownership % of Largest Shareholder 85.00% 75.00% 65.00% 55.56%
Value of Stock Held by the Largest Shareholder $30,685 $27,075 $23,465 $20,057
Annual Payment c $5,303 $4,679 $4,055 $3,466
Example Tax LiabilityEBITDA Margin $ d $5,250 $5,250 $5,250 $5,250
Less: Interest Expense ($1,534) ($1,354) ($1,173) ($1,003)
Taxable Income $3,716 $3,896 $4,077 $4,247
Less: Tax Rate e 42% 42% 42% 42%
Tax Liability $1,561 $1,636 $1,712 $1,784
Example Cash Flow Year OneEBITDA Margin $ $5,250 $5,250 $5,250 $5,250
Less: Tax Liability ($1,561) ($1,636) ($1,712) ($1,784)
Less: Payment in Year One (Principal & Interest) ($5,303) ($4,679) ($4,055) ($3,466)
Cash Flow Year One ($1,614) ($1,066) ($517) $0
agency’s largest shareholder(s) will help enable the agency to perpetuate ownership without experiencing negative cash flow.
Cash flow in the first year of a redemption varies with the percentage of ownership held by a departing principal. Figure 2 is an illustration that assumes that the agency has roughly $20 million of revenue, tangible net worth equal to 18% of revenue, and EBITDA (Earnings Before Interest, Taxes, Depreciation and Amortization) equivalent to 25% of revenue after excess owner payroll and noncash, nonrecurring and discretionary expenses are eliminated. Reflecting the typical buy-sell agreement, no down payment has been assumed in the example.
An agency’s ability to fund perpetuation out of cash flow declines with an increase in the retiring principal’s ownership interest. In our example, the break-even point in a redemption funded by a seven-year note is stock ownership of 56%. If the retiring principal owns more stock
Securities offered though MarshBerry Capital, Inc., Member FINRA and SIPC, and an affiliate of Marsh, Berry & Co., Inc. 28601 Chagrin Blvd., Suite 400, Woodmere, Ohio 44122, 440-354-3230
8 December 2016 • January 2017 | CounterPoint
than that, the agency cannot purchase the shares without experiencing negative cash flow in the first year. As a selling principal, would you be willing to hold a note or sign personally for the purchase of your shares if the transaction produces a cash deficit on the agency? If an agency does not accept orderly transition of shares, is there still hope for perpetuation? Yes, but only if the principals of the agency are willing to accept the risk associated with a long-term payout, when in the current insurance M&A market, buyers are paying some of the highest multiples we have seen in the history of the industry.
Despite the above, many principals resist gradually transferring ownership. Most feel it will reduce their proceeds at the time of retirement or a sale to an outsider. In our opinion, that concept is flawed, even if an owner intends to eventually sell rather than perpetuate. We have seen that agencies with the highest market value typically have ownership spread among a large group of high-performing individuals. Adopting a culture founded on a willingness to broaden ownership helps enable an agency to attract and retain quality employees and producers, which helps to preserve and build agency value. Moreover, in our experience, when the majority of an agency’s producers are owners, a buyer will have more faith in the strength of the agency’s non-compete and non-piracy covenants, will perceive less risk associated with the transaction and will increase value accordingly.
Producer Stock Incentive PlanOne example of an ownership plan that can advance the ball culturally regarding perpetuation is a Producer Stock Incentive Plan (PSIP).
Such a plan is not a comprehensive solution for perpetuation. But, it can help attract and retain talent and help turn producers into leaders. Perpetuation candidates with leadership capabilities are made, not born. Good producers have egos, are often self-centered, have a short attention span and seldom understand the big picture without proper guidance and leadership training. To help producers develop leadership attributes and work toward becoming shareholders, agency owners should implement a process to track and communicate each producer’s progress relative to stated objective and subjective criteria on a quarterly basis. In our experience, the best plans also include a mechanism
Adopting a culture founded on a willingness to broaden ownership helps enable an agency to attract and retain quality employees and producers, which helps to preserve and build agency value.
PSIP Plan Overviewn Stock bonus: 30% of the value of the book in excess
of 15% net growth n Bonus shares subject to a five-year vestingn Producer responsible for the taxes associated with
the stock bonusn Prerequisite to stock bonus–purchase equivalent
number of shares from treasury at appraised valuen Agency to hold five-year note for the purchase of
shares from treasuryn Unvested bonus shares to be held as collateral and
released as debt is retiredn To be eligible, producer must attain a set of objective
and subjective performance criteria.
Example Objective Criteria (This list is not exhaustive)n 3+ years’ experience in industryn 3+ years’ experience with agencyn Individually develop commission book of $500,000n Net new business production goal of 15% during
prior yearn Attainment of cross-referral goals during the
prior yearn At least one professional industry designationn Involved in at least two community organizationsn Signed agreement with non-solicitation languagen Satisfy employee survey of leadership/
management skillsn Achieve aged receivables minimum target during
the year
Example Subjective Criteria (This list is not exhaustive)n Ability to communicate with others in agencyn Skills include new business, account handling,
management, leadershipn Committed to the future of the industryn Self-starter regularly demonstrating initiativen Personal confidencen Willingness to delegate and annually trade down
bottom 20% of accounts to housen Opinion of agency principalsn Positive attituden Demonstrated willingness to mentor young
producersn Field underwriting that demonstrates diligence
and integrity
Source: MarshBerry Opinion & Experience. The above example is for illustrative purposes only.
Securities offered though MarshBerry Capital, Inc., Member FINRA and SIPC, and an affiliate of Marsh, Berry & Co., Inc. 28601 Chagrin Blvd., Suite 400, Woodmere, Ohio 44122, 440-354-3230
9CounterPoint | December 2016 • January 2017
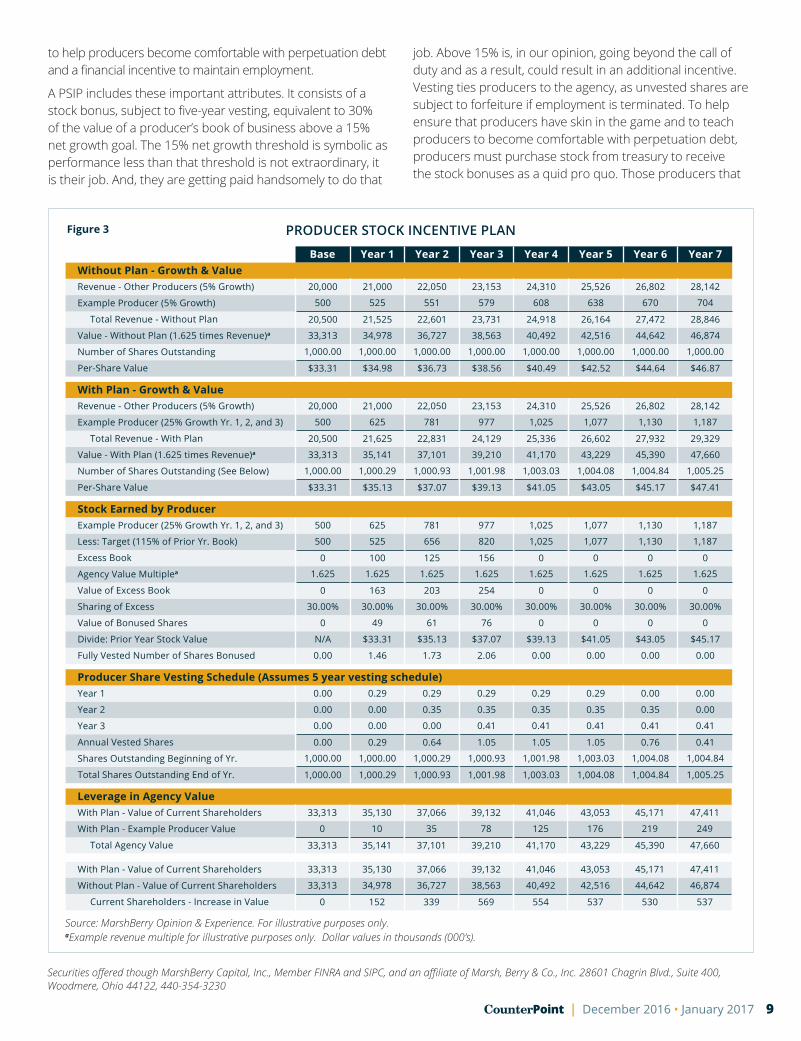
Figure 3
Source: MarshBerry Opinion & Experience. For illustrative purposes only.aExample revenue multiple for illustrative purposes only. Dollar values in thousands (000’s).
PRODUCER STOCK INCENTIVE PLAN
Base Year 1 Year 2 Year 3 Year 4 Year 5 Year 6 Year 7Without Plan - Growth & ValueRevenue - Other Producers (5% Growth) 20,000 21,000 22,050 23,153 24,310 25,526 26,802 28,142
Example Producer (5% Growth) 500 525 551 579 608 638 670 704
Total Revenue - Without Plan 20,500 21,525 22,601 23,731 24,918 26,164 27,472 28,846
Value - Without Plan (1.625 times Revenue)a 33,313 34,978 36,727 38,563 40,492 42,516 44,642 46,874
Number of Shares Outstanding 1,000.00 1,000.00 1,000.00 1,000.00 1,000.00 1,000.00 1,000.00 1,000.00
Per-Share Value $33.31 $34.98 $36.73 $38.56 $40.49 $42.52 $44.64 $46.87
With Plan - Growth & ValueRevenue - Other Producers (5% Growth) 20,000 21,000 22,050 23,153 24,310 25,526 26,802 28,142
Example Producer (25% Growth Yr. 1, 2, and 3) 500 625 781 977 1,025 1,077 1,130 1,187
Total Revenue - With Plan 20,500 21,625 22,831 24,129 25,336 26,602 27,932 29,329
Value - With Plan (1.625 times Revenue)a 33,313 35,141 37,101 39,210 41,170 43,229 45,390 47,660
Number of Shares Outstanding (See Below) 1,000.00 1,000.29 1,000.93 1,001.98 1,003.03 1,004.08 1,004.84 1,005.25
Per-Share Value $33.31 $35.13 $37.07 $39.13 $41.05 $43.05 $45.17 $47.41
Stock Earned by ProducerExample Producer (25% Growth Yr. 1, 2, and 3) 500 625 781 977 1,025 1,077 1,130 1,187
Less: Target (115% of Prior Yr. Book) 500 525 656 820 1,025 1,077 1,130 1,187
Excess Book 0 100 125 156 0 0 0 0
Agency Value Multiplea 1.625 1.625 1.625 1.625 1.625 1.625 1.625 1.625
Value of Excess Book 0 163 203 254 0 0 0 0
Sharing of Excess 30.00% 30.00% 30.00% 30.00% 30.00% 30.00% 30.00% 30.00%
Value of Bonused Shares 0 49 61 76 0 0 0 0
Divide: Prior Year Stock Value N/A $33.31 $35.13 $37.07 $39.13 $41.05 $43.05 $45.17
Fully Vested Number of Shares Bonused 0.00 1.46 1.73 2.06 0.00 0.00 0.00 0.00
Producer Share Vesting Schedule (Assumes 5 year vesting schedule)Year 1 0.00 0.29 0.29 0.29 0.29 0.29 0.00 0.00
Year 2 0.00 0.00 0.35 0.35 0.35 0.35 0.35 0.00
Year 3 0.00 0.00 0.00 0.41 0.41 0.41 0.41 0.41
Annual Vested Shares 0.00 0.29 0.64 1.05 1.05 1.05 0.76 0.41
Shares Outstanding Beginning of Yr. 1,000.00 1,000.00 1,000.29 1,000.93 1,001.98 1,003.03 1,004.08 1,004.84
Total Shares Outstanding End of Yr. 1,000.00 1,000.29 1,000.93 1,001.98 1,003.03 1,004.08 1,004.84 1,005.25
Leverage in Agency ValueWith Plan - Value of Current Shareholders 33,313 35,130 37,066 39,132 41,046 43,053 45,171 47,411
With Plan - Example Producer Value 0 10 35 78 125 176 219 249
Total Agency Value 33,313 35,141 37,101 39,210 41,170 43,229 45,390 47,660
With Plan - Value of Current Shareholders 33,313 35,130 37,066 39,132 41,046 43,053 45,171 47,411
Without Plan - Value of Current Shareholders 33,313 34,978 36,727 38,563 40,492 42,516 44,642 46,874
Current Shareholders - Increase in Value 0 152 339 569 554 537 530 537
to help producers become comfortable with perpetuation debt and a financial incentive to maintain employment.
A PSIP includes these important attributes. It consists of a stock bonus, subject to five-year vesting, equivalent to 30% of the value of a producer’s book of business above a 15% net growth goal. The 15% net growth threshold is symbolic as performance less than that threshold is not extraordinary, it is their job. And, they are getting paid handsomely to do that
job. Above 15% is, in our opinion, going beyond the call of duty and as a result, could result in an additional incentive. Vesting ties producers to the agency, as unvested shares are subject to forfeiture if employment is terminated. To help ensure that producers have skin in the game and to teach producers to become comfortable with perpetuation debt, producers must purchase stock from treasury to receive the stock bonuses as a quid pro quo. Those producers that
Securities offered though MarshBerry Capital, Inc., Member FINRA and SIPC, and an affiliate of Marsh, Berry & Co., Inc. 28601 Chagrin Blvd., Suite 400, Woodmere, Ohio 44122, 440-354-3230
10 December 2016 • January 2017 | CounterPoint
choose to forgo stock bonuses because of the resulting tax liability or the requirement to take on debt to purchase stock send a clear signal that they will not be willing to sign a note to buy out a primary shareholder when the day comes for a large ownership transfer.
Producers that take on and retire debt over a prolonged period of time tend to learn to keep their lifestyles in balance to maintain their capacity to retire debt and to build personal net worth. Debt also helps build and test producer debt tolerance, which could help agency owners to eventually become comfortable with accepting a large note versus forcing a sale. Such a plan takes the mystery out of a very important question: “Will our producers be willing to pull a dime out of their pocket when it is time for my buyout?” Such a plan turns the table on the production staff. Instead of pleading to participate in ownership, producers will be responsible for driving ownership opportunity. Independence will be “theirs to lose” as perpetuation will only occur if producers rise to the challenge and demonstrate that they are leaders capable of driving predictable and profitable organic growth, managing debt service, and are therefore worthy of the seller financed credit risk.
While such a plan will not suffice as a complete perpetuation plan, it does tie ownership to performance, provide a coherent definition of what it takes to become an owner and put an agency in a position to attract and retain a production staff capable and willing to take risk to make perpetuation a reality. Existing owners benefit financially from the plan as the dollar increase in their value more than offsets the resulting percentage dilution in ownership.
As illustrated in Figure 3, if such a plan motivates one existing producer to improve net growth from 5 - 25% during three years, the existing owners drive their value by $537,000 in return for sharing $249,000 in value with the producer. While such an increase in value may appear modest, the true benefit comes from multiple producers stepping up performance, attracting additional entrepreneurial talent and driving the number of viable perpetuation candidates. It should be noted that the table in Figure 3 does not illustrate the required stock purchases by producers in order to illustrate the value trade off driven by the plan.
Strength through retained earningsIn our experience, few agencies have enough capital to perpetuate.
An undercapitalized agency generally cannot secure financing from a bank without requiring the departing principal to sign personally to collateralize the note. If an agency does not have a strong balance sheet, a bank will likely not perceive the agency as a good credit risk. And if a bank does not have
confidence that an agency can service perpetuation debt, why should a retiring agency principal? Faced with the decision to sell or perpetuate the agency, many aging owners choose a sale.
To be a good credit risk for a lender or a departing principal, an agency must have sufficient cash flow to buy out the departing principal, reinvest in the production staff and maintain enough balance sheet strength to weather any future difficulties. Furthermore, an agency with a strong balance sheet can make a large down payment so that less of the future cash flow will need to be diverted to service the remainder of the perpetuation debt. To build a base of capital sufficient for perpetuation, we believe an agency should build and maintain a strong balance sheet by retaining earnings. A good indicator of balance-sheet strength is tangible net worth. Tangible net worth is the amount by which an agency’s tangible assets (assets excluding covenants, goodwill, expiration lists) exceed liabilities. In our experience, an agency with tangible net worth less than 15% of revenue will find it difficult to perpetuate, especially if a sizable portion of the net worth is concentrated in fixed assets. Agencies serious about perpetuation should strive to build up, over and over again, a tangible net worth ratio of 25%.
Comprehensive planRecruiting and retaining producers, removing barriers to cash flow, building a strong balance sheet, broadening ownership over time and using stock as an incentive to attract and develop leaders are all important to perpetuation.
But a well conceived perpetuation plan that has the legs to carry independence must be comprehensive, integrating multiple financial tools. Such a plan should evaluate the use of various trusts, synthetic equity, financing alternatives, changes to corporate structure and tax mitigation and tax deferral strategies.*
Securing independenceWe believe that agencies should implement a process to enable best of breed producers to participate in the risks and returns of private ownership and to build personal wealth.
Embracing a culture of accountability and ownership can help agencies attract entrepreneurial self-starters, drive production and create leaders that are capable of managing perpetuation debt. While developing the next generation of leadership, the agency should create a comprehensive plan that can produce sufficient cash flow to enable the orderly transition of ownership.
Agencies that embrace such concepts help drive agency value by recruiting, retaining and rewarding high performing producers and live up to the promise of achieving independence. n
*Marsh, Berry & Co., Inc. and MarshBerry Capital, Inc. do not provide tax or legal advice. These professionals should be consulted before implementing changes to your tax or legal matters.Securities offered though MarshBerry Capital, Inc., Member FINRA and SIPC, and an affiliate of Marsh, Berry & Co., Inc. 28601 Chagrin Blvd., Suite 400, Woodmere, Ohio 44122, 440-354-3230
Don’t Let Taxes Drive How You Run Your Business
Whether you agree with Mark Cuban or President-elect Donald Trump regarding paying taxes, it is important to understand that tax strategy should only be one tactic for how you operate your business. Mark Cuban has said “…the most patriotic thing you can do as a wealthy person is pay your taxes”. Whereas, President-elect Trump takes a more “fiscally responsible” view on paying taxes believing that it is his “…fiduciary responsibility to his business, his family and his employees to pay no more tax than legally required”. Both of these billionaires, Cuban listed as # 204 on Forbes 2016 400 Wealthiest In America and Trump listed as #156, are playing by the same rules as legally stated by the Internal Revenue Code. Irrespective of your viewpoint on each billionaires’ thoughts, taxes are here to stay and we believe it’s important not to let them dramatically impact and or change how you run your agency.
When looking at historical profitability, measured by profit prior to state and federal income tax (“Pre-tax Profit”), for the All Agency Average compared to the Best 25%, it is evident that the top performing agencies are paying their fair share of income taxes. Historically, Pre-tax Profit for agencies in the Best 25% has hovered around the 23% of Net Revenue mark, indicating that they are not strangers to paying taxes. This aligns with our belief that a business should not be run solely to mitigate taxable income/income taxes. Certainly, there are reasons to take advantage of the tax mitigation strategies offered by the Internal Revenue Code but don’t let these drive the way in which you run your business.
Far too often, we see that agency owners allow their tax strategy to dictate business operations, making it difficult to measure and benchmark their
Continued on Page 19
by Justin Nockengust, Financial Analyst440.392.6556 | [email protected]
11CounterPoint | December 2016 • January 2017
For the Record
When looking at historical profitability, it is evident that the top performing agencies are paying their fair share of income taxes.
HISTORICAL EBITDA AS A PERCENT OF NET REVENUE
*YTD as of 6/30/2016EBITDA: Earnings Before Interest, Taxes, Depreciation and AmortizationAll Agency Average: the average for all agencies in the PHP database.Best 25%: the Best 25% of the Average Performance based on the highest Reward RatioPHP: Perspectives for High PerformanceSource: MarshBerry proprietary financial management system, Perspectives for High Performance (PHP)Marsh, Berry & Co., Inc. and MarshBerry Capital, Inc. do not provide tax or legal advice. These professionals should be consulted before implementing changes to your tax or legal matters.
Marsh, Berry & Co., Inc. and MarshBerry Capital, Inc. do not provide tax or legal advice. These professionals should be consulted before implementing changes to your tax or legal matters

12 December 2016 • January 2017 | CounterPoint
MarshBerry spends thousands of hours inside the walls of insurance brokerages every year. Its consultants are exposed to all different kinds of firms: high-growth, no growth, pro-technology, anti-technology, privately held, bank-owned, sales-focused, service-focused, Millennial-led, Baby Boomer-steered.
The one thing MarshBerry consultants feel in the opening seconds of talking to a leader, or setting foot inside a firm’s building, is the culture.The themes for our 2016 Annual Peak Performance Exchange (APPEX), Bank Agency Network (BANK) and Total Agency Sales Culture (TASC) summits centered on talent, culture, and technology.
We hosted exceptional and insightful presentations from: n John Wepler, Chairman & Chief Executive Officer of MarshBerryn Shawn DuBravac, Ph.D., Chief Economist of the Consumer Electronics Association n Jon Wolske, Culture Evangelist for Zappos Insights n Brian Beaulieu, Chief Executive Officer of ITR Economics and Chief Economist for TECn David Friedman, Chief Executive Officer of High Performing Culture, LLC and former President of RSI
Annual Best of the BestThe annual Best of the Best Award winner was announced at the fall BANK/TASC summit in Denver. This award recognizes the firm with the highest average organic growth rate across the prior five years.
For the second year in a row, TrueNorth Companies LLC (Cedar Rapids, IA) attained the title of “Best of the Best” with an average organic growth rate of 11.3% over the last five years.
Challenging Our PartnersThough perhaps understated, the meat of the network meetings is the time spent in our Strategic Issues Groups (SIGs). SIGs allow agency leaders to meet in small groups and delve deeply into their goals, challenges, and commitments.
These groups also provide feedback and insight to other non-competing firms on their respective strategies for improvement. Given the expectation that SIG members hold each other accountable to value-enhancing change, all participants who attend are not only invested in improving their own organizations, but also in improving the operations of their SIG peers.
Talent, Culture, andTechnology
by Christina M. Moran, Ph.D., Business Unit Manager, Peer Exchange Networks440.220.5273 | [email protected]
2016 Peer Exchange Networks Year in Review
13CounterPoint | December 2016 • January 2017
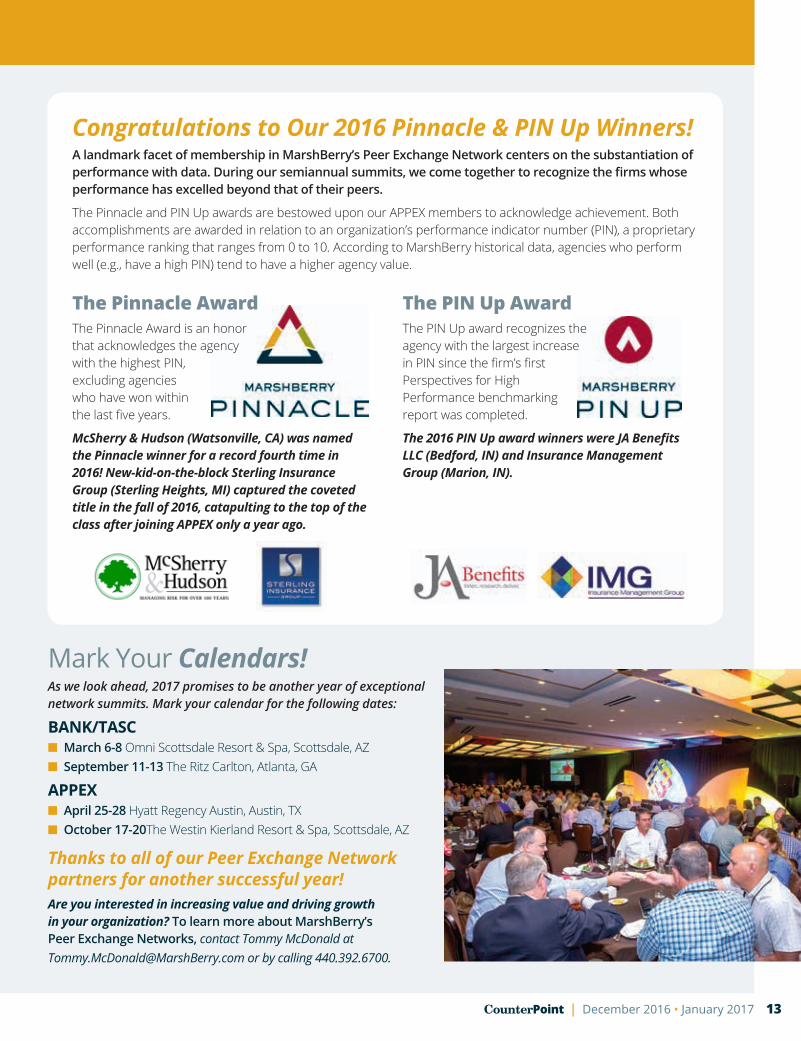
Congratulations to Our 2016 Pinnacle & PIN Up Winners!A landmark facet of membership in MarshBerry’s Peer Exchange Network centers on the substantiation of performance with data. During our semiannual summits, we come together to recognize the firms whose performance has excelled beyond that of their peers.
The Pinnacle and PIN Up awards are bestowed upon our APPEX members to acknowledge achievement. Both accomplishments are awarded in relation to an organization’s performance indicator number (PIN), a proprietary performance ranking that ranges from 0 to 10. According to MarshBerry historical data, agencies who perform well (e.g., have a high PIN) tend to have a higher agency value.
Mark Your Calendars!As we look ahead, 2017 promises to be another year of exceptional network summits. Mark your calendar for the following dates:
BANK/TASC n March 6-8 Omni Scottsdale Resort & Spa, Scottsdale, AZn September 11-13 The Ritz Carlton, Atlanta, GA
APPEXn April 25-28 Hyatt Regency Austin, Austin, TXn October 17-20The Westin Kierland Resort & Spa, Scottsdale, AZ
Thanks to all of our Peer Exchange Network partners for another successful year! Are you interested in increasing value and driving growth in your organization? To learn more about MarshBerry’s Peer Exchange Networks, contact Tommy McDonald at [email protected] or by calling 440.392.6700.
The Pinnacle AwardThe Pinnacle Award is an honor that acknowledges the agency with the highest PIN, excluding agencies who have won within the last five years.
McSherry & Hudson (Watsonville, CA) was named the Pinnacle winner for a record fourth time in 2016! New-kid-on-the-block Sterling Insurance Group (Sterling Heights, MI) captured the coveted title in the fall of 2016, catapulting to the top of the class after joining APPEX only a year ago.
The PIN Up AwardThe PIN Up award recognizes the agency with the largest increase in PIN since the firm’s first Perspectives for High Performance benchmarking report was completed.
The 2016 PIN Up award winners were JA Benefits LLC (Bedford, IN) and Insurance Management Group (Marion, IN).
14 December 2016 • January 2017 | CounterPoint
Dealmaker’s Dialogue
The Tax ManComes
President-elect Donald Trump took a bashing for failure to pay taxes. These sound bites sound great, but knowledgeable tax professionals know that if “The Donald” reported the income or loss from flow through entities, he legitimately could have “huge” losses that can be carried forward to offset other income. This issue could beg more of his business acumen than his legitimate use of the tax code. MarshBerry has long coached its clients to consider a flow-through entity for their agency, whether an LLC, S-Corporation, or a partnership in some states. At the same time, MarshBerry consultants help their clients grow their revenue and profit, thereby helping to increase the taxable income that flows from their business, whereby, they may be paying more in tax than even our presidential candidates. Let’s face it, our governments, in a large part, are funded by income taxes. How do these taxes impact our clients and what are the important planning items to consider?
Assuming agency principals are active in their business, many have salaries, commissions, and bonuses that compensate them for their services. These expenses are deductible by the business against its revenue. The net income or loss from the agency then flows through to the personal returns of owners (in a flow-through entity). Beyond the ordinary income or loss, the buy and sell side of acquisition planning also impacts the owners of both the buyer and the seller.
An agency on the selling side will receive proceeds from a sale. This assumes an asset sale transaction as compared to a stock transaction. The assets of an insurance agency are primarily capital assets, thereby resulting in a capital gain flowing out to the owners. Agency owners prefer the capital gain, at a federal rate of 20%, compared to ordinary income via consulting payments, non-compete payments, or compensation, which are all taxed as ordinary income up to 39% federal.
We have seen in our experience that agency owners that failed to make S-corporation elections often prefer to sell the stock of their company, because they also want a capital gain. However, buyers do not want to buy stock as they do not receive any immediate tax benefits with a stock purchase. As a result, through negotiation, buyers and sellers look for attributes such as personal goodwill of the selling agency’s owners. When the buyer purchases the personal goodwill of a shareholder, the buyer is entitled to amortize the purchase price over fifteen years, resulting in the same consequences to the buyer as if the buyer had acquired the assets of the corporation. The seller, on the other hand, has capital gain on the personal goodwill sale and has a reportable capital gain, rather than suffering the double tax associated with a C-Corporation selling assets, then distributing the net proceeds to the shareholder and the shareholder paying tax, thereby creating the double tax.
Buyers are in a similar position, whether they are acquiring the capital assets of the owner or the business, the purchase price can be amortized over fifteen years. While not as attractive as being able to expense the purchase price immediately, the buyer can deduct the amortization expense over fifteen years, plus any interest expense on debt used to fund the purchase.
It is impossible to avoid tax consequences in running your business, acquiring, or selling. Therefore, it is imperative to get professional advice as you grow your business and approach any transaction.
by Wayne Walkotten, Executive Vice President616.723.8372 | [email protected]
Calling
Securities offered through MarshBerry Capital, Inc., Member FINRA Member SIPC and an affiliate of Marsh, Berry & Company, Inc. 28601 Chagrin Blvd., Suite 400, Woodmere, Ohio 44122 440.354.3230. Marsh, Berry & Co., Inc. and MarshBerry Capital, Inc. do not provide tax or legal advice. These professionals should be consulted before implementing changes to your tax or legal matters.
15CounterPoint | December 2016 • January 2017
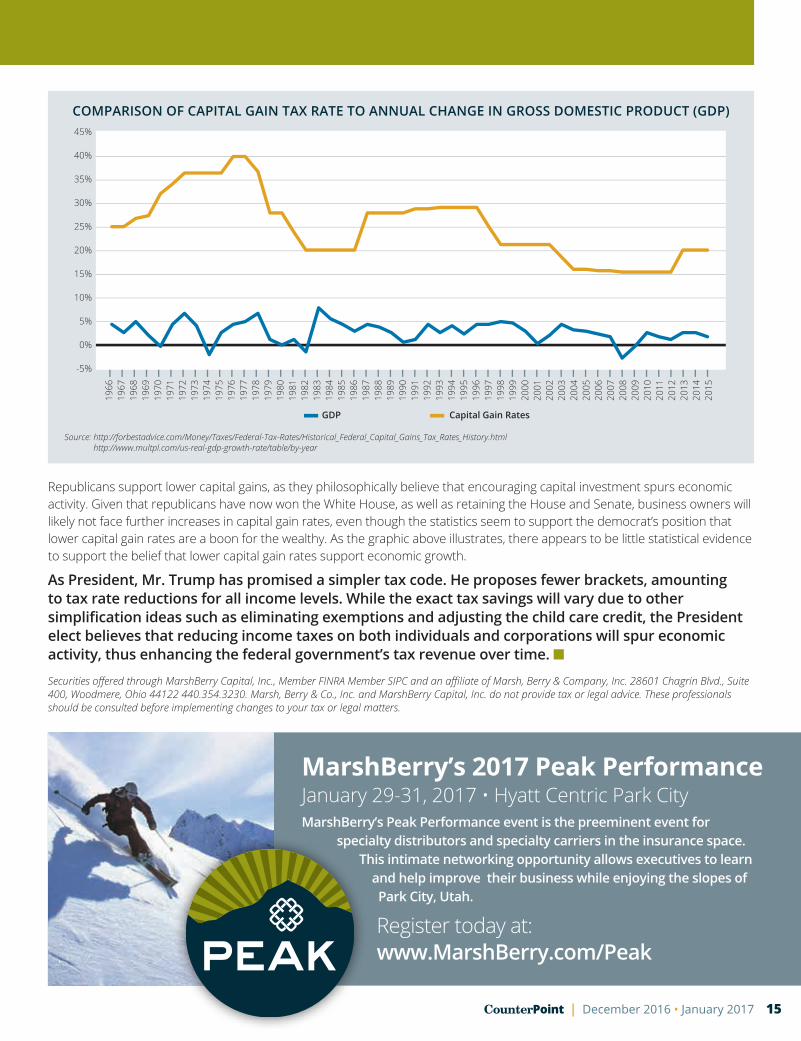
COMPARISON OF CAPITAL GAIN TAX RATE TO ANNUAL CHANGE IN GROSS DOMESTIC PRODUCT (GDP)
Source: http://forbestadvice.com/Money/Taxes/Federal-Tax-Rates/Historical_Federal_Capital_Gains_Tax_Rates_History.html http://www.multpl.com/us-real-gdp-growth-rate/table/by-year
Republicans support lower capital gains, as they philosophically believe that encouraging capital investment spurs economic activity. Given that republicans have now won the White House, as well as retaining the House and Senate, business owners will likely not face further increases in capital gain rates, even though the statistics seem to support the democrat’s position that lower capital gain rates are a boon for the wealthy. As the graphic above illustrates, there appears to be little statistical evidence to support the belief that lower capital gain rates support economic growth.
As President, Mr. Trump has promised a simpler tax code. He proposes fewer brackets, amounting to tax rate reductions for all income levels. While the exact tax savings will vary due to other simplification ideas such as eliminating exemptions and adjusting the child care credit, the President elect believes that reducing income taxes on both individuals and corporations will spur economic activity, thus enhancing the federal government’s tax revenue over time. n
Securities offered through MarshBerry Capital, Inc., Member FINRA Member SIPC and an affiliate of Marsh, Berry & Company, Inc. 28601 Chagrin Blvd., Suite 400, Woodmere, Ohio 44122 440.354.3230. Marsh, Berry & Co., Inc. and MarshBerry Capital, Inc. do not provide tax or legal advice. These professionals should be consulted before implementing changes to your tax or legal matters.
MarshBerry’s 2017 Peak Performance January 29-31, 2017 • Hyatt Centric Park CityMarshBerry’s Peak Performance event is the preeminent event for specialty distributors and specialty carriers in the insurance space. This intimate networking opportunity allows executives to learn and help improve their business while enjoying the slopes of Park City, Utah.
Register today at: www.MarshBerry.com/Peak
Quarter in Review Q&Awith John Wepler
16 December 2016 • January 2017 | CounterPoint
1 How likely are we to see a “seller’s market” in the insurance distribution space continuing unabated into 2017?
Activity year-to-date in 2016 has decelerated compared to the historic pace that was set in 2015, however the volume of transactions in 2016 is still on track to become the second most active year in the past decade. High valuation multiples, and the uncertain regulatory and political outlook, are certainly drivers of the slowed pace and we expect the merger & acquisition (M&A) atmosphere to brighten in 2017. After already completing $98M of annualized acquisition revenues through the end of 3Q16, Arthur J. Gallagher & Co. (AJG) mentioned having $90M of revenue in their acquisition pipeline under “agreed-upon term sheets” and another $140M of revenue in the bidding process, meaning the next 12 months could show similar or greater acquisition activity. Brown & Brown, Inc. (BRO) is on pace to come close to acquiring the same level of annualized revenue this year as last year ($52M YTD in 2016, $56M in 2015) and has built a cash balance to continue to take advantage of good opportunities as they come along. Once there is more visibility into possible tax structure and interest rate outlook, we expect companies to continue using cash to maximize growth.
2 What are the possible impacts of “non-traditional” kinds of insurance coverage such as cyber, drones, ride-sharing and other technologies on the insurance industry?
In an environment of continuing low interest rates, as well as stock market volatility (in the US and internationally), companies are searching for growth and are considering a more diverse array of products. We anticipate that these emerging and “niche” areas of insurance will continue to command appropriate premiums and underwriting standards. For example, AON Corporation (AON) recently completed the purchase of Stroz Friedberg, a global risk management firm focused specifically in cyber security, to take advantage of an industry which they say has roughly $2B of annual premiums placed and roughly $400B of losses. Their view is driven by demand for emerging technology insurance and the need for alternative sources of growth. Of course, this trend could be negatively impacted by a higher incidence of natural catastrophes and terrorism, soft market pricing and/or aggressive underwriting actions.
3 How have recent events regarding the Affordable Care Act (ACA) and the public healthcare exchanges influenced the distribution market?
The ACA has recently come under fire, with carriers pulling out of the public exchange market and rates on the rise. AJG mentioned seeing stronger M&A activity as a result of the complexity of ACA and seeing greater benefits consulting opportunities as their clients determine the right course of action for their employee base. AJG also mentioned roughly 15% of its client base is “taking a serious look” at their private exchange (current utilization is lower). AON mentioned strong growth on its health care exchange platforms, and sees this as only a piece of the broader solution based approach that is catching on with employee benefit clients who are faced with difficulties around ACA compliance and understanding. BRO commented that they are starting to see some stabilizing in rates on the under 100 lives cases which have been somewhat volatile with clients changing carriers and carriers moving in some cases form commissions to per employee monthly fees. We expect ACA to continue to dominate headlines as there are likely to be more major changes in the next presidential term.
Sources: Data for Arthur J. Gallagher & Co., AON Corporation, Brown & Brown, Inc. and the Affordable Care Act impact was obtained through the 3Q16 public investor calls for each organization as well as other publicly available sources. Securities offered through MarshBerry Capital, Inc., Member FINRA Member SIPC and an affiliate of Marsh, Berry & Company, Inc., 28601 Chagrin Blvd., Suite 400, Woodmere, Ohio 44122 440.354.3230. Marsh, Berry & Co., Inc. and MarshBerry Capital, Inc. do not provide tax or legal advice. These professionals should be consulted before implementing changes to your tax or legal matters.
BROKERAon
CorporationArthur J.
Gallagher & Co.
Brown & Brown, Inc.
Marsh & McLennan
Companies, Inc.
Willis Towers Watson
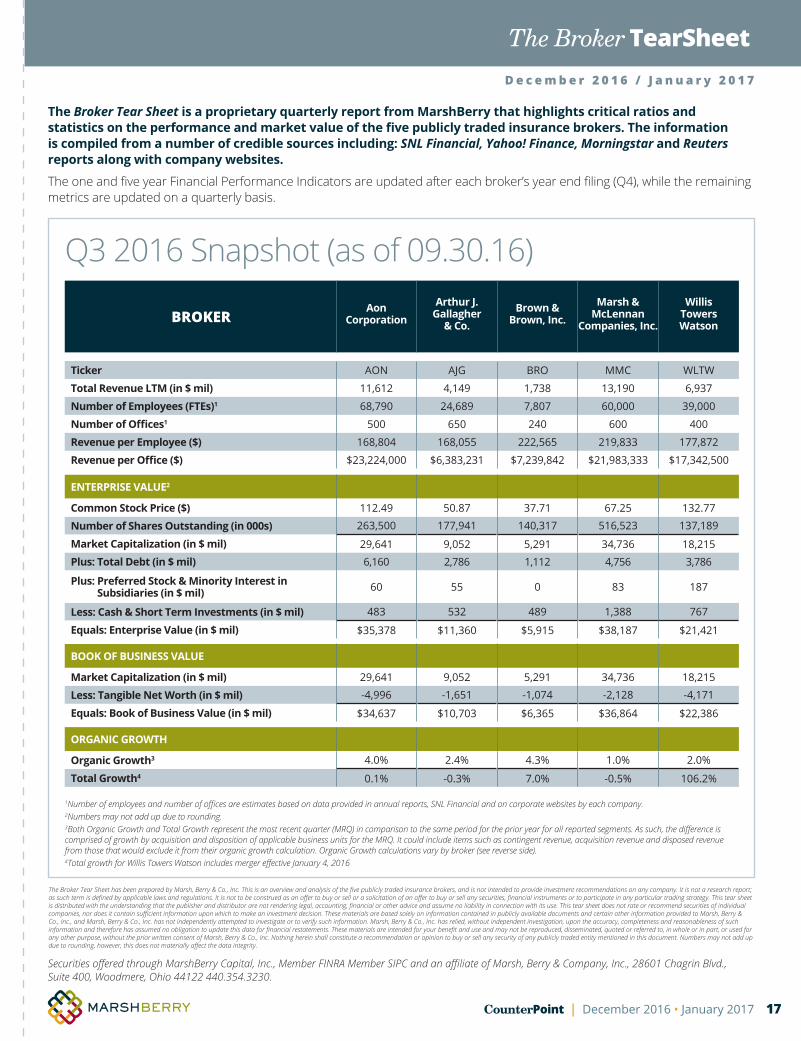
Ticker AON AJG BRO MMC WLTW
Total Revenue LTM (in $ mil) 11,612 4,149 1,738 13,190 6,937
Number of Employees (FTEs)1 68,790 24,689 7,807 60,000 39,000
Number of Offices1 500 650 240 600 400
Revenue per Employee ($) 168,804 168,055 222,565 219,833 177,872
Revenue per Office ($) $23,224,000 $6,383,231 $7,239,842 $21,983,333 $17,342,500
ENTERPRISE VALUE2
Common Stock Price ($) 112.49 50.87 37.71 67.25 132.77
Number of Shares Outstanding (in 000s) 263,500 177,941 140,317 516,523 137,189
Market Capitalization (in $ mil) 29,641 9,052 5,291 34,736 18,215
Plus: Total Debt (in $ mil) 6,160 2,786 1,112 4,756 3,786
Plus: Preferred Stock & Minority Interest in Subsidiaries (in $ mil) 60 55 0 83 187
Less: Cash & Short Term Investments (in $ mil) 483 532 489 1,388 767
Equals: Enterprise Value (in $ mil) $35,378 $11,360 $5,915 $38,187 $21,421
BOOK OF BUSINESS VALUE
Market Capitalization (in $ mil) 29,641 9,052 5,291 34,736 18,215
Less: Tangible Net Worth (in $ mil) -4,996 -1,651 -1,074 -2,128 -4,171
Equals: Book of Business Value (in $ mil) $34,637 $10,703 $6,365 $36,864 $22,386
ORGANIC GROWTH
Organic Growth3 4.0% 2.4% 4.3% 1.0% 2.0%
Total Growth4 0.1% -0.3% 7.0% -0.5% 106.2%
The Broker Tear Sheet has been prepared by Marsh, Berry & Co., Inc. This is an overview and analysis of the five publicly traded insurance brokers, and is not intended to provide investment recommendations on any company. It is not a research report; as such term is defined by applicable laws and regulations. It is not to be construed as an offer to buy or sell or a solicitation of an offer to buy or sell any securities, financial instruments or to participate in any particular trading strategy. This tear sheet is distributed with the understanding that the publisher and distributor are not rendering legal, accounting, financial or other advice and assume no liability in connection with its use. This tear sheet does not rate or recommend securities of individual companies, nor does it contain sufficient information upon which to make an investment decision. These materials are based solely on information contained in publicly available documents and certain other information provided to Marsh, Berry & Co., Inc., and Marsh, Berry & Co., Inc. has not independently attempted to investigate or to verify such information. Marsh, Berry & Co., Inc. has relied, without independent investigation, upon the accuracy, completeness and reasonableness of such information and therefore has assumed no obligation to update this data for financial restatements. These materials are intended for your benefit and use and may not be reproduced, disseminated, quoted or referred to, in whole or in part, or used for any other purpose, without the prior written consent of Marsh, Berry & Co., Inc. Nothing herein shall constitute a recommendation or opinion to buy or sell any security of any publicly traded entity mentioned in this document. Numbers may not add up due to rounding, however, this does not materially affect the data integrity.
The Broker Tear Sheet is a proprietary quarterly report from MarshBerry that highlights critical ratios and statistics on the performance and market value of the five publicly traded insurance brokers. The information is compiled from a number of credible sources including: SNL Financial, Yahoo! Finance, Morningstar and Reuters reports along with company websites.
The one and five year Financial Performance Indicators are updated after each broker’s year end filing (Q4), while the remaining metrics are updated on a quarterly basis.
D e c e m b e r 2 0 1 6 / J a n u a r y 2 0 1 7
Q3 2016 Snapshot (as of 09.30.16)
The Broker TearSheet
Securities offered through MarshBerry Capital, Inc., Member FINRA Member SIPC and an affiliate of Marsh, Berry & Company, Inc., 28601 Chagrin Blvd., Suite 400, Woodmere, Ohio 44122 440.354.3230.
17CounterPoint | December 2016 • January 2017
1 Number of employees and number of offices are estimates based on data provided in annual reports, SNL Financial and on corporate websites by each company. 2 Numbers may not add up due to rounding.3Both Organic Growth and Total Growth represent the most recent quarter (MRQ) in comparison to the same period for the prior year for all reported segments. As such, the difference is comprised of growth by acquisition and disposition of applicable business units for the MRQ. It could include items such as contingent revenue, acquisition revenue and disposed revenue from those that would exclude it from their organic growth calculation. Organic Growth calculations vary by broker (see reverse side).4Total growth for Willis Towers Watson includes merger effective January 4, 2016
5As reported in the MD&A published by each company; and calculated and reported slightly differently by each. AON: Includes all revenue except business unit transfers, unusual items and reimbursable expenses. AJG: Includes base organic commission & fee revenue and excludes supplemental and contingent commission revenue, impact of prior year large account wins, run-off related to the New South Wales Workers’ Compensation Scheme, South Australia ramp up fees and New Zealand claims administration. BRO: Includes total commissions excludes profit sharing and guaranteed supplemental commissions. MMC: Includes all segments of revenue, using consistent currency translation (excluding divestitures, transfers among business units, acquisitions, and deconsolidation of Marsh India). WLTW: Includes total commissions & fees (excludes goodwill impairment charges, debt extinguishment, investment income, and other income). All broker organic growth calculations exclude the impact of foreign currency translation, divestitures, transfers, disposed operations, and the first twelve months of acquisition commission & fee revenue.6EBITDA is not adjusted to include the add-back of non-recurring expenses written off throughout the year.
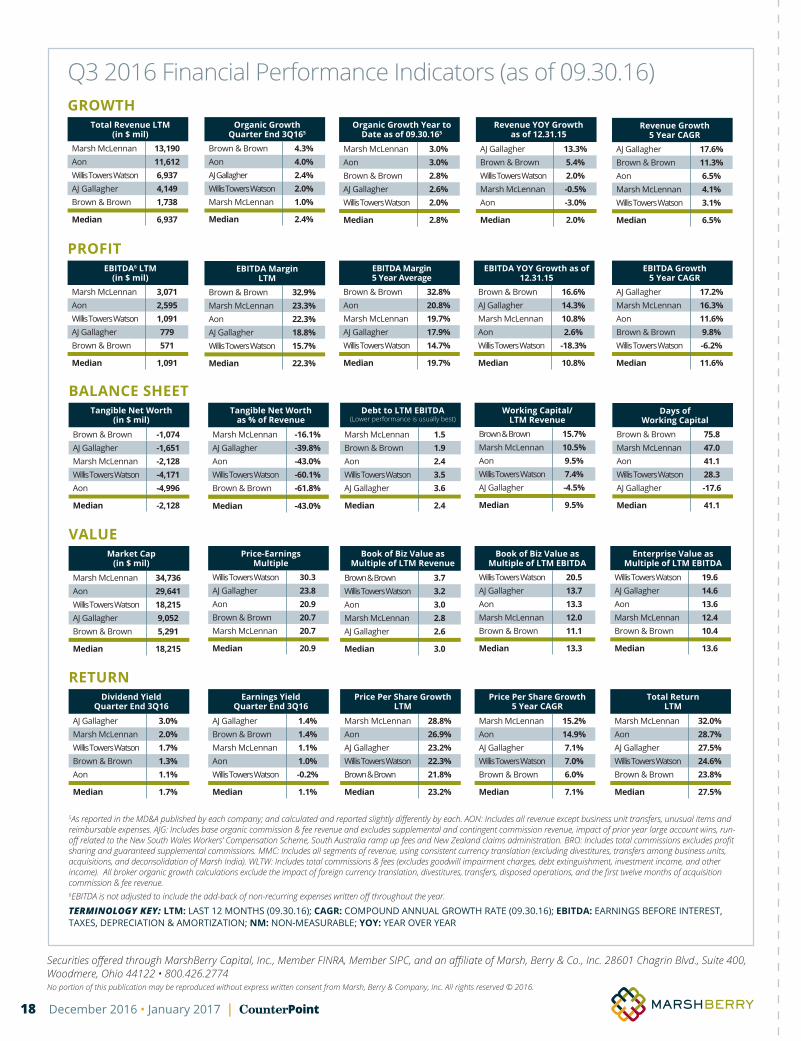
TERMINOLOGY KEY: LTM: LAST 12 MONTHS (09.30.16); CAGR: COMPOUND ANNUAL GROWTH RATE (09.30.16); EBITDA: EARNINGS BEFORE INTEREST, TAXES, DEPRECIATION & AMORTIZATION; NM: NON-MEASURABLE; YOY: YEAR OVER YEAR
EBITDA6 LTM (in $ mil)
Marsh McLennan 3,071 Aon 2,595 Willis Towers Watson 1,091 AJ Gallagher 779 Brown & Brown 571
Median 1,091
EBITDA YOY Growth as of 12.31.15
Brown & Brown 16.6%AJ Gallagher 14.3%Marsh McLennan 10.8%Aon 2.6%Willis Towers Watson -18.3%
Median 10.8%
EBITDA Growth 5 Year CAGR
AJ Gallagher 17.2%Marsh McLennan 16.3%Aon 11.6%Brown & Brown 9.8%Willis Towers Watson -6.2%
Median 11.6%
EBITDA Margin LTM
Brown & Brown 32.9%Marsh McLennan 23.3%Aon 22.3%AJ Gallagher 18.8%Willis Towers Watson 15.7%
Median 22.3%
EBITDA Margin 5 Year Average
Brown & Brown 32.8%Aon 20.8%Marsh McLennan 19.7%AJ Gallagher 17.9%Willis Towers Watson 14.7%
Median 19.7%
PROFIT
Organic GrowthQuarter End 3Q165
Brown & Brown 4.3%Aon 4.0%AJ Gallagher 2.4%Willis Towers Watson 2.0%Marsh McLennan 1.0%
Median 2.4%
Revenue YOY Growth as of 12.31.15
AJ Gallagher 13.3%Brown & Brown 5.4%Willis Towers Watson 2.0%Marsh McLennan -0.5%Aon -3.0%
Median 2.0%
Revenue Growth 5 Year CAGR
AJ Gallagher 17.6%Brown & Brown 11.3%Aon 6.5%Marsh McLennan 4.1%Willis Towers Watson 3.1%
Median 6.5%
Total Revenue LTM (in $ mil)
Marsh McLennan 13,190 Aon 11,612 Willis Towers Watson 6,937 AJ Gallagher 4,149 Brown & Brown 1,738
Median 6,937
GROWTHOrganic Growth Year to
Date as of 09.30.165
Marsh McLennan 3.0%Aon 3.0%Brown & Brown 2.8%AJ Gallagher 2.6%Willis Towers Watson 2.0%
Median 2.8%
Tangible Net Worth (in $ mil)
Brown & Brown -1,074AJ Gallagher -1,651Marsh McLennan -2,128Willis Towers Watson -4,171Aon -4,996
Median -2,128
Working Capital/LTM Revenue
Brown & Brown 15.7%Marsh McLennan 10.5%Aon 9.5%Willis Towers Watson 7.4%AJ Gallagher -4.5%
Median 9.5%
Days of Working Capital
Brown & Brown 75.8 Marsh McLennan 47.0 Aon 41.1 Willis Towers Watson 28.3 AJ Gallagher -17.6
Median 41.1
BALANCE SHEETTangible Net Worth
as % of Revenue
Marsh McLennan -16.1%AJ Gallagher -39.8%Aon -43.0%Willis Towers Watson -60.1%Brown & Brown -61.8%
Median -43.0%
Debt to LTM EBITDA (Lower performance is usually best)
Marsh McLennan 1.5 Brown & Brown 1.9 Aon 2.4 Willis Towers Watson 3.5 AJ Gallagher 3.6
Median 2.4
Market Cap (in $ mil)
Marsh McLennan 34,736 Aon 29,641 Willis Towers Watson 18,215 AJ Gallagher 9,052 Brown & Brown 5,291
Median 18,215
Book of Biz Value as Multiple of LTM EBITDA
Willis Towers Watson 20.5 AJ Gallagher 13.7 Aon 13.3 Marsh McLennan 12.0 Brown & Brown 11.1
Median 13.3
Enterprise Value as Multiple of LTM EBITDA
Willis Towers Watson 19.6 AJ Gallagher 14.6 Aon 13.6 Marsh McLennan 12.4 Brown & Brown 10.4
Median 13.6
Price-Earnings Multiple
Willis Towers Watson 30.3 AJ Gallagher 23.8 Aon 20.9 Brown & Brown 20.7 Marsh McLennan 20.7
Median 20.9
VALUEBook of Biz Value as
Multiple of LTM Revenue
Brown & Brown 3.7 Willis Towers Watson 3.2 Aon 3.0 Marsh McLennan 2.8 AJ Gallagher 2.6
Median 3.0
Dividend Yield Quarter End 3Q16
AJ Gallagher 3.0%Marsh McLennan 2.0%Willis Towers Watson 1.7%Brown & Brown 1.3%Aon 1.1%
Median 1.7%
RETURNEarnings Yield
Quarter End 3Q16
AJ Gallagher 1.4%Brown & Brown 1.4%Marsh McLennan 1.1%Aon 1.0%Willis Towers Watson -0.2%
Median 1.1%
Price Per Share Growth LTM
Marsh McLennan 28.8%Aon 26.9%AJ Gallagher 23.2%Willis Towers Watson 22.3%Brown & Brown 21.8%
Median 23.2%
Price Per Share Growth 5 Year CAGR
Marsh McLennan 15.2%Aon 14.9%AJ Gallagher 7.1%Willis Towers Watson 7.0%Brown & Brown 6.0%
Median 7.1%
Total Return LTM
Marsh McLennan 32.0%Aon 28.7%AJ Gallagher 27.5%Willis Towers Watson 24.6%Brown & Brown 23.8%
Median 27.5%
Securities offered through MarshBerry Capital, Inc., Member FINRA, Member SIPC, and an affiliate of Marsh, Berry & Co., Inc. 28601 Chagrin Blvd., Suite 400, Woodmere, Ohio 44122 • 800.426.2774No portion of this publication may be reproduced without express written consent from Marsh, Berry & Company, Inc. All rights reserved © 2016.
Q3 2016 Financial Performance Indicators (as of 09.30.16)
18 December 2016 • January 2017 | CounterPoint
19CounterPoint | December 2016 • January 2017
For the RecordContinued from Page 11
agency. Setting aside business entity structure differences (flow-through vs. tax paying entities), there are other tax strategies that frequently make the comparison difficult including: compensation paid to owners/shareholders, self-employment taxes (Social Security and Medicare taxes), various fringe benefits, and employees vs. independent contractor classification. When trying to gauge your agency against other similar agencies, these differences can cause difficulties in doing so. Depending on your valuation method, these differences can impact the overall valuation of the firm by reducing Pre-Tax Profit and Earnings Before Interest, Taxes, Depreciations and Amortization. This can make bringing on new shareholders difficult as it “muddies” the transparency of the Financial Statements and may require performing a deep dive into all expenses to “pro forma” out the items that are only flowing through the business for tax benefits. Also, potential shareholders may be hesitant to buy as on the surface the agency appears less profitable. As MarshBerry sees in the marketplace, both for internal valuations (Fair Market Valuations) and external valuations, the amount of pro forma
adjustments is often directly correlated with the potential risk of the investment, therefore potentially decreasing value due to increased perceived risk.
Part of growing up as a business is overcoming the realization that taxes are an inevitable cost of running a business. This is just one piece of the greater Corporate Governance discussion. As the year comes to a close, this topic may be top of mind for many. Other Corporate Governance topics that we see in high performing agencies include: having a Board of Directors, a process for selection of the composition of the Board of Directors, process for bringing on new shareholders, having Audit and Attest services (Financial Audit, Review, or Compilation) performed by an independent Accounting Firm, Business Planning, Buy-Sell Agreement, Perpetuation planning, etc.
It’s important not to look at taxes as a “penalty” of doing business, but more of a rite of passage and that every business will pay taxes. Tax strategy is important and we believe you should seek professional guidance, however we see that successful firms do not allow it to drive their business strategy. n
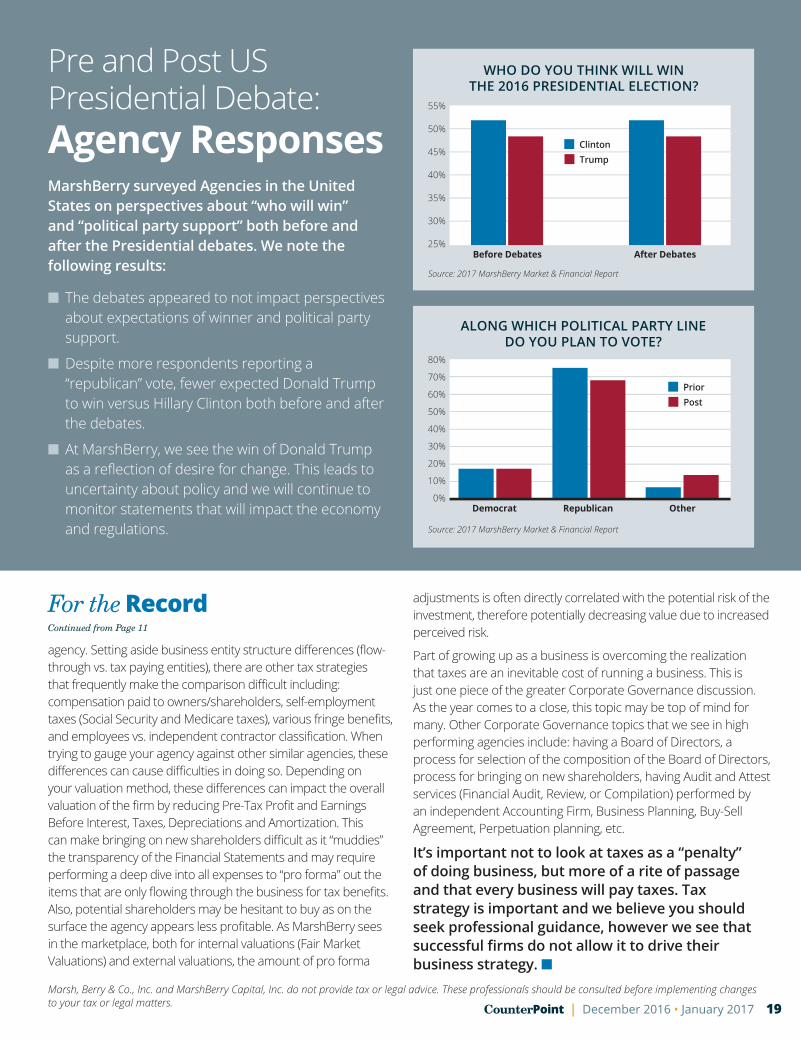
Pre and Post US Presidential Debate: Agency ResponsesMarshBerry surveyed Agencies in the United States on perspectives about “who will win” and “political party support” both before and after the Presidential debates. We note the following results:
n The debates appeared to not impact perspectives about expectations of winner and political party support.
n Despite more respondents reporting a “republican” vote, fewer expected Donald Trump to win versus Hillary Clinton both before and after the debates.
n At MarshBerry, we see the win of Donald Trump as a reflection of desire for change. This leads to uncertainty about policy and we will continue to monitor statements that will impact the economy and regulations.
Source: 2017 MarshBerry Market & Financial Report
WHO DO YOU THINK WILL WIN
THE 2016 PRESIDENTIAL ELECTION?
ALONG WHICH POLITICAL PARTY LINE
DO YOU PLAN TO VOTE?
Source: 2017 MarshBerry Market & Financial Report
Marsh, Berry & Co., Inc. and MarshBerry Capital, Inc. do not provide tax or legal advice. These professionals should be consulted before implementing changes to your tax or legal matters.

MARSHBERRY28601 Chagrin Blvd., Suite 400, Woodmere, Ohio 44122
ON THE HORIZON
JANUARY 20171.29-31 Peak Performance
Park City, UT
MAY 2017S A V E T H E D A T E S ! 2017 MarshBerry 3605.09 New Orleans, Harrah’s New Orleans5.11 New York, Convene at 237 Park Avenue5.23 Chicago, Swissotel Chicago5.25 Las Vegas, The Cosmopolitan of Las Vegas
Register today at www.MarshBerry.com/360
Log on to www.MarshBerry.com
to register for events and to view all MarshBerry
news and events.
WE WANT TO HEAR FROM YOU!We want to make sure we’re providing the content you want to read and want feedback on the articles we’re publishing. Send an email to us at [email protected] to share your thoughts!
Follow-us! Are you following MarshBerry yet on our social media channels? If not, join the thousands in the insurance industry already following us. Over the past year we have ramped up our social media content across LinkedIn, Twitter and Facebook and would love to interact with you!
So, why should you follow us? We provide exclusive access to our industry-leading thought leadership and content. Whether it be access to our CounterPoint magazine, insights from our consultants, or metrics from our Intellectual Capital team you’ll see it first across our social media channels.
Interested in attending one of our industry events? Get exclusive discounts not offered anywhere else.
If you’re not on social media yet, what are you waiting for?! Create your accounts today and join in on the fun!