the heritage foundation and affiliatesthf-reports.s3.amazonaws.com/2017/heritage...
TRANSCRIPT
The Heritage Foundation and Affiliates Consolidated Financial Report December 31, 2016
Contents Independent auditor’s report 1-2 Financial statements
Consolidated statements of financial position 3 Consolidated statements of activities 4 Consolidated statements of cash flows 5 Notes to consolidated financial statements 6-20
Supplementary information
Consolidated schedules of functional expenses 21-22

1
Independent Auditor’s Report To the Board of Trustees The Heritage Foundation Washington, D.C. Report on the Financial Statements We have audited the accompanying consolidated financial statements of The Heritage Foundation and Affiliates (the Foundation), which comprise the consolidated statements of financial position as of December 31, 2016 and 2015, and the related consolidated statements of activities and cash flows for the years then ended, and the related notes to the consolidated financial statements (collectively, financial statements). Management’s Responsibility for the Financial Statements Management is responsible for the preparation and fair presentation of these financial statements in accordance with accounting principles generally accepted in the United States of America; this includes the design, implementation and maintenance of internal control relevant to the preparation and fair presentation of financial statements that are free from material misstatement, whether due to fraud or error. Auditor’s Responsibility Our responsibility is to express an opinion on these financial statements based on our audits. We conducted our audits in accordance with auditing standards generally accepted in the United States of America. Those standards require that we plan and perform the audit to obtain reasonable assurance about whether the financial statements are free from material misstatement. An audit involves performing procedures to obtain audit evidence about the amounts and disclosures in the financial statements. The procedures selected depend on the auditor’s judgment, including the assessment of the risks of material misstatement of the financial statements, whether due to fraud or error. In making those risk assessments, the auditor considers internal control relevant to the entity’s preparation and fair presentation of the financial statements in order to design audit procedures that are appropriate in the circumstances but not for the purpose of expressing an opinion on the effectiveness of the entity’s internal control. Accordingly, we express no such opinion. An audit also includes evaluating the appropriateness of accounting policies used and the reasonableness of significant accounting estimates made by management, as well as evaluating the overall presentation of the financial statements. We believe that the audit evidence we have obtained is sufficient and appropriate to provide a basis for our audit opinion.

2
Opinion In our opinion, the financial statements referred to above present fairly, in all material respects, the financial position of The Heritage Foundation and Affiliates as of December 31, 2016 and 2015, and the changes in their net assets and their cash flows for the years then ended in accordance with accounting principles generally accepted in the United States of America. Other Matter Our audits were conducted for the purpose of forming an opinion on the financial statements as a whole. The accompanying supplementary information is presented for purposes of additional analysis and is not a required part of the financial statements. Such information is the responsibility of management and was derived from and relates directly to the underlying accounting and other records used to prepare the financial statements. The information has been subjected to the auditing procedures applied in the audits of the financial statements and certain additional procedures, including comparing and reconciling such information directly to the underlying accounting and other records used to prepare the financial statements or to the financial statements themselves, and other additional procedures in accordance with auditing standards generally accepted in the United States of America. In our opinion, the information is fairly stated in all material respects in relation to the financial statements as a whole.
Washington, D.C. May 18, 2017

3
The Heritage Foundation and Affiliates
Consolidated Statements of Financial PositionDecember 31, 2016 and 2015
2016 2015Assets
Current assets:Cash and cash equivalents 7,419,517 $ 4,660,363 $ Contributions receivable 7,142,526 8,145,678 Prepayments and other assets 968,624 608,933
Total current assets 15,530,667 13,414,974
Long-term assets:Investments 186,298,568 182,144,559 Deferred compensation investments 2,133,741 2,393,742 Contributions receivable, net 7,357,075 3,378,177 Property and equipment, net 76,916,027 67,554,256 Cash surrender value of insurance 790,149 720,900
Total long-term assets 273,495,560 256,191,634
Total assets 289,026,227 $ 269,606,608 $
Liabilities and Net Assets
Current liabilities:Accounts payable and accrued expenses 10,826,986 $ 9,219,012 $ Notes payable 548,805 533,072
Total current liabilities 11,375,791 9,752,084
Long-term liabilities:Notes payable 22,469,756 18,320,831 Deferred compensation obligations 2,133,741 2,393,742 Split-interest obligations 12,366,345 12,856,836
Total long-term liabilities 36,969,842 33,571,409
Total liabilities 48,345,633 43,323,493
Net assets:Unrestricted:
Board designated 110,975,192 107,094,213 Undesignated 73,772,268 73,802,723
Temporarily restricted – gifts from annuities, trustsand promises to give 49,007,923 40,779,219
Permanently restricted 6,925,211 4,606,960 Total net assets 240,680,594 226,283,115
Total liabilities and net assets 289,026,227 $ 269,606,608 $
See notes to consolidated financial statements.

4
The Heritage Foundation and Affiliates
Consolidated Statements of ActivitiesYears Ended December 31, 2016 and 2015
2016 2015Changes in unrestricted net assets:
Support and revenue:Public support – contributions 58,613,777 $ 76,045,217 $ Investment gain (loss), net 12,738,695 (99,228) Rental and other income 2,975,778 2,259,589 Net assets released from restriction – satisfaction of
time or program restrictions 10,877,190 13,077,591 Total unrestricted support and revenue 85,205,440 91,283,169
Expenses:Program services:
Research 24,777,934 24,556,292 Media and government relations 10,330,910 8,511,139 Educational programs 28,431,409 31,131,429
Total program services 63,540,253 64,198,860
Supporting services:Management and general 2,439,865 2,377,143 Fundraising 15,374,798 14,048,683
Total supporting services 17,814,663 16,425,826
Total expenses 81,354,916 80,624,686
Change in unrestricted net assets 3,850,524 10,658,483
Changes in temporarily restricted net assets:Contributions 18,604,572 11,501,433 Investment gain (loss), net 1,693,825 (289,059) Change in value of split-interest agreements (629,588) (875,411) Change in value of pledges and irrevocable trusts (562,915) 16,624 Net assets released from restrictions (10,877,190) (13,077,591)
Change in temporarily restricted net assets 8,228,704 (2,724,004)
Changes in permanently restricted net assets:Contributions 2,318,251 1,206,960
Change in permanently restricted net assets 2,318,251 1,206,960
Change in net assets 14,397,479 9,141,439
Net assets:Beginning 226,283,115 217,141,676
Ending 240,680,594 $ 226,283,115 $
See notes to consolidated financial statements.

5
The Heritage Foundation and Affiliates
Consolidated Statements of Cash FlowsYears Ended December 31, 2016 and 2015
2016 2015Cash flows from operating activities:
Change in net assets 14,397,479 $ 9,141,439 $ Adjustments to reconcile change in net assets to net cash
(used in) provided by operating activities:Net realized and unrealized (gain) loss on investments (14,318,286) 500,756 Change in value of split-interest obligations 629,588 593,279 Increase in discount on contributions receivable 348,180 8,617 Change in value of terminated split-interest obligations 33,394 (9,638) Depreciation 4,101,357 4,071,116 (Gain) loss on disposal of assets (76,564) (207,018) Change in value of interest rate swap (302,216) 165,019 Contributions restricted to investment in perpetuity (2,818,251) (1,206,960) Contributed property (750,000) (1,794,033) Changes in assets and liabilities:
(Increase) decrease in:Contributions receivable (3,323,926) 5,918,542 Prepayments and other assets (359,691) 269,711
Increase (decrease) in:Accounts payable and accrued expenses 1,607,974 392,459
Net cash (used in) provided by operating activities (830,962) 17,843,289
Cash flows from investing activities:Purchases of investments (28,454,960) (34,968,355) Sales of investments 38,619,237 24,588,026 Purchases of property and equipment (12,636,564) (9,049,667) Change in cash surrender value of life insurance (69,249) 4,684
Net cash used in investing activities (2,541,536) (19,425,312)
Cash flows from financing activities: Proceeds from notes payable 5,000,000 - Principal payments on notes payable (533,126) (518,066) Proceeds from the line of credit 17,544,384 9,246,609 Payments on the line of credit (17,544,384) (9,246,609) Contributions restricted to investment in perpetuity 2,818,251 1,206,960 Payments on split interest obligations (1,510,942) (1,535,936) Proceeds from split interest obligations 357,469 282,132
Net cash provided by (used in) financing activities 6,131,652 (564,910)
Net increase (decrease) in cash and cash equivalents 2,759,154 (2,146,933)
Cash and cash equivalents:Beginning 4,660,363 6,807,296
Ending 7,419,517 $ 4,660,363 $
Supplemental disclosures of cash flow information:Interest paid 743,000 $ 601,780 $
Net increase (decrease) in cash surrender value of life insurance 69,249 $ (4,684) $
See notes to consolidated financial statements.
The Heritage Foundation and Affiliates Notes to Consolidated Financial Statements
6
Note 1. Nature of Activities and Significant Accounting Policies
Nature of activities: The Heritage Foundation and Affiliates (the Foundation) is composed of the following entities: The Heritage Foundation, 3rd Street Properties, LLC, Massachusetts Avenue Properties, LLC and Intern Housing, LLC. Founded in 1973, The Heritage Foundation is an educational and research institute – a think tank – whose mission is to formulate and promote conservative public policies based on the principles of free enterprise, limited government, individual freedom, traditional American values, and a strong national defense. The Foundation pursues this mission by performing timely, accurate research on key policy issues, and effectively marketing these findings to its primary audiences who are members of Congress, key congressional staff, policy makers in the Executive Branch, the nation’s news media, the academic and policy communities, and its donors and the public at large. The Foundation’s vision is to build an America where freedom, opportunity, prosperity and civil society flourish. The Heritage Foundation is the sole member of three Limited Liability Companies that are used for a variety of purposes. 3rd Street Properties, LLC is a Limited Liability Company used to purchase and hold real estate property. Massachusetts Avenue Properties, LLC is a Limited Liability Company used to purchase and hold real estate property. Intern Housing LLC, is a Limited Liability Company that operates an intern housing program. A summary of significant accounting policies of the Foundation follows: Basis of accounting: The accompanying consolidated financial statements are presented in accordance with the accrual basis of accounting, whereby unconditional support is recognized when received, revenue is recognized when earned, and expenses are recognized when incurred. Principles of consolidation: All intercompany accounts and transactions between The Heritage Foundation, 3rd Street Properties, LLC, Massachusetts Avenue Properties, LLC and Intern Housing, LLC, have been eliminated in the consolidated financial statements. Basis of presentation: The consolidated financial statement presentation follows the recommendation of the Financial Accounting Standards Board (FASB) Accounting Standards Codification (the Codification). As required by the Not-for-Profit Entities topics of the Codification, Balance Sheet and Income Statement, the Foundation is required to report information regarding its financial position and activities according to three classes of net assets: unrestricted, temporarily restricted and permanently restricted. Unrestricted net assets: Net assets representing unrestricted resources available to support the Foundation’s operations and temporarily restricted resources that become available for use in the year given by satisfying donor-imposed time or purpose restrictions. Unrestricted net assets include both board-designated and undesignated funds. The Board of Trustees has approved the establishment of an operating reserve (designated fund) to provide working capital and financing stability for the Foundation in the future. Funds have also been designated by the Board for certain programs and capital acquisitions. Total designated funds at December 31, 2016 and 2015, totaled $110,975,192 and $107,094,213, respectively. The undesignated fund constitutes the Foundation’s operating fund and net investment in property, plant and equipment net of related liabilities.
The Heritage Foundation and Affiliates Notes to Consolidated Financial Statements
7
Note 1. Nature of Activities and Significant Accounting Policies (Continued)
Temporarily restricted net assets: Net assets subject to donor-imposed stipulations that will be met either by actions of the Foundation and/or the passage of time. When a donor-imposed restriction expires due to accomplishing the stipulated purpose or through passage of time, temporarily restricted net assets are reclassified to unrestricted net assets and reported in the consolidated statements of activities as net assets released from restrictions.
Permanently restricted net assets: Net assets subject to donor-imposed stipulations that they be maintained permanently by the Foundation, typically with earned investment income used for donor-restricted purposes. Cash and cash equivalents: The Foundation considers all highly liquid investments purchased with an initial maturity of three months or less to be cash equivalents. Cash equivalents held temporarily in the investment portfolio are excluded from cash and cash equivalents. Financial risk: The Foundation maintains its cash in bank deposit accounts and money market accounts, which, at times, may exceed federally insured limits. The Foundation has not experienced any losses in such accounts and believes it is not exposed to any significant financial risk on cash balances. The Foundation invests in a professionally managed portfolio that contains various securities that are exposed to risks such as interest rate, market and credit. Due to the level of risk associated with such investments and the level of uncertainty related to changes in the value of such investments, it is at least reasonably possible that changes in risks in the near term would materially affect investment balances and the amounts reported in the consolidated financial statements. Contributions receivable and support and revenue: The Foundation recognizes support and revenue for unconditional contributions received, including those contributions received in the form of unconditional promises to give or pledges. These promises to give are classified as contributions receivable on the consolidated statements of financial position. As of December 31, 2016, the Foundation had an outstanding conditional matching pledge totaling $8,000,000. Contributions receivable that are expected to be collected within one year are recorded at net realizable value. Contributions receivable that are expected to be collected in future years are discounted at an appropriate rate commensurate with the risks involved. Amortization of the discount is included in the change in value of pledges and irrevocable trusts on the consolidated statements of activities. An allowance for uncollectible pledges is recorded based on estimated amounts not expected to be collected. At December 31, 2016 and 2015, there was no allowance for uncollectible amounts recorded. Investments: Investments with readily determinable fair values are reported at fair value with gains and losses included in the consolidated statements of activities. Other investments in partnerships, hedge funds, trusts, LLCs and private equity are reported at fair value based on a practical expedient, the net asset value per share or equivalent, determined by the fund or the investment manager at the measurement date. The estimated values, provided by the fund or the investment manager, are subject to an annual independent audit, and are reviewed by management for reasonableness. The Foundation believes the carrying amount of these financial instruments is a reasonable estimate of fair value. Accordingly, the estimated fair values may differ significantly from the values that would have been used had a ready market existed for these investments. Estate gifts: The Foundation is the beneficiary under various wills and other agreements, the total realizable amounts of which are not presently determinable. The Foundation’s share of such amounts is not recorded until the Foundation has an irrevocable right to the bequest and the proceeds are measurable.

The Heritage Foundation and Affiliates Notes to Consolidated Financial Statements
8
Note 1. Nature of Activities and Significant Accounting Policies (Continued)
Property and equipment: Property and equipment consists of land, buildings, building improvements, office furniture and equipment, which are stated at cost as of the date of acquisition or, for gifts-in-kind, the fair market value at the date of donation. Depreciation is recognized on a straight-line basis over estimated useful lives of 3 to 39 years for building and building improvements, and 3 to 10 years for office furniture and equipment. The Foundation began capitalizing individual property and equipment purchases with a cost of $5,000 or more. Valuation of long-lived assets: Long-lived assets and certain identifiable intangible assets are reviewed for impairment whenever events or changes in circumstances indicate that the carrying amount of an asset may not be recoverable. Recoverability of the long-lived asset is measured by a comparison of the carrying amount of the asset to future undiscounted net cash flows expected to be generated by the asset. If such assets are considered to be impaired, the impairment to be recognized is measured by the amount by which the carrying amount of the assets exceeds the estimated fair value of the assets. Assets to be disposed of are reportable at the lower of the carrying amount or fair value, less costs to sell. The Foundation had no impairment of long-lived assets during 2016 or 2015. Cash surrender value of insurance: During 1999, the Foundation entered into a split-dollar insurance agreement with the Foundation’s then president. The Foundation made premium payments to fund the life insurance policy. The then president assigned the cash surrender value and proceeds from the death benefit of the policy to the Foundation to the extent of the Foundation’s cumulative premium payments. Derivative financial instruments: The Foundation has entered into two interest rate swap agreements to manage the interest rate exposure on the notes payable. The fair values of the interest rate swap agreements are the estimated amount that the bank or financial institution would receive or pay to terminate the swap agreements at the reporting date, taking into account current interest rates and the current credit worthiness of the swap counter parties. Such interest rate swaps are accounted for under the Codification topic, Derivatives and Hedging. As a not-for-profit organization, the Foundation is not allowed to use cash flow hedging. Therefore, the interest rate swaps are recorded in the consolidated statements of financial position at fair value. The changes in the fair values are reflected in other income in the consolidated statements of activities. The fair values of the interest rate swap liabilities at December 31, 2016 and 2015, were $(1,116,372) and $(1,418,588), respectively, and are included in long-term notes payable in the accompanying consolidated statements of financial position. Split-interest agreements: Contributions received in the form of irrevocable split-interest agreements (charitable gift annuities and charitable trusts) are recorded as contribution support at the present value of amounts expected to transfer to the Foundation at the estimated date of death of the current beneficiaries, which is estimated using Internal Revenue Service mortality tables and discount rates commensurate with the risks involved, ranging from 1% to 6%. Any subsequent changes in the value of the split-interest obligations are recorded as change in value of split-interest obligations in the consolidated statements of activities. During the life of the beneficiary or for the specified period of time, the Foundation pays the donor, or other specified parties, amounts as determined in the donor agreement. Upon fulfillment of the beneficiary payments or termination of the trust, the remaining assets are available to the Foundation for unrestricted purposes.
The Heritage Foundation and Affiliates Notes to Consolidated Financial Statements
9
Note 1. Nature of Activities and Significant Accounting Policies (Continued)
Income tax status: The Heritage Foundation is a nonprofit organization exempt from federal income taxes under Section 501(a), as an entity described in Section 501(c)(3) of the Internal Revenue Code of 1986. The Heritage Foundation has been classified by the Internal Revenue Service as a public charity and is not a private foundation. Contributions to The Heritage Foundation are deductible for federal income, estate and gift tax purposes. Income which is not related to exempt purposes is subject to tax. 3rd Street Properties, LLC, Massachusetts Avenue Properties, LLC, and Intern Housing, LLC, are limited liability companies whose sole member is The Heritage Foundation. Consequently, 3rd Street Properties, LLC, Massachusetts Avenue Properties, LLC, and Intern Housing, LLC, are disregarded entities for federal and state income tax purposes. Management evaluated the Foundation’s tax positions and concluded that the Foundation had taken no uncertain tax positions that require adjustment to the consolidated financial statements. Allocation of joint costs: The Foundation incurred joint costs of $12,641,834 and $12,893,090 for the years ended December 31, 2016 and 2015, respectively. The Foundation allocated these joint costs among program and fundraising expenses as follows:
2016 2015
Educational programs expense 10,209,296 $ 10,733,741 $ Fundraising expense 2,432,538 2,159,349
12,641,834 $ 12,893,090 $ Advertising costs: Advertising costs are expensed when incurred. Total advertising expense was $1,235,248 and $1,164,300 for the years ended December 31, 2016 and 2015, respectively. Use of estimates: The preparation of consolidated financial statements requires management to make estimates and assumptions that affect the reported amounts of assets and liabilities, and disclosure of contingent assets and liabilities at the date of the consolidated financial statements, and the reported amounts of support and revenue and expenses during the reporting period. Actual results could differ from those estimates. Functional allocation of expenses: The costs of providing various program and supporting activities have been summarized on a functional basis in the accompanying statements of activities. Accordingly, certain costs have been allocated among the programs and supporting services benefited. Pending accounting pronouncements: In August 2016, the FASB issued Accounting Standards Update (ASU) No. 2016-14, Not-for-Profit Entities (Topic 958): Presentation of Financial Statements of Not-for-Profit Entities. The amendments in this ASU make improvements to the information provided in financial statements and accompanying notes of not-for-profit entities. The amendments set forth the FASB’s improvements to net asset classification requirements and the information presented about a not-for-profit entity’s liquidity, financial performance and cash flows. The ASU will be effective for fiscal years beginning after December 15, 2017. Earlier application is permitted. The changes in this ASU should generally be applied on a retrospective basis in the year that the ASU is first applied. In February 2016, the FASB issued ASU 2016-02, Leases (Topic 842). A lessee is required to record a right-of-use asset and a lease liability for all leases with a term of greater than 12 months. Leases with a term of 12 months or less will be accounted for similar to existing guidance for operating leases today. The standard is effective on January 1, 2020, with early adoption permitted.

The Heritage Foundation and Affiliates Notes to Consolidated Financial Statements
10
Note 1. Nature of Activities and Significant Accounting Policies (Continued)
Subsequent events: The Foundation evaluated subsequent events through May 18, 2017, which is the date the consolidated financial statements were available to be issued.
Note 2. Contributions Receivable
The following are unconditional promises to give at December 31, 2016 and 2015:
2016 2015
Due in less than one year 7,142,526 $ 8,145,678 $ Due in one to five years 5,825,000 3,477,922 Due in greater than five years 2,010,000 30,000
Total to be received 14,977,526 11,653,600 Less discounting for multi-year promises to give (rates of 1.11% - 3.13%) (477,925) (129,745)
14,499,601 $ 11,523,855 $
Note 3. Investments
See Note 4 for details on the composition of the investment portfolio at December 31, 2016 and 2015. The following summarizes investment income (loss) for the years ended December 31, 2016 and 2015:
2016 2015
Net realized and unrealized gain (loss) 14,318,286 $ (500,756) $ Interest and dividends 114,234 112,469
14,432,520 $ (388,287) $
Note 4. Fair Value Measurements
The Foundation follows the Codification topic, Fair Value Measurement, which defines fair value as the price that would be received to sell an asset or paid to transfer a liability in an orderly transaction between market participants at the measurement date and sets out a fair value hierarchy. The fair value hierarchy gives the highest priority to quoted prices in active markets for identical assets or liabilities (Level 1) and the lowest priority to unobservable inputs (Level 3). Inputs are broadly defined as assumptions market participants would use in pricing an asset or liability. The three levels of the fair value hierarchy are described below: Level 1: Quoted market prices in active markets for identical assets or liabilities. Level 2: Observable market based inputs or unobservable inputs that are corroborated by market data. Level 3: Unobservable inputs that are not corroborated by market data.
The Heritage Foundation and Affiliates Notes to Consolidated Financial Statements
11
Note 4. Fair Value Measurements (Continued)
In determining the appropriate levels, the Foundation performs a detailed analysis of the assets and liabilities that are subject to the topic. At each reporting period, all assets and liabilities for which the fair value measurement is based on significant unobservable inputs are classified as Level 3. At each reporting period, transfers between levels are recognized on the actual date of the event or change in circumstances that caused the transfer in accordance with the Foundation’s accounting policy regarding the recognition of transfers between levels of the fair value hierarchy. Publicly traded securities are classified as Level 1 instruments because they comprise assets traded on public exchanges with readily determinable fair values and observable market based inputs. As of December 31, 2016 and 2015, 77% and 72%, respectively, of capital committed to the private equity funds has been called. Common trust funds (CTF) are unregistered bank investment products that pool fiduciary client assets. There were no unfunded commitments related to the CTF and the funds can be redeemed daily with no notice period. Multi-strategy equity pooled separate accounts (PSA) are valued based on the fair value of the underlying assets in the PSA and the number of units in each PSA owned by the Foundation as a percentage of the total number of units in the PSA. A valuation agent is selected by Lincoln National Life Insurance Company for each PSA. The valuation agent calculates the net assets of the account on each open market day. There were no unfunded commitments related to the PSA and the funds can be redeemed daily with no notice period. Guarantee income fund is valued at a contract value reported by the insurance company. Contract value represents contributions made under the contract, plus earnings, less participant withdrawals and administrative expenses. The guarantee contract is invested primarily in publicly traded and privately placed debt securities and mortgage loans. Funds can be withdrawn to be placed in separate funds upon request. Withdrawals may be deferred for up to six months if it is determined that investment conditions prevent an orderly sale of investments. The deferred compensation plan obligations are based on the fair market value of the deferred compensation plan assets, which are observable inputs; however, the liabilities are not publicly traded and are, therefore, considered Level 2 items. The interest rate swaps connected to the Foundation’s term loan financing are classified as Level 2 instruments because their values are a function of the difference between the interest rate on the Foundation’s notes payable and the rates in the swap agreements; hence there are observable market based inputs.
The Heritage Foundation and Affiliates Notes to Consolidated Financial Statements
12
Note 4. Fair Value Measurements (Continued)
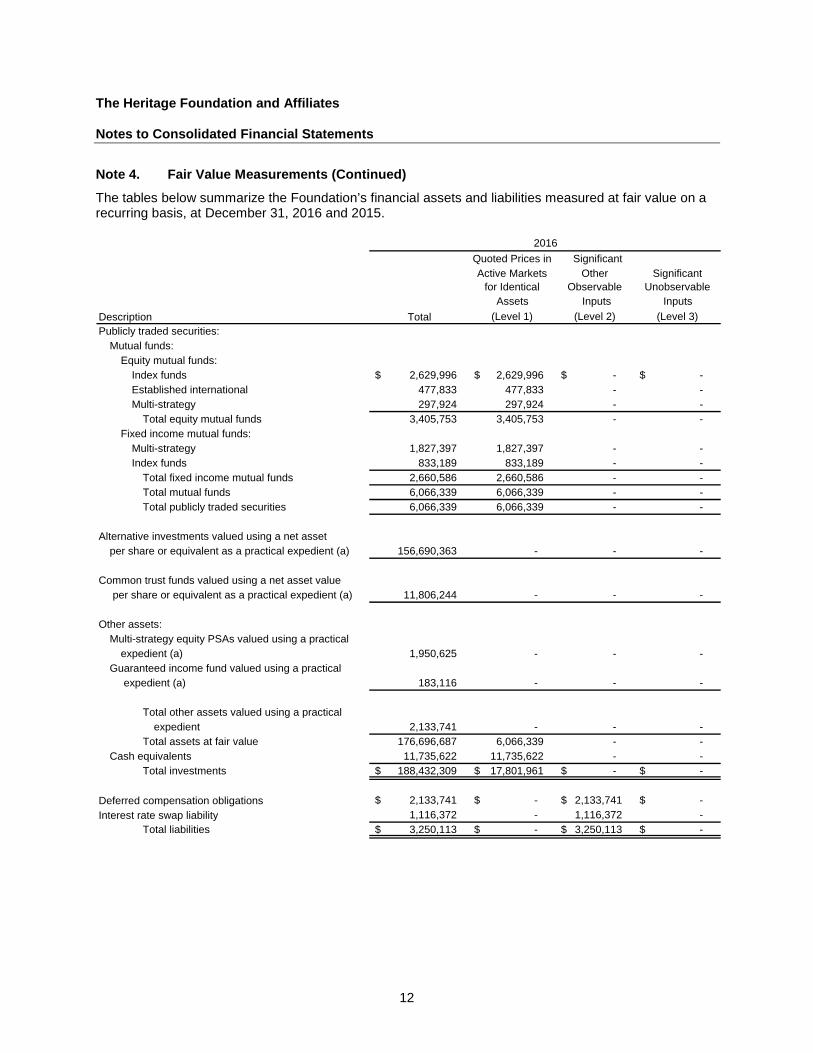
The tables below summarize the Foundation’s financial assets and liabilities measured at fair value on a recurring basis, at December 31, 2016 and 2015.
Quoted Prices in Significant Active Markets
for IdenticalOther
ObservableSignificant
UnobservableAssets Inputs Inputs
Description Total (Level 1) (Level 2) (Level 3)Publicly traded securities:
Mutual funds:Equity mutual funds:
Index funds 2,629,996 $ 2,629,996 $ -$ -$ Established international 477,833 477,833 - - Multi-strategy 297,924 297,924 - -
Total equity mutual funds 3,405,753 3,405,753 - - Fixed income mutual funds:
Multi-strategy 1,827,397 1,827,397 - - Index funds 833,189 833,189 - -
Total fixed income mutual funds 2,660,586 2,660,586 - - Total mutual funds 6,066,339 6,066,339 - - Total publicly traded securities 6,066,339 6,066,339 - -
Alternative investments valued using a net asset per share or equivalent as a practical expedient (a) 156,690,363 - - -
Common trust funds valued using a net asset value per share or equivalent as a practical expedient (a) 11,806,244 - - -
Other assets:Multi-strategy equity PSAs valued using a practical
expedient (a) 1,950,625 - - - Guaranteed income fund valued using a practical
expedient (a) 183,116 - - -
Total other assets valued using a practicalexpedient 2,133,741 - - -
Total assets at fair value 176,696,687 6,066,339 - - Cash equivalents 11,735,622 11,735,622 - -
Total investments 188,432,309 $ 17,801,961 $ -$ -$
Deferred compensation obligations 2,133,741 $ -$ 2,133,741 $ -$ Interest rate swap liability 1,116,372 - 1,116,372 -
Total liabilities 3,250,113 $ -$ 3,250,113 $ -$
2016
The Heritage Foundation and Affiliates Notes to Consolidated Financial Statements
13
Note 4. Fair Value Measurements (Continued)
Quoted Prices in Significant Active Markets
for IdenticalOther
ObservableSignificant
UnobservableAssets Inputs Inputs
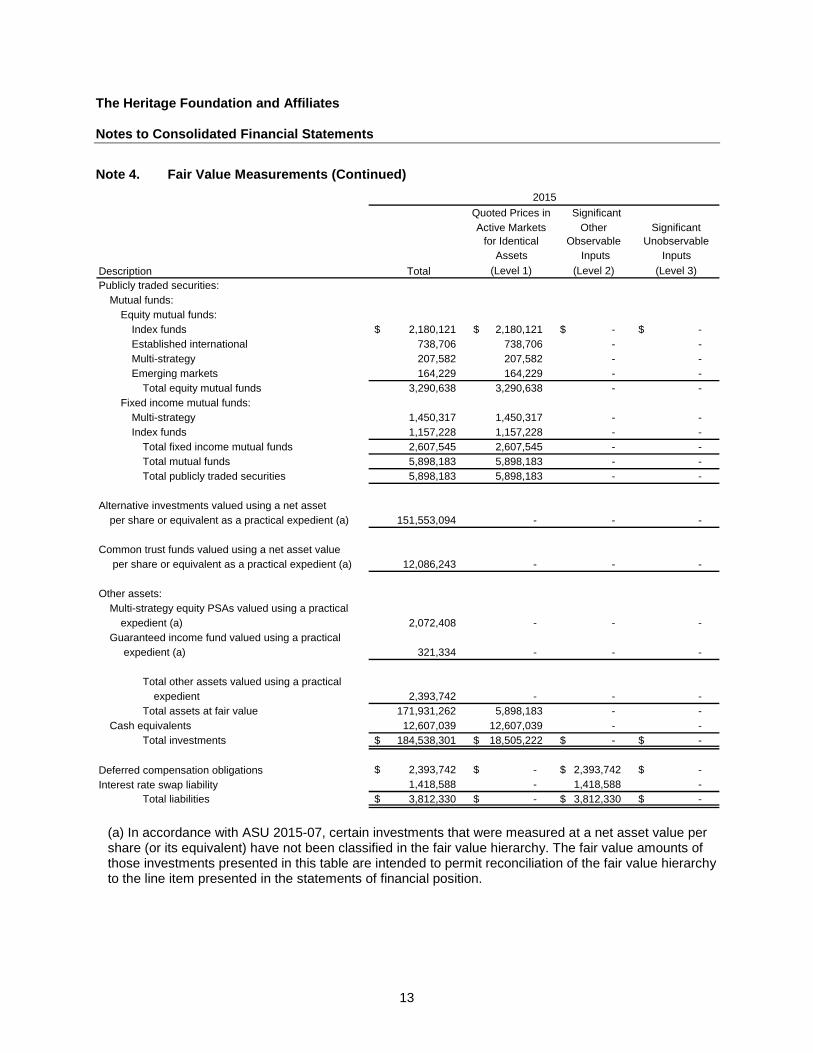
Description Total (Level 1) (Level 2) (Level 3)Publicly traded securities:
Mutual funds:Equity mutual funds:
Index funds 2,180,121 $ 2,180,121 $ -$ -$ Established international 738,706 738,706 - - Multi-strategy 207,582 207,582 - - Emerging markets 164,229 164,229 - -
Total equity mutual funds 3,290,638 3,290,638 - - Fixed income mutual funds:
Multi-strategy 1,450,317 1,450,317 - - Index funds 1,157,228 1,157,228 - -
Total fixed income mutual funds 2,607,545 2,607,545 - - Total mutual funds 5,898,183 5,898,183 - - Total publicly traded securities 5,898,183 5,898,183 - -
Alternative investments valued using a net asset per share or equivalent as a practical expedient (a) 151,553,094 - - -
Common trust funds valued using a net asset value per share or equivalent as a practical expedient (a) 12,086,243 - - -
Other assets:Multi-strategy equity PSAs valued using a practical
expedient (a) 2,072,408 - - - Guaranteed income fund valued using a practical
expedient (a) 321,334 - - -
Total other assets valued using a practicalexpedient 2,393,742 - - -
Total assets at fair value 171,931,262 5,898,183 - - Cash equivalents 12,607,039 12,607,039 - -
Total investments 184,538,301 $ 18,505,222 $ -$ -$
Deferred compensation obligations 2,393,742 $ -$ 2,393,742 $ -$ Interest rate swap liability 1,418,588 - 1,418,588 -
Total liabilities 3,812,330 $ -$ 3,812,330 $ -$
2015
(a) In accordance with ASU 2015-07, certain investments that were measured at a net asset value per share (or its equivalent) have not been classified in the fair value hierarchy. The fair value amounts of those investments presented in this table are intended to permit reconciliation of the fair value hierarchy to the line item presented in the statements of financial position.

The Heritage Foundation and Affiliates Notes to Consolidated Financial Statements
14
Note 4. Fair Value of Financial Instruments (Continued)
The following table provides additional disclosures on the Foundation’s alternative investment assets at December 31, 2016 and 2015:
Fair Fair Value at Value at Unfunded Redemption Redemption
2016 2015 Commitments Frequency Notice Period
Multi-Strategy(a) 104,781,314 $ 104,990,641 $ N/A Daily 1 dayGlobal Equity Opportunistic (b) 21,800,606 21,320,788 N/A Quarterly 30 daysFixed Income(c) 17,140,340 12,538,114 N/A Daily 1 dayPrivate Equity(d) 9,153,962 9,201,650 3,137,778 $ N/A(e) N/A(e)
Event-Driven(f) 3,814,141 3,501,901 N/A Quarterly to Semi-annual 60 daysTotal 156,690,363 $ 151,553,094 $
(a) Multi-strategy managers employ a combination of any of the above mentioned strategies and may
shift amongst those strategies at any time as conditions permit. 2% of the investment balance in this category is in the process of being liquidated. As such, the redemption frequency or notice period shown relate to those multi-strategy investments not currently planned for liquidation.
(b) Global Equity Opportunistic refers to investments in equity securities across worldwide markets, not
restricted to specific regions or market capitalization. (c) Fixed Income managers use a multi-strategy approach and invest in a broad range of sectors and
ratings. These managers seek to manage risk in an overall portfolio and seek returns for the investor. (d) Private Equity represents securities in operating companies that are not publicly traded on an
exchange. This could be achieved through private equity investment funds, direct co-investments in individual portfolio companies, secondary private equity offerings or direct and indirect investments in privately and publicly issued debt securities and privately issued equity securities of companies that are currently experiencing financial and/or operational distress.
(e) Private Equity partnerships permit redemption only amongst partners. As such, there is no
redemption frequency or notice period officially outlined in the investment agreement. (f) Event-Driven strategies are investments in opportunities created by significant transaction events,
such as spin-offs, mergers and acquisitions and reorganizations. These strategies include risk arbitrage, distressed situations investing, special situations and opportunistic investing.

The Heritage Foundation and Affiliates Notes to Consolidated Financial Statements
15
Note 5. Property and Equipment
Property and equipment and accumulated depreciation consist of the following at December 31, 2016 and 2015:
2016 2015
Land, building and improvements 80,677,582 $ 82,645,863 $ Contruction in progress 21,936,477 8,605,959 Office furniture and equipment 12,952,058 12,398,430
115,566,117 103,650,252 Less accumulated depreciation (38,650,090) (36,095,996)
Property and equipment, net 76,916,027 $ 67,554,256 $ Depreciation expense for the years ended December 31, 2016 and 2015, totaled $4,101,357 and $4,071,116, respectively.
Note 6. Notes Payable
Notes payable as of December 31, 2016 and 2015, are as follows:
2016 2015
Notes payable 21,902,189 $ 17,435,315 $ Interest rate swap liability 568,772 727,915 Interest rate swap liability 547,600 690,673
23,018,561 18,853,903 Less current portion (548,805) (533,072)
Notes payable, long-term 22,469,756 $ 18,320,831 $ Interest expense for the years ended December 31, 2016 and 2015, was $743,042 and $637,524, respectively. The Foundation obtained a note with a financial institution. The loan amount was $5,186,560. At December 31, 2016 and 2015, the outstanding liability totaled $4,477,730 and $4,685,192, respectively. The principal balance is payable in 59 consecutive monthly installments. The unpaid principal balance of the note, plus accrued and unpaid interest, is due on June 12, 2018. The note is unsecured and requires that the Foundation maintain a debt service coverage ratio (as defined by the lending institution) of at least 1.20 to 1 and unrestricted liquidity of at least $50,000,000. The interest rate on this loan is the London Interbank Offered Rate (LIBOR) + 1.23%. The Foundation obtained a second note with a financial institution. The loan amount was $6,500,000. At December 31, 2016 and 2015, the outstanding liability totaled $5,996,181 and $6,149,105, respectively. The principal balance is payable in 119 consecutive monthly installments. The unpaid principal balance of the note, plus accrued and unpaid interest, is due on June 12, 2023. The note is unsecured and requires that the Foundation maintain a debt service coverage ratio (as defined by the lending institution) of at least 1.20 to 1 and unrestricted liquidity of at least $50,000,000. The interest rate on this loan is LIBOR + 1.37% however a forward starting interest rate swap was initiated effective in 2015, with a term matching the note at an effective rate of 4.94% per annum. The value of the interest rate swap liability was $568,772 and $727,915 as of December 31, 2016 and 2015, respectively.

The Heritage Foundation and Affiliates Notes to Consolidated Financial Statements
16
Note 6. Notes Payable (Continued)
The Foundation obtained a third note with a financial institution. The loan amount was $7,000,000. At December 31, 2016 and 2015, the outstanding liability totaled $6,428,278 and $6,601,018, respectively. The principal balance is payable in 179 consecutive monthly installments. The unpaid principal balance of the note, plus accrued and unpaid interest, is due on June 12, 2028. The note is unsecured and requires that the Foundation maintain a debt service coverage ratio (as defined by the lending institution) of at least 1.20 to 1 and unrestricted liquidity of at least $50,000,000. The interest rate on this loan is LIBOR + 1.38%; however, an interest rate swap was initiated with term matching the note with an effective interest rate of 4.54%. The value of the interest rate swap liability was $547,600 and $690,673 as of December 31, 2016 and 2015, respectively. During the year ended December 31, 2015, the Foundation, obtained a closed ended note with a financial institution totaling $30,000,000 used to fund certain construction projects. Advances on the loan may be taken for 36 months from the date of commencement (the draw period) at a rate of LIBOR + 1.50%. During the draw period an unused fee of 12.5 basis points will be assessed. At the end of the draw period, principal and interest will be payable in 143 consecutive monthly installments on the outstanding principal balance based on a 25 year amortization. The note is unsecured and requires that the Foundation maintain a debt service coverage ratio (as defined by the lending institution) of at least 1.20 to 1 and unrestricted liquidity of at least $50,000,000. As of December 31, 2016 and 2015, the outstanding balance of the note was $5,000,000 and $0, respectively. As of December 31, 2016, minimum future principal payments under these notes are as follows: Years ending December 31:
2017 548,805 $ 2018 4,644,772 2019 574,860 2020 594,028 2021 613,074 Thereafter 14,926,650
21,902,189 $
Note 7. Line of Credit
The Foundation has a revolving bank line of credit of $10,000,000 from a financial institution. The revolving line of credit bears interest at LIBOR plus 115 basis points. It is unsecured and requires that the Foundation maintain a debt service coverage ratio of at least 1.20 to 1 and unrestricted liquidity of at least $50,000,000. The line of credit matures on September 30, 2017, and there was no outstanding balance at December 31, 2016 and 2015.
Note 8. Employee Benefits
Discretionary contribution plan: The Foundation provides a non-contributory discretionary contribution plan to all employees with at least one year of service who have attained the age of 21 and who worked at least 1,000 hours during the year. Expenses for the plan were approximately $2,078,000 and $1,930,000 for the years ended December 31, 2016 and 2015, respectively. Employees vest at 25% per year of service beginning after two years and are fully vested after five years. The Foundation also provides employees the opportunity to defer current compensation under a 403(b) plan. The Foundation makes no contributions to this plan.
The Heritage Foundation and Affiliates Notes to Consolidated Financial Statements
17
Note 8. Employee Benefits (Continued)
Deferred compensation plan: The Foundation provides employees the opportunity to defer current compensation under a 457(b) plan. Although the Foundation makes no contributions to these plans, the plan assets and related obligations to employees are includable on the Foundation’s consolidated statements of financial position. The total market value of all deferred compensation investments and the related deferred compensation obligations to employees was $2,133,741 and $2,393,742 at December 31, 2016 and 2015, respectively.
Note 9. Restricted Net Assets
The Foundation follows the Codification contents governing Reporting Endowment funds. The Codification addresses accounting issues related to guidelines in the Uniform Prudent Management of Institutional Funds Act of 2006 (UPMIFA), which was adopted by the National Conferences of Commissioners on Uniform State Laws in July 2006. The Foundation has interpreted UPMIFA as requiring the preservation of the fair value of original donor-restricted endowment gifts as of the date of the gift absent explicit donor stipulations to the contrary. As a result of this interpretation, the Foundation classifies as permanently restricted net assets (a) the original value of gifts donated to the permanent endowment, (b) the original value of subsequent gifts to the permanent endowment and (c) accumulations to the permanent endowment made in accordance with the direction of the applicable donor gift instrument at the time the accumulation is added to the fund. The remaining portion of donor-restricted endowment funds not classified in permanently restricted net assets is classified as temporarily restricted net assets until those amounts are appropriated for expenditure by the Foundation in a manner consistent with the standard of prudence prescribed by UPMIFA. In accordance with UPMIFA, the Foundation considers the following factors in making a determination to appropriate or accumulate donor-restricted endowment funds: • The purposes of the Foundation and donor-restricted endowment fund.
• The duration and preservation of the fund.
• General economic conditions.
• The possible effect of inflation and deflation.
• The expected total return from income and the appreciation of investments.
• Other available financial resources.
• Investment policies. The Foundation has adopted investment and spending policies for permanently restricted cash contributions that attempt to provide a predictable stream of funding to programs while maintaining purchasing power. The annual investment withdrawal is calculated at 5% of the three-year quarterly average of the investment market values at September 30. All earnings from these funds are reflected as temporarily restricted net assets until appropriated for program expenditures.
The Heritage Foundation and Affiliates Notes to Consolidated Financial Statements
18
Note 9. Restricted Net Assets (Continued)
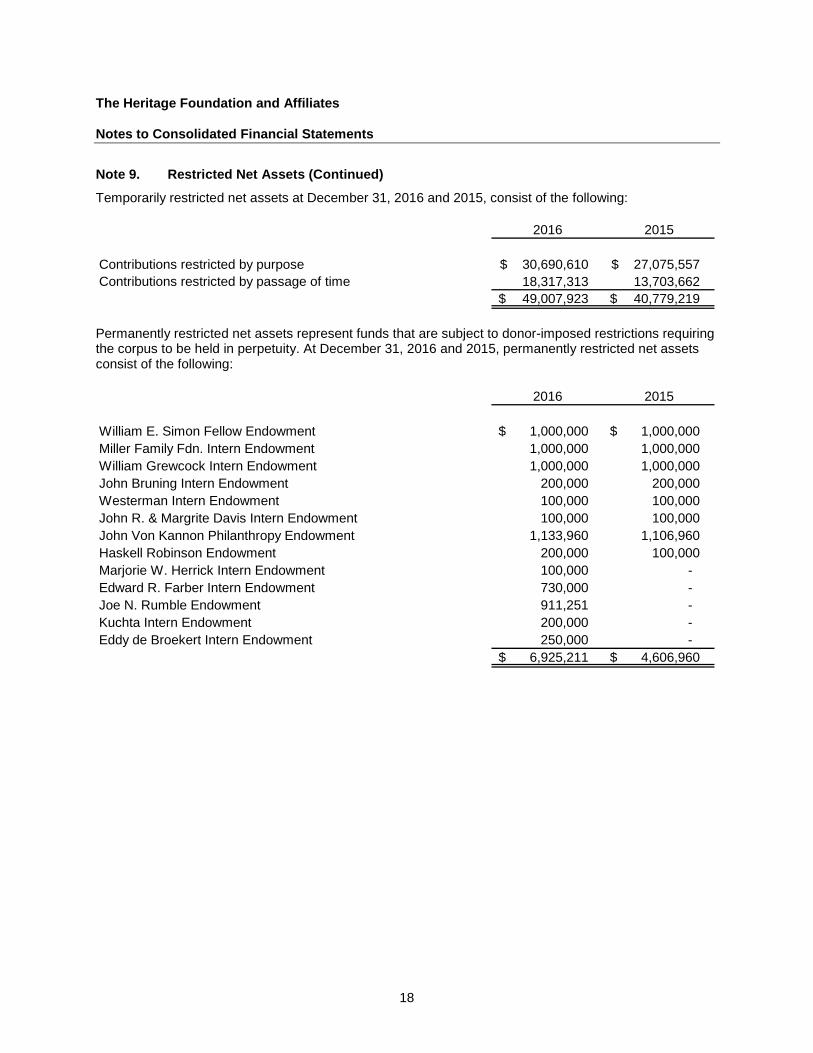
Temporarily restricted net assets at December 31, 2016 and 2015, consist of the following:
2016 2015
Contributions restricted by purpose 30,690,610 $ 27,075,557 $ Contributions restricted by passage of time 18,317,313 13,703,662
49,007,923 $ 40,779,219 $ Permanently restricted net assets represent funds that are subject to donor-imposed restrictions requiring the corpus to be held in perpetuity. At December 31, 2016 and 2015, permanently restricted net assets consist of the following:
2016 2015
William E. Simon Fellow Endowment 1,000,000 $ 1,000,000 $ Miller Family Fdn. Intern Endowment 1,000,000 1,000,000 William Grewcock Intern Endowment 1,000,000 1,000,000 John Bruning Intern Endowment 200,000 200,000 Westerman Intern Endowment 100,000 100,000 John R. & Margrite Davis Intern Endowment 100,000 100,000 John Von Kannon Philanthropy Endowment 1,133,960 1,106,960 Haskell Robinson Endowment 200,000 100,000 Marjorie W. Herrick Intern Endowment 100,000 - Edward R. Farber Intern Endowment 730,000 - Joe N. Rumble Endowment 911,251 - Kuchta Intern Endowment 200,000 - Eddy de Broekert Intern Endowment 250,000 -
6,925,211 $ 4,606,960 $
The Heritage Foundation and Affiliates Notes to Consolidated Financial Statements
19
Note 9. Restricted Net Assets (Continued)
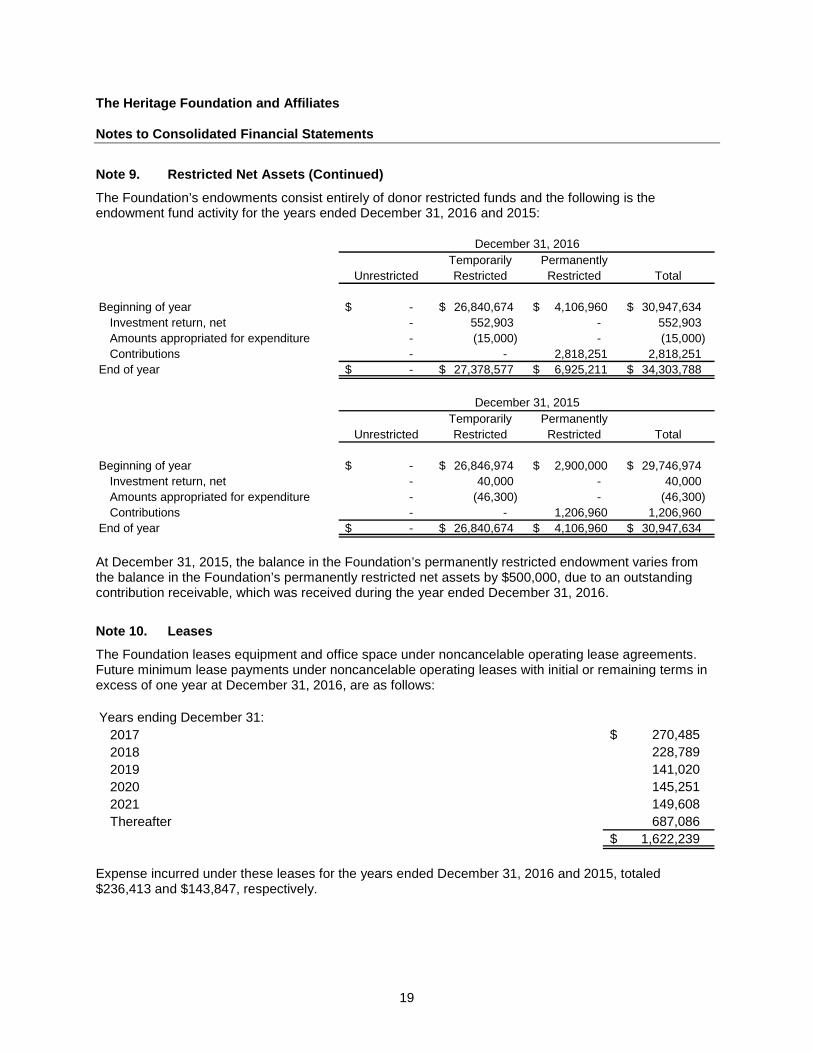
The Foundation’s endowments consist entirely of donor restricted funds and the following is the endowment fund activity for the years ended December 31, 2016 and 2015:
Temporarily PermanentlyUnrestricted Restricted Restricted Total
Beginning of year -$ 26,840,674 $ 4,106,960 $ 30,947,634 $ Investment return, net - 552,903 - 552,903 Amounts appropriated for expenditure - (15,000) - (15,000) Contributions - - 2,818,251 2,818,251
End of year -$ 27,378,577 $ 6,925,211 $ 34,303,788 $
Temporarily PermanentlyUnrestricted Restricted Restricted Total
Beginning of year -$ 26,846,974 $ 2,900,000 $ 29,746,974 $ Investment return, net - 40,000 - 40,000 Amounts appropriated for expenditure - (46,300) - (46,300) Contributions - - 1,206,960 1,206,960
End of year -$ 26,840,674 $ 4,106,960 $ 30,947,634 $
December 31, 2016
December 31, 2015
At December 31, 2015, the balance in the Foundation’s permanently restricted endowment varies from the balance in the Foundation’s permanently restricted net assets by $500,000, due to an outstanding contribution receivable, which was received during the year ended December 31, 2016.
Note 10. Leases
The Foundation leases equipment and office space under noncancelable operating lease agreements. Future minimum lease payments under noncancelable operating leases with initial or remaining terms in excess of one year at December 31, 2016, are as follows: Years ending December 31:
2017 270,485 $ 2018 228,789 2019 141,020 2020 145,251 2021 149,608 Thereafter 687,086
1,622,239 $ Expense incurred under these leases for the years ended December 31, 2016 and 2015, totaled $236,413 and $143,847, respectively.
The Heritage Foundation and Affiliates Notes to Consolidated Financial Statements
20
Note 11. Related Party Transactions
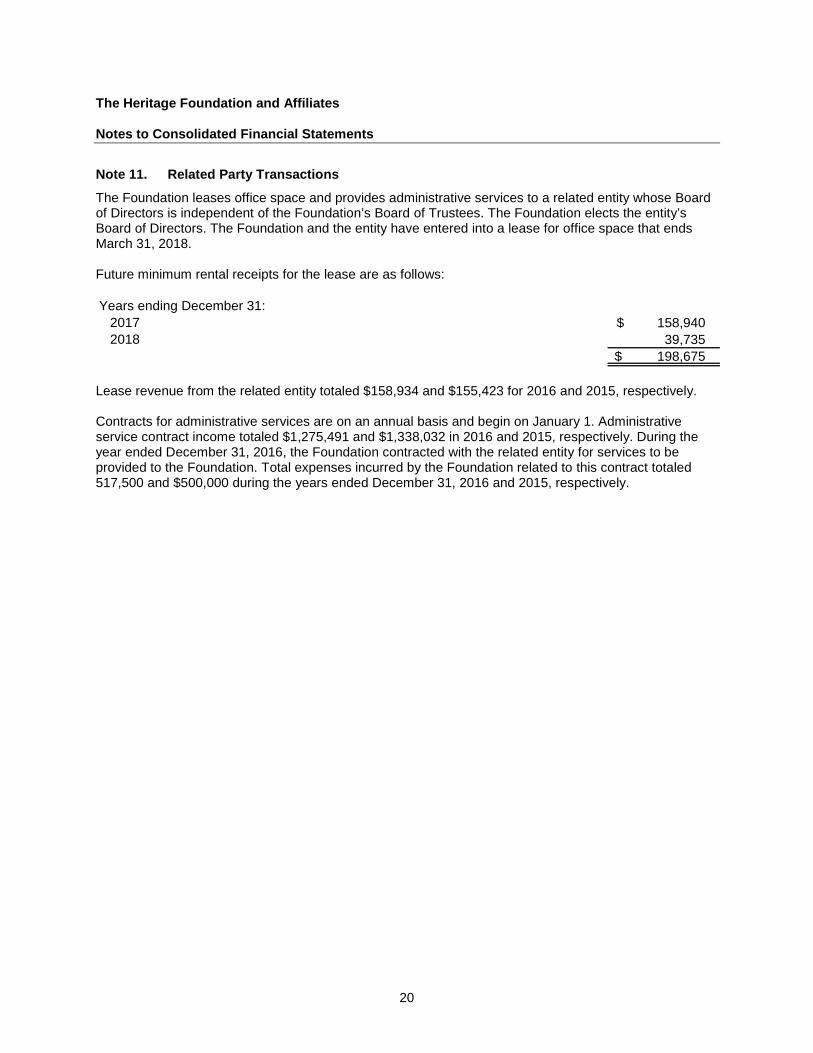
The Foundation leases office space and provides administrative services to a related entity whose Board of Directors is independent of the Foundation’s Board of Trustees. The Foundation elects the entity’s Board of Directors. The Foundation and the entity have entered into a lease for office space that ends March 31, 2018. Future minimum rental receipts for the lease are as follows: Years ending December 31:
2017 158,940 $ 2018 39,735
198,675 $ Lease revenue from the related entity totaled $158,934 and $155,423 for 2016 and 2015, respectively. Contracts for administrative services are on an annual basis and begin on January 1. Administrative service contract income totaled $1,275,491 and $1,338,032 in 2016 and 2015, respectively. During the year ended December 31, 2016, the Foundation contracted with the related entity for services to be provided to the Foundation. Total expenses incurred by the Foundation related to this contract totaled 517,500 and $500,000 during the years ended December 31, 2016 and 2015, respectively.
21
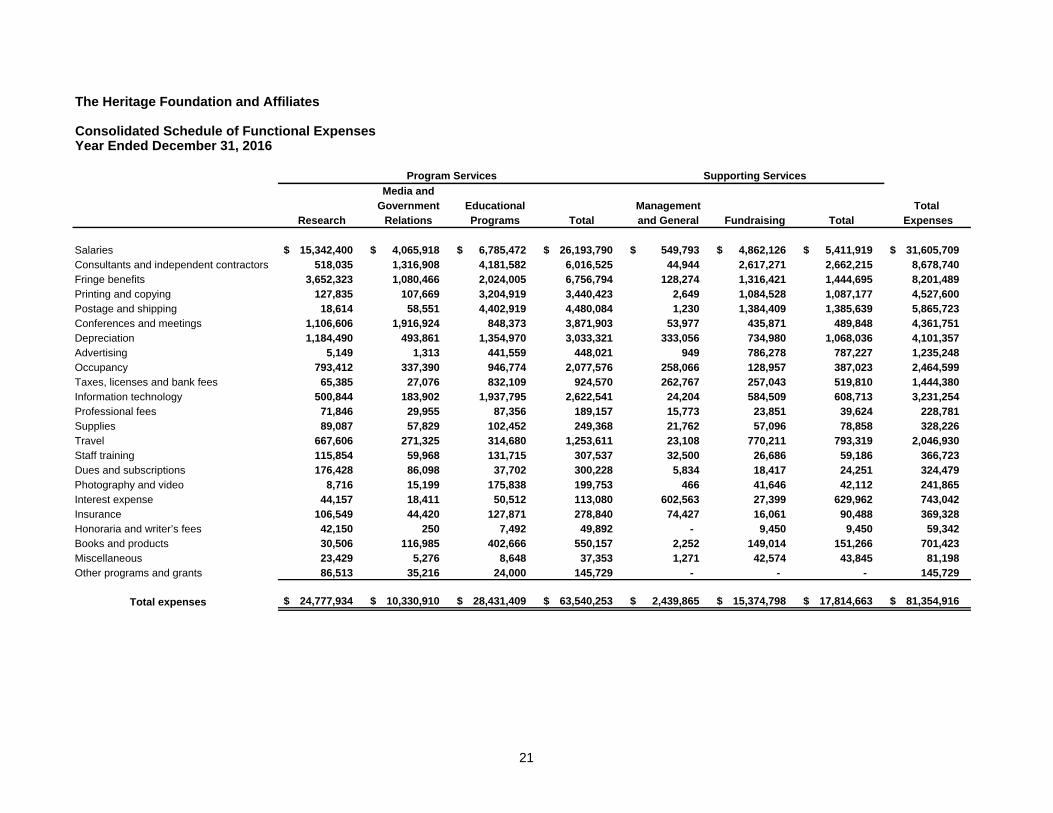
The Heritage Foundation and Affiliates
Consolidated Schedule of Functional ExpensesYear Ended December 31, 2016
Media andGovernment Educational Management Total
Research Relations Programs Total and General Fundraising Total Expenses
Salaries 15,342,400 $ 4,065,918 $ 6,785,472 $ 26,193,790 $ 549,793 $ 4,862,126 $ 5,411,919 $ 31,605,709 $ Consultants and independent contractors 518,035 1,316,908 4,181,582 6,016,525 44,944 2,617,271 2,662,215 8,678,740 Fringe benefits 3,652,323 1,080,466 2,024,005 6,756,794 128,274 1,316,421 1,444,695 8,201,489 Printing and copying 127,835 107,669 3,204,919 3,440,423 2,649 1,084,528 1,087,177 4,527,600 Postage and shipping 18,614 58,551 4,402,919 4,480,084 1,230 1,384,409 1,385,639 5,865,723 Conferences and meetings 1,106,606 1,916,924 848,373 3,871,903 53,977 435,871 489,848 4,361,751 Depreciation 1,184,490 493,861 1,354,970 3,033,321 333,056 734,980 1,068,036 4,101,357 Advertising 5,149 1,313 441,559 448,021 949 786,278 787,227 1,235,248 Occupancy 793,412 337,390 946,774 2,077,576 258,066 128,957 387,023 2,464,599 Taxes, licenses and bank fees 65,385 27,076 832,109 924,570 262,767 257,043 519,810 1,444,380 Information technology 500,844 183,902 1,937,795 2,622,541 24,204 584,509 608,713 3,231,254 Professional fees 71,846 29,955 87,356 189,157 15,773 23,851 39,624 228,781 Supplies 89,087 57,829 102,452 249,368 21,762 57,096 78,858 328,226 Travel 667,606 271,325 314,680 1,253,611 23,108 770,211 793,319 2,046,930 Staff training 115,854 59,968 131,715 307,537 32,500 26,686 59,186 366,723 Dues and subscriptions 176,428 86,098 37,702 300,228 5,834 18,417 24,251 324,479 Photography and video 8,716 15,199 175,838 199,753 466 41,646 42,112 241,865 Interest expense 44,157 18,411 50,512 113,080 602,563 27,399 629,962 743,042 Insurance 106,549 44,420 127,871 278,840 74,427 16,061 90,488 369,328 Honoraria and writer’s fees 42,150 250 7,492 49,892 - 9,450 9,450 59,342 Books and products 30,506 116,985 402,666 550,157 2,252 149,014 151,266 701,423 Miscellaneous 23,429 5,276 8,648 37,353 1,271 42,574 43,845 81,198 Other programs and grants 86,513 35,216 24,000 145,729 - - - 145,729
Total expenses 24,777,934 $ 10,330,910 $ 28,431,409 $ 63,540,253 $ 2,439,865 $ 15,374,798 $ 17,814,663 $ 81,354,916 $
Program Services Supporting Services

22
The Heritage Foundation and Affiliates
Consolidated Schedule of Functional ExpensesYear Ended December 31, 2015
Media andGovernment Educational Management Total
Research Relations Programs Total and General Fundraising Total Expenses
Salaries 14,952,768 $ 3,442,917 $ 7,224,588 $ 25,620,273 $ 443,793 $ 4,459,126 $ 4,902,919 $ 30,523,192 $ Consultants and independent contractors 735,461 1,111,588 4,909,733 6,756,782 47,544 2,413,363 2,460,907 9,217,689 Fringe benefits 3,231,181 846,252 1,832,821 5,910,254 104,481 1,158,604 1,263,085 7,173,339 Printing and copying 137,301 107,976 3,792,225 4,037,502 3,372 1,105,696 1,109,068 5,146,570 Postage and shipping 67,434 55,145 4,991,162 5,113,741 2,866 1,264,917 1,267,783 6,381,524 Conferences and meetings 1,251,784 1,112,456 975,537 3,339,777 65,092 457,457 522,549 3,862,326 Depreciation 1,190,470 412,613 1,506,897 3,109,980 280,065 681,071 961,136 4,071,116 Advertising 9,440 4,402 875,661 889,503 2,825 271,972 274,797 1,164,300 Occupancy 739,900 257,170 967,998 1,965,068 379,361 130,410 509,771 2,474,839 Taxes, licenses and bank fees 61,893 21,314 1,009,978 1,093,185 265,549 323,423 588,972 1,682,157 Information technology 497,979 174,286 1,565,911 2,238,176 23,891 561,952 585,843 2,824,019 Professional fees 89,041 30,861 113,081 232,983 89,250 23,856 113,106 346,089 Supplies 94,997 41,135 129,151 265,283 13,030 60,206 73,236 338,519 Travel 753,817 243,672 328,094 1,325,583 23,543 768,533 792,076 2,117,659 Staff training 137,484 48,399 172,042 357,925 37,833 29,497 67,330 425,255 Dues and subscriptions 243,815 306,550 61,303 611,668 5,362 54,449 59,811 671,479 Photography and video 13,101 24,594 310,517 348,212 2,518 175,461 177,979 526,191 Interest expense 35,666 12,362 45,146 93,174 523,946 20,404 544,350 637,524 Insurance 129,421 44,684 163,188 337,293 58,668 19,811 78,479 415,772 Honoraria and writer’s fees 82,912 740 63,221 146,873 - 2,700 2,700 149,573 Books and products 53,353 68,677 57,142 179,172 1,216 22,604 23,820 202,992 Miscellaneous 4,239 2,466 1,965 8,670 2,938 43,171 46,109 54,779 Other programs and grants 42,835 140,880 34,068 217,783 - - - 217,783
Total expenses 24,556,292 $ 8,511,139 $ 31,131,429 $ 64,198,860 $ 2,377,143 $ 14,048,683 $ 16,425,826 $ 80,624,686 $
Program Services Supporting Services