the global state of the pmo - strategyex-au.com · the global state of the pmo highlights the...
TRANSCRIPT

PB 1
The Global State of the PMOAn analysis for 2015
An ESI International study

2 3
The Global State of the PMO: An Analysis for 2015
2
2 3
Introduction
The Project / Programme Management Office (PMO) has become a deeply entrenched body in many organisations across the globe. Organisations are not just opting for one type of PMO function either. The Global State of the PMO highlights the different types, how many PMOs an organisation has, how they are funded and what type of value they provide to the business.
While the number of PMOs overall remains steady, its level of maturity has grown worldwide. Even though it is still early days, there is evidence that PMOs are increasingly moving away from just providing monitoring and controlling activities. Instead, they are moving up a level to provide support at a strategic and portfolio level.
As with previous Global State of the PMO reports, we also highlight the role of the PMO in supporting project delivery capability improvements and their work around training and develop-ment. We found that although the majority of PMOs are tasked with training project staff, human resources departments exercise the most control over the type of training delivered and the vendors who i mplement it.
In its fourth annual survey on the global state of the PMO, ESI International has endeavoured to investigate the PMO’s function, its role in the organisation, its value and its involvement in training project management professionals. Conducted online from March to April 2015, the global survey attracted over 900 respondents from five continents and from sectors such as energy, telecom-munications, engineering, financial services and IT. We polled project professionals who work in, with or alongside PMOs with respondents comprising 63 percent portfolio, programme or project managers; 12 percent PMO heads; and 7 percent senior- level management. A total of 42 percent of respondents work for companies with more than 10,000 employees. Employees from multina-tional firms comprised 65 percent of all respondents.
3 Introduction
6 Section 1: Personal & Company Profile
8 Section 2: PMO Structure & Function
14 Section 3: Role & Value of the PMO
22 Section 4: Skills Development & the Role of the PMO
30 Section 5: Agile on the Rise and a Looming Skills Crisis
34 Summary

4 5
Top Findings in the Survey
Two Out of Three PMOs are Involved in Training
Sixty-five percent surveyed said their PMO is involved in training. Top PMO involvement includes direct training in methodology and tools (70 percent), the ownership of core competencies and skills profiles for project management within the organisation (61 percent), hard skills development (52 percent) and coaching individuals and groups (52 percent). Soft skills development is still lagging, indicating a gap between the hard skills and soft skills offered. PMOs and HR will therefore need to work more closely together to close this gap.
Less Than One-Half of PMOs Offer a Defined PM Career Path
Overall, only 46 percent of the PMOs surveyed in 2015 offered a defined career path for its project management staff. When broken down by job title, only 37 percent of project managers have access to a career path; that number drops to 31 percent for programme managers and 18 percent for portfolio managers.
The Definition of PMO Success Remains the Same
Classic definitions of project success (on-time, to-budget delivery) are still the most used to determine PMO effectiveness. In 2015, 78 percent claimed to use these metrics. Interestingly, project/programme visibility status was the second most common tool for measurement (68 percent). Streamlined processes, greater project visibility, reporting and an expanded ability to take on larger projects, programmes and portfolios, were named the greatestsuccesses for PMOs in 2015.
Departmental and enterprise-wide PMOs rule
Three out of four surveyed have a PMO. The top five PMO functions include support and guidance around the methodology, management reporting (MI), support on project management tools, portfolio management and planning. Well over half of the PMOs had either a departmental or enterprise-wide scope, while about one out of five was situated at the programme level or Centre of Excellence. Just under half of the PMOs surveyed were tactical—or tactical with some strategic reach (46 percent). About one in four (26 percent) was either strategic or purely operational in nature.
An Increase in Tactical PMOs
While we can see that 26 percent of respondents thought their PMO was strategic i.e., providing a portfolio level service, this represents a minimal increase from the survey in 2013 (3 percent). The dominant group is a mixture of tactical and strategic influence (29 percent), which demonstrates a dramatic drop from 2013 where 43 percent reported that their PMO had a mixed influence. There has been an increase in tactical PMOs (from 6 percent in 2013 to 16 percent this year), which are responsible for a consistency in delivery methods hence classifying their services as a Centre of Excellence.
Future Funding is Secure
The future of PMO funding is secure, according to 74 percent surveyed, who thought PMO funding would either stay the same or increase next year. Just fewer than half the PMOs are funded by corporate overhead (49 percent) with an equal distribution funded within projects (18 percent) or programmes (18 percent). This distribution indicates that many PMOs will remain under executive scrutiny as senior management continues to hold the PMO’s purse strings.
4 5
The Greatest Perceived Challenge for PMOs is Resource Management
Resource management tops the list of challenges mentioned for PMOs in 2015. More specifically, one of the biggest ongoing challenges cited for PMOs was the lack of training and skilled resources in Agile projects.
Executives Continue to Challenge PMOs
Because half the PMOs are funded by corporate overhead, it is clear that the PMO will continue to be challenged by the C-suite. In this year’s survey, 72 percent of respondents claimed the PMO continues to be called into question mostly by senior management. The top three reasons for challeng-ing the PMO were its lack of perceived value (44 percent); its lack of project/programme maturity in the organisation (41 percent) and a lack of executive support (32 percent).
The PMO has Come of Age, Yet Value Perceptions are Lagging
The PMO is coming of age with 27 percent claiming full maturity, up from 20 percent last year. In the survey’s inception year (2010) only 15 percent of PMOs claimed full-blown maturity. At the same time, three out of four respondents said their PMO operates mainly from a tactical standpoint. Its perceived level of influence is actually much lower.
Agile is on the Rise
Great effort has been made to adopt Agile practices, either by staff mem-bers themselves or through external support, especially in larger organisa-tions—yet the majority of staff still have no practical experience using this method. Around two out of five PMOs use the Agile approach in some of their projects/programmes; while 54 percent use some type of Agile con-sultancy to help implement Agile successfully. Over half of those surveyed said the use of Agile has increased, either in the number or percentage of projects. We have seen large increases in Agile across all types of PMOs, especially the Centre of Excellence model. Project/ programme level PMOs had the most challenges when implementing Agile, which points to the need for organisational buy-in rather than trying to implement Agile from the bottom up. Of those that do not use Agile, one out of five claimed the reason was that they did not understand how to apply it. Well over half (54 percent) said they have no practical experience with Agile whatsoever.

6 7
Section 1: Personal & Company Profile
6

6 7 3
Respondents by Industry
The Organisation
About one in three survey respondents came from organisations with 1,000 to 10,000 employees. Two out of five came from even larger organisations. The IT sector dominated the pool of respondents with 16 percent coming from that industry, followed by 12 percent from financial services and nine percent from both the telecommunications and construction/engineering sectors.
The vast majority of respondents worked within organisations that provide a mix of internal and external client based programmes and projects. External projects were most popular amongst the smallest organisations with 100 to 250 employees.
The Project Professional
Among the project professionals surveyed, almost two out of five had more than 10 years’ experience. One out of four had between six and 10 years’ experience. In their current role, one out of three surveyed reported through the IT department or operations part of the business. Only six percent claimed they had no contact with the PMO whatsoever. An equal split either worked within the PMO or interfaced with it for project and programme de-livery (31 and 29 percent) while another 26 percent claimed they managed the PMO itself.
Personal & Company Profile
Aerospace / Defense 3%Automotive
Construction / Engineering
Education / Not For Profit
Energy
Entertainment
Financial Services
Food, Beverage & Tobacco
Government
ITManufacturing
Pharma & Healthcare
Professional Services
Retail
Telecommunications
Other
2%9%
4%8%
1%12%
1%4%
7%7%7%
1%
9%9%
16%

8 9
Section 2: PMO Structure & Function
8

8 9
What is Your PMO Structure?
The respondents to this year’s survey, however, show that the majority tended to work in or interfaced with an enterprise- wide PMO. Enterprise- wide PMOs have gained the spotlight in recent years due to the increasing interest in portfolio management and the desire to see increased alignment between the organisation strategy and the programmes and projects that deliver the changes required to meet the strategic goals.
Around 74 percent surveyed claimed they have a PMO, up slightly from the previous report in 2013 at 72 percent.
The majority of PMOs are located at a department level (35 percent) fol-lowed by a Centre of Excellence (26 percent). The more strategic enterprise- wide PMO lands at 23 percent of those surveyed with a PMO.
PMO Structure & Function
Enterprise wide i.e., responsible for alignment ofproject and programme work to corporate strategy 23%
Departmental level i.e., provides services to supporta business unit or division within an organisation
like an IT department35%
Project or Programme level i.e., a temporary entityestablished to support a specific project or programme 16%
Centre of Excellence i.e., supports project work byequipping the organisation with methodologies,
standards and tools, etc.26%
10 11
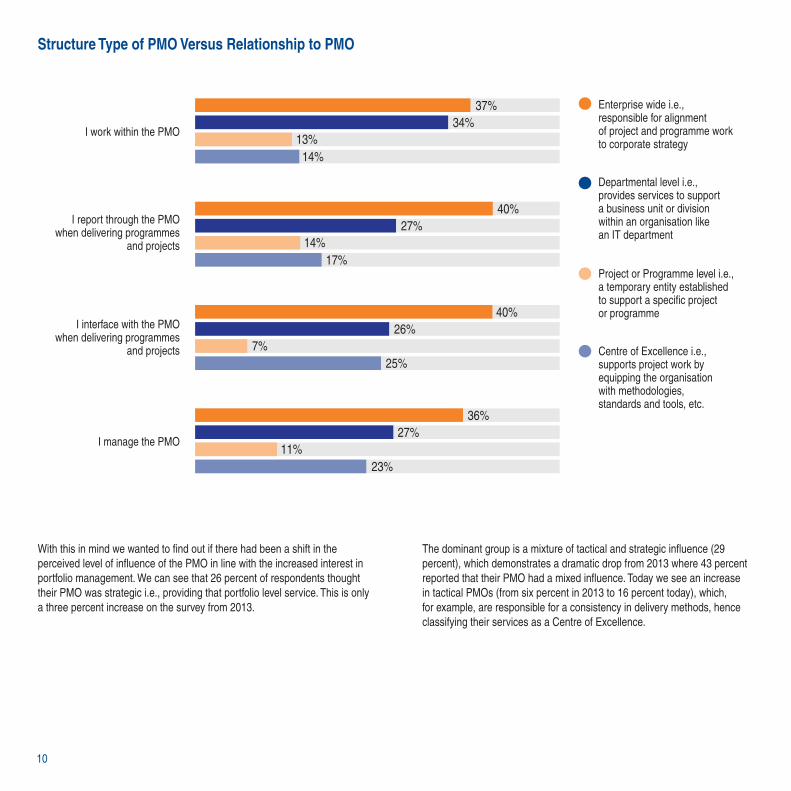
Structure Type of PMO Versus Relationship to PMO
With this in mind we wanted to find out if there had been a shift in the perceived level of influence of the PMO in line with the increased interest in portfolio management. We can see that 26 percent of respondents thought their PMO was strategic i.e., providing that portfolio level service. This is only a three percent increase on the survey from 2013.
The dominant group is a mixture of tactical and strategic influence (29 percent), which demonstrates a dramatic drop from 2013 where 43 percent reported that their PMO had a mixed influence. Today we see an increase in tactical PMOs (from six percent in 2013 to 16 percent today), which, for example, are responsible for a consistency in delivery methods, hence classifying their services as a Centre of Excellence.
I work within the PMO
I report through the PMOwhen delivering programmes
and projects
I interface with the PMOwhen delivering programmes
and projects
I manage the PMO
37%34%
13%14%
40%27%
14%17%
40%26%
7%25%
36%27%
11%23%
Enterprise wide i.e., responsible for alignment of project and programme work to corporate strategy
Departmental level i.e., provides services to support a business unit or division within an organisation like an IT department
Project or Programme level i.e., a temporary entity established to support a specific project or programme
Centre of Excellence i.e., supports project work by equipping the organisation with methodologies, standards and tools, etc.

10 11
Regarding the functions and services that PMOs provide to their business-es, we asked respondents what they considered to be the most important PMO functions it provides. The top three were all standard operational services. The most popular response was support and guidance around the methodology, processes and standards used within the project environment. Management reporting (MI) was second followed by providing support on project management tools. The fourth most important service was portfolio management support and, finally, planning. In terms of important services a PMO offers, it is the established services rather than the newer portfolio support that takes precedence.
Operational PMOs have remained consistent over the last two years, which highlights that although there is an interest in portfolio level PMOs, organi-sations are still maintaining the ‘bread and butter’ services that PMOs have always provided, such as monitoring and reporting.
Perceived Level of Influence
Strategic i.e., responsible for alignment ofproject and programme work to corporate strategy
Fundamentally tactical, but with somestrategic reach
Tactical i.e., responsible for a consistency indelivery methods across the organisation
Operational i.e., providing regular status reports andensuring information is available to inform decisions
Other
26%
29%
16%
26%
3%

12 13
The distribution of PMOs throughout organisations has proven to be rather extreme. The majority of respondents with a PMO claimed their organisation had either one PMO or five. Not surprisingly, most respondents with five or more PMOs are working for large multinational organisations.
Deeper insights paint an interesting contrast between organisations with ‘1 PMO’ or those that have five or more, ‘5+ PMO’.
‘1 PMO’ organisations are more likely to be corporate funded than those with five or more (61 percent versus 41 percent). Organisations with five or more PMOs have them operating at the department level (42 percent) whilst ‘1 PMO’ organisations predominantly have the one enterprise PMO (54 percent). These ‘5+ PMO’ organisations are also challenged by senior management less than ‘1 PMO’ organisations. 19 percent of ‘5+ PMOs’ are challenged compared to 37 percent of ‘1 PMO’ organisations.
The oldest PMOs are situated in organisations at the project or programme level. Over 42 percent of project or programme level PMOs were over a decade old.
Organisations with more than five PMOs are also the organisations with the oldest PMOs, suggesting that the longer an organisation invests in the concept of a PMO, the more likely it is that they will use PMOs at different levels in their organisations and for different functions.
In many ways, this insight also reveals the typical PMO journey. As the name suggests, PMOs started out supporting project and programmes before wid-ening the remit to include support for improving project capability for which the Centre of Excellence model is best known. The relatively recent introduc-tion of portfolio management, which typically sits within a departmental or enterprise- wide PMO can be seen in more newly created PMOs.
Number of PMOs Versus Type of PMO
Enterprise-wide i.e., responsible for alignment of project and programme work to corporate strategy
Departmental level i.e., provides services to support a business unit or division within an organisation like an IT department
Project or programme level i.e., a temporary entity established to support a specific project or programme
Centre of Excellence i.e., supports project work by equipping the organisation with methodologies, standards and tools, etc.
1
51%16%17%
50%
2
11%14%
8%7%
3
5%12%
8%2%
4
2%4%
3%2%
5 or more
21%35%
50%25%

12 13
Funding
Just under half of the PMOs are funded by corporate overhead (49 percent) with an equal distribution funded within projects (18 percent) or programmes (18 percent).
For PMOs supporting external client programmes and projects, this shifts to an equal split of 40 percent corporate funding and 40 percent project/pro-gramme funding, reflecting that the PMO can become a revenue- generating entity on client projects.
The future of PMO funding is secure, according to 74 percent surveyed who thought PMO funding would either stay the same or increase next year.
Enterprise- wide PMOs were the most optimistic with one in three claiming they anticipated increased funding levels for the next financial year. This may be due to their far- reaching influence and visibility throughout the organi-sation, while departmental or project and programme level PMOs remain more isolated from the overall strategy of the business. The other view is that PMOs that rely on project/programme funding or client revenues are unsure about funding levels because their view of the future is overly reliant on forecasted business levels.
It is encouraging to see high levels of corporate funded PMOs. It has long been believed that PMOs which receive corporate funding are in a much better place than those funded by programmes and projects. The perception is that corporate funded PMOs are much more likely to have the opportunity to mature and provide value added services that benefit the business, as well as the programmes and projects.
How is Your PMO Funded?
Corporate Overhead Within Programme Budgets Within Project Budgets
Departmental LevelEnterprise Wide
56% 17% 15% 46% 16% 15%
Centre of ExcellenceProject or Programme Level
36%31%19% 56% 14% 13%

14 15
Section 3: Role and Value of the PMO
14

14 15
The more sophisticated enterprise- wide PMOs have proven their seat at the table with optimistic funding prognoses as well as a more strategic approach in the services offered to the business. Other PMOs function within depart-ments or at the project level, fulfilling necessary, day- to- day tasks to ensure the seamless operation and delivery of projects and programmes.
The Definition of PMO Success Remains the Same
This is regardless of its position within the organisation, proving the PMO’s value has not changed over the years. It is true that the PMO struggles to demonstrate its value, according to PMI’s Pulse of the Profession In- Depth Report: The Impact of PMOs on Strategy Implementation 2013 and still re-lies on the classic definitions of project success (on- time, to- budget delivery)
to determine PMO effectiveness. In 2015, 78 percent claimed to use this measurement, although project success levels are not necessarily good indi-cators of the PMO’s success levels. The graph above shows that indicators, which are more PMO service aligned such as ‘service utilisation of the PMO’, are only measured by 33 percent of PMOs.
The PMO needs to consider which metric and measurement areas highlight its own effectiveness and successes rather than relying on measures which in reality are the responsibility of the project or programme manager (i.e., projects delivered on time, etc.).
In terms of those metrics and measurements that are tracked, the PMO reports that things are getting better. One area to watch is ‘customer satis-faction,’ which, for some PMOs, is getting worse whilst for others is getting much better. What is not clear from the results is whether these customers are those of the PMO or those of the programmes and projects. We will take a look at how ‘customer satisfaction’ within PMOs manifests itself later on in the report when we focus on the challenges they face in businesses today.
Which of the Following Metric & Measurement Areas Does Your PMO Track?
Role and Value of the PMO
Alignment of programmes /projects to strategic objectives 61%
Service utilisation of the PMO 33%
Customer satisfaction 44%Effectiveness of the projectmanagement methodology 53%
Training rates ofprogramme / project staff 26%Visibility of programme /
project statuses 68%Programmes / projects delivered
on time and to budget 78%Resource utliisation and
staffing issues 53%

16 17
Measuring PMO Effectiveness Levels Off
We can clearly see that the PMO has work to do in improving the measure-ment of its own effectiveness.
When asked “Does the PMO function measure and report formally to the organisation (Executives, Senior Management, Project Governance Boards, etc.) on its own effectiveness?” 66 percent of respondents answered in the positive. Measurement of the PMO’s effectiveness has remained about the same over the past few years (in 2015, 66 percent; in 2013 and 2012, 68 percent). During the survey’s inception in 2010, only 51 percent claimed the PMO measures its own effectiveness. So while we have seen some improvement in that area in the past five years, the PMO still has a long way to go in this area.
PMOs that engage in learning sustainment and training impact measure-ment exhibited the highest maturity across all six stages of PMO maturity. Around 29 percent of those PMOs actively involved in learning sustainment and training impact measurement have already reached full maturity while only about 15 percent of those who are not active in learning transfer and impact measurement have achieved full-blown maturity.
Does Your PMO Measure & Report on its Own Effectiveness?
“Generated the firstagreed- upon project priority list for a rolling 15 month view.”Canadian IT PMO Manager at a university
“Created Project University where we trained hundreds of staff in PM, PI, & CM.”US IT PMO Manager at a pharmaceutical company with 1000- 5000 employees
Yes No Don’t Know
66% 22% 12%

16 17
PMO Maturity by Evolutionary Stage
The PMO’s Current Perceived Value
The PMO is maturing and evolving. The encouraging signs are that PMOs recognise that as the PMO services evolve from one stage to the next, the nature of their work within organisations will always likely to be ‘still evolving’. As the organisation’s business changes over time, so too must the PMO be prepared to change and evolve.
One area where 55 percent of PMOs are happy to report as ‘fully embedded’ is the foundation level service of ‘gathering and reporting on project progress data’. Breaking this down, it is the enterprise- wide PMOs at 40 percent that report this basic service is ‘fully embedded’ compared to project/programme level PMOs at 11 percent.
Programme level activity and portfolio management services are reported as being the areas ‘not fully in place’ today. When we consider the enterprise- wide PMO—the PMO that supports strategy and portfolio management, 32 percent of them reported that the fundamentals of ‘managing the health of the project portfolio’ is ‘not fully in place’. Interestingly 29 percent of respond-ents report that ‘managing the health of the project portfolio’ is not part of the enterprise- wide PMO’s remit, which highlights there may be some confusion around what portfolio management actually is and how organisations actual-ly see it manifest itself.
Stage 1: Gather and report on projectprogress data
Stage 2: Develop and enforce standards,methods and processes
Stage 3: Manage, allocate and controlPM resources
Stage 4: Manage dependenciesacross multiple projects / programmes
Stage 5: Track and report on projectROI and benefits realisation
Stage 6: Manage the health of theproject portfolio
0 10 20 30 40 50 60 70 80 90 100%
Not part of remit Not fully in place Still evolving Fully embedded
18 19
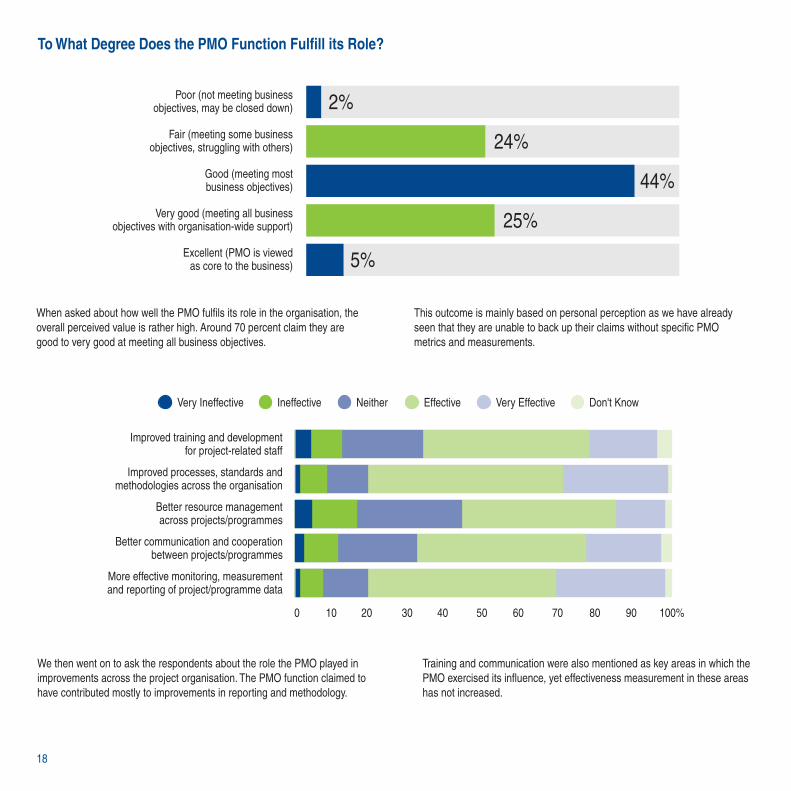
We then went on to ask the respondents about the role the PMO played in improvements across the project organisation. The PMO function claimed to have contributed mostly to improvements in reporting and methodology.
Training and communication were also mentioned as key areas in which the PMO exercised its influence, yet effectiveness measurement in these areas has not increased.
To What Degree Does the PMO Function Fulfill its Role?
When asked about how well the PMO fulfils its role in the organisation, the overall perceived value is rather high. Around 70 percent claim they are good to very good at meeting all business objectives.
This outcome is mainly based on personal perception as we have already seen that they are unable to back up their claims without specific PMO metrics and measurements.
Poor (not meeting businessobjectives, may be closed down) 2%
Fair (meeting some businessobjectives, struggling with others) 24%
Good (meeting mostbusiness objectives) 44%
Very good (meeting all businessobjectives with organisation-wide support) 25%
Excellent (PMO is viewedas core to the business) 5%
Improved training and developmentfor project-related staff
Improved processes, standards andmethodologies across the organisation
Better resource managementacross projects/programmes
Better communication and cooperationbetween projects/programmes
More effective monitoring, measurementand reporting of project/programme data
0 10 20 30 40 50 60 70 80 90 100%
Very Ineffective Ineffective Neither Effective Very Effective Don't Know

18 19
Which Stakeholder Groups Challenged the PMO’s Function or Value?
PMO Challenges
In order to properly assess the state of the PMO, it makes sense to also review the areas in which PMOs are facing challenges within their organi-sations. Whilst only 36 percent have been formally challenged during 2015, these insights can also benefit PMOs that are currently doing well to help stay on the right track.
Executives Continue to Challenge PMOs
Being challenged does not mean the PMO is not considered a useful body within the organisation. In fact, the more attention it receives, the greater the opportunity for the PMO to prove its worth. Because half the PMOs are funded by corporate overhead (49 percent), it is clear that the PMO will continue to be challenged by the C- suite. In this year’s survey, 72 percent of respondents claimed the PMO continues to be called into question mostly by senior management. The top three reasons for challenging the PMO were its lack of perceived value (44 percent); its lack of project/programme maturity in the organisation (41 percent) and a lack of executive support (32 percent).With ‘perceived value’ taking the top slot, this reinforces the message that PMOs have to clearly demonstrate the value they add—perhaps only in the way that most senior managers will be interested in—measurable, objective and quantitative results!
The Customer orProduct Owner
ProgrammeManagers
C LevelManagement
ProjectManagers
The LineOrganisation(s)
SeniorManagementOther 72%4%
37%
35%
23%
22%
21%
20 21
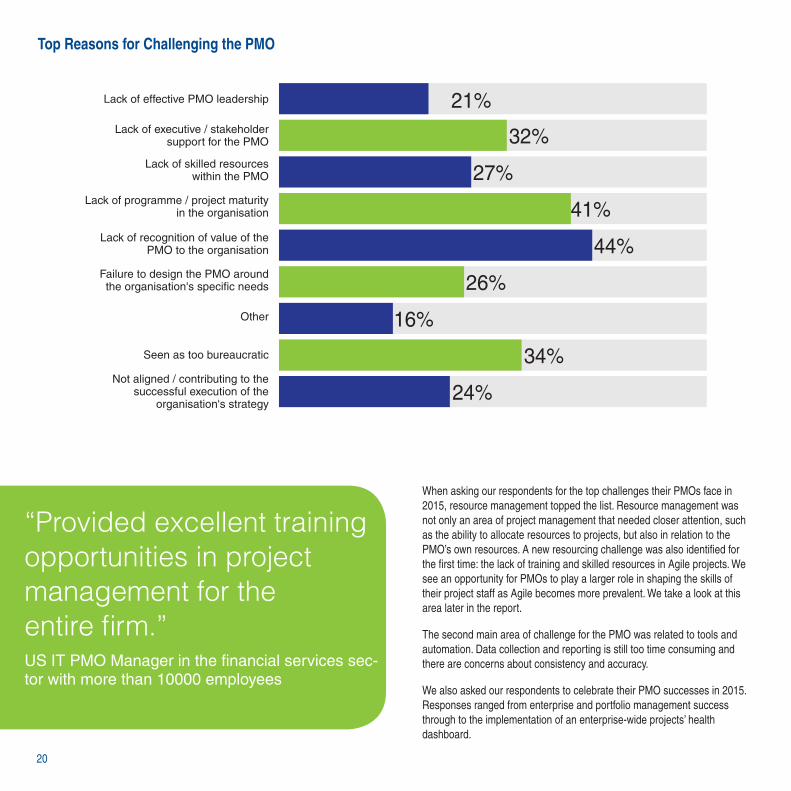
When asking our respondents for the top challenges their PMOs face in 2015, resource management topped the list. Resource management was not only an area of project management that needed closer attention, such as the ability to allocate resources to projects, but also in relation to the PMO’s own resources. A new resourcing challenge was also identified for the first time: the lack of training and skilled resources in Agile projects. We see an opportunity for PMOs to play a larger role in shaping the skills of their project staff as Agile becomes more prevalent. We take a look at this area later in the report.
The second main area of challenge for the PMO was related to tools and automation. Data collection and reporting is still too time consuming and there are concerns about consistency and accuracy.
We also asked our respondents to celebrate their PMO successes in 2015. Responses ranged from enterprise and portfolio management success through to the implementation of an enterprise- wide projects’ health dashboard.
Top Reasons for Challenging the PMO
“Provided excellent training opportunities in project management for the entire firm.”US IT PMO Manager in the financial services sec-tor with more than 10000 employees
Lack of effective PMO leadership 21%Lack of executive / stakeholder
support for the PMO 32%
24%
Lack of skilled resourceswithin the PMO 27%
Lack of programme / project maturityin the organisation 41%
Lack of recognition of value of thePMO to the organisation 44%
Failure to design the PMO aroundthe organisation's specific needs 26%
Other 16%
Seen as too bureaucratic
Not aligned / contributing to thesuccessful execution of the
organisation's strategy
34%

20 21
“We built the PMO starting in 2015 and so far it has been extremely effective. We’ve provided oversight to several cross- cutting teams focused on executing strat-egies that currently overlap many depart-ments. This work has been a tremendous success.
In addition, the PMO has stepped in on several high profile projects to provide expertise and management to ensure they were successful.”US Director/VP of business operations in the education sector with 500- 1000 employees
22 23
Section 4: Skills Development & the Role of the PMO
22

22 23
In this section we wanted to bring some unique insights into the role the PMO plays in skills development, learning and training. In ESI’s Project Management Talent Survey released in 2014, we highlighted that increasing proficiency and accelerating the ability of project practitioners to manage ever increasing complex and complicated projects relies on at least five days of targeted training a year.
With that in mind, 65 percent surveyed said their PMO is involved in training. Training becomes a rarity for project staff who are not in any way working with the PMO. Of those who have no interaction with the PMO, 40 percent claimed they hadn’t received training in the last year. At the same time, 80 percent of those that work with the PMO in some way have had some kind of training in the last year.
Skills Development in Project Organisations
Skills and competency development is an ongoing concern for organisations. This effort is viewed very differently, depending on the sector in question. Half of those surveyed from the entertainment sector viewed the skill levels of their project management staff as very good and even improving year on year, while only one in five from the energy sector could say the same. The automotive industry ranked the skill levels of their project staff to be theworst. Over 10 percent claimed they were poorly trained.
The size of the organisation also impacted how the skill levels of their project staff were viewed. Large organisations with over 5,000 people ranked their skill levels the highest. 71 percent claimed they were good to very good.
When viewed from the departmental level, customer services had the best ranked project staff by skill level. Over 57 percent claimed their customer services staff had very good skills, compared to the lowest ranking depart-ment in research and development. When looking at project performance as measured by project on- time deliv-ery, even the highest performing organisations with a 75+ percent on-time delivery rate recognised that their staff’s skills required improvement.
Project managers continue to benefit the most from their organisations’ ca-reer path. As project staff move up the ladder to portfolio manager, however, that career path opportunity dwindles.
The highest- ranking personnel have a different view about career opportuni-ties within their organisation. More than 60 percent of executives claim their organisation provides ample career opportunities for its project staff while only 23 percent of PMO specialists agree. Similar results were also recorded in Arras People’s Project Management Benchmark Report 2015 that polled PMO managers on the PMO having clear career paths for its staff. Just 29 percent of them said there was a clear career path in place.
Skills Development & the Role of the PMO

24 25
Individual Level
On an individual level, more than half of all project staff claimed they have had some form of training over the last year. In fact, 92 percent of all PMO specialists said they received training last year.
Across all job titles, classroom training was the most popular form, followed by some kind of eTraining.
Training Received Per Job Role
Programme / Project Administrator PMO Analyst PMO Specialist
Programme Manager
70% 30%
70% 30%
PMO Manager
71% 29%
Yes No
54% 46% 92% 8%
Portfolio Manager
88% 12%
Project Manager
74% 26%

24 25
PMO Level
Enterprise- wide PMOs have the highest involvement in training, with almost 70 percent claiming they play a role in skill development for their project staff. The Centre of Excellence model is also highly involved (65 percent), followed closely by the departmental level (61 percent).
Methodology training is the greatest focus across all PMO types. Once again, enterprise- wide PMOs take a more strategic approach to their training, with the highest focus on soft skills development, while the Centre of Excellence model lags behind with the least amount of attention paid to that type of skill.
The PMO’s involvement in learning sustainment is plummeting. Only 34 percent claimed in 2015 that the PMO is involved in learning sustainment, compared to 46 percent in 2013. That number fell from 57 percent who claimed PMO involvement in learning sustainment in 2012. How they sustain learning also varies depending on the type of PMO.
Both the departmental level and enterprise- wide PMO prefer coaching and mentoring as its main focus in helping project practitioners practice, master and sustain the skills they learned during training, while the projector programme level PMO uses less labour- intensive follow- up discussionsas its main source for learning sustainment.
PMO Involvement in Training Versus PMO Type
Enterprise Wide
69% 27% 4%
Departmental Level
61% 34% 5%
Project / Programme Level
60% 34% 10%
Centre of Excellence
65% 27% 8%
Yes No I Don’t Know

26 27
Training Impact Measurement
Even fewer PMOs are measuring the impact training has on the project organisation. About 23 percent of PMOs played an active role in measuring training’s impact in 2015, compared to 31 percent in 2013. That number has dropped from 70 percent in 2012 and 75 percent in 2011.
ROI is Not a Popular Measuring Stick for Training Effectiveness
Around two out of three use happy sheets and/or follow- up evaluations to measure training impact. As in 2013, only one in three used ROI as their training effectiveness measuring stick in 2015.
Although the percentage of PMOs involved in learning sustainment has dropped, the delivery form for sustained learning has remained the same since 2013. In 2015, coaching and mentoring topped the list (60 percent), then post- learning assessment (56 percent), closely followed by pre- learning assessment (55 percent). The trend continues also for the popularity of collaborative learning. As in 2013, two out of five provide opportunities for collaborative learning.
Training has long been a service area for PMOs. Providing support for project managers and their teams is a key area in their remit to help improve project capability in an organisation.
Because PMOs traditionally struggle to find good metrics, articulate benefits and demonstrate added value for their services, using relatively obvious metrics and key performance indicators in an area such as training has been a missed opportunity.
We have seen slight differences in the PMOs’ training involvement, depend-ing on the size of the organisation. The bigger it is, the less likely the PMO has an active role in the training and development of project/programme staff. Three out of four single- site organisations are actively involved in training, while only 64 percent of organisations with a multinational operation claim PMO involvement in training its project staff.
Does the PMO Take an Active Role in Measuring Training?
23% 64% 13%
Yes No I Don’t Know

26 27
The PMO’s Evolution & Maturity in Training
The higher up the evolution ladder the PMO goes, the more strategic its ap-proach to training project staff becomes. The most mature PMOs in Stages 5 (track and report on project ROI and benefits realization) and Stages 6 (manage the health of the project portfolio) are more likely (63 percent) to own the core competencies for project and programme managers than less mature PMOs.
They also place less emphasis (66 percent) on training in methodology and tools than those less mature (77 percent).
Soft skills training plays a greater role for mature PMOs (44 percent) com-pared to only 37 percent of less mature PMOs.
More evolved PMOs are more active (28 percent) in measuring the impact of training on workplace performance than those less mature ones (17 percent).
Finally, 61 percent of mature PMOs place far greater emphasis on follow- up evaluations for job impact and knowledge transfer, while only 41 percent of less mature PMOs do so.
As past surveys have shown, measuring training ROI is a smart business decision. 38 percent of mature PMOs, as compared to only 21 percent of less mature PMOs, use this criteria as their training-effectiveness measuring stick.
Differences in Training Focus by PMO Maturity
Owns CoreCompetencies
63%57%
Methodology /Tools Training
77%
66%
Soft SkillsTraining
44%37%
Measure Job impactof Training
28%
17%
WorkplaceFollow-up Evaluations
61%
41%
EvaluateTraining ROI
38%
21%
Still Evolving / Fully Embedded Not Part of Remit / Not Fully in Place

28 29
The types of preferred training delivery methods varied as well. While all seemed to prefer classroom training over any other method, PMO heads ranked eTraining as its second most favoured method, while senior managers claimed formal coaching as the second highest form of preferred training. The most likely reason for this stems from convenience. PMO heads view eTraining as an effective way of learning while saving time and keeping staff in house.
Type of PMO & Careers / Training
In terms of career path, respondents who were involved with the department level had the highest affirmative response rate (70 percent) followed by the Centre of Excellence model (59 percent).
Project Performance Versus Career Paths
Our results on project performance as it relates to investment in PM careers is not surprising. The higher the project performance rate, the more organi-sations invested in the professional development of project staff. There is a distinct correlation between project performance and training.
Skills DevelopmentTop PMO involvement includes direct training in methodology and tools
(70 percent), the ownership of core competencies and skills profiles forproject management within the organisation (61 percent), hard skillsdevelopment (52 percent) and coaching individuals and groups (52 percent). Soft skills development is still lagging with only 40 percent doing so,indicating a gap between the hard skills and soft skills offered.
The PMO has Come of Age, Yet Value Perceptionsare Lagging
The PMO is coming of age with 27 percent claiming full maturity, up from 20 percent last year. In the survey’s inception year (2010) only 15 percent of PMOs claimed full- blown maturity. At the same time, just under three out of four respondents said their PMO operates mainly from a tactical standpoint.
PMO as Career- Crucial Body
Although 65 percent of all PMOs are involved in training their project staff, only 46 percent of the PMOs surveyed in 2015 offered a defined career path for them.
When broken down by job title, only 37 percent of project managers have access to a career path, 31 percent for programme managers and 18 percent for portfolio managers.
We compare these figures with PMI’s Pulse of the Profession Report released in 2014, which highlighted that 62 percent of high- performing organisations in project management have a clearly defined career path for project professionals, a shortfall of 25 percent.
When it comes to career paths for project management staff, executives tend to view their organisations more favourably than those working lower down the chain. Those in management roles were more likely to say there is a career path for project staff than lower- ranking staff members surveyed.
Only those that have an interface with the PMO say they are more likely to have a career path defined by their organisation (50 percent said ”yes“). All other groups surveyed fell under the 50 percent mark. The departmental PMO tops the list of career paths offered with 70 percent of project manag-ers claiming they have a defined career path in their organisation.

28 29
Who Selects the Vendor for Training?
Training by Country
A short foray into training efforts by country reveals that in South America, Africa and Southeast Asia, 100 percent of respondents claimed their organisation offers some type of project management training. The United Kingdom had the lowest response with just over 60 percent claiming their organisation offered training.
Vendor Selection
While the PMO is often involved in training its project staff, less than half (45 percent) claimed they actually source the training for its project personnel. A mere 12 percent claimed they were even involved in selecting the vendor. Two out of five said human resources and L&D were responsible for vendor selection.
With HR departments more likely to select and source training for project practitioners, it stands to reason that PMOs and the HR team need to consider working more closely together to help close the hard and soft skills development gap through better training selection.
Human Resources & L&D
Business Units
PMO
Other
I Don’t Know
39%
14%
12%
12%
12%
Procurement 11%

30 31
Section 5: Agile on the Rise and a Looming Skills Crisis
30

30 31
Great effort has been made to adopt Agile practices either from staff members themselves or through external support, especially in larger organ-isations, yet a majority of staff still have no practical experience using this method. Around two out of five PMOs report that their organisation use the Agile approach on some of their projects/programmes while 54 percent use some type of Agile consultancy to help them implement Agile successfully. Over half of those surveyed said the use of Agile has increased either in the number or percentage of projects. At the same time the biggest challenges for organisations in implementing Agile are ‘changing the culture of the organisation in readiness’ (52 percent), ‘making the move from traditional methods i.e., Waterfall’ (44 percent), ‘getting the right leadership in place to drive the change’ (43 percent) and ‘upskilling the teams’ (31 percent).
When the PMO respondents were asked about their biggest challenges when considering an increase in the Agile approach, 45 percent were concerned about the lack of trained and skilled resources in the organisation to deliver these projects. They were also concerned about their own role in Agile projects (39 percent).
The lack of understanding of the role of the PMO in supporting the Agile ap-proach is a concern as PMOs are being asked to introduce new services to support it. When we asked what changes the PMO has had to make in order to support the increase in Agile projects within their organisation, the biggest responses were training and development related. Providing Agile related training and coaching and mentoring both came in at 43 percent.
If PMOs are being asked to provide training and development support around the Agile approach for the organisation, yet they are also unclear about the role the PMO plays, this conflict needs to be resolved or the PMO will be heading for disastrous results.
Agile on the Rise and a Looming Skills Crisis
Changing the culture of theorganisation in readiness 52%
Upskilling the teams 31%
Other 9%
I don't know 13%Understanding the value of an
Agile approach to the organisation 30%Motivating the teams to
make the change to Agile 20%Making a move from traditional
methods, i.e., Waterfall 44%Getting the right leadershipin place to drive the change 43%
Top Most Difficult Aspects of Agile Implementation
32 33
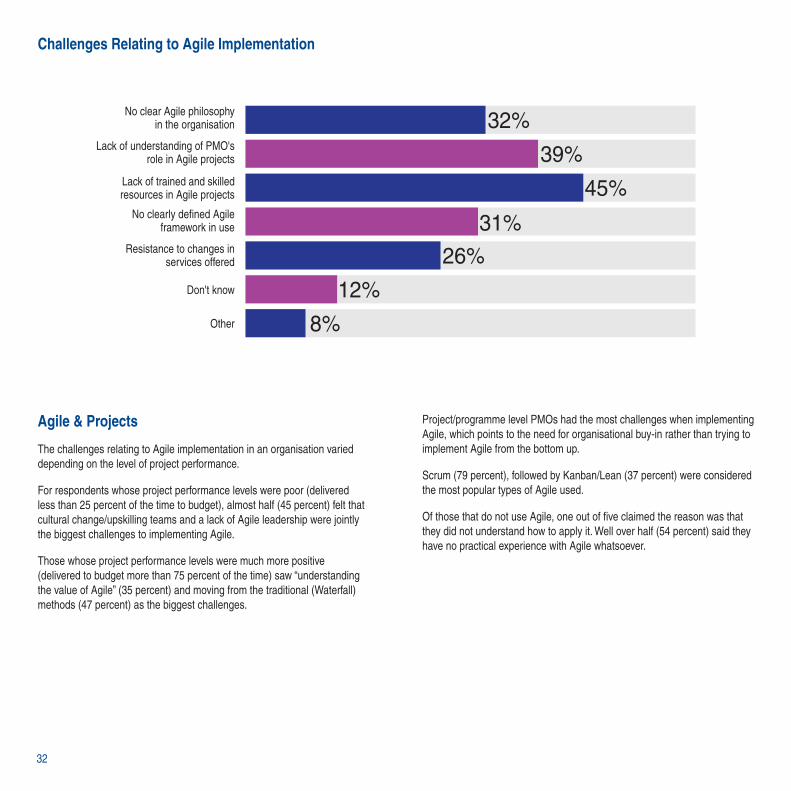
Challenges Relating to Agile Implementation
Agile & Projects
The challenges relating to Agile implementation in an organisation varied depending on the level of project performance.
For respondents whose project performance levels were poor (delivered less than 25 percent of the time to budget), almost half (45 percent) felt that cultural change/upskilling teams and a lack of Agile leadership were jointly the biggest challenges to implementing Agile.
Those whose project performance levels were much more positive (delivered to budget more than 75 percent of the time) saw “understanding the value of Agile” (35 percent) and moving from the traditional (Waterfall) methods (47 percent) as the biggest challenges.
Project/programme level PMOs had the most challenges when implementing Agile, which points to the need for organisational buy- in rather than trying to implement Agile from the bottom up.
Scrum (79 percent), followed by Kanban/Lean (37 percent) were considered the most popular types of Agile used.
Of those that do not use Agile, one out of five claimed the reason was that they did not understand how to apply it. Well over half (54 percent) said they have no practical experience with Agile whatsoever.
No clear Agile philosophyin the organisation 32%
Lack of understanding of PMO'srole in Agile projects 39%
Lack of trained and skilledresources in Agile projects 45%
No clearly defined Agileframework in use 31%
Resistance to changes inservices offered 26%
Don't know 12%Other 8%

32 33
Agile preferred for Internal Projects
In our survey we found that organisations are more likely to use Agile on their own projects versus projects they carry out with clients or so- called external projects.
Although 19 percent of those who use Agile for internal or a mix of internal and external projects claim the primary reason why the organisation is not using Agile more often is “too big a cultural change for the organisation,” only 3 percent of those who use it for external client projects believe that is the case.
More than one in three claimed the primary reason in their eyes is that the “projects/programmes are not suitable.” For the organisations who use Agile for internal or a mix of external/internal, 50 percent of respondents have no practical experience of using Agile. This rises to 68 percent for those using it for external/customer projects.
Whilst more mature PMOs are most likely to use Agile, one out of four have a lack of understanding of Agile methods. Less mature PMOs use it less, yet they have more Agile- qualified staff.
The use of Agile is increasing in all regions. The United Kingdom has shown the greatest increase, followed by India and Germany. The biggest accredi-tation earners can be found in Asia.
The survey data points to a looming skills crisis in Agile implementation, which presents an opportunity for the PMO to provide better training in the approach to enhance not only skill sets, but also alter cultural bias against the Agile approach.
Although 19 percent of those who use Agile for internal or a mix of internal and external projects claim the primary reason why the organisation is not using Agile more often is “too big a cultural change for the organisation,” only 3 percent of those who use it for external client projects believe that is the case.
34 35
The Final Word
While more and more PMOs are reaching full- scale maturity, demonstrated by an increase in services which support strategy and portfolio manage-ment, they have a long way to go in demonstrating value through consid-ered, quantitative measurement and metrics.
The PMO is under pressure to demonstrate its value, ultimately because it is not measuring this effectively enough. However, scrutiny from senior management shows that the PMO is viewed as an essential body for the organisation, and therefore one it is prepared to fund.
The PMO exists on many different levels within organisations and the ser-vices they provide are ever-evolving to meet the changes in business. Taking the Agile approach as just one example, the PMO should now be thinking about what support is really needed to ensure successful integration into project operations.
The activities surrounding training and development of project staff to improve project delivery capability has long been a PMO role. To address training needs more appropriately, the PMO should explore the possibilities of working closer with HR departments to influence training options, vendor selection and training delivery formats.
Resource allocation continues to be a challenge for today’s PMO, but the reported successes of higher project visibility and greater alignment with business strategy speak well of the PMO’s role in maintaining the health of the companies surveyed.
Even though only five percent of PMOs currently rate themselves as ‘excel-lent’ in fulfilling their role and being viewed as a core service to the business, 70 percent are feeling very optimistic and continue to evolve and mature. The PMO is a staple entity in organisations that strive to improve their pro-gramme and project performance and one that has proven its well- deserved place in the business landscape.

34 35

36 PB
For more information about how ESI can help your organisation, contact us today.
SINGAPOREwww.esi-intl.com.sg
[email protected]+65 3158 9500
+86 21 2226 5032 (Shanghai)+86 10 5682 6633 (Beijing)
[email protected]+61 02 8999 9162
+91 99 8099 3385