the global recession and the philippines economy: …pdf.usaid.gov/pdf_docs/pnadt979.pdf · the...
TRANSCRIPT

The Global Recession and the Philippines Economy: Impact and Policy Responses By The Center for Research and Communication Foundation, Inc.
March 2010
Submitted to USAID/Philippines by the Local Implementation of National Competitiveness for Economic Growth (LINC-EG) Project implemented by Nathan Associates on behalf of DNG Groug under Contract No. EEM-I-00-07-00009-00, Task Order 6. Its contents are the sole responsibility of the authors and do not recessarily reflect the views of USAID, nor of LINC-EG, or its implementing organizations.

The Global Recession and the Philippine Economy Impact and Policy Responses
Center for Research and Communication Foundation Inc. August 2009
CRC Foundation Inc. - - The Global Recession and the Philippine Economy
ii
TABLE OF CONTENTS
1 INTRODUCTION ................................................................................................................... 1
1.1 EFFECTS ON THE PHILIPPINE MACROECONOMY................................................................ 1 1.2 MAJOR FINDINGS ON KEY SECTORS.................................................................................... 5 1.3 ACTIONABLE RECOMMENDATIONS ................................................................................... 16
2. THE GLOBAL MELTDOWN: MACROECONOMIC IMPLICATIONS ON THE PHILIPPINES.............................................................................................................................. 29
2.1 EXAMINING THE MECHANICS ............................................................................................. 29 2.2 EXTERNAL TRANSACTIONS ................................................................................................ 31 2.3 STATE OF THE NATION’S FINANCIAL HEALTH ................................................................. 34 2.4 WILL SPENDING SPIN OUT OF CONTROL?........................................................................ 45 2.5 SUMMARY ............................................................................................................................ 50 2.6 IMPLICATIONS ON POLICY FORMULATION ...................................................................... 51
3 VULNERABILITY OF PHILIPPINE AGRICULTURE.................................................. 54
3.1 IMPORTANCE OF AGRICULTURE ........................................................................................ 54 3.2 INTERNATIONAL BENCHMARKING..................................................................................... 55 3.3 INDUSTRY ANALYSES .......................................................................................................... 58 3.4 IS PHILIPPINE AGRICULTURE VULNERABLE?................................................................... 70 3.5 OVERALL ............................................................................................................................. 79 3.6 MOVING FORWARD ............................................................................................................. 80
4 IMPACT ON THE PHILIPPINE BUSINESS PROCESS OUTSOURCING SECTOR....................................................................................................................................... 86
4.1 CURRENT INDUSTRY STATUS ............................................................................................. 86 4.2 IMPACT OF THE CRISIS ON THE SECTOR ........................................................................... 95 4.3 SPECIFIC RECOMMENDATIONS ........................................................................................ 104
5 THE PHILIPPINE ELECTRONICS INDUSTRY IN A GLOBAL RECESSION ....... 117
5.1 GLOBAL ELECTRONICS INDUSTRY AND THE PHILIPPINES............................................. 118 5.2 IMPACT OF GLOBAL ELECTRONICS SLOWDOWN ........................................................... 120 5.3 COMPETITIVENESS ISSUES ............................................................................................... 124 5.4 ACTIONABLE MEASURES TO MITIGATE THE IMPACT OF THE GLOBAL CRISIS ........... 124
6 THE GLOBAL CRISIS AND PHILIPPINE TOURISM ................................................ 126
6.1 IMPACT OF THE CRISIS ON PHILIPPINE TOURISM .......................................................... 128 6.2 INDUSTRY AND GOVERNMENT RESPONSE ....................................................................... 146 6.3 COMPETITIVENESS ISSUES AND STRATEGIC RESPONSE................................................. 150
7. THE PHILIPPINE AUTOMOTIVE INDUSTRY AND THE GLOBAL FINANCIAL CRISIS ........................................................................................................................................ 160
7.1 CURRENT INDUSTRY STATUS ............................................................................................ 160 7.2 IMPACT OF THE CRISIS ON THE AUTO INDUSTRY ........................................................... 166 7.3 RECOMMENDATIONS......................................................................................................... 175
8. ASSESSING THE IMPACT OF GLOBAL ECONOMIC SLOWDOWN ON PHILIPPINE REGIONS AND THE SUBIC-CLARK-BATANGAS CORRIDOR ............ 179

CRC Foundation Inc. - - The Global Recession and the Philippine Economy
iii
8.1 DECLINE IN GLOBAL OUTPUT, TRADE AND TRANSPORT ............................................... 180 8.2 IMPACT ON THE PHILIPPINE REGIONS ............................................................................ 181 8.3 INFRASTRUCTURE DEVELOPMENT AS A KEY TO MITIGATING THE IMPACT OF THE
CRISIS .......................................................................................................................................... 186 8.4 FROM INTER-ISLAND CONNECTIVITY TO REGIONAL CONNECTIVITY.......................... 188 8.5 PROPOSED REGIONAL RO-RO FRAMEWORK FOR SOUTH ASIA ................................... 192 8.6 SUBIC-CLARK-BATANGAS CORRIDOR............................................................................. 193 8.7 NEXT STEPS ....................................................................................................................... 196
9. REVITALIZING THE PHILIPPINE METALLIC MINING INDUSTRY..................... 198
9.1 DRIVERS OF THE DEVELOPMENT IN THE MINING INDUSTRY........................................ 200 9.2 STRUCTURE OF THE PHILIPPINE METALLIC MINING INDUSTRY .................................. 206 9.3 IMPACT OF MINING ACTIVITIES...................................................................................... 223 9.4 OBSTACLES TO MINING ACTIVITIES ............................................................................... 224 9.5 ACTION PROGRAMS FOR OVERCOMING OBSTACLES IN MINING.................................. 228

CRC Foundation Inc. - - The Global Recession and the Philippine Economy
1
1 Introduction This report was prepared by the Center for Research and Communication
(CRC) for the Department of Trade and Industry (DTI) and the Department of Interior Local Government (DILG), in their respective capacities as co-Chair Departments of the Growth and Investment Climate (GIC) Working Group and of the Decentralization Working Group of the Philippine Development Forum (PDF). These two working groups have agreed to convene an action-oriented conference involving industry, local government authorities and selected national government agencies to discuss, recommend and suggest possible interventions to mitigate the possible adverse effects of the slowdown of the world economy and seize the opportunity to prepare for the expected global economic recovery. The DTI Undersecretary Zenaida Maglaya, in her capacity as the chairperson of the GIC and DILG Undersecretary Austere Panadero in his similar capacity for the Working Group on Decentralization, requested the Local Implementation of National Competitiveness for Economic Growth (LINC-EG) and the United States Agency for International Development (USAID) to provide technical and related support for this joint working group (JWG) initiative. To prepare for the conference, the CRC team conducted research, key informants interviews (private and government stakeholders) and focus group discussions/consultations with the associations. The CRC also presented its findings during the inter-agency meetings convened by the DTI in March and April prior to the Global Crisis Forum that was held in April 23, 2009.
The report is organized as follows. Chapter 2 examines the effects of the
global crisis on the Philippine macroeconomy. Chapters 3 to 9 provide an assessment of the impact of the crisis on six sectors namely agriculture, business process outsourcing, tourism, automotive, electronics, mining and on the regions, specifically the Subic-Clark logistics corridor. The main findings of the report are presented in the following sections.
1.1 Effects on the Philippine Macroeconomy
The global economic turmoil would have direct and indirect effects on the
Philippine economy. The direct effects would come from the exposure of the Philippine financial system to the toxic assets that are at the roots of the global meltdown. This is not expected to be significant given the limited exposure of Philippine financial institutions on these assets. What could be more worrying would be the indirect effects which could result from the drying up of the financial flows from the big economies as well as the weakening of the demand for goods and services that the Philippine sell to these big economies. Threats to Sources of Income There are three sources of income that will be threatened by the slowdown in production activities in big economies: export revenues, OFW remittances and revenues from BPO services. There are signs that two of these will remain strong.
a. The BPO industry is just at the initial phase of its rapid growth and the potential activities that firms in the US can outsource is still large.

CRC Foundation Inc. - - The Global Recession and the Philippine Economy
2
b. OFWs are also geographically dispersed. Thus, the impact of the slowdown in big economies can be mitigated by the continued growth in the others.
The one that seems to have been severely affected are export revenues which showed dramatic drops starting December of last year. Fortunately (or perhaps unfortunately), the contribution of exports to the nation’s total income has been declining. In gross terms, the share of exports to the nation’s income down to about 30%. Netting out the imported raw materials that the economy uses, this goes down further to around 10%. In terms of net revenues, therefore, OFWs contribute even more that the exports of goods. Furthermore, the slowdown in export earnings is probably more a problem of lack of competitiveness rather than a result of the slowdown in our big market. The Philippines is a small player in this big market. Thus, as long as it can sell what it produces at the prevailing dollar price and at the quality required by the market, it should be able to sell all that it produces. Will expenditures balloon? If the global crisis will not cause severe problems in the income side, will it trigger pressures on the spending side? This does not seem to be the case either. Even before the onset of the global crisis, the nation’s spending as a proportion of the nation income has been on the decline. Most notable are the declines in the shares of personal and government consumption expenditures. Result: Gross savings rates have moved up. Consequently, interest rates have moved down. These trends have not been reversed. What is in fact worrisome is that despite the increased availability and lower cost of funds, the proportion of the nation’s income spent on investment goods by the private sector has been on the decline. The only one that has slightly recovered is the proportion of the nation’s income that is invested by the government on public construction. Nevertheless, even this is still below what we have posted in previous years. Given these trends severe imbalances between income and spending seem unlikely to result from the ongoing crisis. This gets even reinforced when one considers the two key accounts that make up the nation: private and public sectors. The private sector seems to have sufficient elbow room in keeping a healthy surplus in its financial records. The public sector could face some challenges. Since the growth in the nation’s income seems to be originating from the sectors that enjoy some tax breaks (OFWs and BPOs), the proportion of income that would go to the government coffers is likely to be threatened. The collections of BIR during the first two months of this year are highly suggestive of this emerging problem: the agency’s collections during the year would likely be fall short of what could have been expected from the underlying trends. Do these mean that the public sector’s deficits would balloon to unsustainable levels? Not necessarily. This administration has established a sufficiently long track record of prudent fiscal management and there seems to be no reason to break that trend in the next two years. Will we have access to foreign funds? With the expected strength of the nation’s income-spending position, the anticipated drying up of funds from foreign investors and lenders would unlikely pose a big problem to the nation. Again, the nation’s track records during the past six years are instructive. We have lived with severely limited inflows of funds from foreigners because we have learned to manage our finances better. In fact, it is even possible that we could face a better situation for the next two years. Given the troubles that Thailand, India and Vietnam are going
CRC Foundation Inc. - - The Global Recession and the Philippine Economy
3
through, more foreign funds might find their way to the Philippines for the lack of better alternatives for investors and lenders on where to place their money.
In summary, the Philippine economy is in a better financial position to face the global financial slowdown compared to the previous three crises that it faced from the eighties to the present. This relatively healthy financial position is not likely to be seriously undermined by the ongoing difficulties in the world economy.
a. Among the vulnerable income drivers (i.e. exports, OFW remittances and BPO earnings), only exports have exhibited dramatic drops. Furthermore, even these drops in export earnings are not probably due to the slowdown in these markets. The slowdown in our exports started way before the onset of the global crisis suggesting that competitiveness is our problem not lack of demand. Furthermore, the net contribution of exports to the nation’s income is smaller compared to other countries.
b. The nation’s spending behavior is also likely to remain prudent given the track records posted in the past years both of the private and public sectors. Furthermore, even if the income and spending balance gets reversed, there is some elbow room provided by the relatively healthy cash position of the nation.
c. With these, the prospects for access to foreign loans and investments could even be better compared to the past crises we have gone through considering the diminished attractiveness of the alternative destination of these funds due to the political and economic problems these countries are going through.
Implications on Policy Responses All these are important to keep in mind in crafting the policy responses to the ongoing global slowdown:
a. Lack of demand in the global market does not seem to our problem. Thus, offsetting the drop in export revenues by stimulating domestic demand through the traditional Keynesian approach does not seem to be the best way to cope with the crisis.
b. In fact, deliberate increases in the fiscal deficits could potentially spark imbalances in the nation’s finances if these stimulate more the demand for imported goods rather than domestically produced goods. True, the present financial conditions allow some elbow room for this strategy. Nevertheless, if not properly calibrated and directed to productive uses, the strategy could eventually undermine the financial muscle that has been built up through the years.
c. The following bottlenecks appear to require more policy interventions: i. The apparent lack of confidence in the private sector to bet on the
nation’s economic future. This can be gleaned from the declining proportion of the nation’s income spent by the private sector on investment goods. This despite the greater availability of funds due to the increased savings rate and the drop in interest rates due to this improved conditions in the funds market.
ii. The deteriorating competitiveness of in the export sector. This is indicated by the sluggish growth of our export revenues in comparison with the records of our neighbors. Two key indicators are worth examining to trace the reasons for this trend: (a) Peso

CRC Foundation Inc. - - The Global Recession and the Philippine Economy
4
prices of exports have been declining thereby squeezing the profit margins of exporters; and (b) the drop in the peso prices not only of the US dollars but of the other foreign currencies.
iii. The relatively slow pace of job creation that has accompanied growth in the recent years. The growth of employment in agriculture and industry has decelerated. Unfortunately, the growth in services, though fast, has not completely offset the slowdown in growth of the other sectors.
The government’s resiliency plan The term resiliency plan seems a more appropriate label than a calling the program as a stimulus package. This may sound like an issue of semantics but in truth, a stimulus package may give the impression that the response is inspired by Keynesian economics. The resiliency plan does not seem to be one. From a Keynesian perspective, as stimulus is essentially the deliberate posting of a fiscal deficit in order to offset the shortfall in private demand. To a developed economy whose currency is acceptable for international transactions, the impact of such stimulus could be predominantly positive. This is what Keynesian economics posits. A fiscal deficit means additional demand which will stimulate additional production. As long as the economy has spare capacity (or it is not at full employment), the stimulus would result in more production and, therefore, more income.
To a small open economy like the Philippines, however, a public sector deficit could have a bad side effect. Excess of spending over income of the public sector if not offset by a surplus in the private sector, would translate to a deficit for the nation as a whole. The problem: the nation’s deficit gets reflected as a current account deficit (i.e. an excess of nation’s dollar expenses over its dollar income). Obviously, this deficit will have to be financed with foreign currencies. If these foreign currencies cannot be drawn from the reserves or supplied by a surplus in the capital account, tightness in the foreign exchange market would ensue and put pressures on the exchange rate.
Can the government afford to post a deficit now without leading to these bad effects? It seems it can but only to a limited extent. The following indicators suggest that there is a room for some amount of stimulation:
a. We have a relatively comfortable level of international reserves. b. The private sector is in surplus.
Nevertheless, the elbow room seems tight. The levels of our gross and net
international reserves are higher than our historical records but they are not extraordinary compared to what our Asian neighbors have. Also, the nation is only in surplus because the remittances of OFWs have, so far, been sufficient to offset the deficit in our trade. The slowdown in the world economy has thus far shrunk our current account balance because our trade deficit has widened and OFW remittances are no longer growing as fast as before.
Thus, ERP should not be looked at from a Keynesian perspective. The ERP is designed not in terms of the deficit the government is going to incur. Rather, the program is presented as one that is primarily meant to make sure that

CRC Foundation Inc. - - The Global Recession and the Philippine Economy
5
a. the amounts budgeted are actually spent, b. that the expenditures are on items that would have high impact on growth of
output and jobs and on poor families and c. that resources tapped are optimized by augmenting them through private-
public sector partnerships.
Thus, ERP speaks of a budget (not a fiscal deficit) of P330 billion that would come from three sources:
a. Increase in the 2009 budget: This amounts to P160 B b. Tax cuts for low and middle income earner: This amounts to P40 B c. Financing of large infrastructure projects in joint effort with the private sector.
This will amount to P 100 B d. Additional benefits to members by social security institutions. This is valued
at P30 B
Viewed from this perspective, it is difficult to find fault in the approach taken to stimulate the economy. In essence, the focus of the program is simply the make sure that resources are tapped to the fullest, that they are actually spent, and that they go to the proper items. With or without the crisis, this is something that the government should be doing. To the extent that the government has been provoked to do this by the crisis, this is still something that would be worth pursuing.
There is a wide gap between intentions and actual actions. There is a nagging fear that ERP has been formulated with an eye for the 2010 elections. This is a valid concern but this does not diminish the significance of the general directions adopted in the program.
1.2 Major Findings on Key Sectors
The impact of the crisis on the six sectors covered in this study differs in terms of depth and magnitude depending on their reliance on the global market for their products, inputs and financing. Among the six sectors covered in the study, the most vulnerable to the crisis are electronics and international tourism (particularly international aviation services) due to their heavy reliance on the export markets. Apart from the international airline sector, other suppliers like hotels in Metro Manila and key destinations and travel agencies are more dependent on the foreign travellers and Balikbayans and therefore vulnerable to the crisis. The BPO industry, while export-oriented, is still at the initial phase of its rapid growth and will not significantly experience slowdown in the potential activities that firms in the US can outsource to the Philippines. Those heavily dependent on the domestic market are less exposed to the global crisis. The Philippine automotive industry is domestic-oriented and is less exposed to the depressed global demand. There are specific companies though which are more reliant on exports, for instance those which use the Philippines as hub for regional production under the ASEAN Industrial Cooperation (AICO) scheme. The agriculture and mining sectors are partly vulnerable since commodity and mineral exports are always buffeted by global price cycles. The recent softening of world prices has stolen some of the glitter from mining prospects.

CRC Foundation Inc. - - The Global Recession and the Philippine Economy
6
(a) Electronics
The local electronics industry accounts for almost 60% of total Philippine
exports. Without this sector, Philippine GDP would contract by an estimated 38.6%. Semiconductor manufacturing makes up 74% of manufacturing activity in the sector. Firms in the electronics industry are regionally dispersed, generating a significant number of jobs in the countryside. There are total of 926 firms in the industry employing an estimate 460,000 workers (2008). Only a small number of these firms are located in the National Capital Region (NCR); most are in regions III, IV and VII. Simulations show that a 10% increase in global electronics output was followed by a corresponding 4.66% increase in Philippine electronics exports and a 2.6% increase in employment in the industry. It is logical to assume then that decreases in global output will result in corresponding dips in export output and employment. For the first time, Philippine exports of electronics will experience at least two to three consecutive years of decline. Significant job losses is expected this year and the next if the global environment of electronics does not improve.
With more electronics factories located in the countryside, the adverse economic effects of the slowdown in electronics exports will be felt more keenly outside NCR. About 90% of the industry’s workforce are women, so they will bear the brunt of job displacement caused by the crisis. No doubt the economic effects of the slowdown in electronics exports will be felt in other sectors as well. The electronics exports slowdown will have a direct impact on jobs, household incomes, national output and even on taxes.
A weaker electronics industry also means drastically reduced opportunities for knowledge and skills development. The industry is estimated provide 13 million hours of training per year or an average of 40 hours per employee. Training modules are usually diverse, ranging from process, product and equipment engineering knowledge and skills upgrading to IT-training and interpersonal skills development. Spending on training can range from P60,000–100,000. Others firms also provide scholarships, research support and in-house degree granting programs to their employees.
Like mining, the global crisis has also magnified the competitive issues of the industry. The following are these issues confronting the electronics industry: Low value-added manufacturing operations. The concentration of the activities of the Philippine electronics industry is on assembly, testing, cleaning and packaging. R&D and design capabilities of the industry are very limited. Credit is tight for the sector. Local financial institutions are believed to have tightened credit to the industry due to the global crisis. Unlike in other countries, there are limited government-guarantees to loans extended to vulnerable sectors like electronics in the Philippines. Limited pool of managerial knowledge and skills in production. The industry still considers the senior managerial skills and knowledge of Filipino production managers as limited. There is a lack of culture on productivity enhancement and practices among the ranks and managers in the production line.

CRC Foundation Inc. - - The Global Recession and the Philippine Economy
7
Lack of incubation centers. The Philippines do have any incubation center to test and model their projects. The link between the academe and the industry remains weak. Some companies even complain about the bureaucracy involved if they decide to donate their equipment to educational institutions. Lack of Policy Consistency at the Local Level. SEZs, Ecozones and even LGUs tend to undercut each other in order to attract or retain investments or locators in their locality. This leads to inconsistency in the application or implementation and even unpredictability of policies. (b) Tourism
In 2008, global tourism’s growth slowed down to 1.8 percent, from 6.9 percent in 2007. In February 2009, the World Tourism Organization (WTO) projected that growth will range from -2 percent to 0 percent by the end of the year. In May, the WTO reported that the results for the first two months of 2009 demonstrated the lingering effects of the crisis when world tourism volume dipped by 8 percent from its year-ago level. It expected global tourism to decline by 2 percent to 3 percent in 2009. Recovery is projected to require a longer period due to the threat of the Influenza A(H1N1) virus scare that started in April of this year.
Tourism’s power to reduce poverty is threatened by the global financial crisis
and the correct policy responses to mitigate the negative effects of the crisis are deemed to make tourism play a key role in global recovery. In terms of negative impacts, on the demand-side, the volume of international arrivals (3.145 million) grew by only 1.5 percent in 2008 after posting relatively high growth from 2005 to 2007. Receipts dipped to US$4.4 billion (bn) in 2008, 11.1% lower than the earnings in 2007. The slower growth in 2008 was due to the decline of 77,387 visitors from Korea and Japan. These two origin markets alone accounted for 31 percent of arrivals per year.
Among the providers, the most vulnerable to the global tourism slowdown is
the international airline sector which carries 98% of international arrivals to the Philippines. About half of international inbound passengers are tourists and the rest are returning Philippine residents (e.g. tourists and Overseas Filipino Workers). In March 2009, the International Air Transport Association (IATA) revised (downward) its forecasts for passenger and cargo services and airline revenues for the global airline industry. In the Philippines, these vulnerabilities have been evident in the reduction of flights (with the exemption of Middle East carriers), decline in passenger volumes and most importantly in falling yields. Overall, the gross value-added of the sector slowed down in 2008, a result of the heavy profit-squeezing in the industry, as evidenced by the significant drops in yields.
The growth of the gross value-added of the hotel and restaurant sector also
slowed down in 2008. The occupancy rates of hotels in Metro Manila already declined from 73.8 percent in 2007 to 69.8 percent in 2008 (or a decline by 4.5 percent). The year-end figure was still above the average of 65 percent over a 20-year period. Hardest hit were the bay area, Makati/Mandaluyong/Pasig and Alabang hotels. Category-wise, the de luxe and first class hotels registered the most significant drop in

CRC Foundation Inc. - - The Global Recession and the Philippine Economy
8
occupancy. The share of foreign guests varies – 30% to 50% - among hotels. Minimal displacement of tourism workers has been noted. Based on the data from DOLE, only 147 workers (at least 60% from the lodging and restaurant sector) have been displaced from October 2008 to April 2009. Those handling inbound tourists, especially from Korea, Japan, and China have experienced sharp reductions, as high as 35 to 50%, in their bookings. Airlines have reduced their commission rates for these agencies, particularly in the business and first class seats. The industry is very competitive and switching costs are lower, forcing agencies to reduce their mark ups on economy class seats. The convention industry is one of the less vulnerable among all the tourism providers. MICE foreign arrivals constitute only 1.16% of total foreign visitor arrivals to the country. Any decrease will have minimal impact on overall visitor traffic. To date, the domestic market, especially association events continue to provide good source of business for this industry. Nevertheless, contraction in corporate events and product launches has been noted as local and foreign companies implement cost-cutting measures. Some association conferences and trade exhibitions are being postponed.
In 2008, the about a thousand workers in the passenger transport and tour and
travel agency industries were displaced. The hotel and restaurant industries managed to increase its workforce overall. But it also had to displace some workers due to the slower tourism business, particularly from the international markets. From October 2008 to April 2009, the DOLE reported that about 147 workers (50-50 male/female) working in hotels and resorts nationwide were displaced, mostly food attendants and kitchen related service workers. The hotel and restaurant industries employ a significant number of women, about 40 percent in all medium to large establishments (those with 20 or more employees).
On a positive note, the crisis has highlighted the vital role that domestic tourism plays amidst the vulnerability of international tourism to external shocks. The Philippines has greater potentials of surviving the crisis because of the dependency of most providers on the local market. The local tour operators have produced more competitive packages to a number of destinations in the country, contributing to the stimulation of domestic travel, development of more destinations and generation of income sources to local communities, especially those from impoverished areas.
The current crisis has further highlighted that the Philippines is still a very
small player in the global market and relative to the potentials for revenue and job generation and in pursuing sustainability. The Philippines will continue to be the same small player even after the crisis in the absence of timely and relevant response actions to mitigate the negative impact and strategic responses to address the areas that have persistently contributed to the low competitiveness in tourism. One major opportunity is to support the survival, recovery and long term competitiveness of the industry by identifying areas where stimulus measures can be pursued in exchange for the long-term benefits and where growth and investment climate can be enhanced. This is true especially in the case of tourism suppliers such as airlines whose vulnerabilities are rooted in the unfavourable business and investment climate in the country. Now is the time to remove the obstacles to mobility and to competitiveness. The objective is to make it more difficult for existing investors to leave and for new investors to ignore the Philippines.
CRC Foundation Inc. - - The Global Recession and the Philippine Economy
9
Based on global competitiveness reports (by the World Economic Forum), the areas which contribute to the lack of tourism competitiveness include: transport and tourism infrastructure, investment rules, regulatory environment and health and hygiene. Local connectivity can also be improved with the completion of mass transport projects (e.g. rail system) within the metropolis and between the metropolis and its environs. Connectivity can also be improved with the development of port facilities to support domestic travel via the RORO. New products such as cruise tourism can be designed and promoted with the right port infrastructure. Tourism has been identified as a globally competitive and sunrise industry by the government. Hence, government should seek to reduce transaction costs. In the case of the airline industry, the lingering issues on the impact of airport-related charges such as overtime fees, meals and allowances paid to the personnel of customs, immigration and overtime and the gross taxation (taxing global sales of airlines operating in the Philippines) regime imposed on foreign airlines have yet to be addressed despite the calls of the private sector for government to enable the improvement of the business climate. Other costs associated with the implementation of policies (e.g. travel tax) and regulations in all tourism-related services should be included in the agenda. Another strategic response is to streamline procedures and processes (e.g. registration, access to information, licensing, etc) at the LGUs through one-stop shop tourism investment centers (including website).
(c) Business Process Outsourcing
Global outsourcing & off-shoring (O&O) of services, commonly referred to as business process outsourcing (BPO), has been a recent but rapidly growing phenomenon. Its growth can be attributed to two main drivers. From the demand side, as the global market became more competitive due to the lowering of barriers to trade, companies had to be more competitive in terms of lower costs and better services. From the supply-side, rapid developments in information and communication technology (ICT) have made it technically possible to digitize service activities and transmit them via the internet in a cost-effective and timely manner.
In 2007, prior to the global crisis, the industry developed the Offshoring & Outsourcing Philippines Roadmap 2010. It targeted to grow the country’s share of the global market from the approximately 5%-6% in 2006, to about 10% by 2010. This means that revenues should increase to about US$13B by 2010, supported by about 900,000 full-time employees (FTE). With the global crisis, the 2010 targets are not expected to be met. However, the industry will continue to enjoy strong growth—revenues will increase by between 20% to 30%; while employment will grow at a slightly lower rate since (a) productivity in the sector has been increasing (i.e. less employees are needed to support the revenue targets) and (b) more value-adding BPO services are being established. Thus, by 2010, revenues will most likely grow to about US$9.5B; and full-time employees will number at least 580,000.
Given the global orientation of the BPO sector, its performance should be positively correlated with that of the global economy—especially of the main BPO markets, e.g. the United States. However, a confluence of factors provides the Philippine BPO industry with a unique opportunity to consolidate its position as a preferred location for BPO services in the context of the slowdown.

CRC Foundation Inc. - - The Global Recession and the Philippine Economy
10
The impact of the crisis on the industry can be examined from the market demand side and from the supply side. From the demand side, in terms of positive impacts the continued relative stability of the country’s economy, coming at a time when India is suffering from negative perceptions due to the terrorist attacks in Mumbai and financial governance scandal at Satyam, has highlighted the Philippines’ attractiveness as a BPO location. In addition, the global crisis and the resulting corporate bankruptcies have pushed companies to seek ways by which they can enhance their cost competitiveness and improve service quality—key value propositions of BPOs. And, provided that the crisis will result in a stable and predictable depreciation of the Philippine Peso, this may also have a positive impact on foreign exchange-earning sectors, including BPOs. In terms of negative impacts, the financial crisis resulted in a decline in business transactions supported by BPO companies. However, two important trends must be highlighted. First, even with the general slowdown, certain types of transactions were observed to have increased (e.g. outbound calls for credit collection); and, second, there is continued strong interest in the Philippines as a BPO location, with potential projects already in the pipeline. However, it is expected that the negotiation process for contracts will be harder, as clients adopt a certain level of wait-and-see posturing, exhibit greater risk aversion, and express greater interest in fee reductions. Moreover, since client companies are also in the midst of financial and organizational restructuring themselves, negotiation cycles become longer.
From the supply side, in terms of positive impacts, the most critical cost items
for BPOs are: salaries and wages, rent, telecoms expenses, and utilities. Slower economic growth is expected to lessen inflationary pressure on these cost items, thereby positively affecting BPO operations and profitability. More importantly, however, the financial crisis can be a unique opportunity for the country to address a major competitiveness challenge—the sustainability of the supply of BPO professionals. This can best be analyzed by looking at the different stages in the supply pipeline: from the pool of graduating college students, to those actually applying in BPOs, to those successfully accepted, and eventually, to those who choose to remain in the BPO industry.
In summary, the global crisis is expected to enhance the attractiveness of
BPOs as employers of new graduates, industry shifters, retrenched workers and returning OFWs—provided that they possess the required skill-sets or can be re-trained to acquire these BPO-related skills. The crisis presents an opportunity for the industry to surmount negative perceptions about the nature of BPO work (e.g. it is monotonous) and perception on the poor quality of life among BPO professionals. As the crisis can cause a deterioration in the cohort survival rate among students, BPOs can assist students fund their studies and at the same time introduce them to BPO (part-time) employment. The industry should also resist the temptation to take advantage of the weak labor market to unjustly squeeze current and incoming BPO professionals. In the long-run, BPOs must develop strategies that will highlight the benefits of being employed in BPOs, e.g. globally-oriented career path, and must fundamentally re-think industry current human resource recruitment and retention models.

CRC Foundation Inc. - - The Global Recession and the Philippine Economy
11
(d) Automotive
Trade represents a considerable part of the Philippine economy—with the absolute share of exports to GDP at 43%, and imports at 42%. However, it is still a domestic-oriented economy, with domestic private consumption accounting for close to 70% of total GDP. In contrast, in neighboring countries such as Thailand and Malaysia, private consumption expenditures account for only about 50% of GDP.
During periods of high global growth, the Philippines’ relatively lower share of exports to GDP (compared with Thailand’s 73% and Malaysia’s 110%) prevents it from experiencing greater economic expansion. However, during times of global contraction, a large domestic-oriented market provides a higher level of resiliency to the country.
The Philippine automotive industry is domestic-oriented and is less exposed to the depressed global demand. There are specific companies though which are more reliant on exports, for instance those which use the Philippines as hub for regional production under the ASEAN Industrial Cooperation (AICO) scheme.
Previous growth in domestic demand has been driven by availability (i.e. ease of availment and low interest cost) of financing and buoyant demand from OFWs and their families. Based on interviews, as well as business news reports, about 70% of brand-new car buyers rely on bank loans; while OFWs account for about 25% of the market for vehicles. Despite the global financial crisis, the financing environment has been relatively conducive to the growth of the auto industry. Average loan rates in the country had been relatively stable over the past decade, resulting in higher auto loan availments. Equally important, the crisis does not seem to have led to a substantial deterioration in auto loan payments—which, if it materializes, could lead banks to be more conservative in lending to car buyers (e.g. by increasing loan rates, increasing downpayment levels, shortening loan repayment terms, adopting stricter applicant screening procedures, etc.). In the first three quarters of 2008, auto loans (ALs) have been relatively stable; and there was no significant increase in non-performing loans (NPLs). In terms of OFW remittances, the inflow of remittances has surprisingly been robust even in the face of the global crisis. OFW remittances account for roughly 9% of total GNP (2008). Vehicles are popular among OFWs not only for their personal use but also for pursuing possible business opportunities, e.g. for the logistics needs of their small businesses or for shuttle services. In 2008, even with the crisis, OFW remittance increased by 14% in dollar terms. For the first quarter of 2009, remittances managed to grow by 3%. Another important factor that affects sales of motor vehicles is the price of fuel. This may however have a counter-intuitive effect as higher fuel prices may actually attract car owners to buy smaller, more fuel efficient vehicles or shift from gas-powered engines to diesel or even hybrid fuel—thereby, at least initially, increasing vehicle sales. It is noteworthy that sales of vehicles even increased in early 2008 at the height of fuel price increases. The global crisis has however eased the upward pressure on fuel prices. From a high of almost Php60 per liter of unleaded fuel in July 2008 (Metro Manila), fuel price had

CRC Foundation Inc. - - The Global Recession and the Philippine Economy
12
consistently gone down to reach a low of about Php31 in February 2009. In general, this has made it more affordable to own and use a vehicle. Fuel prices have started to again increase with signs of impending global economic recovery. While the sales of brand-new vehicles in the country have not yet even returned to its pre-1997 level, the industry was at least able to grow, albeit at a slower pace in 2008. In fact, even in the first quarter of 2009, the industry still managed to grow slightly by 2.6%. This is in sharp contrast to the more than 50% contraction being reported in the North America (which includes the United States). The Philippines, thus is relatively still in a better situation than most other countries. Its domestic orientation has been sustaining the industry. The industry is expected to register flat growth this year—as long as the following are sustained: stable interest rates on auto loans, inflow of OFW remittances, and stable (and low) fuel prices. (e) Agriculture
The agriculture sector is partly vulnerable to the crisis. World commodity prices have declined since their peak in 2008. These have dual effects: reduce output prices for some exportables, principally coconut, and reduce input prices. Lower fertilizer and fuel prices in 2009 will have positive effects on farm bottom lines. On the policy front, peso depreciation has positive effects on many products, principally for exportables like coconut and banana.
But, the sector’s coping mechanisms could have been far better if the country had long invested in sector competitiveness. Adequate investments would have generated higher productivity.
The AFTA 2010 looms. Corn, sugar, feeds, chicken and pork will face competition. Feeds and meats will enter the country duty-free and this will, in turn, reduce the demand for corn. The industries were given lead time, but preparations appear to be taking unnecessarily longer. On a regional basis, the most impacted regions will be the coconut areas of Mindanao, Bicol, Eastern and Central Visayas, and Southern Tagalog (mainly Quezon).
The latest rice crisis created serious concern. World prices accelerated in March 2008 and peaked in April. Misguided concern for domestic supply led India and Vietnam (key exporters) to curb exports. In the process, world rice prices started to spike. Also, the National Food Authority reacted by taking large orders at abnormal prices. Certain sectors in government believe that the rice crisis makes 100% self-sufficiency a more strategic option than ever without reference to cost-benefit analysis.
Corn accounts for 6.4% of agriculture GDP. It has the third largest farm area
(1.35 M ha) and number of farmers (0.7 M) after coconut and rice. Over 80% of corn is used as feed ingredients for poultry and swine. The key production zones are in Cagayan Valley (particularly Isabela), Ilocos (mainly Pangasinan), and Mindanao. Corn is an upland crop where access to marketing infrastructure is more limited than lowland crops like rice.

CRC Foundation Inc. - - The Global Recession and the Philippine Economy
13
Compared to competitor countries, corn yield is only 54% of global average and is lower than China’s or Thailand’s. Hybrid seed use is reportedly one factor. However, the good news is that it posted the highest growth in farm yield among Asian peers since 1990. The private seed companies as well as the input suppliers have played a key role in expanding hybrid seed use. The dramatic fall in world prices in 2009 will cut farm profits. Only a large peso depreciation can help reverse the income shrinkage.
Coconut is the largest agriculture industry. Its farm land (3.3 M ha) is 34% larger than rice; and its number of farms (1.4 M) slightly higher. But it contributes only 3.4 % to agriculture GDP, principally because of dismally low farm productivity. The industry suffers from decades of neglect. It does not receive the resources it deserves. It gets not even one-twentieth of the rice budget. The existing tree stocks are of poor genetics. Severe under-investment has led to senile trees, while the lack of fertilizers causes low productivity. The senile trees need replanting as more than 95% of tree stocks are from poor clones. There is also need for intercropping to supplement low farm incomes. Today, only one million ha are intercropped with varying degrees of management. The main coconut regions are Mindanao, Bicol, East Visayas, and Southern Tagalog (principally Quezon). Concidentaly, they happen to have the highest concentration of rural poor and insurgency. Benchmarking the industry shows that the Philippines has the lowest farm yield among competition. Indonesian yield is 30% higher, not to mention Brazil and PNG at more than double. Philippines yield growth has been above average for unexplained reasons as fertilization had been minimal. The Philippines lost its top spot in production to Indonesia in the 1990s due to the latter’s more organized development program. Meanwhile, palm kernel oil from Indonesia and Malaysia has been making inroads in the global market. (f) Mining
There are two levels in which mining activities affected by the global slowdown will economically impact the Philippines – at the national and local levels. The channels in which the impact will be felt are through investments, exports, jobs and taxes. During its peak in the 1980s, it contributed a 2.10% to current gdp, 25% to total exports, and about 13% to government taxes. It also employed an average of 134,000 workers or less than half a percent of the country’s employed labor force of 32.5-million. Furthermore, it contributes to national development through the development of its host communities by providing roads, churches, markets, schools, housing, utilities (electricity and water) and hospitals. In fact, mining has spurred the growth and development of towns and cities like Baguio, Sipalay and Toledo (Manuzo, 2002)
The favorable policy environment coupled with attractive global prices and heightened promotional efforts have rekindled once again the importance of mining activities. In 2007, mining activities account for 1.4% of current GDP, 5.4% of total exports, and about 153,000 or about .4% of total employment. Mining recorded its highest employment level in 1989, with about 168,000 workers—about 0.77% of the total work force then. The employment figures include operations from mining and quarrying activities and thus grossly overestimate the total employment contribution of large scale metallic mining companies. It is estimated that current employment

CRC Foundation Inc. - - The Global Recession and the Philippine Economy
14
generated by large scale mining companies is about 10,000 to 15,000 persons. The current majority of those employed in the industry belong to small-scale mines. Mining activities contribute to the government coffers in four ways – fees and royalties charged by the MGB-DENR, excise taxes, taxes collected by the national government and taxes collected by the local government unit that has jurisdiction over the mining site. In 2006, the government collected from the mining activities close to P3.1-billion in taxes – up by more than two folds from the P1.4-billion collected in 2002. Recently, the government is able to generate over P10.4-billion in taxes and royalties in 2007 – up more than two folds from P3.5-billion collected in 2004.
A total of 62 mining projects at various stages of development identified by government as priority have infused a total of US$1.85-billion in investments during the period 2004 and the third quarter of 2008. Bulk of these investments went into construction and development stage of 8 companies infusing in the same period about US$835-million and another 12 companies at the operating and expansion stage injecting US$789-million.
From the last quarter of 2008 to 2013, the government projects an additional infusion of US$11.4-billion in investments from mining projects at various stages of development. All these investments are dispersed throughout the countryside where oftentimes poverty levels are high.
Government projections did not provide estimates of additional taxes as well as the exports these new mining projects will generate. However, if all these mining investments push through as projected especially those 8 mines at the development/commercialization and the 12 others at the expansion/operating stages, mineral export levels and taxes will substantially increase from mineral extraction, processing and sales.
Only during the commercial operation of a mine will the national as well as local government and communities fully enjoy the benefits of the mining activities. At the national level, the economic benefits derived from commercial operations are as follows:
- For MPSA: Excise tax on minerals of 2% of market value; 5% if in mineral reserve
- Corporate income tax of 5% or 3% of sales - For FTAA: Net mining revenue option of 50% of gross output net of
deductible expenses or profit-based option of 25% of excess profits (net profit after tax less 40% of gross output)/(1-income tax rate)
- Environmental management fee of 1% of capex during construction - Mine wastes fee of P.05/MT and tailings fee of P.10/MT
For the LGUs that have jurisdiction over the claims, in addition to realty and
business taxes and license permits, their sharing on the 40% excise taxes from a fully operating mine are as follows:
- 20% to the province - 35% to the municipality - 45% to the barangay

CRC Foundation Inc. - - The Global Recession and the Philippine Economy
15
Other stakeholders can partake from the commercial operations of a mine are as follows:
- Social investment of 1% of direct milling cost of which 90% must be spent on SDMP which directly benefits the communities within and around the mining site and the remaining 10% must be spent on mining technology & geosciences
- If present within the site, indigenous communities get a royalty fee of 1% of gross output
The factors external to the Philippines that discourage investments in exploration
and mine development and commercialization are the credit crisis and the softening of world prices and the presence of international anti-mining lobby groups against any form of mining activities. These factors are well-beyond the control of the Philippines. Credit Crisis and Falling World Prices. In a 2008/2009 annual survey conducted by the Fraser Institute of 658 exploration and other mining-related companies around the world, more than 4 out of 5 believe that at least 30% of exploration companies will be forced out of business in the current economic downturn. The same survey indicated that over 90% of the respondents believe the exploration and development activities of exploration companies will be curtailed with 57% saying that the activity will decline a “great deal,” and 85% say that the activities of production companies will be curtailed.
The implications can be adverse to the Philippine mining sector as most of the projects are still at the exploration and feasibility/financing stages. Postponements or outright cancellations of exploration activities can eliminate in the long term all prospects of the Philippines benefiting from mining activities.
The postponement of exploration and commercialization activities can lead to commodity shortages when the economy recovers. According to the same report, “the world may face a shortage of raw materials and sky rocketing commodity prices as the world economy moves past the recession and into renewed growth”.
The report further states “the curtailment of development activity will hit in the short-term, likely during the opening phase of the recovery period. The gap between exploration and production typically span five years to ten years. This means that the negative impact from the lack of exploration on commodity supplies will begin to hit as the recovery matures.” While it may augur well for existing mining operations, the report observed that “these problems could weaken the recovery and spark inflation fears” Anti-mining lobby. The spotlight focused on Philippine mining has also rekindled fierce opposition from international and local environmental groups and other non government organizations who are seriously concerned about non-economic issues like the adverse impact on the environment and the violations of rights of indigenous people. The local networks and well-funded machinery against mining has already gained roots in the Philippines and have impeded a number of mining projects.

CRC Foundation Inc. - - The Global Recession and the Philippine Economy
16
(g) Regions and Transportation Infrastructure
The global economy is going through a “perfect storm,” with the global recession. Major economies like US, Japan, and EU are in simultaneous recession, with their economic output declining. The collapse of the investment banking and the resulting credit crunch led to the sharp decline in industrial production, commercial operations, and capital spending across the world. The World Bank (2009) has forecasted a 6.1% reduction in the volume of world trade in goods and services. The estimated growth for East Asia and the Pacific will ease at 5.3% in 2009, mainly because of weaker export demand. Roughly 6% of total containership fleet capacity has been laid up as of February 2009.
While the Philippine economy is not as badly affected by the crisis, some sectors have manifested certain levels of vulnerabilities. These sectors (automotive, electronics, tourism, mining, BPO) mostly operate in NCR, Regions III, IV-A, VI and VII. Since the exports of electronics products account for more than half of Philippine exports, the slowdown in production is manifested in lower growth projections for the same regions where the electronics manufactures operate. The impact of the global crisis on some of the special economic zones and freeport/s is as follows. In Subic, 5,000 jobs lost in 2 electronics firms. There have been cancellations of ship orders. On the positive side, ship lay-ups (more than 20 international ships are currently laid up in Subic bay. The government is also developing a lay up facility in Malalag, Davao.
In Clark, about 2,000 jobs were lost. The electronics exporter operating at 30% capacity today; no lay-offs but shorter working days. Call center operations shrunk by 40%, but BPO presents opportunities (buying US companies, labor arbitrage). In Calaba, about 10,000 jobs lost in various industrial estates/special economic zone s in Southern Tagalog according to PEZA.
1.3 Actionable Recommendations
The actionable recommendations proposed in this report are presented in
Table 1.1.

CRC Foundation Inc. - - The Global Recession and the Philippine Economy
17

CRC Foundation Inc. - - The Global Recession and the Philippine Economy
18
Table 1.1 Key Findings and Actionable Recommendations Impact of the Crisis Actionable Recommendations
Electronics A 21% change in global output will lead to a 10% decline in Philippine exports. Assuming that the exports of the electronics industry contracts 10% and 8% in 2009 and 2010, respectively, there will be substantial reductions in household incomes, taxes and trimming of current GDP levels and thus GDP growth.
Ensure credit availability to electronics firms operating and expanding in the Philippines. The industry proposes that government can allocate part of its stimulus package by extending a credit guarantee to existing electronics and semiconductor firms expanding and/or investing in the Philippines. Move up the value chain of the electronics industry. The Philippines cannot remain in the same level of skills and capabilities. It must move up the value chain. Some of the concrete steps include (a) establishing R&D and incubation centers funded and/or supported by the government, the industry and the academic institutions; (b) eliminate donors taxes and accelerate processing of documents for equipment donated by the industry to the academe; (c) promote the development of the upstream component of the electronics industry (i.e., wafer fabs) in order to preserve testing and assembly operations in the Philippines and (d) promote a stronger partnership between the academe, the industry and other stakeholders to meet the manpower and other needs of the electronics and semiconductor industry to remain competitive. Encourage consolidation of global operations in the Philippines. The global crisis has forced companies to consolidate their global operations into a select few of geographical locations where their competitiveness are sustained or enhanced. Thus government must conduct investment promotion activities directed at parent companies that have manufacturing operations in the Philippines and to harmonize investment-related incentives of LGUs, Ecozones and SEZ’s.
A 10% decline in Philippine exports, as a result of decline in global output, will translate to job losses of at least 8,000. A weaker electronics industry also means drastically reduced opportunities for knowledge and skills
Improve efficiency of business operations to sustain cost competitiveness. To improve the industry’s state of competitiveness, the industry must in coordination with government provide continuous training of production managers to improve manufacturing knowledge and skills; improve the quality and reliability of power supply and reduce the cost of doing business in the country.

CRC Foundation Inc. - - The Global Recession and the Philippine Economy
19
Impact of the Crisis Actionable Recommendations development. The industry is estimated to provide 13 million hours of training per year or an average of 40 hours per employee. Training modules are usually diverse, ranging from process, product and equipment engineering knowledge and skills upgrading to IT-training and interpersonal skills development. Spending on training can range from P60,000–100,000. Others firms also provide scholarships, research support and in-house degree granting programs to their employees.
Automotive The crisis does not seem to have led to a substantial deterioration in auto loan payments—which, if it materializes, could lead banks to be more conservative in lending to car buyers (e.g. by increasing loan rates, increasing downpayment levels, shortening loan repayment terms, adopting stricter applicant screening procedures, etc.). In the first three quarters of 2008, auto loans (ALs) have been relatively stable; and there was no significant increase in non-performing loans (NPLs). Unlike other markets, it seems that the local financial institutions remain to be healthy and have actually kept the local automotive industry buoyant in the midst of the global recession.
Financial institutions should further come up with more attractive auto loan rates The government can also come up with its own auto loan system that can encourage consumers to buy cars
In 2008, even with the crisis, OFW remittance increased by 14% in dollar terms. For the first quarter of 2009, remittances managed to grow by 3%.
The government should continue to look for fresh job opportunities abroad to sustain growth in remittances Encourage competition among banks offering transfer of remittances services to bring down transfer fees
The global crisis has however eased the upward pressure The government and oil companies must have a concerted effort to make sure
that domestic prices really reflect the movements of oil prices in the world

CRC Foundation Inc. - - The Global Recession and the Philippine Economy
20
Impact of the Crisis Actionable Recommendations on fuel prices. From a high of almost Php60 per liter of unleaded fuel in July 2008 (Metro Manila), fuel price had consistently gone down to reach a low of about Php31 in February 2009. In general, this has made it more affordable to own and use a vehicle.
market
The Philippines, thus is relatively still in a better situation than most other countries. Its domestic orientation has been sustaining the industry. The industry is expected to register flat growth this year—as long as the following are sustained: stable interest rates on auto loans, inflow of OFW remittances, and stable (and low) fuel prices.
Implement more effectively EO 156
Tourism Volume of Arrivals
The early impact of the global crisis was evidenced in the slower growth of international arrivals in 2008. A total of 3,139,422 visitors arrived in the Philippines last year, 1.5 percent higher than the volume in 2007 but the slowest in the past five-years.
Tourism Receipts
For the whole year of 2008, receipts dipped to $4.4 B in 2008, 11.1 percent lower than the earnings in 2007. The 1st quarter results revealed that revenue flows declined from $1,155 M to $744 M (35.6 percent).
Per recommendation during the April 23 forum, more innovative packages should be developed for markets other than the US or Balikbayans. Development or improvement of marketing channels such as websites and booking channels especially at the LGU levels Review of fees charged by tourism suppliers and LGUs to tourists, especially to high value market segments such as divers in line with sustainable tourism revenue (and taxation) generation mechanisms LGUs can help mobilize their local communities to make the tourism experience of current and new market segments truly worthwhile through more efficient transport management systems, clean and safe (and secure) tourist environment – ports, airports, bus terminals, tourist sites. For these new markets, their good experience in the Philippines will have a positive effect on the destination through word of mouth advertising. Funding support by international agencies in tourism can be directed towards these types of

CRC Foundation Inc. - - The Global Recession and the Philippine Economy
21
Impact of the Crisis Actionable Recommendations projects.
Air Transport The vulnerabilities have been evident in the reduction of flights (with the exemption of Middle East carriers), decline in passenger volumes and most importantly in yields (about 35 to 50 percent). Gross Value Added (GVA) The effects of the crisis on the local airlines are evident on the slower growth of the gross value-added (GVA) in 2008 and in the 1st quarter of 2009. Tours and Travel Agencies Those handling inbound tourists, especially from Korea, Japan, and China have experienced sharp reductions, as high as 35 to 50 percent, in their bookings. Airlines have reduced their commission rates for these agencies, particularly in the business and first class seats.
Accommodation
The occupancy rates of hotels in Metro Manila already declined from 73.8 percent in 2007 to 69.8 percent in 2008 (or a decline by 4.5 percent). The GVA growth of the hotel and restaurant sector slowed down in 2008 after an impressive record in 2007, when it grew faster than the growth in GDP.
The Board of Airline Representatives requested for discounts on airport charges. In May, the MIAA granted 10 percent discount on airport related charges for all commercial flights and 15 percent for all extra section flights for a period of six months or until the end of 2009. Requests submitted to the Mactan Airport Authority and Civil Aviation Authority of the Philippines have been denied because airport authorities have not increased their rates in previous years. Pro-active dialogue between the DOTC and the airlines for them to make a case for the stimulus package or extension beyond December 2009. The long-term benefits of the package should outweigh the foregone revenues of the airport authorities or the DOTC for a fiscal year or two. Review of investment incentives for SMEs in tourism. Most of the tour operators are SMEs that cannot meet the minimum fleet requirements for buses by the government.
From October 2008 to April 2009, the DOLE reported that about 147 workers (50-50 male/female) working in
International agencies/chambers of commerce can extend support to the DOT through the GREET program in order to expand the pool of funds for the SMEs

CRC Foundation Inc. - - The Global Recession and the Philippine Economy
22
Impact of the Crisis Actionable Recommendations hotels and resorts nationwide were displaced, mostly food attendants and kitchen related service workers. The hotel and restaurant industries employ a significant number of women, about 40 percent in all medium to large establishments (those with 20 or more employees).
and microfinance projects proposed by local communities and enterprises. These projects can support the women entrepreneurs. Link-up projects for women in tourism with private sector initiatives such as the 10,000 women project of the Goldman Sachs and the University of Asia and the Pacific. Provide training programs, develop service manuals to prepare the industry for the rebound. Some proposals from the 2006 Manpower Summit include: encourage more training providers in the sector and possible expansion of the capacity of the existing TVET providers; encourage active participation of private sector in dual training system, apprenticeship program, enterprise-based training, and more on-the-job training (OJT); and promote assessment and certification especially in food and beverages and particularly on standards of safety on food and beverage handling. They can be done through one of these channels - school-based, center-based, community-based and enterprise-based programs - depending on the partner of potential international donor agencies that seek to support local tourism training programs and the local partner. Support through discounts or rebates can be given especially to SMEs participating in training programs
Investments- The DOT already endorsed five Development projects worth P6.323 Billion in 1st quarter of the year. These projects are projected to create 6,340 jobs for local residents. The preliminary figures from the BSP already revealed that tourism continues to attract interest from the international community and that the industry will not surely post zero investment despite the crisis
The Implementing Rules and Regulations of the Tourism Act of 2009 (Republic Act 9593) need to be drafted and promulgated by second week of November.
Other salient points of the Act with implications on LGUs include: masterplanning, identification of lands for tourism development, implementation of standards for accreditation, development of one-stop shops for investments and businesses to reduce time and financial costs (particularly in licensing and registration, land titling – including verification and

CRC Foundation Inc. - - The Global Recession and the Philippine Economy
23
Impact of the Crisis Actionable Recommendations authentication). Projects of international donor agencies can focus on these areas to help LGUs mobilize tourism investments in light of the Tourism Act of 2009
The crisis magnified the burden of costs on the tourism suppliers. Certain transaction costs tend to raise the costs of doing business in the country and make it easier for investors to shift operations to more competitive tourism destinations. Specifically, in the airline sector: gross receipts taxation (global sales and not just the business turnover in the Philippines) imposed on foreign airlines, costs of overtime payments (overtime rate per hour, meals and transportation allowances) to customs, immigration and quarantine personnel (CIQ), and impact of travel tax procedures
Review of the rationale for the collection of these charges and the taxation regime for foreign airlines, and make amendments to the rules and regulations that govern such practices in light of global practices and the long-term international connectivity and competitiveness of Philippine tourism. It is important to identify the remedies needed – administrative, legislative, executive, judiciary and the lead agencies to enable the reform process. To develop competitive and sustainable tourism taxation in the country, the pertinent laws and regulations on taxes and charges being applied to the entire tourism value chain (airlines, hotels, travel agencies, tour operators, facilities) need to be reviewed with a wholistic perspective – long term development of tourism. International agencies can support projects to assess the impact of the current tourism taxation regime on the value chain and propose ways to generate more innovative, competitive and sustainable sources of taxation revenues
The Philippines’ ranking has not improved based on international surveys Government has decided to channel some funds to infrastructure development, including tourism, in order to generate jobs
In general, infrastructure to improve farm to market access in the countryside and in the metropolis will benefit tourism as evidenced in the case of Thailand. The DPWH, DOT, DOTC already have a list of these projects. The airports and ports should be a priority in relation to improving processes and ensuring safety of travellers. There has been underinvestment in airport facilities and process improvements in the past decades. Local connectivity can also be improved with the completion of mass transport projects (e.g. rail system) within the metropolis and between the metropolis and its environs. Connectivity can also be improved with the development of port facilities to support domestic travel via the RORO.
Business • Possibly, some students may drop-out of college,
leading to deterioration in cohort rates. But in the
More students choosing to study in their localities may encourage dispersion of BPOs away from NCR (and Metro Cebu). Currently, BPOs in NCR generate

CRC Foundation Inc. - - The Global Recession and the Philippine Economy
24
Impact of the Crisis Actionable Recommendations
Process Outsourcing
short-term (within a one-year period), the impact on number of graduates may not be as significantly felt.
• Possibly, greater number of students will choose to study in their home localities rather (or in regional education hubs) than go to the NCR.
about 78% of total industry employment though the rest of the country accounts for around 75% of total college graduates—especially Regions IV-A, VI, VII and III. Ensure BPO readiness and friendliness of localities which serve as regional education hubs. Provide opportunities for part-time BPO employment to college students, as a way of funding their studies; or developing other mechanisms for financing their studies, e.g. thru loans and scholarships.
• Other industries’ slower growth can make employment
in BPOs more attractive for newly graduates and industry shifters.
• Retrenched workers from other industries and returning OFWs can be potential BPO applicants—provided they possess the required skill-sets or can be re-trained to acquire BPO-related skills.
• Specific country-knowledge of returning OFWs can provide opportunity to penetrate additional country-markets
Job assistance programs jointly organized by BPA/P, industry associations representing sectors negatively affected by the crisis, and relevant national and local government agencies. Job assistance programs for returning OFWs jointly organized by BPA/P and the appropriate national and local government agencies. Partnerships between BPA/P and academic institutions to provide students with a broader, more realistic understanding of the BPO sector and the career opportunities in this industry. Enhancing employer branding of BPOs.
• Better-qualified applicants may consider BPO
employment, e.g. graduates of “first-tier” schools (however they may be defined), graduates of courses more appropriate for BPO jobs, laid-off managers from other industries, etc.
• Academic institutions, given brighter prospects in the BPO sector, may embed BPO-related courses in college curricula and may actively encourage students to pursue BPO-related careers.
Partnerships between BPA/P and academic institutions in offering courses that will develop BPO-related skills (including English language proficiency) and in exploring internship opportunities in BPOs; harnessing greater involvement of the Commission on Higher Education (CHED) in these initiatives. Providing remedial training for “near-hires”. Reviewing Philippine basic educational system and benchmarking it with international practice, possibly towards (a) lengthening current 10-year basic

CRC Foundation Inc. - - The Global Recession and the Philippine Economy
25
Impact of the Crisis Actionable Recommendations education program and (b) developing courses more relevant for current shift towards technology-intensive, service-based economies.
• Given slower growth in other industries, BPO
professionals may be encouraged to stay longer with BPO companies.
•
Improving quality of life of BPO workers, in the context of nature of work and of work schedule. Promoting work-life balance within the industry. Developing career paths within the industry, including possibilities of overseas posting as part of business development teams in new markets (e.g. China). Improving leadership and supervisory skills of front-line BPO managers—who are typically young, newly-promoted BPO agents with limited work experience but tasked with handling large team(s) of agents. Consider developing new HR recruitment and employee retention models based on realities of the industry (i.e. of being considered as stepping stone towards career in other industries). Consider enhancing direct and indirect economic benefits (e.g. pay increases, training, benefits which are linked to tenure, e.g. car, housing & education plans, etc.) of BPO professionals, considering direct and indirect costs of attrition (e.g. cost of recruiting replacement—given low applicant’s success rate—for each worker that voluntarily leaves the BPO industry); possibly using as model the other industries which previously experienced pronounced talent recruitment needs and retention problems.
Mining
• In a 2008/2009 annual survey conducted by the Fraser Institute of 658 exploration and mining-related companies around the world, more than 4 out of 5 believe that at least 30% of exploration companies will be forced out of business in the current economic
Enhance the economic and non-economic impact of a mine operation. An organization must be in place, preferably devolved at the local level with adequate representation from appropriate agencies and local communities (perhaps the same organization or group being proposed in the minerals protocol above), to strictly monitor mineral production and exports, and help

CRC Foundation Inc. - - The Global Recession and the Philippine Economy
26
Impact of the Crisis Actionable Recommendations downturn. The same survey indicated that over 90% of respondents believe exploration and development activities will be curtailed, with 57% saying activity will decline a “great deal” and 85% saying that activities of production companies will be curtailed.
• The implications can be adverse to the Philippine mining sector as most projects in the country are still at the exploration and feasibility/financing stages. Postponements or outright cancellations of exploration activities can eliminate the Philippines’ long term prospects in mining.
• The postponement of exploration and commercialization activities can lead to commodity shortages when the economy recovers. According to the same report, “the world may face a shortage of raw materials and sky rocketing commodity prices as the world economy moves past the recession and into renewed growth.”
• The report further states “the curtailment of development activity will hit in the short-term, likely during the opening phase of the recovery period. The gap between exploration and production typically span five years to ten years. This means that the negative impact from the lack of exploration on commodity supplies will begin to hit as the recovery matures.” While it may augur well for existing mining operations, the report observed that “these problems could weaken the recovery and spark inflation fears.”
assist stakeholders draft programs for spending or allocation of their share in mining operations. Another way to fully optimize the impact of a mine operation is to encourage other sectors to invest in downstream operations like mineral processing plants. Tap local financial markets to fund mining projects. There is a need to educate local financial institutions about mining operations to encourage these to fund mining projects. There are on-going proposals to offer a Mining 101 course in UP to other interested parties like lawyers, accountants, government officials, etc. The participation of local financial institutions can lead to the mobilization of excess liquidity and to give a positive signal to investors about local commitment and confidence on mining prospects in the country. Lately, negotiations are on-going with the Philexim bank to extend credit guarantees on loans provided to mining projects.
Agriculture Philippine rice is not competitive with imports without tariff protection (now at 50% in-quota). Exporting rice is also a losing proposition. The lower world fertilizer
The national government (NG) and local government units (LGUs) must support the mayors and governors as the agriculture champions in their respective localities. Cluster farmers are convergence points for interventions

CRC Foundation Inc. - - The Global Recession and the Philippine Economy
27
Impact of the Crisis Actionable Recommendations and fuel prices in 2009 will help enhance farmers’ profits. Low fertilizer usage, increasing soil acidity, improving but still limited use of good seeds, as well as poor state of irrigation maintenance are among the causes of low yield. Extension services have also suffered since the advent of the Local Government Code in 1991. On the other hand, the drive for 100% self–sufficiency makes rice a disproportionate recipient (70 to 80%) of the DA budget. This has caused reduction of resources flowing to equally or more deserving sectors.
in: o irrigation systems restoration o certified and hybrid seeds use o extension services o soil analysis and organic fertilizer development
The private sector, given favorable business climate, can expand hybrid seed supply, and modernize the rice mills.
Corn is not yet competitive in export, but it will gain competitiveness with improvements in yield and farm and post-harvest infrastructure.
The tasks for the NG and LGUs are to: • construct, rehabilitate and maintain farm-to-market roads • build village level post harvest facilities • prepare for AFTA 2010.
On the part of the private sector:
• expand hybrid seed supply • invest in large post-harvest facilities (PHFs) (for corn cobs)
prepare for AFTA 2010
The dramatic fall in world prices in 2009 will cut farm profits. Only large peso depreciation can help reverse the income shrinkage. Low farm productivity and limited intercropping are the main causes of high poverty in coconut areas.
The NG through the Philippine Coconut Authority (PCA) and LGUs must consider fertilization of strategic areas. There are reports that yield can increase by 50% in 24-36 months.
As 95% of trees are of poor genetics, there is need for replanting with good
clones. In poverty areas such as coconut lands, intercrop for food and cash can have large spillover effects. Quick access to the levy money can help fund these projects. Meanwhile, depreciating the peso will mitigate the collapse of farm incomes in the coconut areas.

CRC Foundation Inc. - - The Global Recession and the Philippine Economy
28
Impact of the Crisis Actionable Recommendations The private sector should consider seed nuts multiplication as potential project.
Sugar is not competitive without the AFTA tariff of 38%. Export is not a viable option, except in the high-priced US quota market. Lower fertilizer and fuel prices in 2009 will support higher farm profits. The depreciation of the peso will help farm margins. The main challenge for the sugar industry is to attain global competitiveness. This involves addressing the supply chain gaps: input costs, cane yield, logistics to mill, mill efficiency. The advent of the agrarian reform program in 1988 and extended to 2008 has severely curtailed land transactions that could have given land to the efficient managers. Thus, economies of scale in plowing, irrigation and harvesting have been constrained.
The NG together with LGUs can consider the following: o improving key farm-mill roads, and o expanding irrigation access to sugar lands.
The private sector needs to:
o sustain R&D by the Philsurin in cooperation with the Sugar Regulatory Administration;
o improve mechanization rate; and o hone extension services through the mill district development
council.
The industry is globally competitive. It is expanding market share and is a dominant supplier in Asia. Lower world fertilizer prices will enhance farm profits; peso depreciation will boost peso earnings. Mindanao has the potential for expansion given the growth of the banana market in Asia and the Middle East. Expansion into new areas will entail several activities:
o building access roads to farm areas; o stable policy environment; and o securing peace.
The Government can provide the enabling environment by: o improving road networks to plantations and potential areas; o restoring peace in Mindanao; and o lobbying for entry of bananas to Australia.
The role of the private sector: there is need to replicate the financing schemes of OneNetworkBank, Tagum Rural Bank and PenBank to individual small farmers with BPPA contracts with big buyers. The Bangko Sentral ng Pilipinas and Land Bank’s 5-7 year rediscounting plus technical assistance to bank’s production technicians could be the key component.

CRC Foundation Inc. - - The Global Recession and the Philippine Economy
29
2. The Global Meltdown: Macroeconomic Implications On The Philippines
Emilio T. Antonio, Jr., Ph.D.
1
The US and the other major economies are suffering from a credit crunch originating from a severe loss of confidence among the players in the financial system. With the drying of credit, a slowdown in economic activities is expected. History shows that the downturn after a banking crisis usually lasts for four years. Conventional wisdom says that when the US sneezes, the Philippine economy catches cold. Now that it is down with flu, therefore, the nagging question is: Will the Philippines catch pneumonia? Before accepting the wisdom of such conventional saying, it is important to examine the logic and facts behind such conclusion.
2.1 Examining the mechanics
How will the Philippines be affected by these developments? There can be direct and indirect effects. The direct effects would be felt by those financial institutions that bought the toxic loans that the US peddled to economies world wide. The indirect effects, on the other hand, would be felt through the possible slowdown in the business transactions between the US and the Philippines as a result of the recession expected to result from the financial meltdown in the US. The direct effects are likely to be minimal. True, there were several banks that got themselves entangled with the financial instruments that were peddled by the US financial agents. However, given the lack of familiarity of the Philippine financial players with these ‘innovative’ financial instruments, the bets they placed on these investment tools were quite limited. The impact of the bottom lines of those banks exposed to these toxic financial papers have been recognized and for some, these have been significant. Nevertheless, they are not likely to place these banks on the brink of possible collapse. The greater risk of contamination therefore lies on the possible effects of the imminent recession in the US and other big economies to the Philippine economy. There are two questions that we need to examine to help us guess how these developments will affect us.
a. First: Is the Philippine economy healthy enough to absorb the impact of the impending shocks?
b. Second: How is the Philippine economy linked to the US and other major economies and to what would be likely extent of the damage these developments can inflict on the economy?
1 Associate Professor, University of Asia and the Pacific

CRC Foundation Inc. - - The Global Recession and the Philippine Economy
30
How do we assess a nation’s financial strength? An analogy with how the financial strength of a household can be helpful. There are three key indicators that we watch to be able to judge whether a household is financially stable:
a. How much cash it has b. The state of balance between what it earns and what it spends c. Its access to other people’s money
Why are these indicators important?
a. The amount of cash it has would be an important indicator of whether it has the capability to survive a sudden drying up of its income sources. Thus, households are usually advised to set aside what it would need for survival just in case the head of the household loses his job. The usual rule of thumb is the amount of cash needed for the family’s sustenance for six months which is the usual amount of time needed to find a new job.
b. The state of balance between what it earns and what it spends indicate whether it has the habit of living within its means. Once a household incurs a deficit, it will have to dip on its cash reserve. If it has none, somebody else has to finance it.
c. Finally, the ease of its access to other people’s money is another indicator if it can weather a situation when its sources of income temporarily dry up.
Using these three indicators, we can easily spot a household in severe financial trouble when we see the following signals: it has run out of cash at a time when its expenses exceed its income and the other sources of funds dry up. Under these circumstances, it would become extremely difficult for the household even to think of how to earn more. Using the Paradigm for the Nation
A nation can be looked at in a similar manner. Consider the following:
a. When a nation spends more than what it earns, the deficit will be reflected as the excess of spends on imported goods and services and what it earns from what it exports. This is not a theory; it is an accounting truth.
b. The problem with imports and exports is that they are transactions with the rest of the world. For these transactions, the peso is useless. Thus, when there is a deficit, we would need foreign currencies to finance it.
c. Where do we get the foreign currencies to fill up the gap? We can draw from our reserves, attract foreign investors, borrow from financial institutions or at the extreme case, run to IMF.
d. If the gap between income and spending cannot be financed by all of these sources combined, a shortage of foreign currencies will ensue. Once the shortage becomes evident, upward pressures on the price of foreign currencies (i.e. the peso-dollar rate) would develop. This would in turn cause interest rates to go up, inflation rates to rise which would eventually push the workers

CRC Foundation Inc. - - The Global Recession and the Philippine Economy
31
to clamor for higher wages. The result would be an atmosphere of uncertainty where practically every one would be trying to outguess each other on the peso-dollar rate or on any other prices. Consequently, bets on the future (real investments) would suffer and production activities slow down.
The critical indicators to watch therefore are the nation’s dollar resources and transactions. The similarities with the key indicators of a household financial health are summarized in the table below.
Household Nation
Cash Position: how many months can the cash last if
income flows stop
Gross and Net International Reserves (GIR and NIR)
How many months of imports can the stock of dollars in the vaults of the central
bank finance?
Balance between income and spending Balance between the dollar income and
dollar expenses (Current Account Balance)
Access to other people’s money Balance between the inflows and
outflows of capital in the form of dollars (Capital Account Balance)
Among these three, the most important is the balance between income and spending. A surplus here means that the cash position is being built. A good cash position improves the capability of the household to tap other people’s money. In the same way, a nation with good levels of international reserves becomes attractive to foreign lenders and investors.
2.2 External Transactions
How are we faring in this aspect? Actually we have not completely shed off some bad habits. Our earnings from our exports still fall short of our expenditures on imports and the gap between the two has been widening. Our saving grace: remittances from our overseas workers. The amount of dollars remitted by Filipinos working abroad have so significantly increased that in the recent years, these have completely offset the deficits in our trade account.

CRC Foundation Inc. - - The Global Recession and the Philippine Economy
32
Figure 2.1
Balance of Trade and OFW Remittances
-15
-10
-5
0
5
10
15
20
80 82 84 86 88 90 92 94 96 98 00 02 04 06 08
in b
illio
n d
olla
rs
Exports - Imports OFW remittances
Source: Bangko Sentral ng Pilipinas (BSP)
These recent developments actually contrast sharply from our past records. Until around 2000, the deficit in our trade account could not be filled up by the remittances of our workers. What kept the overall balances of dollar inflows with outflows were the surpluses in the amount of dollars that came in and out of the country in the form of capital. For the past eight years, however, we have been posting surpluses in our current account balance – a welcome phenomenon because our capital account has been extremely volatile.
Figure 2.2
Current and Capital Account Balances
-6
-4
-2
0
2
4
6
8
10
12
80 85 90 95 00 05
in b
illi
on
do
llars
Current Capital
Source: BSP

CRC Foundation Inc. - - The Global Recession and the Philippine Economy
33
Within the perspective of these developments, the improvements in the nation’s cash position can be better appreciated. We can compare and contrast three periods.
a. In the eighties, we were having difficulties in keeping the level of our gross international reserves at levels sufficient to finance three months worth of our imports. Even worse, our net international reserves (i.e. our gross reserves less the amount of our debt obligations which are due within the year) have always been in the negative zone. In other words, the amount of dollars we have in the vaults of the central bank would not even be enough to meet our short term obligations!
b. In the nineties, our cash position improved. Both the gross and net eventually reached levels equivalent to about 4 – 5 months of our import requirements. It is important to note, however, that during this period, we were continuously posting deficits in our current account – i.e. the dollars that we earned were perennially short of the dollars that we spent. Fortunately, foreign investments came in and more than offset the deficits in our current account allowing us to even improve our cash balances.
c. For most of the years during the present decade, our current account finally posted sustained surplus. This came at an opportune time when our political troubles have scared off foreign funds. In short, the recent improvement in our cash position has been built on more solid grounds. These have resulted from a reform in our income-spending habits rather than from a heavy reliance on other people’s money.
Figure 2.3
Current Account Balances in Three Crisis Periods
-6
-4
-2
0
2
4
6
8
80 85 90 95 00 05in b
illio
n d
olla
rs
Source: BSP
Marcos
Crisis
Aquino
Crisis
Asian
Crisis

CRC Foundation Inc. - - The Global Recession and the Philippine Economy
34
Figure 2.4
Gross and Net International Reserves in Three Crisis Periods
-6
-4
-2
0
2
4
6
8
82 87 92 97 02 07
in m
on
ths
of
imp
ort
s
Gross Net
Source of data: BSP
2.3 State of the Nation’s Financial Health
The indicators of the nation’s financial health therefore clearly suggest that we are in a far better position at present than when the Asian financial crisis took place. The nation’s income is in excess of its spending which allowed us to improve our cash position. The combination of these two developments should have made us more attractive to foreign investors. Unfortunately, the crisis gripping them at the moment has dampened their enthusiasm to invest in their economies much less to other countries. Nevertheless, as long as no dramatic reversals of the trends in the income-spending balances of the nation take place, the drying up of foreign currencies from foreign lenders and investors is unlikely to cause a foreign exchange crisis in the Philippines. Financial health vs. Macroeconomic performance
Are the improvements in these indicators of financial health mirrored in the key indicators of the nation’s macroeconomic performance? From a macroeconomic standpoint, two indicators are critical:
a. The relative stability of the prices of goods (inflation rate), funds (interest rate) and foreign currencies (peso-dollar rate); and
b. The growth of the nation’s real income. The improvements in the nation’s financial health are expected to be directly felt in the stabilization of the movements of the prices of goods, funds and foreign currencies. In turn, these improvements in the relatively predictability of prices create the conditions where businesses and consumers can think in terms of longer-time
Marcos
Crisis
Aquino
Crisis
Asian
Crisis

CRC Foundation Inc. - - The Global Recession and the Philippine Economy
35
horizon, and would therefore be conducive to the improvement of the growth of nation’s real income. From these perspectives, therefore, the macroeconomic gains that resulted from the improved financial health of the nation can be better appreciated if we examine the longer term performance of the Philippine economy in terms of these sets of indicators. Clearly, the present price environment is far more stable than our turbulent past and the growth in real income (measured by the growth of the gross national product in peso terms minus the growth in consumer prices) has definitely improved in the more recent years.
Table 2.1 Indicators of Price Changes under Five Presidents
Average Annual Rates (in %) across Historical Periods
Marcos Aquino Ramos Estrada Arroyo
Inflation rate 14.3 9.8 8.2 6.6 5.5
Interest rate 14.4 19.3 12.6 10.8 7.2
% change in P/$ rate
11.1 4.8 9.1 9.9 0.4
Sources of Data: BSP, National Statistics Office (NSO)
Table 2.2
Indicators of Growth of Nation’s Buying Power under Five Presidents Average Annual Rates (in %) across Historical Periods
Marcos Aquino Ramos Estrada Arroyo
% change in nominal GNP
17.7 14.0 12.0 11.4 11.4
Inflation rate 14.3 9.6 8.2 6.9 5.5
% change in buying power
3.2 4.1 3.9 4.3 5.6
Sources of Data: National Statistical Coordinating Board (NSCB)
The same picture can be gleaned from the records of our income per person both in terms of 1985 pesos and in current prices converted into dollars. The picture that emerges sharply highlights the importance of the three indicators of financial health (i.e. cash position, income and spending balance and access to other people’s money). The severe financial crisis during the closing years of the Marcos regime threw back the level of the nation’s income per person to its level 14 years prior to that crisis. The subsequent income-spending imbalances, the shortages of cash and the lack of access to foreign savings impeded the nation’s recovery resulting in the loss of more than two decades in the development game. The recent improvements in these indicators have finally brought us back to the growth path that we used to traverse in the 50s and 60s.

CRC Foundation Inc. - - The Global Recession and the Philippine Economy
36
Figure 2.5
Per Capita Income at constant 2008 prices
40
50
60
70
80
90
100
70 73 76 79 82 85 88 91 94 97 00 03 06GN
P p
er
pers
on
(000 2
008
peso
s)
Source: NSCB
Figure 2.6
Per Capita Income at current prices in dollars
100
400
700
1000
1300
1600
1900
2200
70 73 76 79 82 85 88 91 94 97 00 03 06GN
P p
er
pers
on
(cu
rren
t d
ollars
)
Source: NSCB
Will the global crisis undermine financial strength?
Although the financial health of the nation has improved, we still need to examine if this strength can be seriously undermined by the ongoing global crisis. For this purpose, we need to elaborate on the framework we have previously used.
Marcos
Aquino
Ramos
Estrada
Arroyo
Marcos
Aquino
Ramos
Estrada Arroyo

CRC Foundation Inc. - - The Global Recession and the Philippine Economy
37
Figure 2.7
Framework for Assessing Indirect Effects of Global Crisis
Based on this framework, there are three critical questions to ask:
a. Will the income sources dry up? Will the global crisis severely handicap our capability to earn income from agriculture, industry, services and OFW remittances?
b. Will the expenses go out of control? Will the private and public sector go on overspending spree that could cause a huge imbalance in the finances of the nation?
c. Will the nation still have access to foreign savings? Will the foreign investors and lenders find the Philippines an attractive place for their money?
Would income sources dry up?
There are three sources of income that appear vulnerable to the global crisis:
a. Exports of goods and services b. Remittances of OFWs c. Income from the business process outsourcing sectors.
The first concern is the one that receives the most attention at the moment. The usual conclusion: The growth of our exports would slowdown because of the markets where we are selling our goods are in recession. This would seem logical and the most recent records of exports seem to confirm this. Since December 2008, our exports have already posted extraordinary declines.
Will income
sources dry up?
Agriculture
Industry
Services OFW Remittances
Consumption
Investment
Gov’t
Interest Payments
Will expenses go
out of control?
Will the nation
have access to
foreign savings?
Current
account
balance
Gross/net
International
Reserves
Capital
account
balance

CRC Foundation Inc. - - The Global Recession and the Philippine Economy
38
Figure 2.8 Monthly Exports of Goods in million Dollars
0
500
1000
1500
2000
2500
3000
3500
4000
4500
5000
50 55 60 65 70 75 80 85 90 95 00 05 10
in m
illio
n d
olla
rs
Source: NSO
Although it is true that our export earnings have slowed down, there are indicators that suggest that this is not entirely due to the slowing down on the markets that we serve. Consider the following:
a. Last year, while the growth of our exports declined, other Asian countries were still posting dramatic increases in their exports.
Growth of $ value of exports vs. previous year, 2008
(in %)
Philippines -2.65
Malaysia 16.15
Indonesia 18.03
Thailand 34.21
Singapore 14.26
India 19.49
Korea 14.38
Taiwan 3.64
China 17.23
Vietnam 34.40
Source: BSP
b. This was not only happening last year. Our exports used to be growing faster than the exports of these countries. Starting 2000, however, our pace of growth slackened while the growth of the other countries picked up substantially.
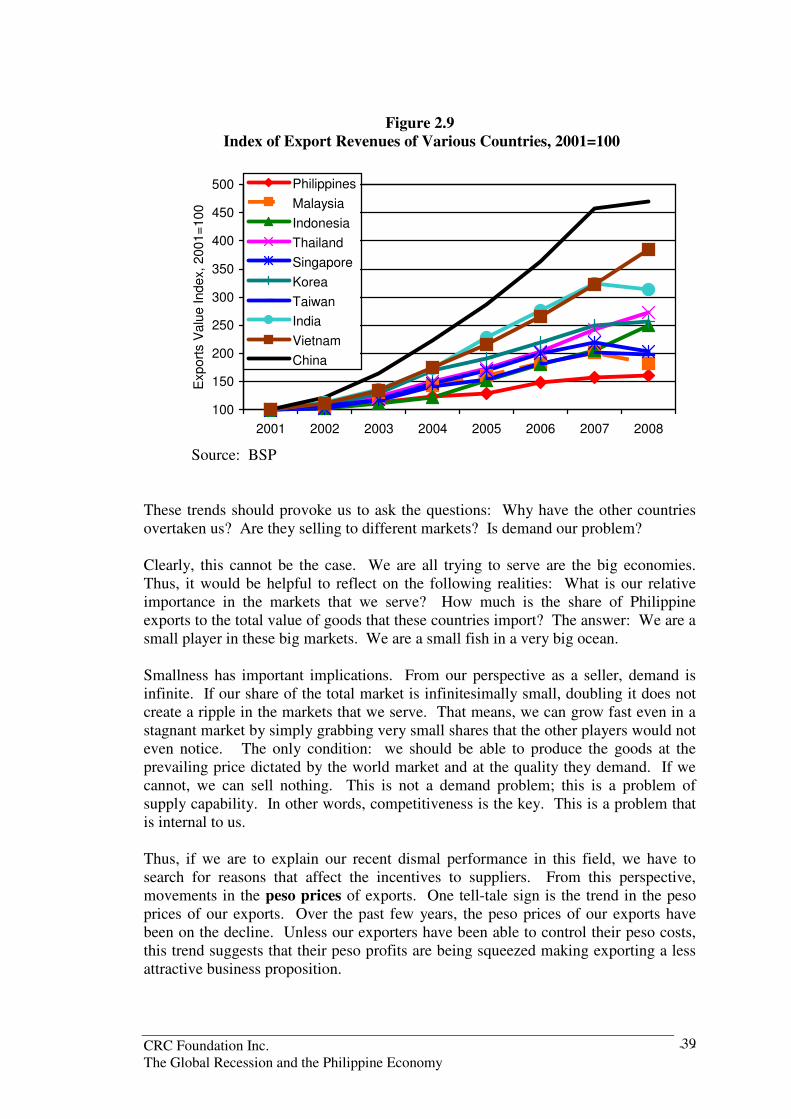
CRC Foundation Inc. - - The Global Recession and the Philippine Economy
39
Figure 2.9
Index of Export Revenues of Various Countries, 2001=100
100
150
200
250
300
350
400
450
500
2001 2002 2003 2004 2005 2006 2007 2008
Export
s V
alu
e Index, 2001=
100
Philippines
Malaysia
Indonesia
Thailand
Singapore
Korea
Taiwan
India
Vietnam
China
Source: BSP
These trends should provoke us to ask the questions: Why have the other countries overtaken us? Are they selling to different markets? Is demand our problem? Clearly, this cannot be the case. We are all trying to serve are the big economies. Thus, it would be helpful to reflect on the following realities: What is our relative importance in the markets that we serve? How much is the share of Philippine exports to the total value of goods that these countries import? The answer: We are a small player in these big markets. We are a small fish in a very big ocean. Smallness has important implications. From our perspective as a seller, demand is infinite. If our share of the total market is infinitesimally small, doubling it does not create a ripple in the markets that we serve. That means, we can grow fast even in a stagnant market by simply grabbing very small shares that the other players would not even notice. The only condition: we should be able to produce the goods at the prevailing price dictated by the world market and at the quality they demand. If we cannot, we can sell nothing. This is not a demand problem; this is a problem of supply capability. In other words, competitiveness is the key. This is a problem that is internal to us. Thus, if we are to explain our recent dismal performance in this field, we have to search for reasons that affect the incentives to suppliers. From this perspective, movements in the peso prices of exports. One tell-tale sign is the trend in the peso prices of our exports. Over the past few years, the peso prices of our exports have been on the decline. Unless our exporters have been able to control their peso costs, this trend suggests that their peso profits are being squeezed making exporting a less attractive business proposition.

CRC Foundation Inc. - - The Global Recession and the Philippine Economy
40
Figure 2.10
Index of Peso Prices of Philippine Exports, 1985=100
Averageannualgrowth
10.8%
Averageannual growth
- 1%
100
150
200
250
300
350
400
450
500
90 92 94 96 98 00 02 04 06 08* 10
Price
Inde
x, 1
98
5=
100
Price of Exports
Source: NSCB
The next question to ask: Why have peso prices of exports been on the decline? The equation to remember is quite simple: peso price of exports is simply the world dollar price multiplied by peso-dollar rate. Thus, these declines can only come from two things: from the movements of the world dollar price and/or the peso-dollar rate. Judging from the movements of the peso-dollar rate, it is clear that the more significant portion of the decline in the peso prices of exports came from the decline in the peso-dollar rate.
Figure 2.11
Peso-Dollar Rates
Averageannual
growth6.5%
Averageannualgrowth
- 2.0%
20
25
30
35
40
45
50
55
60
90 91 92 93 94 95 96 97 98 99 00 01 02 03 04 05 06 07 8 09 10
Peso
-Do
llar
Ra
te
Peso-dollar rate
Source: BSP

CRC Foundation Inc. - - The Global Recession and the Philippine Economy
41
Some would argue that other currencies have been experiencing a similar fate because the dollar has grown weaker in the international financial market. This is only partly true. The US dollar has become cheaper also relative to other currencies. Nevertheless, the fall in the peso of price of the dollar has been faster compared to the declines in its price in terms of other currencies. Implication: other foreign currencies have also become cheaper in peso terms. Consequently, our competitiveness in relation to these countries must have been eroded. No wonder, their exports have grown much faster than ours.
Figure 2.12 Index of the exchange rates of the peso vs. currencies of various countries
60
70
80
90
100
110
120
130
140
150
97 98 99 00 01 02 03 04 05 06 07 08 09 10
Peso p
rice indic
es o
f fo
reig
n c
urr
encie
s,
2000=
100
US
Taiwan
S Korea
Singapore
Malaysia
Thailand
Indonesia
Source: BSP
The loss of competitiveness which occurred much earlier than the onset of the global crisis is clearly reflected in the trend of our earnings from manufactured exports. In the 90s, our revenues from manufactured exports were growing annually at an average of more than 19%. During the new millennium, growth of revenues slowed down to a measly 4.3%. Since the other countries selling to the same market continued to grow at double digit rates, it is clear that our problem is not lack of demand. Our competitiveness has been eroded and a large part of this could be traced to the strength of our currency.
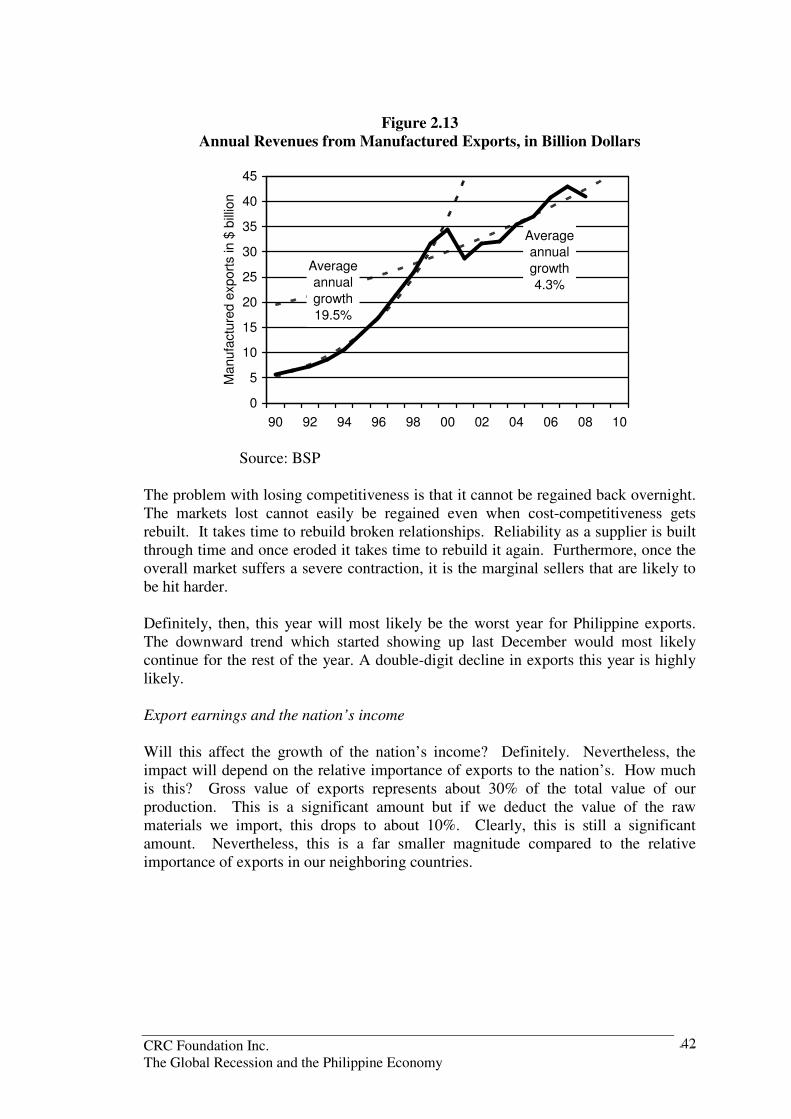
CRC Foundation Inc. - - The Global Recession and the Philippine Economy
42
Figure 2.13
Annual Revenues from Manufactured Exports, in Billion Dollars
Averageannual
growth
19.5%
Averageannual
growth
4.3%
0
5
10
15
20
25
30
35
40
45
90 92 94 96 98 00 02 04 06 08 10
Ma
nufa
ctu
red e
xport
s in
$ b
illio
n
Source: BSP
The problem with losing competitiveness is that it cannot be regained back overnight. The markets lost cannot easily be regained even when cost-competitiveness gets rebuilt. It takes time to rebuild broken relationships. Reliability as a supplier is built through time and once eroded it takes time to rebuild it again. Furthermore, once the overall market suffers a severe contraction, it is the marginal sellers that are likely to be hit harder. Definitely, then, this year will most likely be the worst year for Philippine exports. The downward trend which started showing up last December would most likely continue for the rest of the year. A double-digit decline in exports this year is highly likely. Export earnings and the nation’s income
Will this affect the growth of the nation’s income? Definitely. Nevertheless, the impact will depend on the relative importance of exports to the nation’s. How much is this? Gross value of exports represents about 30% of the total value of our production. This is a significant amount but if we deduct the value of the raw materials we import, this drops to about 10%. Clearly, this is still a significant amount. Nevertheless, this is a far smaller magnitude compared to the relative importance of exports in our neighboring countries.

CRC Foundation Inc. - - The Global Recession and the Philippine Economy
43
Figure 2.14 Share of Export Revenues to the Gross National Product, in per cent
0%
10%
20%
30%
40%
50%
60%
1999 2000 2001 2002 2003 2004 2005 2006 2007 2008
Export
s a
s %
of G
NP
Gross
Net of Imported RM
Source: NSCB, BSP
Workers Remittances
Similar in magnitude in terms of contribution to the nation’s income are the remittance of OFWs. On the average, this has been increasing at the rate of about $1.8 billion per year. The bigger fraction of this comes from land-based OFWs whose remittances have been growing at a fast clip of about $1.5 billion per year. The sea-based workers’ remittances, on the other hand, which accounts for about 15% of the total remittances has been increasing at about $ 300 million per year.
Figure 2.15 Remittances of Overseas Filipino Workers, in billion dollars
Average
annual
increase
$1.5B
Averageannual
increase
$0.3 B
0
2
4
6
8
10
12
14
16
18
97 98 99 00 01 02 03 04 05 06 07 08 09 10
in $
bill
ion
Land-based
Sea-based
Source: BSP

CRC Foundation Inc. - - The Global Recession and the Philippine Economy
44
Between the two, the more seriously threatened by the world crisis are the remittances from sea-based workers. With the slowdown in the global trade, there is a possibility that a substantial number of our seafarers would lose their jobs. Nevertheless, the remittances figures for the first quarter of this year still show no signs of such deceleration. Remittances from land-based workers also remained firm. The growth has slowed down but no declines were posted. Using the past patterns of remittances as guide, it seems that the more important factor affecting remittances are internal rather than external. During the episode of the Asian financial crisis, remittances even grew faster. A slowdown, however, can be observed during the turbulent years of the Estrada period and the early years of the Arroyo administration. In the more recent years, however, a dramatic acceleration of the flows can be observed. Thus, if past patterns persist, it seems that inflow of OFW remittances would continue. The worst case seems a slowdown in growth but a decline appears unlikely, A big chunk of our remittances originate from the US. Many of these workers are teachers and nurses whose jobs are not likely to be threatened by the slowdown in the economic activities. Business Process Outsourcing
The third source of income growth for the Philippine economy is the business process outsourcing industry. This is a relatively young sector whose growth was stimulated by two factors: the dramatic drop and widespread availability of telecommunication facilities together with the huge difference between the cost of skilled workers between developed and developing countries. Thus, backroom operations of firms like call center operations, human resource management, financial analysis and IT-related activities can be done more cheaply in developing countries. According to some studies, only 4% of the business activities that can be potentially outsourced have been tapped by the sector. Thus, the room for growth in this business is still big. Consequently, the loss in business from those firms that will be affected by the global crisis can be compensated by the decisions of the surviving firms to outsource some of their business processes. In fact, the pressures to outsource can be expected to be greater due to the cost-cutting drives that can be expected from these firms that would be operating in a tougher environment. The Philippines is well-positioned to take advantage of these developments. It enjoys a good reputation in this business. Again, the main constraint here would the be availability and cost of the manpower needed to sustain the growth of BPOs. This does not look like a problem in the short run because BPOs are now trying to tap the pool of human resources available outside of the National Capital Region. In the medium term, however, this is an internal problem that we need to address. Bonus: Slowdown in inflation rate would boost real buying power
It is clear then that dramatic drop in income from exports can be offset by the continued inflows of workers’ remittances as well as the growth in the BPO sector. As a bonus, the real buying power of the incomes earned by the nation would get a

CRC Foundation Inc. - - The Global Recession and the Philippine Economy
45
boost from the slowdown in inflation rate. Two pressures that pushed inflation last year have eased up. The bubble in the dollar prices of petroleum in the world market has burst and the increases in the price rice have decelerated. As of May this year, inflation has slowed down to 3.3%. Definitely, the increase in the prices of consumer goods this year will be below 5%.
2.4 Will Spending Spin Out Of Control?
Given the positive outlook on the nation’s income, the remaining factors that could undermine the nation’s macroeconomic strength would be the nation’s spending propensities and its access to foreign savings. While the current strategies being employed in the more developed countries have centered on increased spending, such policies need to be applied with caution in a small country context whose currencies are not acceptable for international transactions. Ultimately, deficits incurred by the nation need to be financed by foreign currencies. And as the Philippine experience in the decades of the 70s, 80s and 90s show, there is a high price to pay for excessive profligacy. There are two main groups of earners and spenders: the private and the government sectors. How is the nation’s income split up between them? Up to 1997, the share of the nation’s income going to the government was on an upward trend. This trend has been reverse. From a relative high share of more than 16%, the government’s share of the nation’s income plummeted to a low of about 11%. Although there has been a slight reversal in the recent years, the peak recorded in 1997 has not been duplicated.
Figure 2.16 Tax Collections as Percentage of GNP
9%
10%
11%
12%
13%
14%
15%
16%
17%
18%
81 86 91 96 01 06
Ta
xe
s c
olle
cte
d a
s %
of In
co
me
Source: NSCB, Bureau of Treasury (BoT)
Private sector’s behavior
If the share of the government has been declining, this can only mean that the proportion that remained in the private sector’s hands must have been increasing. The question is: How has the private sector managed its finances?

CRC Foundation Inc. - - The Global Recession and the Philippine Economy
46
As a whole, the private sector has been exhibiting an improvement in its spending behavior. As a proportion of the nation’s income, personal consumption expenditure has been on the decline.
Figure 2.17 Personal Consumption Expenditures as % of GNP
60%
62%
64%
66%
68%
70%
72%
74%
76%
78%
81 83 85 87 89 91 93 95 97 99 01 03 05 07 09
Private
consum
ption a
s %
of
GN
P
Source: NSCB
In terms of balancing its incomes with expenses, the records have likewise improved. Up to 1997, the private sector was posting deficits. This has changed. It has been posting surpluses since then.
Figure 2.18 Income-Spending Balances of the Private Sector
-5
0
5
10
15
20
25
30
85 87 89 91 93 95 97 99 01 03 05 07Private
Secto
r's Incom
e-S
pe
ndin
g
Bala
nce a
s %
of G
NP
Source of basic data: NSCB
Implication: The nation’s savings rate has improved considerably. From dismally low levels of about 16% in the nineties, savings rates have gone up to almost 28% in the recent years. No wonder banks have been awash with funds and this has cause interest rates to decline substantially.

CRC Foundation Inc. - - The Global Recession and the Philippine Economy
47
Figure 2.19
Gross Savings Rate as % of GNP
12
14
16
18
20
22
24
26
28
30
86 89 92 95 98 01 04 07
Savings/GNP
Source of Basic Data: NSCB
Figure 2.20 Average Monthly 91-day Treasure Bill Rates
0
5
10
15
20
25
30
86 89 92 95 98 01 04 07
91-d
ay T B
ill R
ate
The more problematic aspect of the private sector’s behavior, however, is its investment behavior. Despite the availability and low cost of funds, the proportion of the nation’s income set aside for private investment has been on the decline. In other words, private investors seem to be afraid of betting on the future.

CRC Foundation Inc. - - The Global Recession and the Philippine Economy
48
Figure 2.21 Private investment Expenditures as % of GNP
5%
10%
15%
20%
25%
81 84 87 90 93 96 99 02 05 08
Private
Investm
ent
as %
of
GN
P
Source of Basic Data: NSCB
The government’s struggles
Contrary to common impressions, the government has likewise shown relatively prudent behavior. Government consumption expenditures (i.e. those expenses that are directly related to the running of the government bureaucracy) have been declining as a proportion of the nation’s income.
Figure 2.22 Government Consumption Expenditures as % of GNP
5%
6%
7%
8%
9%
10%
11%
12%
13%
14%
81 83 85 87 89 91 93 95 97 99 01 03 05 07 09
Gov't
Consum
ption E
xpenditure
s a
s %
of G
NP
Source of Basic Data: NSCB
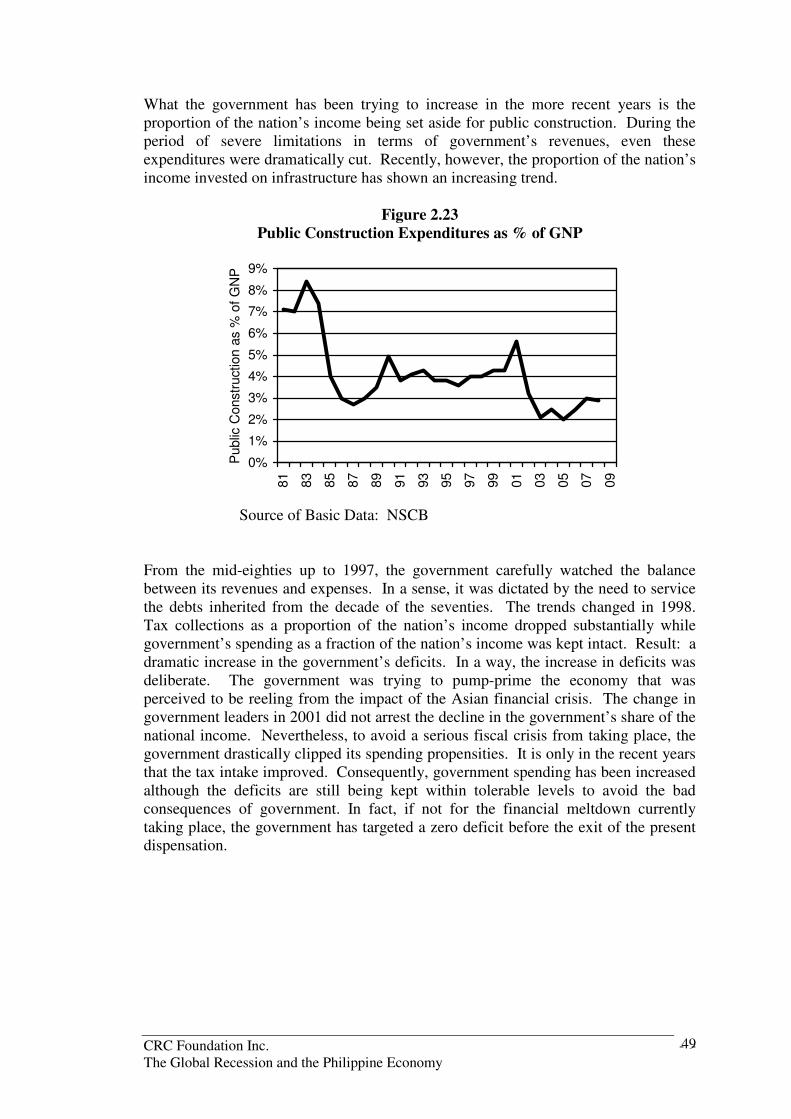
CRC Foundation Inc. - - The Global Recession and the Philippine Economy
49
What the government has been trying to increase in the more recent years is the proportion of the nation’s income being set aside for public construction. During the period of severe limitations in terms of government’s revenues, even these expenditures were dramatically cut. Recently, however, the proportion of the nation’s income invested on infrastructure has shown an increasing trend.
Figure 2.23 Public Construction Expenditures as % of GNP
0%
1%
2%
3%
4%
5%
6%
7%
8%
9%81
83
85
87
89
91
93
95
97
99
01
03
05
07
09
Public
Constr
uct
ion a
s %
of
GN
P
Source of Basic Data: NSCB
From the mid-eighties up to 1997, the government carefully watched the balance between its revenues and expenses. In a sense, it was dictated by the need to service the debts inherited from the decade of the seventies. The trends changed in 1998. Tax collections as a proportion of the nation’s income dropped substantially while government’s spending as a fraction of the nation’s income was kept intact. Result: a dramatic increase in the government’s deficits. In a way, the increase in deficits was deliberate. The government was trying to pump-prime the economy that was perceived to be reeling from the impact of the Asian financial crisis. The change in government leaders in 2001 did not arrest the decline in the government’s share of the national income. Nevertheless, to avoid a serious fiscal crisis from taking place, the government drastically clipped its spending propensities. It is only in the recent years that the tax intake improved. Consequently, government spending has been increased although the deficits are still being kept within tolerable levels to avoid the bad consequences of government. In fact, if not for the financial meltdown currently taking place, the government has targeted a zero deficit before the exit of the present dispensation.

CRC Foundation Inc. - - The Global Recession and the Philippine Economy
50
Figure 2.24
Taxes and Government Expenditures as % of GNP
Sources of Basic Data: NSCB, BoT
2.5 Summary
Summing up, our historical records of income and spending give encouraging answers to the critical questions that we have identified.
a. Will the global crisis cause our sources of income to dry up?
1. Export revenues have indeed dried up and the difficulties faced by our
exporters are likely to continue. Nevertheless, the bigger part of this slowdown is not due to global crisis. Export revenues have been declining much earlier and the more likely culprit seems to be the erosion of the nation’s competitiveness which has been undermined by the long-term decline peso-dollar rate.
2. Two sources of income, however, seem to be holding up to the
challenge of the crisis: the remittances from OFWs and the continued growth in the revenues from BPOs.
3. The growth of the nation’s buying power (i.e. growth in nominal gnp
less the inflation rate) is also getting a boost from the dramatic decline in inflation rate. The pressures that pushed inflation rates last year have eased up. World oil prices have tumbled and increases in the price of rice have moderated.
b. Will it cause spending to spin out of control?
1. The private sector has behaved prudently. Personal consumption
expenditures as proportion of the nation’s income continue to drop.
10%
11%
12%
13%
14%
15%
16%
17%
18%
86 89 92 95 98 01 04 07
Taxes as % of GNP Expenses as % of GNP

CRC Foundation Inc. - - The Global Recession and the Philippine Economy
51
Saving rate continue to improve causing interest rates to decline. The only problem: private investors are hesitating to bet on the future despite the improved conditions in the credit market.
2. The public sector has been similarly well behaved. Government
consumption expenditures have declined as proportions of the nation’s income while there have been attempts recently to jack up what the nation sets aside for infrastructure spending. Furthermore, the track records of the government over the past six year in terms of managing the balance between its revenues and expenses suggest remarkable prudence.
c. Will we have access to foreign savings?
1. Given our track records and the present state of affairs, we should be
more attractive to foreign lenders and investors. The private and public sectors have been managing well the balances between their income and spending. This has allowed the nation to build up its international reserves. These two indicators are the ones usually looked at to assess a nation’s creditworthiness or attractiveness as an investment area.
2. Unfortunately, we still seem to be out of the radar of foreign creditors
and investors. On the net, more dollars in the form of capital still flow out of the country compared to the amounts of capital that come in. Clearly, there is a need to improve the foreigners’ perceptions on our economy to stimulate them to bet on our future.
2.6 Implications On Policy Formulation
What do these suggest on how policies should be crafted in response to the crisis? The following considerations are important to keep in mind:
1. Lack of global demand is not our main problem. The erosion of competitiveness of our export sector which has been taking place even before the crisis struck seems to be the more important one to address.
2. Lack of confidence is holding back our growth prospects. Despite the
availability and lower cost of funds, domestic investors continue to hesitate to bet on our future. Also, despite the dramatic improvements in the nation’s financial health, foreign investors and creditors are still hesitating the park their savings on Philippine shores.
3. Employment generation still falls short of the nation’s needs. The number of
people employed is increasing but the rate of growth is still too low to make a significant impact on the nation’s unemployment problem.

CRC Foundation Inc. - - The Global Recession and the Philippine Economy
52
In short, the roots of the obstacles to the nation’s growth have weak links on the global crisis. They are deep-seated problems that require strategic responses with or without the crisis. True, the nation’s income will most likely weather the current global turmoil but when the recovery sets in, we might not be ready to take advantage of it unless strategic reforms that address these weaknesses are aggressively put in place. These considerations would be helpful in evaluating the government’s response to the crisis as articulated in its Economic Resiliency Plan (ERP) Economic Resiliency Plan There are four components in the plan:
(a) increase in budget (b) reduction in taxes (c) large infrastructure projects jointly undertaken with the private sector (d) improvement of social security benefits.
It is laudable that the program is presented as one that aims to accomplish three things instead of simply a deficit program aimed to offset the drop in aggregate demand expected as a consequence of the global crisis:
(a) that the amounts budgeted are actually spent (b) that the expenditures made would have high impact (c) that the participation of the private sector is harnessed
In other words, the government has avoided presenting this as a deficit target or as a Keynesian medicine as the more developed countries are now doing. This is a prudent move. Government deficits could stimulate demand but they could also pose problems when they leak out as demand for imports. We have enough historical examples that could caution us whenever a deliberate government deficit is used as a strategy to stimulate demand. One only needs to recall the past crises that the Philippines went through to have an idea of the high cost deficit spending could imposed on a developing economy. The more recent episode was the response to the Asian financial crisis which could have been the root of the fiscal crisis that we faced in the subsequent years. Nevertheless, the program needs to be framed within the context of the three impediments to growth that we have previously mentioned. How will it address the problem of competitiveness? How will it restore domestic and foreign investors’ confidence? How much jobs will it generate? Perhaps, more than just focusing on stimulating the economy through deficit spending, improving the business environment through an aggressive infrastructure program and eliminating bureaucratic red tapes that hamper business transactions might have more significant effects in improving the competitiveness of industries. We have made significant strides in creating a calmer price environment which should be favorable to making business decisions with longer time horizon. Nevertheless, businesses are still vocal in their complaints about the bureaucratic obstacles involved

CRC Foundation Inc. - - The Global Recession and the Philippine Economy
53
in starting and running business in the Philippines as well as additional costs that poor infrastructure facilities impose on them. In short, most of the problems that we face have longer term roots and have been with us with or without the global crisis. The government might want to seize the opportunity to institute real, long-lasting reforms now given the relative openness of the people to make sacrifices in the light of the on-going crisis.
CRC Foundation Inc. - - The Global Recession and the Philippine Economy
54
3 Vulnerability of Philippine Agriculture
Rolando T. Dy, Ph. D.
2
Philippine agriculture is a vital cog of the Philippine economy. It comprises about 20% of the gross domestic product (GDP), and some 37% of the labor force. However, its share to total merchanidise export is less than 10%, a result that will be explained later. When the whole agri-food chain is considered (agribusiness context),
it accounts for nearly half of GDP3. This includes supply of industrial farm inputs and services, agri-food processing, packaging, logistics and financing.
Is Philippine agriculture4, or the broader scope of agribusiness, vulnerable to the ongoing global financial crisis? Is its vulnerability a result of shrinking global demand and the resulting fall in commodity prices? Or is it the lack of competitiveness and preparedness to the world business cycle? This paper hopes to answer these questions. Moreover, five selected agriculture industries will be analyzed. Thereafter, proposals will be made in the short-term and medium-term to address important concerns.
3.1 Importance of Agriculture Some 12 M farm workers and fishers in the sector, plus another 4 M in non-farm enterprises. There are about 10 million (M) hectares (ha) of farmland in the country scattered in 5 M farms, averaging only 2 ha. . During the 1980s and 1990s, Philippine agriculture growth lagged behind its Asian neighbors. It is an evidence of the “lost decades” where severe under-investment reigned. Sector performance recovered in the 2000s. The growth drivers were fishery, palay, corn and poultry.
2 Executive Director, Center for Food and Agribusiness, University of Asia and the Pacific 3 Allen and Dy (1990). 4 Agriculture as defined in this paper includes fishery.

CRC Foundation Inc. - - The Global Recession and the Philippine Economy
55
Table 3.1 Agriculture Growth: The Philippines tailed its neighbors in the 80s and 90s
(% average annual growth)
1980-1990 1990-2000 2001-2006 Indonesia 3.6 2.1 3.2
Malaysia 3.4 0.3 3.5
Philippines 1.0 1.7 3.7
Thailand 3.9 4.2 2.6
China 5.9 4.1 4.1
Vietnam 2.8 4.3 3.8
Source: World Bank Development Indicators, 2004 and 2006; Asian Development
Bank – Key Indicators of Developing Asia and Pacific Countries, 2007
Table 3.2 Drivers of agriculture growth: fishery, rice and corn led the way…
Sources of growth
2001 – 2008, % Palay 17.8
Corn 8.5
Coconut 1.9
Sugarcane 2.7
Banana 5.1
Other crops 7.5
Livestock 6.3
Poultry 8.4
Fishery 36.9
Total 100.0 Source of basic data: National Statistical Coordination Board (NSCB) Despite the notable growth, however, experts have questioned why rural poverty still hovers at 50% when other countries such as China, Indonesia and Vietnam have recorded significant falls in poverty incidence. Habito (2009) found that the growth of manufacturing jobs is a factor. Perhaps, another factor is the country’s poor performance in agri-food exports.
3.2 International Benchmarking
Benchmarking is a tool for comparing a country’s or an industry’s performance relative to peer group. A country’s record in exports is a good comparator of global competitiveness. The Philippine export performance appears way below par in several metrics. 3.2.1 Agri-food export intensity is way below peers. In 2007, the Philippines had only 6.7% of its total merchandise exports coming from agri-food compared to 20% for the top 15 exporting countries, and to 18% for its ASEAN neighbors. The ASEAN peers posted large trade surpluses but the Philippines had large deficit.

CRC Foundation Inc. - - The Global Recession and the Philippine Economy
56
Table 3.3 Agri-Food Exports and Their Shares to Total Merchandise Exports, 2007
Agri-food Export ($ B)
Agri-food Export Intensity % Share to Total Export
Trade Balance
USA 113.5 9.8 + Brazil 48.2 30.0 + Canada 48.7 11.6 + China 38.8 3.2 - Argentina 28.8 51.5 + Thailand 25.0 16.3 + Indonesia 23.4 19.9 + Australia 22.4 15.8 + Malaysia 20.5 11.6 + New Zealand 16.0 59.5 + India 16.0 11.0 + Mexico 15.6 5.7 - Chile 13.6 20.0 + Vietnam 11.7 24.2 + Turkey 10.0 9.4 Nil Average 20.0 + Memo item Philippines 3.2 6.7 -
3.2.2 Export per unit of land. Relative to its ASEAN neighbors, the Philippine export-to-farm land ratio is very low. It was only $300 per ha in 2007 compared to $2,710 for Malaysia, $1,500 for Vietnam, and $1,420 for Thailand.
Table 3.4 RP dismally underperforms in agri-food exports, 2007
Exports ($ B)
Imports ($ B)
Balance ($ B)
Export $ per Farm area
Indonesia 23.4 10.5 +12.9 710
Malaysia 20.5 10.6 +9.9 2,710
Thailand 25.0 8.4 +16.6 1,420
Vietnam 11.7 6.1 +5.6 1,500
Philippines 3.2 4.3 -1.1 300
Source of basic data: World Trade Organization, Central Intelligence Agency (CIA)
Based on area alone, the Philippine agri-food export could have been at par with Malaysia and Vietnam.

CRC Foundation Inc. - - The Global Recession and the Philippine Economy
57
3.2.3. In seafood export intensity, the Philippines only exported $11 per kilometer of coastline as compared to $1,918 for Thailand, $890 for Vietnam, and $137 for Malaysia.
Table 3.5 Philippine seafood exports… in the cellar
Export 2007
($ M) Coastline
(km) Export
($’000/km) Indonesia 1,949 57,716 34 Malaysia 640 4,675 137 Philippines 391 36,289 11 Thailand 6,173 3,219 1,918 Vietnam 3,064 3,444 890 Note: HS 03 & h16 Source: International Trade Centre, and CIA 3.2.4. Revealed Comparative Advantage (RCA). On the basis of RCA, Philippine exports totaled $2.5 B versus $7.3 B for Vietnam, and $22.8 B for Thailand in 2006. The Philippine export effort is only a third of Vietnam’s, and one-seventh of Thailand’s.
Table 3.6 Comparative advantage in exports: The Philippines lags badly…
Value ( $ B) Indonesia Malaysia Philippines Thailand Vietnam Fish, etc 1.6 0.3 2.3 2.5
Veggies 0.7 0.2
Fruits & nuts 0.6 0.5
Coffee 0.9 1.6
Cocoa and prepn 0.9 0.6
Cereals & prepn 0.2 2.7 0.9
Vegetable oils 6.1 7.0 0.6
Seafood prepn 0.3 0.1 4.0 0.6
Rubber prod 5.5 4.8 8.9 0.9
All products 15.8 12.4 2.5 22.8 7.3 Products groups with RCA of 1 or above are competitive (2006 data). Source: ITC The above metrics clearly indicate low level of efforts of stakeholders in penetrating the global markets

CRC Foundation Inc. - - The Global Recession and the Philippine Economy
58
3.3 Industry Analyses
Going into specifics, in-depth analysis will be made for five commodities:
• Rice, corn, and sugarcane - all domestically-oriented industries
• Coconut – the major traditional export
• Banana - a benchmark export The discussion will cover four areas:
• Situationer;
• Analysis of vulnerability;
• Actionable measures; and
• Strategic options.
Figure 3.1 Impact of Global Financial Crisis on Commodities
Global financial tsunami
Output prices
Input prices
Quantity
Global demand
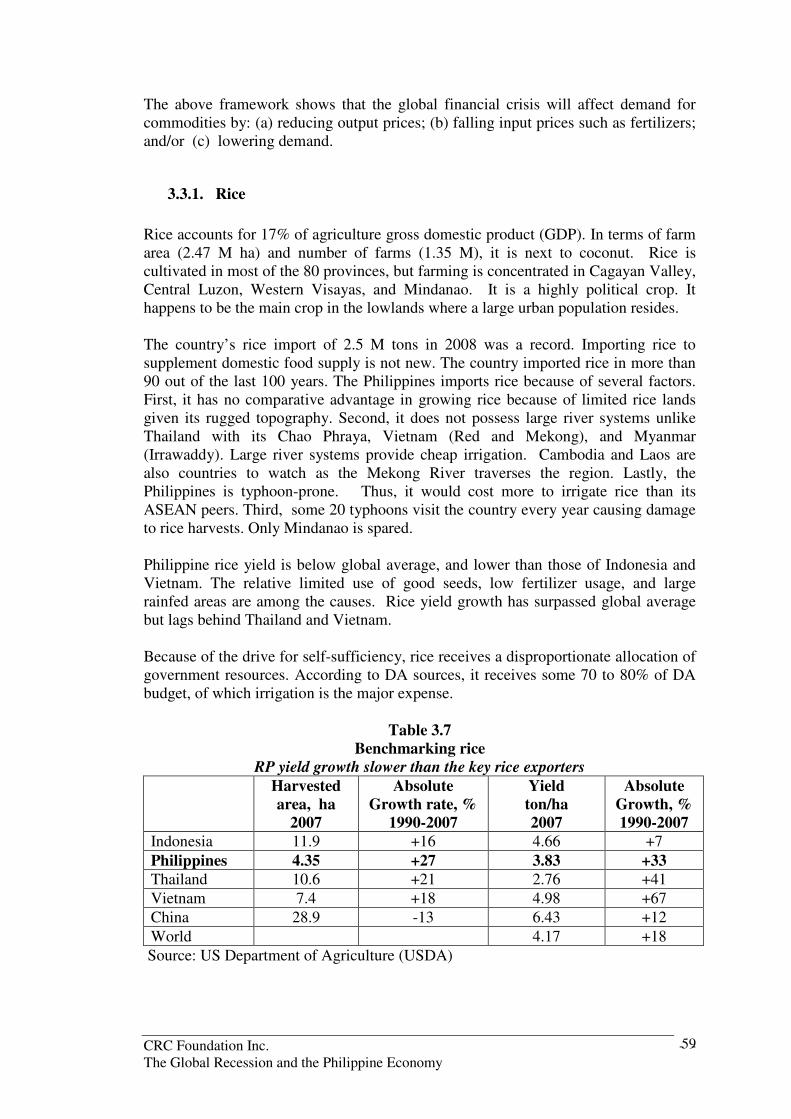
CRC Foundation Inc. - - The Global Recession and the Philippine Economy
59
The above framework shows that the global financial crisis will affect demand for commodities by: (a) reducing output prices; (b) falling input prices such as fertilizers; and/or (c) lowering demand.
3.3.1. Rice
Rice accounts for 17% of agriculture gross domestic product (GDP). In terms of farm area (2.47 M ha) and number of farms (1.35 M), it is next to coconut. Rice is cultivated in most of the 80 provinces, but farming is concentrated in Cagayan Valley, Central Luzon, Western Visayas, and Mindanao. It is a highly political crop. It happens to be the main crop in the lowlands where a large urban population resides. The country’s rice import of 2.5 M tons in 2008 was a record. Importing rice to supplement domestic food supply is not new. The country imported rice in more than 90 out of the last 100 years. The Philippines imports rice because of several factors. First, it has no comparative advantage in growing rice because of limited rice lands given its rugged topography. Second, it does not possess large river systems unlike Thailand with its Chao Phraya, Vietnam (Red and Mekong), and Myanmar (Irrawaddy). Large river systems provide cheap irrigation. Cambodia and Laos are also countries to watch as the Mekong River traverses the region. Lastly, the Philippines is typhoon-prone. Thus, it would cost more to irrigate rice than its ASEAN peers. Third, some 20 typhoons visit the country every year causing damage to rice harvests. Only Mindanao is spared. Philippine rice yield is below global average, and lower than those of Indonesia and Vietnam. The relative limited use of good seeds, low fertilizer usage, and large rainfed areas are among the causes. Rice yield growth has surpassed global average but lags behind Thailand and Vietnam. Because of the drive for self-sufficiency, rice receives a disproportionate allocation of government resources. According to DA sources, it receives some 70 to 80% of DA budget, of which irrigation is the major expense.
Table 3.7 Benchmarking rice
RP yield growth slower than the key rice exporters
Harvested area, ha
2007
Absolute Growth rate, %
1990-2007
Yield ton/ha 2007
Absolute Growth, % 1990-2007
Indonesia 11.9 +16 4.66 +7
Philippines 4.35 +27 3.83 +33 Thailand 10.6 +21 2.76 +41
Vietnam 7.4 +18 4.98 +67
China 28.9 -13 6.43 +12
World 4.17 +18
Source: US Department of Agriculture (USDA)

CRC Foundation Inc. - - The Global Recession and the Philippine Economy
60
The latest rice crisis created serious concern. World prices accelerated in March 2008 and peaked in April. Misguided concern for domestic supply led India and Vietnam (key exporters) to curb exports. In the process, world rice prices started to spike. Also, the National Food Authority reacted by taking large orders at abnormal prices. Certain sectors in government believe that the rice crisis makes 100% self-sufficiency a more strategic option than ever without reference to cost-benefit analysis.
Figure 3.2 World rice price peaked in 2008…
The Philippines paid dearly for rice
Source: World Bank Pink Sheet Rice competitiveness and sensitivity Philippine rice is not competitive with imports without tariff protection (now at 50% in-quota). Exporting rice is also a losing proposition. The lower world fertilizer and fuel prices in 2009 will help enhance farmers’ profits. Competitive Analysis
Table 3.8
Rice is not competitive without tariff protection; nor in the export market IMPORT PARITY EXPORT PARITY US$/ton
FOB, Vietnam 460 460
+ Freight 40 -
CIF/FOB Manila 500 460
Php/ton (P48)
CIF/FOB Manila 24,000 22,080
+ Handling and margin (15%,+ 50% tariff)
15,600 (2,208)
Derived Whole Price* 39,600 19,872
Actual Wholesale 32,000 to 40,000

CRC Foundation Inc. - - The Global Recession and the Philippine Economy
61
Table 3.9 Indicative Rice Farm Profitability
(Pesos/hectare)
2008 2009 Costs 45,000 37,000
Sales 56,000 64,000
Profit 11,000 27,000
Source: Annex Key Challenges Low fertilizer usage, increasing soil acidity, improving but still limited use of good seeds, as well as poor state of irrigation maintenance are among the causes of low yield. Extension services have also suffered since the advent of the Local Government Code in 1991. On the other hand, the drive for 100% self–sufficiency makes rice a disproportionate recipient (70 to 80%) of the DA budget. This has caused reduction of resources flowing to equally or more deserving sectors. Actionable Measures The national government (NG) and local government units (LGUs) must support the mayors and governors as the agriculture champions in their respective localities. Cluster farmers are convergence points for interventions in:
• irrigation systems restoration
• certified and hybrid seeds use
• extension services
• soil analysis and organic fertilizer development Meanwhile, the private sector, given favorable business climate, can expand hybrid seed supply, and modernize the rice mills. Strategic Response In the medium-term, there is need for the DA to address the following:
• implement a rice master plan
• research and development (R&D) into rice varieties with low water
requirements (Palay production is a heavy water user)5
• independent review of the cost of rice self-sufficiency
• refine targeted rice subsidy to consumers
• allocate resources based cost-benefits to regions.
5 It takes 5 cubic meters (5,000 liters) to produce one kilo of rice. This translates to 600 cubic meters per capita per year assuming an annual per capita rice consumption of 120 kilos.

CRC Foundation Inc. - - The Global Recession and the Philippine Economy
62
The Management Association of the Philippines (MAP) calls for the following: (a) drastic curtailment of the role of the National Food Authority; (b) promotion of non-rice sources of carbohydrates; and (c) encourage formation of rice growers associations to have a private sector lobby. Moreover, a program of soil rejuventation in rice and corn areas is imperative as yields have stabilized or declined due to acidic soils (Augusto de Leon, 2009).
3.3.2 Corn
Corn accounts for 6.4% of agriculture GDP. It has the third largest farm area (1.35 M ha) and number of farmers (0.7 M) after coconut and rice. Over 80% of corn is used as feed ingredients for poultry and swine. The key production zones are in Cagayan Valley (particularly Isabela), Ilocos (mainly Pangasinan), and Mindanao. Corn is an upland crop where access to marketing infrastructure is more limited than lowland
crops like rice.6 Compared to competitor countries, corn yield is only 54% of global average and is
lower than China’s or Thailand’s. Hybrid seed use is reportedly one factor.7 However, the good news is that it posted the highest growth in farm yield among Asian peers since 1990. The private seed companies as well as the input suppliers have played a key role in expanding hybrid seed use.
Table 3.10 Benchmarking corn
Outstanding yield growth but yield remains below world average
Harvested area, M ha
2007
Absolute Growth,% 1990-2007
Yield Ton/ha
2007
Absolute Growth
1990-2007 China 29.48 +38 5.17 +14
Indonesia 3.56 +32 2.11 +14
Philippines 2.74 -4 2.65 +100 Thailand 1.00 -26 3.85 +37
World 4.93 +32
Source: USDA The export potential of corn is robust. East Asia (Japan, South Korea, Taiwan, and Malaysia) imports over 30 M tons a year from the Americas (e.g. USA and Argentina). Only China and Thailand exhibit significant surpluses.
6 The author has observed these constraints in the Bukidnon and South Cotabato (Mindanao). 7 The low yield of white corn pulls down the overall corn yield in the Philippines.

CRC Foundation Inc. - - The Global Recession and the Philippine Economy
63
Table 3.11
Asian Corn Trade Importers Exporters
‘000 tons ‘000 tons Japan 16,500 China 500
Korea 7,200 Thailand 490
Taiwan 4,000 Indonesia 90
Malaysia 2,500
Vietnam 700
Indonesia 300
Philippines Nil
Source: USDA Corn competitiveness and sensitivity Corn is not yet competitive in export, but it will gain competitiveness with improvements in yield and farm and post-harvest infrastructure. The lower fertilizer and fuel prices in 2009 will provide a breathing space for corn farmers.
Table 3.12 Parity Prices
Import Parity Export Parity In $/ton
No. 2 Corn yellow, US 160 160
+ Freight and others 40
In Php/ton(P48)
= CIF/FOB Manila 9,600 7,680
+ Handling and margin +35% tariff
4,300 (770)
= Dervived wholesale price 13,900 6,910
Source of basic data: World Bank
Table 3.13 Indicative Corn Farm Profitability
(Pesos/hectare)
2008 2009 Cost 45,000 37,000
Sales 54,000 54,000
Profit 9,000 17,000
Source: Annex Key Challenges High post harvest losses due to inadequate post harvest facilities, the poor state of farm-to-market roads and distance to market, and upland soil degradation are among the challenges. Extension services have suffered since its devolution under the Local

CRC Foundation Inc. - - The Global Recession and the Philippine Economy
64
Government Code in 1991. The LGUs are, by and large, unprepared for their new mandates. Under the ASEAN Free Trade Area (AFTA), tariffs of the remaining tariff lines, except rice, will fall to zero to 5% in 2010. These include corn (from 35%), vegetable oil, sugar, feeds, chicken, and pork. Sadly, stakeholders’ preparation to this strategic milestone falls short. Actionable Measures The tasks for the NG and LGUs are to:
• construct, rehabilitate and maintain farm-to-market roads
• build village level post harvest facilities
• prepare for AFTA 2010. On the part of the private sector:
• expand hybrid seed supply
• invest in large post-harvest facilities (PHFs) (for corn cobs)
• prepare for AFTA 2010 Strategic Response In the medium term, there is need to focus on corn value/supply chain improvements to make the industry competitive, and become an export player. In this regard, a critical mass of infrastructure in production zones is imperative from roads to PHFs to bulk handling facilities (end to end) from Mindanao to Luzon and the Visayas. In addition, the MAP recommendations must be considered. These include: (a) accelerating adoption of Bt corn; (b) enhancement of credit access to support investments on post-harvest facilities; and (c) establishing a corn growers’ association (like the Sugar Alliance). It is also imperative that a program of soil rejuvenation is undertaken as overused soils are no longer providing the expected yield despite application of adequate fertilizers.
3.3.3 Coconut
Coconut is the largest agriculture industry. Its farm land (3.3 M ha) is 34% larger than rice; and its number of farms (1.4 M) slightly higher. But it contributes only 3.4
% to agriculture GDP, principally because of dismally low farm productivity8. The
8 The average farm yield is only 40 nuts per tree (4,000 nuts per ha), or about 800 kilos of copra per ha. With clone clones and under plantation management, it should get three times the current yield.

CRC Foundation Inc. - - The Global Recession and the Philippine Economy
65
industry suffers from decades of neglect. It does not receive the resources it deserves. it gets not even one-twentieth of the rice budget. The existing tree stocks are of poor genetics. Severe under-investment has led to senile trees, while the lack of fertilizers causes low productivity. The senile trees need replanting as more than 95% of tree stocks are from poor clones. There is also need for intercropping to supplement low farm incomes. Today, only one million ha are intercropped with varying degrees of management. The main coconut regions are Mindanao, Bicol, East Visayas, and Southern Tagalog (principally Quezon). Concidentaly, they happen to have the highest concentration of rural poor and insurgency. Benchmarking the industry shows that the Philippines has the lowest farm yield among competition. Indonesian yield is 30% higher, not to mention Brazil and PNG at more than double. Philippines yield growth has been above average for unexplained reasons as fertilization had been minimal.
Table 3.14 Benchmarking coconut
Near average yield growth, but yield is way below competitors Harvested
area, M ha 2007
Absolute Growth 1990-
2007
Yield Ton/ha
2007
Absolute Growth, % 1990-2007
India 1.88 +27 5.00 +2
Indonesia 2.62 +16 5.94 +11
Philippines 3.45 +11 4.52 +28 Cote d”ivoire 0.03 -40 8.00 +20
Brazil 0.27 +29 10.13 +366
PNG 0.20 -23 9.17 +90
World 5.02 +18
Source: USDA The lower productivity of coconut will have a long-term impact on its competitiveness with palm kernel oil, its only competitor in the lauric oil market. There is a large price differential between coconut oil and palm kernel oil. The probability of feedstock shift is getting higher with this large price gap.
Table 3.15 Large CNO premium over PKO will harm the coconut industry in the long run
World prices 2008 ($/ton) Q1 Q2 Q3 Q4 01- 09 Coconut oil 1,379 1,499 1,246 772 718
Palm kernel oil 1,156 1,198 928 512 534
Price difference 223 301 318 260 184 Source: World Bank Pink Sheet, February 2009

CRC Foundation Inc. - - The Global Recession and the Philippine Economy
66
Coconut competitiveness and sensitivity The Philippines lost its top spot in production to Indonesia in the 1990s due to the latter’s more organized development program. Meanwhile, palm kernel oil from Indonesia and Malaysia has been making inroads in the global market. The dramatic fall in world prices in 2009 will cut farm profits. Only a large peso depreciation can help reverse the income shrinkage.
Table 3.16 Indicative Coconut Farm Profitability
(Pesos/ha) 2008 2009 Cost 12,500 12,500
Farm sales 26,700 10,700
Profit 14,200 (1,800)
Source: Annex Key Challenges Low farm productivity and limited intercropping are the main causes of high poverty in coconut areas. The former is the result of spontaneous plantings of poor clones, a large proportion of senile trees due to limited replanting, and inadequate fertilization. Little investments have flowed into the industry in over 25 years. These caused the declining competitiveness of the industry, and the high poverty in coconut regions. Actionable Measures The NG through the Philippine Coconut Authority (PCA) and LGUs must consider fertilization of strategic areas. There are reports that yield can increase by 50% in 24-36 months.
As 95% of trees are of poor genetics, there is need for replanting with good clones. In poverty areas such as coconut lands, intercrop for food and cash can have large spillover effects. Quick access to the levy money can help fund these projects. Meanwhile, depreciating the peso will mitigate the collapse of farm incomes in the coconut areas. The private sector should consider seed nuts multiplication as potential project. Strategic Response
It has been 23 years since 1986 when the coconut levy issue began. The long litigation has caused the limited flow of resources to the coconut industry. The long wait for the recovery of the coconut levy has hurt the industry. It is time to craft a strategic plan that will cover: (a) fertilization of 2 M ha; (b) replanting 1 M ha with world class clones; (c) market-led intercropping; (d) diversification of by-products; and (e) R&D. Coconut research must be separated from PCA following the Philippine Rice Research Institute model.

CRC Foundation Inc. - - The Global Recession and the Philippine Economy
67
Further, there is need to: (a) unlock the coconut levy; and (b) promote new products (like coconut flour and coconut sugar) as recommended by the MAP.
3.3.4 Sugar
Sugar is the 4th largest agriculture industry contributing 2.5% to agriculture GDP. It has 363,000 ha on 67,500 farms, and employs 500,000 farm workers. Sugarcane is the main source of bio-ethanol. Sugarcane is grown in Western Visayas, Central Visayas, and Mindanao. Rehabilitation of mills and new ethanol plants can generate excess electricity for sale to the national grid. Sugarcane yield increased below world average since 1990. However, sugar recovery rate of the new cane varieties has risen by 16% due to the efforts of the private sector-funded Philippine Sugar research Institute (Philsurin) established in 1997.
Table 3.17 Benchmarking Sugar
Industry-led research is bearing fruits in higher yield and sugar recovery Harvested
area, M ha 2007
Absolute Growth % 1990-2007
Yield Ton/ha
2007
Absolute Growth
1990-2007 Indonesia 0.35 +3 72.0 -11
Philippines 0.40 +25 63.2 +6*
Thailand 1.01 +46 63.7 +30
Australia 0.42 +27 85.7 +17
World 70.9 +15
* Philippine sugar recovery: 1990 - 1.33 PSTC; 2007 - 1.54 PSTC, (+16%) (PSMA) Source: USDA; PSMA adjusted for 1990 - 59.5 Sugar competitiveness and sensitivity
Sugar is not competitive without the AFTA tariff of 38%. Export is not a viable
option, except in the high-priced US quota market. 9 Lower fertilizer and fuel prices in 2009 will support higher farm profits. The depreciation of the peso will help farm margins. By 2010, the AFTA will reduce tariffs to 0-5%. Despite many years to restructure, the industry is seeking including sugar in the exclusion list as the stakeholders feel it is not ready. Domestic sugar cannot compete without tariffs relative to Thai sugar.
9 The US quota price is 50% higher than world price.
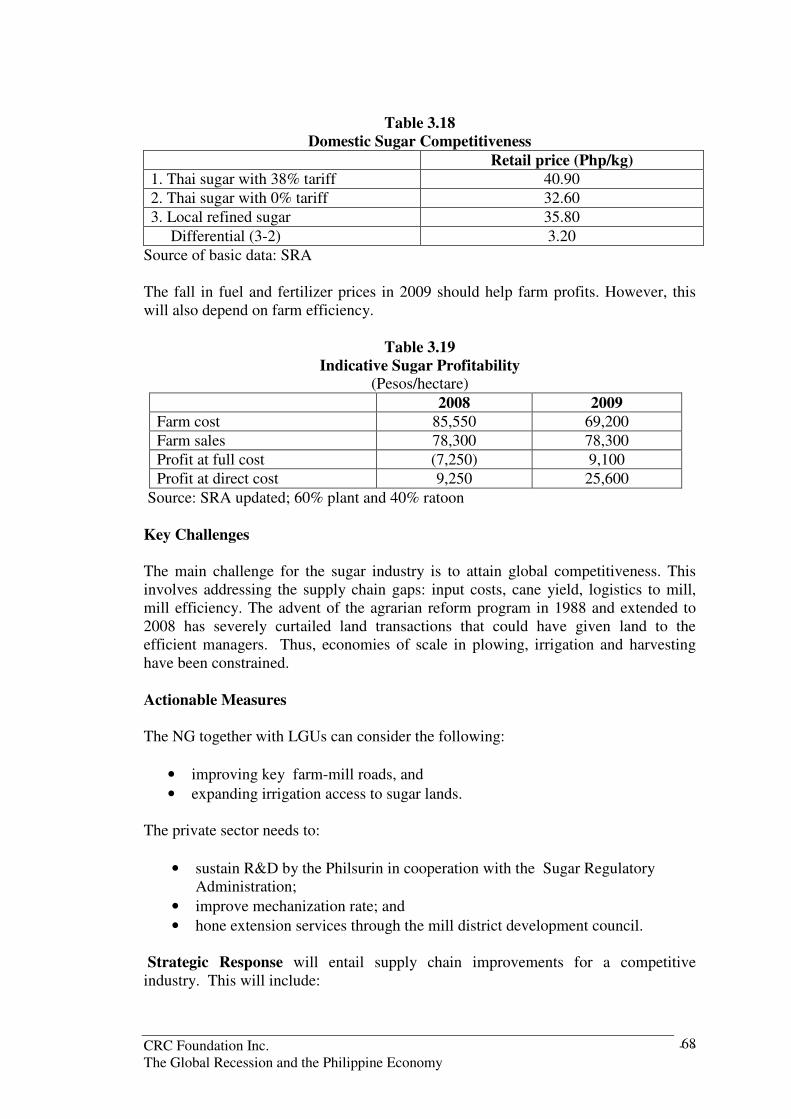
CRC Foundation Inc. - - The Global Recession and the Philippine Economy
68
Table 3.18
Domestic Sugar Competitiveness Retail price (Php/kg) 1. Thai sugar with 38% tariff 40.90
2. Thai sugar with 0% tariff 32.60
3. Local refined sugar 35.80
Differential (3-2) 3.20
Source of basic data: SRA The fall in fuel and fertilizer prices in 2009 should help farm profits. However, this will also depend on farm efficiency.
Table 3.19 Indicative Sugar Profitability
(Pesos/hectare)
2008 2009 Farm cost 85,550 69,200
Farm sales 78,300 78,300
Profit at full cost (7,250) 9,100
Profit at direct cost 9,250 25,600
Source: SRA updated; 60% plant and 40% ratoon Key Challenges The main challenge for the sugar industry is to attain global competitiveness. This involves addressing the supply chain gaps: input costs, cane yield, logistics to mill, mill efficiency. The advent of the agrarian reform program in 1988 and extended to 2008 has severely curtailed land transactions that could have given land to the efficient managers. Thus, economies of scale in plowing, irrigation and harvesting have been constrained. Actionable Measures The NG together with LGUs can consider the following:
• improving key farm-mill roads, and
• expanding irrigation access to sugar lands. The private sector needs to:
• sustain R&D by the Philsurin in cooperation with the Sugar Regulatory Administration;
• improve mechanization rate; and
• hone extension services through the mill district development council. Strategic Response will entail supply chain improvements for a competitive industry. This will include:
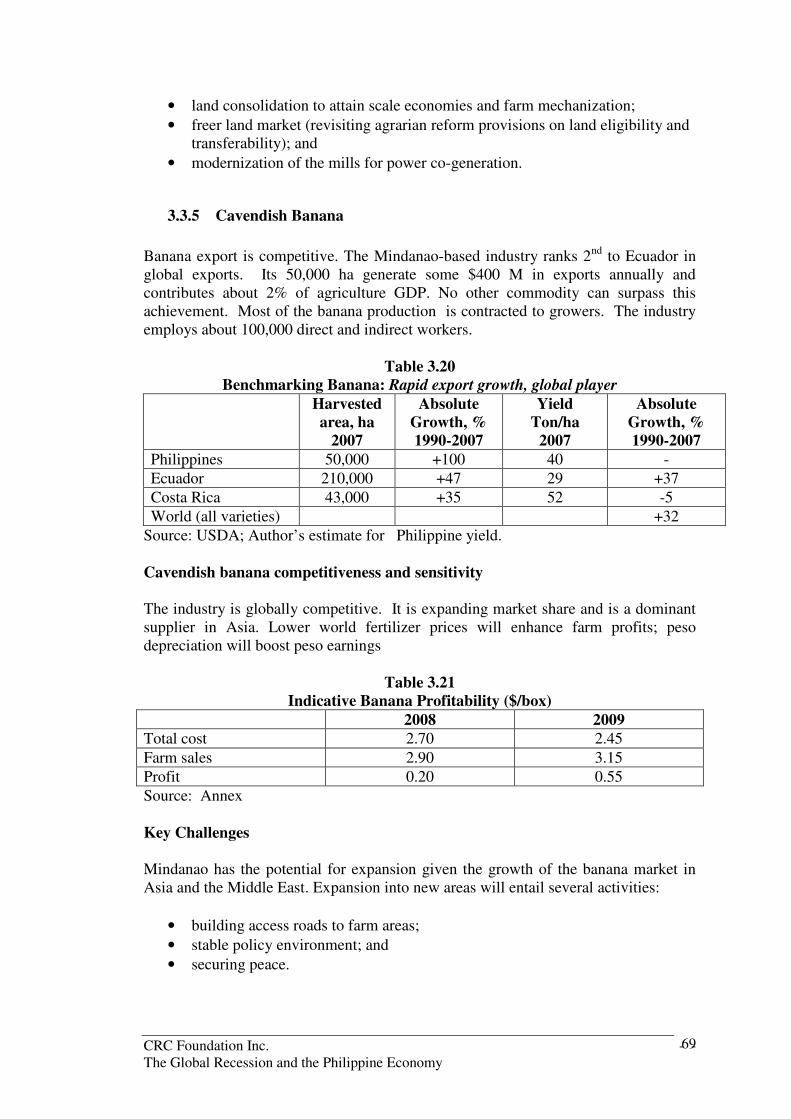
CRC Foundation Inc. - - The Global Recession and the Philippine Economy
69
• land consolidation to attain scale economies and farm mechanization;
• freer land market (revisiting agrarian reform provisions on land eligibility and transferability); and
• modernization of the mills for power co-generation.
3.3.5 Cavendish Banana
Banana export is competitive. The Mindanao-based industry ranks 2nd to Ecuador in global exports. Its 50,000 ha generate some $400 M in exports annually and contributes about 2% of agriculture GDP. No other commodity can surpass this achievement. Most of the banana production is contracted to growers. The industry employs about 100,000 direct and indirect workers.
Table 3.20 Benchmarking Banana: Rapid export growth, global player
Harvested area, ha
2007
Absolute Growth, % 1990-2007
Yield Ton/ha
2007
Absolute Growth, % 1990-2007
Philippines 50,000 +100 40 -
Ecuador 210,000 +47 29 +37
Costa Rica 43,000 +35 52 -5
World (all varieties) +32
Source: USDA; Author’s estimate for Philippine yield. Cavendish banana competitiveness and sensitivity The industry is globally competitive. It is expanding market share and is a dominant supplier in Asia. Lower world fertilizer prices will enhance farm profits; peso depreciation will boost peso earnings
Table 3.21 Indicative Banana Profitability ($/box)
2008 2009 Total cost 2.70 2.45
Farm sales 2.90 3.15
Profit 0.20 0.55
Source: Annex Key Challenges Mindanao has the potential for expansion given the growth of the banana market in Asia and the Middle East. Expansion into new areas will entail several activities:
• building access roads to farm areas;
• stable policy environment; and
• securing peace.

CRC Foundation Inc. - - The Global Recession and the Philippine Economy
70
Actionable Measures The Government can provide the enabling environment by:
• improving road networks to plantations and potential areas;
• restoring peace in Mindanao; and
• lobbying for entry of bananas to Australia The role of the private sector: there is need to replicate the financing schemes of OneNetworkBank, Tagum Rural Bank and PenBank to individual small farmers with
BPPA contracts10 with big buyers. The Bangko Sentral ng Pilipinas and Land Bank’s 5-7 year rediscounting plus technical assistance to bank’s production technicians could be the key components. Strategic Options The road map is for the Government (NG and LGUs) to provide a good business climate to investors. Unilateral changes in policy (e.g. ban on aerial spraying) are not a positive signal of stable policy.
3.4 Is Philippine Agriculture Vulnerable?
Yes, it partly is. World commodity prices have declined since their peak in 2008. These have dual effects: reduce output prices for some exportables, principally coconut, and reduce input prices. Lower fertilizer and fuel prices in 2009 will have positive effects on farm bottom lines. On the policy front, peso depreciation has positive effects on many products, principally for exportables like coconut and banana. But, the sector’s coping mechanisms could have been far better if the country had long invested in sector competitiveness. Adequate investments would have generated higher productivity. The AFTA 2010 looms. Corn, sugar, feeds, chicken and pork will face competition. Feeds and meats will enter the country duty-free and this will, in turn, reduce the demand for corn. The industries were given lead time, but preparations appear to be taking unnecessarily longer.
10 For example banana production and purchase agreement (BPPA) is a long-term deal of 10 to 15 years to producers with fixed US$ buying price.

CRC Foundation Inc. - - The Global Recession and the Philippine Economy
71
Box 3.1 The AFTA Common Effective Preferential Tariff Scheme (CEPT)
The CEPT scheme, introduced in 1993 to eliminate intra-ASEAN import tariffs, is now almost completed. The ASEAN-6 and Viet Nam have reduced duties on all products to 0-5 per cent. ASEAN-6 will eliminate duties on all products by 1 January 2010, except the limited Sensitive and Highly Sensitive Unprocessed Agricultural Products.
Lao PDR and Myanmar are expected to reduce duties on all products by 1 January 2008 except Sensitive and Highly Sensitive Unprocessed Agricultural Products. Cambodia is given until 1 January 2010 to do so. These countries and Viet Nam will eliminate duties on all products by 1 January 2010.
Indonesia and the Philippines have yet to offer rice and sugar for concessions. A special dispensation has been given to both countries to phase in these products by 2015.
Source: http://www.miti.gov.my
On a regional basis, the most impacted regions will be the coconut areas of Mindanao, Bicol, Eastern and Central Visayas, and Southern Tagalog (mainly Quezon).
Table 3.22 Vulnerability Summary
Product/Area Region(s)/areas Vulnerability Coconut (3.3 M ha)
Mindanao, Bicol, East Visayas, Central Visayas, S. Tagalog.
High
Sugarcane (~400,000 ha)
West Visayas, Central Visayas Mindanao *
Low High (with AFTA 2010)**
Corn (1.35 M ha)
Cagayan Valley, Mindanao Pangasinan
Low High (with AFTA 2010)**
Rice (2.47 M ha)
Cagayan Valley, Central Luzon, Western Visayas, Mindanao, Other regions
Low
Cavendish banana (50,000 ha)
Mindanao (S, C, N) Low
* also Cagayan Valley, Central Luzon ** AFTA 2010 has been agreed by the ASEAN members for over five years.

CRC Foundation Inc. - - The Global Recession and the Philippine Economy
72
Sensitivity and Key Challenges to Agriculture Industries amidst the Global Financial Crisis Current Situation Sensitivity and Key Challenges Possible Interventions
Rice
• Rice accounts for 17% of agriculture gross domestic product (GDP). In terms of farm area (2.47 M ha) and number of farms (1.35 M), it is next to coconut.
• The country’s rice import of 2.5 M tons in 2008 was a record. The country imported rice in more than 90 out of the last 100 years.
• The Philippines imports rice because it has no comparative advantage in growing rice due to limited rice lands given its rugged topography, it does not possess large river systems, and it is typhoon-prone.
• Philippine rice yield is below global average, and lower than those of
• Philippine rice is not competitive with imports without tariff protection (now at 50% in-quota). Exporting rice is also a losing proposition. The lower world fertilizer and fuel prices in 2009 will help enhance farmers’ profits.
• Low fertilizer usage, increasing soil acidity, improving but still limited use of good seeds, as well as poor state of irrigation maintenance are among the causes of low yield. Extension services have also suffered since the advent of the Local Government Code in 1991.
• On the other hand, the drive for 100% self–sufficiency makes rice a disproportionate recipient (70 to 80%) of the DA budget. This has caused reduction of resources flowing to equally or more deserving sectors.
• The national government (NG) and local government units (LGUs) must support the mayors and governors as the agriculture champions in their respective localities. Cluster farmers are convergence points for interventions in:
o irrigation systems restoration o certified and hybrid seeds use o extension services o soil analysis and organic fertilizer
development
• The private sector, given favorable business climate, can expand hybrid seed supply, and modernize the rice mills.

CRC Foundation Inc. - - The Global Recession and the Philippine Economy
73
Sensitivity and Key Challenges to Agriculture Industries amidst the Global Financial Crisis
Current Situation Sensitivity and Key Challenges Possible Interventions Indonesia and Vietnam.
Corn
• Corn accounts for 6.4% of agriculture GDP. It has the third largest farm area (1.35 M ha) and number of farmers (0.7 M) after coconut and rice. Over 80% of corn is used as feed ingredients for poultry and swine.
• Compared to competitor countries, corn yield is only 54% of global average and is lower than China’s or Thailand’s. Hybrid seed use is reportedly one factor. However, the good news is that it posted the highest growth in farm yield among Asian peers since 1990. The private seed companies as well as the input suppliers have played a key role in expanding
• Corn is not yet competitive in export, but it will gain competitiveness with improvements in yield and farm and post-harvest infrastructure. The lower fertilizer and fuel prices in 2009 will provide a breathing space for corn farmers.
• High post harvest losses due to inadequate post harvest facilities, the poor state of farm-to-market roads and distance to market, and upland soil degradation are among the challenges. Extension services have suffered since its devolution under the Local Government Code in 1991. The LGUs are, by and large, unprepared for their new mandates.
• Under the ASEAN Free Trade Area (AFTA), tariffs of the remaining tariff lines, except rice, will fall to zero to 5% in 2010.
• The tasks for the NG and LGUs are to: o construct, rehabilitate and maintain farm-
to-market roads o build village level post harvest facilities o prepare for AFTA 2010.
• On the part of the private sector: o expand hybrid seed supply o invest in large post-harvest facilities
(PHFs) (for corn cobs) o prepare for AFTA 2010

CRC Foundation Inc. - - The Global Recession and the Philippine Economy
74
Sensitivity and Key Challenges to Agriculture Industries amidst the Global Financial Crisis
Current Situation Sensitivity and Key Challenges Possible Interventions hybrid seed use.
• The export potential of corn is robust. East Asia (Japan, South Korea, Taiwan, and Malaysia) imports over 30 M tons a year from the Americas (e.g. USA and Argentina). Only China and Thailand exhibit significant surpluses.
These include corn (from 35%), vegetable oil, sugar, feeds, chicken, and pork. Sadly, stakeholders’ preparation to this strategic milestone falls short.
Coconut
• Coconut is the largest agriculture industry. Its farm land (3.3 M ha) is 34% larger than rice; and its number of farms (1.4 M) slightly higher. But it contributes only 3.4 % to agriculture GDP, principally because of dismally low farm productivity. The industry suffers from decades of neglect. It
• The Philippines lost its top spot in production to Indonesia in the 1990s due to the latter’s more organized development rogram. Meanwhile, palm kernel oil from Indonesia and Malaysia has been making inroads in the global market.
• The dramatic fall in world prices in 2009 will cut farm profits. Only large peso depreciation can help reverse the income shrinkage.
• The NG through the Philippine Coconut Authority (PCA) and LGUs must consider fertilization of strategic areas. There are reports that yield can increase by 50% in 24-36 months.
• As 95% of trees are of poor genetics, there is need for replanting with good clones. In poverty areas such as coconut lands, intercrop for food and cash can have large spillover effects. Quick access to the levy money can help fund these projects. Meanwhile, depreciating the peso will mitigate the collapse of farm incomes in the coconut areas.
• The private sector should consider seed nuts multiplication as potential project.
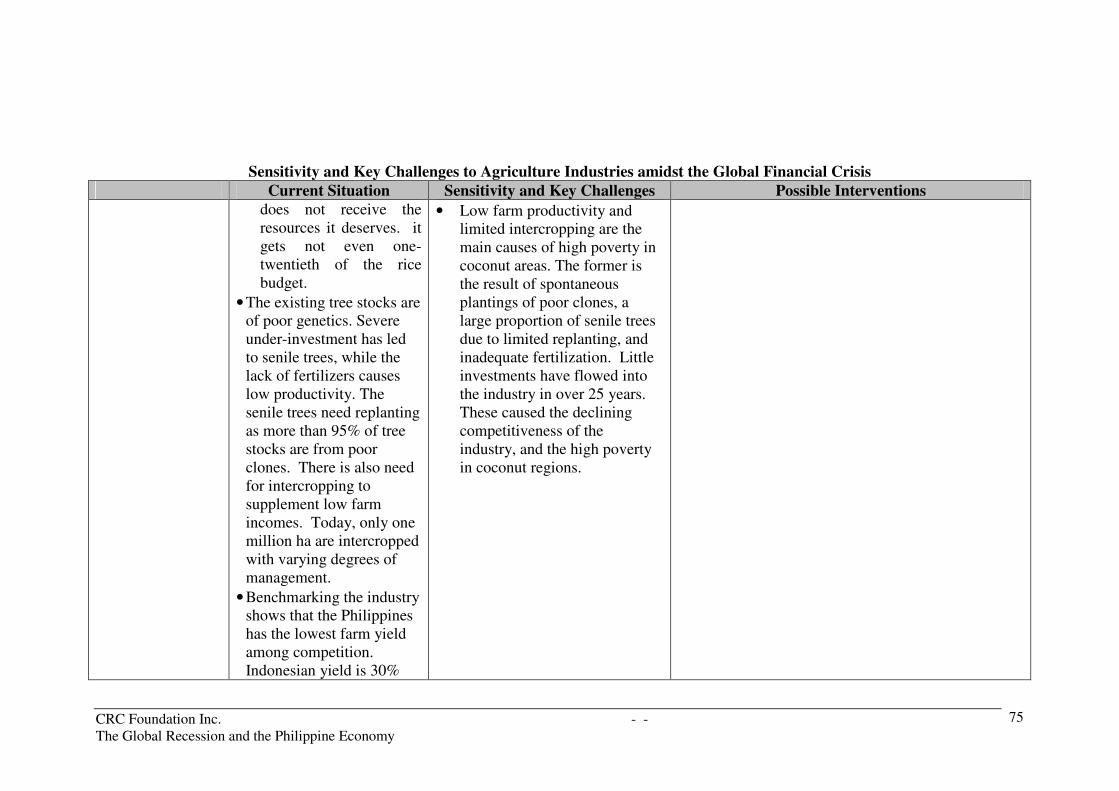
CRC Foundation Inc. - - The Global Recession and the Philippine Economy
75
Sensitivity and Key Challenges to Agriculture Industries amidst the Global Financial Crisis
Current Situation Sensitivity and Key Challenges Possible Interventions does not receive the resources it deserves. it gets not even one-twentieth of the rice budget.
• The existing tree stocks are of poor genetics. Severe under-investment has led to senile trees, while the lack of fertilizers causes low productivity. The senile trees need replanting as more than 95% of tree stocks are from poor clones. There is also need for intercropping to supplement low farm incomes. Today, only one million ha are intercropped with varying degrees of management.
• Benchmarking the industry shows that the Philippines has the lowest farm yield among competition. Indonesian yield is 30%
• Low farm productivity and limited intercropping are the main causes of high poverty in coconut areas. The former is the result of spontaneous plantings of poor clones, a large proportion of senile trees due to limited replanting, and inadequate fertilization. Little investments have flowed into the industry in over 25 years. These caused the declining competitiveness of the industry, and the high poverty in coconut regions.

CRC Foundation Inc. - - The Global Recession and the Philippine Economy
76
Sensitivity and Key Challenges to Agriculture Industries amidst the Global Financial Crisis
Current Situation Sensitivity and Key Challenges Possible Interventions higher, not to mention Brazil and PNG at more than double. Philippines yield growth has been above average for unexplained reasons as fertilization had been minimal.
Sugar
• Sugar is the 4th largest agriculture industry contributing 2.5% to agriculture GDP. It has 363,000 ha on 67,500 farms, and employs 500,000 farm workers. Sugarcane is the main source of bio-ethanol. Sugarcane is grown in Western Visayas, Central Visayas, and Mindanao. Rehabilitation of mills and new ethanol plants can generate excess
• Sugar is not competitive without the AFTA tariff of 38%. Export is not a viable option, except in the high-priced US quota market. Lower fertilizer and fuel prices in 2009 will support higher farm profits. The depreciation of the peso will help farm margins.
• The main challenge for the sugar industry is to attain global competitiveness. This involves addressing the supply chain gaps: input costs, cane yield, logistics to mill, mill efficiency. The advent of the
• The NG together with LGUs can consider the following:
o improving key farm-mill roads, and o expanding irrigation access to sugar lands.
• The private sector needs to: o sustain R&D by the Philsurin in
cooperation with the Sugar Regulatory Administration;
o improve mechanization rate; and o hone extension services through the mill
district development council.
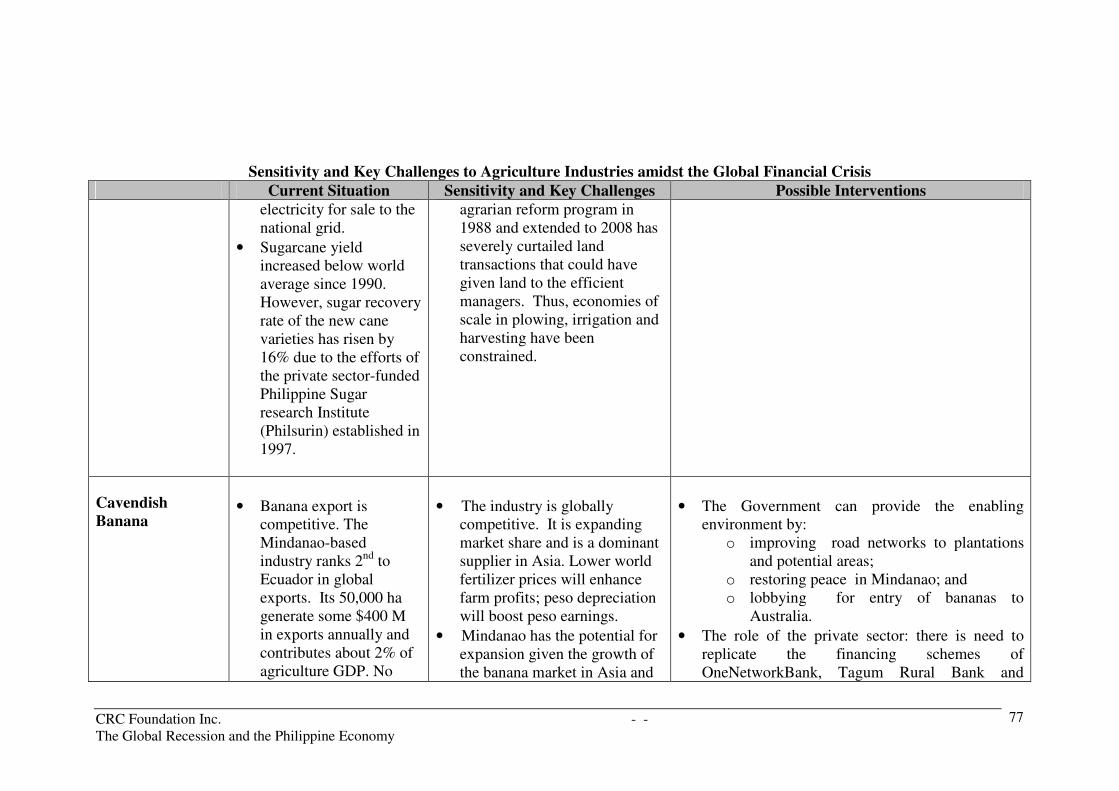
CRC Foundation Inc. - - The Global Recession and the Philippine Economy
77
Sensitivity and Key Challenges to Agriculture Industries amidst the Global Financial Crisis
Current Situation Sensitivity and Key Challenges Possible Interventions electricity for sale to the national grid.
• Sugarcane yield increased below world average since 1990. However, sugar recovery rate of the new cane varieties has risen by 16% due to the efforts of the private sector-funded Philippine Sugar research Institute (Philsurin) established in 1997.
agrarian reform program in 1988 and extended to 2008 has severely curtailed land transactions that could have given land to the efficient managers. Thus, economies of scale in plowing, irrigation and harvesting have been constrained.
Cavendish Banana
• Banana export is competitive. The Mindanao-based industry ranks 2nd to Ecuador in global exports. Its 50,000 ha generate some $400 M in exports annually and contributes about 2% of agriculture GDP. No
• The industry is globally competitive. It is expanding market share and is a dominant supplier in Asia. Lower world fertilizer prices will enhance farm profits; peso depreciation will boost peso earnings.
• Mindanao has the potential for expansion given the growth of the banana market in Asia and
• The Government can provide the enabling environment by:
o improving road networks to plantations and potential areas;
o restoring peace in Mindanao; and o lobbying for entry of bananas to
Australia.
• The role of the private sector: there is need to replicate the financing schemes of OneNetworkBank, Tagum Rural Bank and

CRC Foundation Inc. - - The Global Recession and the Philippine Economy
78
Sensitivity and Key Challenges to Agriculture Industries amidst the Global Financial Crisis
Current Situation Sensitivity and Key Challenges Possible Interventions other commodity can surpass this achievement. Most of the banana production is contracted to growers. The industry employs about 100,000 direct and indirect workers.
the Middle East. Expansion into new areas will entail several activities:
o building access roads to farm areas;
o stable policy environment; and
o securing peace.
PenBank to individual small farmers with BPPA contracts with big buyers. The Bangko Sentral ng Pilipinas and Land Bank’s 5-7 year rediscounting plus technical assistance to bank’s production technicians could be the key component.

CRC Foundation Inc. - - The Global Recession and the Philippine Economy
79
3.5 Overall
The lack of sector competitiveness principally an unfortunate result of severe under-investment in agriculture. This is shown by the country’s poor export competitiveness, the unproductive coconut tree stocks, and high poverty, among others. The Agriculture and Fisheries Modernization Act (AFMA), passed into law in 1997, was the best hope. It was expected that some an additional Php 15 to 20 B a year will flow to the sectors. But due to the lack of resonance among the top decision makers on the urgency of agriculture development, AFMA failed to deliver the extra resources. Resource allocation is also captured by political expediency. Public spending is heavily biased for rice self-sufficiency. There are sad consequences (low productivity and poverty) for others like tree crops, corn and small fishery
Table 3.23 AFMA budget allocation, 1997-2006
billion pesos
Year Regular GATT AFMP Total 1997 2.69 14.48 17.16
1998 2.84 12.89 15.73
1999 3.34 11.61 14.96
2000 4.16 16.64 20.80
2001 4.66 11.45 16.11
2002 5.60 14.44 20.04
2003 4.44 12.13 16.57
2004 4.25 9.36 13.61
2005 4.27 10.26 14.54
2006* 4.35 11.47 15.82
Source: Department of Agriculture While agriculture and fishery development is a vital cog of development, this is not a sufficient condition for energizing the countryside and alleviating rural poverty. As shown in other countries like Thailand, development of agro-based processing industries is a major cog. These industries are labor-intensive, and absorb excess labor in agriculture. This is easier said than done. Rural-based industries require a favorable business climate including: (a) a steady supply of quality raw materials for processing; (b) adequate marketing infrastructure and power and water supply; and (c) good local governance. Investing in rural communities is vital. Many LGU executives are competent but they lack resources (financial and manpower). They need support as they have limited resources for quick stimulus. There are merits to explore alternative financing beyond the internal revenue allotment (IRA). For example, development market place scheme and conditional cash transfers are interesting options.

CRC Foundation Inc. - - The Global Recession and the Philippine Economy
80
3.6 Moving Forward
In the short term, for agriculture as a whole, emphasis should be given on the following: 1. The budget for 2010 should reflect sound resource allocation in order to have a
broad-based impact on farm incomes and poverty reduction. 2. The increment should be proportionately more for the under-budgeted sectors in
the past such as corn, coconut and other tree crops, fishery and livestock. 3. A concerted effort should be made to craft an AFTA 2010 preparedness program. In the medium term, several competitiveness concerns should be addressed. It can be started with sustaining efforts geared towards sound budget and resource allocation to enhance farm incomes and reduce poverty. This include ensuring that the 2010 budget will provide funding for industries which suffered discrimination in the past due to singular focus on rice self-sufficiency. There must be a shift to ensuring income security and reducing poverty as a quantum leap from the past. 1. Implement AFMA by program elements, and with regional perspective. 2. Revisit the budget line by commodity (GMA rice, corn, HVC, livestock, fisheries) Lacks flexibility; and biased against R&D and marketing support. 3. Sound resource allocation criteria (benefit-cost analysis)
About 70-80% of DA resources allocated for rice. Bias for production support, and against R&D and marketing. There are fewer resources for poverty-stricken sectors like coconut and fisheries.
4. R&D needs to catch up The AFMA formula is inadequate for a catch up strategy. R&D generates high economic gains. The Benchmark at 1% of GVA should be targeted.
5. Weak extension systems The Local Government Code, now an 18-year old legacy, needs amendment.
Agriculture extension has weakened. 6. Dispersed regulatory system Goods enter the border through customs before quarantine. 7. Frequent changes in DA bureaucracy The lack of continuity affects efficiency and institutional memory. Meritocracy
must be observed. 8. Make CARP investment-friendly Farming alone will provide the jobs for the rural sector. Private investments are
needed in rural industries; there is also need for economies of scale. There is a looming crisis of un-employed and underemployed: if paradigm of exclusion of private investments
9. Monitoring and evaluation of programs It is severely inadequate and predominantly input monitoring. More needed for
outcomes monitoring. 10. A pro-active Congressional Oversight Committee on Agricultural and Fisheries
Modernization (COCAFM) that will monitor AFMA implementation.

CRC Foundation Inc. - - The Global Recession and the Philippine Economy
81
Altogether, it is highly imperative to craft regional agriculture strategies that capitalize on each region’s competitive advantage. For example, there is need to pursue the food basket strategy in typhoon-free Mindanao. The strategies must also capture the vitality of marketing support and R&D, and not predominantly production support as has been the common practice. The success of these strategies will be contingent on the absorptive capacity which, in many respects, is anchored on sustained human resource development at the national, regional and local levels.

CRC Foundation Inc. - - The Global Recession and the Philippine Economy
82
ANNEXES References 1. Presentation to COCAFM, January 17, 2009 2. SRA Survey of Farm Costs (Maru) List of Stakeholders Consulted 1. Management Association of the Philippines 2. Senen Bacani (banana) 3. Ramon de Vera (banana) 4. PSMA (c/o ) 5. Philmaize (Chair: Rodger Navarro) 6. DA GMA Rice 7. DA GMA Corn 8. PCA 9. DTI 10. DA Philippine Agribusiness Corporation 11. National Council for Competitiveness 12. Anonymous Player (Coconut industry) Data Sources
• International Trade Centre
• USDA
• WTO
• World Bank
• Sugar Regulatory Administration
• Industry sources
• Center for Food and Agri Business (UA&P

CRC Foundation Inc. - - The Global Recession and the Philippine Economy
83
ANNEX 1 RICE: SENSITIVITY OF COSTS AND RETURNS
Lower fertilizer costs, higher margins
Pesos/hectare 2008 2009 SEEDS (certified) 2,000 2,000
LAND PREP 6,000 6,000
FERTILIZER 20,000 12,000
Chemicals 3,000 3,000
Crop planting and maintenance
6,000 6,000
Harvest and threshing (10%)
5,600 6,400
Other costs 5,400 5,400
TOTAL COSTS 48,000 40,800 Production (kg/ha) 4,000 4,000
Price (Pesos/kg dry) 14 16
SALES 56,000 64,000 PROFIT 8,000 23,200 Note: Ballpark estimates
ANNEX 2 CORN: SENSITIVITY OF COSTS AND RETURNS
Lower fertilizer costs, higher margins
Pesos/hectare 2008 2009 SEEDS 3,400 3,400
LAND PREP 4,000 4,000
FERTILIZER 24,000 16,000
Crop Maintenance
MD (42) 4,200 4,200
MAD (6) 1,200 1,200
Shelling, Drying, 2,250 2,250
Trucking 2,500 2,500
Other costs 3,450 3,450
TOTAL COSTS 45,000 37,000 Cost/kilo, 4,500 kg 10.00 8.22
SALES, P12/kg 54,000 54,000
PROFIT 9,000 17,000 Note: Ballpark estimates
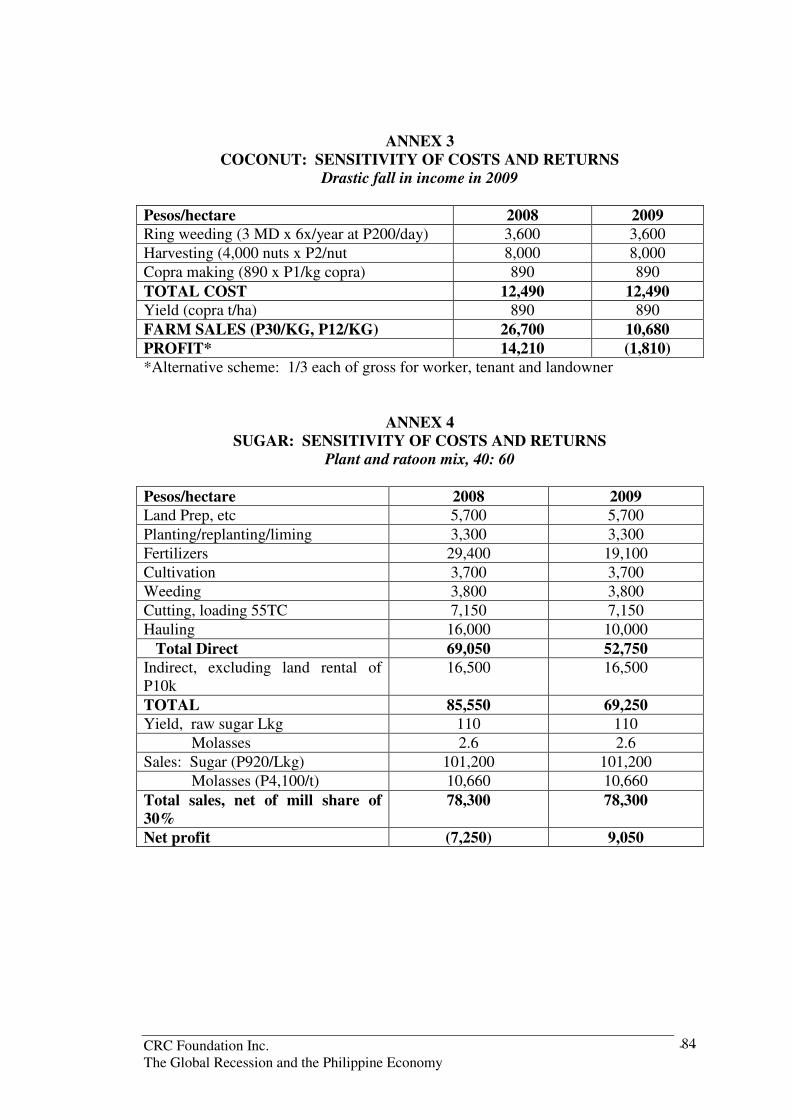
CRC Foundation Inc. - - The Global Recession and the Philippine Economy
84
ANNEX 3 COCONUT: SENSITIVITY OF COSTS AND RETURNS
Drastic fall in income in 2009
Pesos/hectare 2008 2009 Ring weeding (3 MD x 6x/year at P200/day) 3,600 3,600
Harvesting (4,000 nuts x P2/nut 8,000 8,000
Copra making (890 x P1/kg copra) 890 890
TOTAL COST 12,490 12,490 Yield (copra t/ha) 890 890
FARM SALES (P30/KG, P12/KG) 26,700 10,680 PROFIT* 14,210 (1,810) *Alternative scheme: 1/3 each of gross for worker, tenant and landowner
ANNEX 4 SUGAR: SENSITIVITY OF COSTS AND RETURNS
Plant and ratoon mix, 40: 60 Pesos/hectare 2008 2009 Land Prep, etc 5,700 5,700
Planting/replanting/liming 3,300 3,300
Fertilizers 29,400 19,100
Cultivation 3,700 3,700
Weeding 3,800 3,800
Cutting, loading 55TC 7,150 7,150
Hauling 16,000 10,000
Total Direct 69,050 52,750 Indirect, excluding land rental of P10k
16,500 16,500
TOTAL 85,550 69,250 Yield, raw sugar Lkg 110 110
Molasses 2.6 2.6
Sales: Sugar (P920/Lkg) 101,200 101,200
Molasses (P4,100/t) 10,660 10,660
Total sales, net of mill share of 30%
78,300 78,300
Net profit (7,250) 9,050

CRC Foundation Inc. - - The Global Recession and the Philippine Economy
85
ANNEX 5 BANANA: SENSITIVITY OF COSTS AND RETURNS
$/Box 2008 2009 Wages, salaries and benefits
1.20 1.20
Fertilizers and chemicals 0.60 0.50
Plastic, fuel, oil 0.30 0.20
Other costs, land rental, etc.
0.40 0.40
Transport to pier 0.20 0.15
Total Cost 2.70 2.45 Farm Sales + Incentives 2.90 3.15 Farm profit 0.20 0.70 Source: Industry Players

CRC Foundation Inc. - - The Global Recession and the Philippine Economy
86
4 Impact on the Philippine Business Process Outsourcing Sector
Ceferino S. Rodolfo
11
• Global outsourcing & off-shoring (O&O) of services, commonly referred to as business process outsourcing (BPO), has been a recent but rapidly growing phenomenon. Its growth can be attributed to two main drivers:
o From the demand side, as competition in the global market intensified due
to the lowering of barriers to trade, companies were forced to be more competitive in terms of lower costs and better services.
o From the supply-side, rapid developments in information and
communication technology (ICT) have made it technically possible to digitize service activities and transmit them via the internet in a cost-effective and timely manner.
Thus, while outsourcing and off-shoring—separately and in combination—have long been part of corporate strategies, their application to service processes has increased the coverage, depth and value of O&O activities.
• India has been the established country-leader in the global BPO industry, supported primarily by the availability of qualified professionals. However, the Philippines has gained recognition as a viable BPO location based on:
o the availability of professionals with the required language skills,
cultural affinity with the US (the main BPO market), and strong customer service orientation;
o the dramatic improvements in telecommunications infrastructure resulting from the deregulation of the industry in the early 1990s, among others;
o the availability of premium-grade building facilities; and, o the relatively competitive incentive regime that we provide to BPO
investments.
• As a result, over the past five years (2004 to 2008), the Philippine BPO industry grew in terms of employment from 100,000 to about 372,000 full-time employees (FTEs), for an average annual growth of about 40%; and in terms of revenues, from about US$1.5 billion (B) to US$6B, for an average growth of 43%.
4.1 Current Industry Status
4.1.1 Employment
11 Director, Master of Science in Management, University of Asia and the Pacific

CRC Foundation Inc. - - The Global Recession and the Philippine Economy
87
As of end-2008, the BPO industry employed a total of 371,965 full-time employees (FTEs). Over the five-year period from 2004-2008, the number of FTEs in the industry more than tripled, for an average annual growth of 40%. While BPOs contribute only slightly more than 1% of total employment in the
Philippines;12 it accounts for a substantial portion (7%) of total employment in the National Capital Region (NCR). Employment in BPOs is already larger than the
whole financial intermediation sector.13 This is particularly good accomplishment for an industry than is barely a decade old.
Figure 4.1
Contact call centers account for 61% of total employment in the sector; followed by Back Office / Knowledge Process Outsourcing or KPO with 19%; IT Outsourcing or ITO is next with 9%; Transcription, 6%; Animation, 3%; Engineering Services Outsourcing or ESO, with 2%; and Digital content / Game development, with 0.2%.
12 based on January 2009 estimate of 34,258,000 employed Filipinos, per NSCB 13 banks and non-bank financial institutions, including insurance and pre-need companies, employ about 336,000 people nationwide
Chart 1. BPO Employment2004-'08, in full-time employees (FTEs)
2004 2005 2006 2007 2008
Digital content/Game development
Engineering Services Outsourcing
IT Outsourcing
Animation
Transcription
Back office / Knowledge Process Outsourcing
Contact centers
100,500
371,965
298,953
235,575
163,250
Source: BPA/P

CRC Foundation Inc. - - The Global Recession and the Philippine Economy
88
Figure 4.2
4.1.2 Revenues
In terms of revenues, the industry has grown by more than four (4) times between the period 2004-2008 for an annual average growth of 43%. In terms of size, the industry’s revenues is already about 1/3 the size of OFW remittances—presumably without the attendant social costs associated with OFW and migration. In 2000, the industry’s total revenues was only US$350 M; by 2008, its total revenues was at US$6.1B—a growth of more than 17 times in seven years. Based on direct output alone, 2008 BPO revenues is about 5% of the country’s Gross Domestic Product.
Chart 2. 2008 BPO Employment, by sectorin no. of full-time employees (FTEs)
Digital content/
Game development
(500)
Contact centers
(227,000)
Engineering Services
Outsourcing (12,000) IT Outsourcing
(35,314)
Animation
(8,000)
Transcription
(20,224)
Back office/
Knowledge Process
Outsourcing (68,927)
Source: BPA/P
TOTAL FTEs
(371,965)
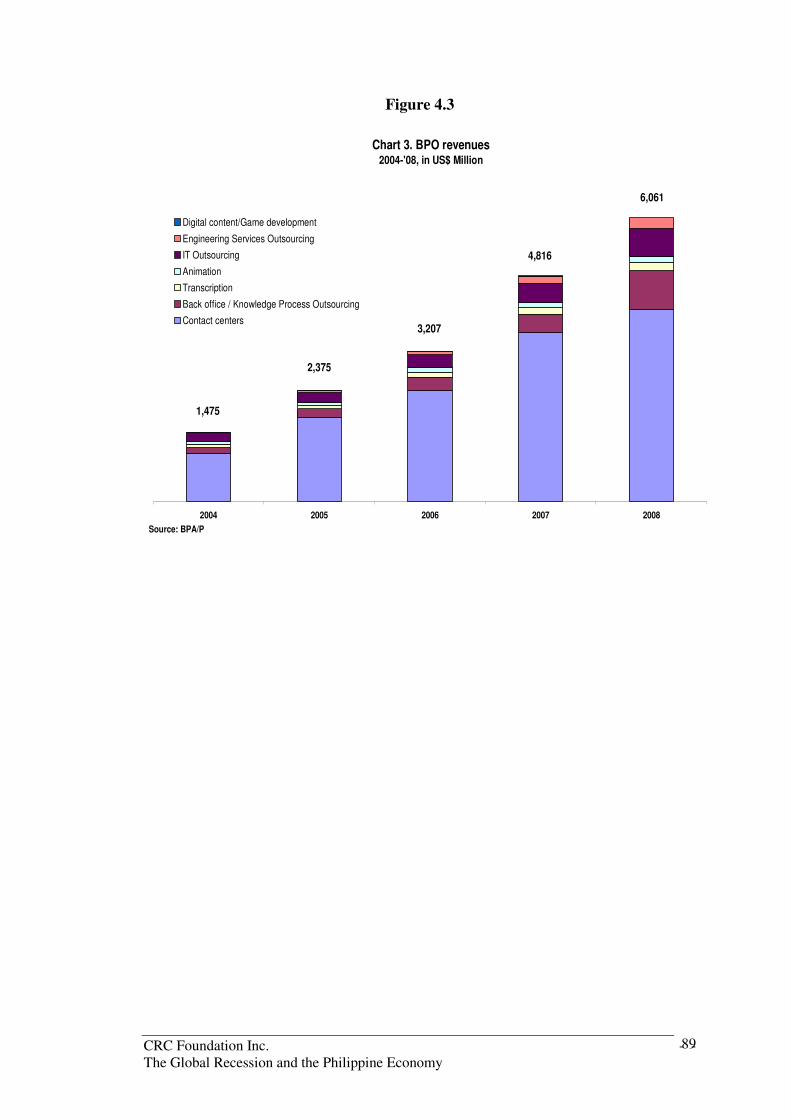
CRC Foundation Inc. - - The Global Recession and the Philippine Economy
89
Figure 4.3
Chart 3. BPO revenues2004-'08, in US$ Million
2004 2005 2006 2007 2008
Digital content/Game development
Engineering Services Outsourcing
IT Outsourcing
Animation
Transcription
Back office / Knowledge Process Outsourcing
Contact centers
Source: BPA/P
1,475
6,061
4,816
3,207
2,375

CRC Foundation Inc. - - The Global Recession and the Philippine Economy
90
Contact call centers again contribute the largest share to total BPO sector revenues at 68%; KPOs, 14%; ITO, 10%; ESO, 4%; Transcription, 3%; Animation, 2%; and Digital contents/game development, 0.05%. However, the fastest growing sub-sectors are the KPOs and the ESOs, as each grew by almost seven times their revenue base over the past five years. This indicates the Philippines is already starting to diversify into non-voice BPOs.
Figure 4.4
Chart 4. 2008 BPO Revenues, by Sector (in US$ Million)
Back office/
Knowledge
Process
Outsourcing
(827)
Transcription
(182)
Animation
(120)
Information Technology
Outsourcing
(601)
Engineering Services
Outsourcing
(228)
Digital content/
Game development
(3)
Contact centers
(4,100)
Source: BPA/P
Total BPO
(6,061)

CRC Foundation Inc. - - The Global Recession and the Philippine Economy
91
4.1.3 Revenue per Employee
There had been previous recommendations for the Philippine BPO industry to move up the “value-chain.” This is commonly interpreted as referring to the shift from call center operations into “more complex” types of BPOs, e.g. KPOs, ESOs, ITOs, etc. However, in terms of revenue generated per employee, call centers are among those with the highest in the industry (US$18,062), ranking a close second to ESOs (US$19,000). Call centers, while essentially offering voice services, require agents to possess multiple technical skills as certain program (client) types have agents simultaneously operating several software programs while interacting with a client / caller.
Figure 4.5
Chart 5. Revenue per Employee2008, in US$
16,294
18,062
12,000
8,976
15,000
17,019
19,000
6,000
Total BPO
Contact centers
Back office / Knowledge
Process Outsourcing
Transcription
Animation
IT Outsourcing
Engineering Services
Outsourcing
Digital content/Game
development
Source: BPA/P

CRC Foundation Inc. - - The Global Recession and the Philippine Economy
92
Overall, revenue per employee in the BPO industry has improved to reach US$16,294 in 2008, from US$14,677 in 2004. Partly, this is due to the growth in higher value-adding sub-sectors such as KPOs and ESOs. Higher revenue per employee implies that industry revenue targets can be supported with less employees.
Figure 4.6
4.1.4 Regional Distribution of Employment
The BPO industry is still largely concentrated in the NCR. There are however BPOs that pursue a deliberate strategy of locating in areas outside of the NCR and Metro Cebu. While there is a smaller pool of prospective BPO applicants in these locations, the quality—in terms of BPO-relevant skill-sets—is high especially in those that serve as regional education centers. Nevertheless, about 78% of total BPO employment is generated in the NCR, with Region VII (or Central Visayas, including Cebu) accounting for 6%. Region III, which includes Clark (Pampanga) and Bulacan, contributes another 5%; and Region IV (CALABARZON), 3%.
Chart 6. Revenue per Employee (Total BPO)2004-'08,in US$
14,67714,548
13,613
16,11116,294
2004 2005 2006 2007 2008Source: BPA/P

CRC Foundation Inc. - - The Global Recession and the Philippine Economy
93
Figure 4.7
4.1.5 Linkages with the National and Local Economy
The BPO sector has limited contribution in terms of inter-industry output multiplier. Its forward linkage (which measures the relative importance of the sector as a supplier to other industries) is low, as its output is geared mainly for clients abroad and not for domestic industries; this is also about the same situation with its backward linkage (which measures its relative importance as a buyer of inputs from other sectors), since its most important input is labor (which is a primary input and not the product or output of another industry), as salaries and wages account for 40% to 60% of the total costs of a BPO operation. However, BPOs are significant contributors in terms of income multiplier (i.e. an increase in overall household income given an increase in BPO revenues). Table 1 indicates that it is one of sectors with the highest income multiplier. Presumably, considering BPO professionals high average salary (e.g. compared with workers of
the same age),14 they would have higher propensity for consumption—which then translates to an increase in the final demand (an exogenous element) for other industries.
14 A call center agent earns between Php14,000 to Php25,000 monthly, excluding bonuses.
Chart 7. Regional Distribution of BPO Employment2008, no. of FTEs
XII
33
X
1,193
CAR
4,505
I
667
VIII
1,787
XI
3,927
VII
23,863 VI
11,344
V
2,454
NCR
290,236
IV-A
12,688
III
18,321
Source: BPA/P

CRC Foundation Inc. - - The Global Recession and the Philippine Economy
94
Table 4.1 Household Income Multiplier and Linkage Indices
Sector Income
Multiplier Public services and social work 0.76751
Private services 0.49925
Business services 0.40473
Call/Contact centers, Business Processing outsourcing and other IT-based services
0.39017
Repairs of motor vehicles and personal and household goods 0.36809
Construction 0.35638
Computer-related activities 0.35531
Other community, social and personal service activities 0.34361
Tourism 0.34031
Furniture 0.30986
Agribusiness 0.30059
Miscellaneous manufacturing 0.28863
Garments 0.28630
Air transport 0.26858
Manufacture of wood, wood products (except furniture) leather, leather products, rubber, rubber products, paper, paper products, chemicals, miscellaneous chemicals, drugs and plastic
0.26606
Land transport (including road freight transport but excluding tour buses)
0.26104
Wholesale and retail trade 0.26066
Automotives including railroad, aircraft, and animal and hand-drawn vehicle
0.25079
Electronics 0.24565
Finance 0.24313
Storage, postal and telecommunications 0.24302
Mining 0.23220
Activities of other transport agencies (including custom brokerage, n.e.c)
0.23219
Manufacture of petroleum, asphalt, pottery, glass, cement, clay, concrete, non-metallic mineral products, metal, iron, and non-ferrous products
0.22551
Supporting services to transport 0.21128
Shipyards and boatyards 0.20038
Electricity, Steam and Water 0.19292
Water transport 0.18085
Real Estate 0.05665
Source: NSCB Input-Output Table (2000)

CRC Foundation Inc. - - The Global Recession and the Philippine Economy
95
Given BPOs’ concentration in particular areas, especially in the NCR, the sector has significant impact in specific localities. BPOs attract significant commercial activity that also tend to match their 24/7 operations, including food services, transport, entertainment establishments, and housing developments and dormitories, etc. For instance, the about 290,000 BPO professionals in the NCR earn annual personal
incomes of at least Php75 B.15 LGUs, even if BPOs enjoy fiscal incentives under PEZA rules, benefit from the higher tax base—both from the commercial establishments that support BPO operations and from the taxes that BPO professionals individually pay as residents of the locality. For a locality to fully benefit from BPOs operating within its boundaries, a progressive LGU should ensure that its young workforce—for instance, those studying in LGU-run or LGU-supported public universities—possess the necessary BPO-related skills. All other things equal, there is a strong market-based incentive for BPOs to hire agents living proximate to their operations as this affects agents’ quality of life (e.g. travel time to office), physical security especially as they leave office premises late at night or early in the morning, access to public transportation, ability to be mobilized during emergencies (e.g. for their back-up plans to ensure continuous operations during natural calamities and civil disruption), etc. All these affect BPO attrition rates.
It should be emphasized the latest available Input-Output table was constructed by the NSCB in 2000 (using data gathered in 1999), when the BPO industry was still at its nascent stage. For instance, the call center sub-sector only had 2,400 employees in 2000 and revenues of US$24M; in 2008, its employee base was about 95 times bigger (227,000) and its revenues about 171 times larger (US$4.1 B).
4.2 Impact of the Crisis on the Sector
In 2007, prior to the global crisis, the industry developed the Offshoring &
Outsourcing Philippines Roadmap 2010. It targeted to grow the country’s share of the global market from the approximately 5%-6% in 2006, to about 10% by 2010. This means that—based on projections then of the global market—revenues should increase to about US$13B by 2010, supported by about 900,000 full-time employees (FTE). With the global crisis, the industry no longer expects to meet the 2010 targets—at least not in 2010. However, the industry will continue to enjoy strong growth—revenues will increase by between 20% to 30%; while employment will grow at a slightly lower rate since (a) productivity in the sector has been increasing (i.e. less employees are needed to support the revenue targets) and (b) more value-adding BPO services are being established. Thus, by 2010, revenues will most likely grow to about US$9.5B; and full-time employees will number at least 580,000.
15 Assuming average salary of Php20,000; based on basic monthly salary alone and 13th month pay.

CRC Foundation Inc. - - The Global Recession and the Philippine Economy
96
Table 4.2 BPO Projections
2010 2011
Original projected projected
target * ** **
Revenues (US$ M)
13,000
9,455
13,048 Employment (FTEs)
900,000
580,265
800,816
Source: Author's estimates based on interviews The revised revenue estimate of BPA/P for 2010, as quoted by the JETRO Manila
Center, is about US$11.4-11.8 billion.16
Given the global orientation of the BPO sector, its performance should be positively correlated with that of the global economy—especially of the main BPO markets, e.g. the United States. However, a confluence of factors provides the Philippine BPO industry with a unique opportunity to consolidate its position as a preferred location for BPO services in the context of the slowdown—especially in relation to the problems currently besetting its leading competitor-country (India). The impact of the crisis on the industry can be examined from the market demand-side and from the supply-side.
4.2.1 Impact on Market Demand:
• Positive impacts. The continued relative stability of the country’s economy, coming at a time when India is suffering from negative perceptions due to the
terrorist attacks in Mumbai17 and financial governance scandal at Satyam,18 has highlighted the Philippines’ attractiveness as a BPO location.
In addition, the global crisis and the resulting corporate bankruptcies have pushed companies to seek ways by which they can enhance their cost competitiveness and improve service quality—key value propositions of BPOs.
And, provided that the crisis will result in a stable and predictable depreciation of the Philippine Peso, this may also have a positive impact on foreign exchange-earning sectors, including BPOs.
16 JETRO Philippine IT Industry Update – eServices Philippines 2009, FY2008 - No.3, March 31, 2009, JETRO Manila Center. 17 Refers to the coordinated bombing and shooting attacks that occurred in Mumbai, India that lasted from November 26 to 29, 2008. 18 Refers to the corporate fraud scandal in one of India's biggest software companies, Satyam Computer Services.

CRC Foundation Inc. - - The Global Recession and the Philippine Economy
97
• Negative impacts: The financial crisis resulted in a decline in business transactions supported by BPO companies. However, two important trends must be highlighted:
First, even with the general slowdown, certain types of transactions were observed to have increased (e.g. outbound calls for credit collection); and, second, there is continued strong interest in the Philippines as a BPO location, with potential projects already in the pipeline. However, it is expected that the negotiation process for contracts will be harder, as clients adopt a certain level of wait-and-see posturing, exhibit greater risk aversion, and express greater interest in fee reductions. Moreover, since client companies are also in the midst of financial and organizational restructuring themselves, negotiation cycles become longer.
4.2.2 Impact on the Supply Side
• Positive impacts. The most critical cost items for BPOs are: salaries and wages, rent, telecoms expenses, and utilities. Slower economic growth is expected to lessen inflationary pressure on these cost items, thereby positively affecting BPO operations and profitability.
More importantly, however, the financial crisis can be a unique opportunity for the country to address a major competitiveness challenge—the sustainability of the supply of BPO professionals. This can best be analyzed by looking at the different stages in the supply pipeline: from the pool of graduating college students, to those actually applying in BPOs, to those successfully accepted, and eventually, to those who choose to remain in the BPO industry.
4.2.3 Analyzing the Pipeline of BPO Professionals
The economics of off-shoring service processes is influenced primarily by arbitraging labor cost differences and, in the case at least of the Philippines and India, higher quality services. These are dependent, to a great extent, on the size and quality of the country’s educated work force, i.e. number of college students—with the relevant skill-sets—that the educational system produces every year.

CRC Foundation Inc. - - The Global Recession and the Philippine Economy
98
Figure 4.8
Chart 8. Sustainability of Supply of BPO Professionals
No. of graduates / job seekers
No. of applicants to BPOs
No. of qualified / accepted
applicants
No. of retained
employees
Attractiveness of BPO employment / career: growth of BPOs vs. other industries, compensation in BPOs, nature of the work & of work environment, opportunities for career growth
Applicants’ Skills gap: Short-term - training courses on specific skills, addressed to near-hires; Long-term – enhancing tertiary-level curricula, as well as elementary & secondary education
External: Opportunities in other sectors
Internal: Management Skills gap – ability of managers to create viable work environment (e.g. career growth & training, viable career paths, interesting job & work environment, etc.).
Business model – for cost-based propositions, higher pay of tenured employees vs. recruitment & training costs, etc.
Population level; Consolidation of higher education institutions in a locality; Business environment; ICT readiness of localities.
No. of graduates / job seekers - this is affected by the population level and the amount of public and private resources devoted to the educational system. In turn, these are reflected in student cohort rates. For the Philippine case, the quality of graduates is also affected by—to a certain extent—by the shorter basic education program (i.e., number of years of full-time schooling from elementary to high school to college) and the migration of school teachers to other countries. There is also wide variability in the quality of educational services across the different localities of the country. For instance, certain locations have evolved to become excellent de-facto regional centers of education (e.g. areas where American Christian missionaries established excellent educational institutions). Hence, the size and quality of the pool of college graduates can be location-specific. To the extent that these areas can be supported with the appropriate policies and infrastructure, then BPOs can take advantage of their pool of graduates. Number of applicants to the BPO industry. This is a function of the attractiveness of the BPO industry as an employer vis-à-vis other industries. It is affected by economic (e.g. comparative salaries & wages, wage increase expectations, etc.) and non-economic factors (e.g. quality of life and work environment, work-life balance, stress levels, career opportunities, etc.). These factors, as they actually are or as they are perceived by the public, determine to a large extent the attractiveness of an industry.

CRC Foundation Inc. - - The Global Recession and the Philippine Economy
99
Number of qualified / accepted applicants. This is mainly affected by the skill-sets of graduates applying for BPO positions. For the BPO industry, the important skills required are: language proficiency (e.g. English), computer skills, critical thinking, analytics, problem-solving, and soft skills (including leadership, teamwork, initiative, and customer service orientation). To have a higher percentage of qualified applicants, it is also important for an industry to attract graduates from good feeder schools (e.g. the so-called “first-
tier” schools)19 and those who took appropriate courses. No. of retained employees. For the BPO industry, voluntary attrition is a key variable that is being monitored. Due in part to the nature of BPO work—e.g. the daily schedule, stress levels, and monotony of tasks—BPO employment is seen by many as just a “stepping-stone” towards finding careers in other industries. Lately, however, there has been a broadening of approach on the problem of attrition rates—from previous approaches which highlighted agent-specific factors to current proposed solutions that consider the role of supervisors and managers.
4.2.4 Impact of the Crisis on the Pipeline of BPO Professionals
The impact of the crisis on the pipeline of BPO professionals can be described at each stage of the pipeline (ref. Table 3.3).
19 It is however probable that there is negative correlation between a school’s ranking and voluntary attrition among its graduates who work in the BPO industry.

CRC Foundation Inc. - - The Global Recession and the Philippine Economy
100
Table 4.3 Impact of the Crisis on Supply Pipeline of BPO Professionals
Current Situation Impact of the Crisis Possible Interventions
No. of graduates / job seekers
• The country produces around 320,000 college
graduates every year;20 about 110,000 or 35% took business or IT-related courses.
• Around 25% of the graduates are in the National Capital Region
(NCR).21
• Out of 100 students who enter grade 1, only 75.3% manage to finish manage to the elementary level; while only 79.9% percent of those who enter secondary schools manage
to finish high school.22
• Possibly, some students may drop-out of college, leading to deterioration in cohort rates. But in the short-term (within a one-year period), the impact on number of graduates may not be as significantly felt.
• Possibly, greater number of students will choose to study in their home localities rather (or in regional education hubs) than go to the NCR.
• More students choosing to study in their localities may encourage dispersion of BPOs away from NCR (and Metro Cebu). Currently, BPOs in NCR generate about 78% of total industry employment though the rest of the country accounts for around 75% of total college graduates—especially Regions IV-A, VI, VII and III.
• Ensure BPO readiness and friendliness of localities which serve as regional education hubs.
• Provide opportunities for part-time BPO employment to college students, as a way of funding their studies; or developing other mechanisms for financing their studies, e.g. thru loans and scholarships.
No. of applicants to BPOs
• Strong negative perception of BPO work as being monotonous, stressful both in terms of nature of work and its schedule, offering
• Other industries’ slower growth can make employment in BPOs more attractive for newly graduates and industry shifters.
• Retrenched workers from other
• Job assistance programs jointly organized by BPA/P, industry associations representing sectors negatively affected by the crisis, and relevant national and local government agencies.
• Job assistance programs for returning OFWs
20 Based on the 315,928 graduates in 2003/04, as reported by the Commission on Higher Education (CHED); 21 The share of NCR was computed to include graduates of masters and doctoral courses. 22 Based on 2007-2008 cohort survival rates as reported in the DepEd Fact Sheet (as of September 2008), Research and Statistics Division, Office of Planning Service, Department of Education.

CRC Foundation Inc. - - The Global Recession and the Philippine Economy
101
Table 4.3 Impact of the Crisis on Supply Pipeline of BPO Professionals
Current Situation Impact of the Crisis Possible Interventions
limited career growth, etc. industries and returning OFWs can be potential BPO applicants—provided they possess the required skill-sets or can be re-trained to acquire BPO-related skills.
• Specific country-knowledge of returning OFWs can provide opportunity to penetrate additional country-markets.
jointly organized by BPA/P and the appropriate national and local government agencies.
• Partnerships between BPA/P and academic institutions to provide students with a broader, more realistic understanding of the BPO sector and the career opportunities in this industry.
• Enhancing employer branding of BPOs.
No. of qualified / accepted applicants
• Low success rate among applicants, estimated based on interviews at between 5% to 10%.
• Better-qualified applicants may consider BPO employment, e.g. graduates of “first-tier” schools (however they may be defined), graduates of courses more appropriate for BPO jobs, laid-off managers from other industries, etc.
• Academic institutions, given brighter prospects in the BPO sector, may embed BPO-related courses in college curricula and may actively encourage students to pursue BPO-related careers.
• Partnerships between BPA/P and academic institutions in offering courses that will develop BPO-related skills (including English language proficiency) and in exploring internship opportunities in BPOs; harnessing greater involvement of the Commission on Higher Education (CHED) in these initiatives.
• Providing remedial training for “near-hires”.23
• Reviewing Philippine basic educational system and benchmarking it with international practice, possibly towards (a) lengthening current 10-year basic education program and (b) developing courses more relevant for current shift towards technology-intensive, service-based economies.
No. of • Varying (voluntary)
attrition rates in the • Given slower growth in other
industries, BPO professionals • Improving quality of life of BPO workers, in the
context of nature of work and of work schedule.
23 Define “near-hires”

CRC Foundation Inc. - - The Global Recession and the Philippine Economy
102
Table 4.3 Impact of the Crisis on Supply Pipeline of BPO Professionals
Current Situation Impact of the Crisis Possible Interventions
retained employees
industry, with the average attrition estimated at between 20%-25%; with some companies experiencing 50% attrition
or even higher.24
may be encouraged to stay longer with BPO companies.
• Promoting work-life balance within the industry.
• Developing career paths within the industry, including possibilities of overseas posting as part of business development teams in new markets (e.g. China).
• Improving leadership and supervisory skills of front-line BPO managers—who are typically young, newly-promoted BPO agents with limited work experience but tasked with handling large team(s) of agents.
• Consider developing new HR recruitment and employee retention models based on realities of the industry (i.e. of being considered as stepping stone towards career in other industries).
• Consider enhancing direct and indirect economic benefits (e.g. pay increases, training, benefits which are linked to tenure, e.g. car, housing & education plans, etc.) of BPO professionals, considering direct and indirect costs of attrition (e.g. cost of recruiting replacement—given low applicant’s success rate—for each worker that voluntarily leaves the BPO industry); possibly using as model the other industries which previously experienced pronounced talent recruitment needs and retention problems.
24 Based on author’s interviews conducted between April to May 2009.

CRC Foundation Inc. - - The Global Recession and the Philippine Economy
103
In summary, the global crisis is expected to enhance the attractiveness of BPOs as employers of new graduates, industry shifters, retrenched workers and returning OFWs—provided that they possess the required skill-sets or can be re-trained to acquire these BPO-related skills. The crisis presents an opportunity for the industry to surmount negative perceptions about the nature of BPO work (e.g. it is monotonous) and perception on the poor quality of life among BPO professionals. As the crisis can cause a deterioration in the cohort survival rate among students, BPOs can assist students fund their studies and at the same time introduce them to BPO (part-time) employment. The industry should also resist the temptation to take advantage of the weak labor market to unjustly squeeze current and incoming BPO professionals. In the long-run, BPOs must develop strategies that will highlight the benefits of being employed in BPOs, e.g. globally-oriented career path, and must fundamentally re-think industry current human resource recruitment and retention models.
4.2.5 Industry Expectations: Impact of the Crisis
The BPA/P has been monitoring the impact of the global crisis on BPOs. Industry perception on the impact of the crisis, based on a number of surveys, had consistently been optimistic—or cautiously optimistic, at worst. These surveys and highlights of their results are given below:
• In October 2008, the BPA/P conducted a survey participated by 113 of their members. Nearly 80% indicated that the global financial crisis will have a neutral or positive impact on their Philippine operations, with larger BPOs (e.g. those with employment of above 5,000) more optimistic than those with less than 500 people. Among BPO sub-sectors, the software segment was more pessimistic than other segments, with majority of software BPOs indicating that the crisis would
have a “negative impact” on their operations.25
• In another BPA/P survey in November 2008, focusing on non-voice BPO services and participated in by 190 companies, 96% of non-voice BPO service providers are optimistic about the business outlook for 2009—regardless of the size of the organization; with about 51% saying that prospects were “excellent”. In terms of workforce growth for 2009, 92% projected an increase of 6%; with about 65% of
them expecting growth of more than 16%.26
• In January 2009, the People’s Management Association of the Philippines (PMAP) released the results of a survey participated by 177 companies, 13 of which were from the BPO sector. The results showed that BPOs seemed to be more optimistic than other industries as 80% of the surveyed BPOs expected to increase headcount in 2009, with 91% of them attributing this to growth in business; in contrast, across all sectors, only 60% said they expect an increase in
headcount—with about 48% of them attributing this to a growth in business.27, 28
25 As reported in the JETRO Philippine IT Industry Update – eServices Philippines 2009, FY2008 - No.3, March 31, 2009, JETRO Manila Center 26 Ibid. (same as the reference above???) 27 Accessed from www.bpap.org, April 2009

CRC Foundation Inc. - - The Global Recession and the Philippine Economy
104
• In another survey, with 160 BPO respondents, undertaken by the BPA/P and Outsource2Philippines from March 31 to April 29, 2009, around 83% said that the impact of the global crisis has been “moderate” or “minor”; 16% mentioned that the impact has been significant; while only 5% answered “very significant.” Moreover, as noted by Ms. Gillian Joyce Virata, BPA/P Executive Director for Information and Research, BPOs have been introducing new services—an indication that innovative BPOs “are identifying new opportunities as a result of
the crisis.” The survey likewise validated that supply of BPO professionals remain a challenge as more than half of the respondents indicated a success rate of
7% or greater; while 45% experienced success rates of 6% or less. 29
4.3 Specific Recommendations
A number of the possible interventions mentioned in Table 2 are actually already being implemented by the industry, mainly in partnership with government agencies and academic institutions.
4.3.1 BPO Industry Roadmap
As mentioned, the industry already has a well-defined roadmap, authored by the BPA/P and jointly developed with stakeholders (e.g. key government agencies including the CICT and DTI). It presents a detailed analysis of the challenges that the Philippines faces in order to grow the BPO industry, as well as prescribed solutions.
The BPO Roadmap identified the key drivers for the industry’s growth: Talent, Next Wave Cities, and the Business Environment.
• On talent, the industry recognizes that the speed and trajectory of its growth is dependent on the continuous recruitment and retention of BPO professionals. To address this, the following actions were specified: (1) developing a training program for “near-hires” to qualify for employment in the industry; (2) creating awareness of the career opportunities in the industry, directed to young graduates and critical influencers (e.g. parents and academics); (3) tapping alternative labor pools—including housewives, retirees, non-graduates, and career-switchers—as well as the 75% of college graduates that reside outside of NCR; (4) creating opportunities for students to fund their studies by working in the industry (e.g. as working students); and (5) partnering with academic institutions to ensure that college and secondary curricula are relevant in developing skills relevant for future employment in BPOs, as well as in other industries.
• On next wave cities, the industry is overly concentrated in the NCR, creating demand pressure on the supply of talent, real estate, and telecoms infrastructure. The BPA/P City Scorecard project aims to provide actionable,
28 “Employment situation not uniformly dismal,” Press Release on the Results of PMAP Pulse Survey, People’s Management Association of the Philippines (PMAP), 26 January 2009 [accessed from www.pmap.org.ph on June 2, 2009]; Presentation accessed from www.bpap.org, April 2009. 29 “BPO executives optimistic despite global crisis—survey,” BusinessWorld, S1/3, col. 1, May 27, 2009.

CRC Foundation Inc. - - The Global Recession and the Philippine Economy
105
accurate information and create convergent stakeholder interest on other viable locations.
• On the business environment, the industry seeks to maintain its attractiveness to investors by ensuring the continued competitiveness of its investment (financial) incentives, support to investors from beginning-to-end of the start-up process, improving international perception of Philippine investment climate and risk environment, and overall support to develop the industry from government, industry organizations, and other stakeholders.
4.3.2 Public-Private Partnership as a Strategy
Sustainability of talent supply, developing next wave cities, and improving the business environment are issues that can only be addressed through collaboration between the industry, government and academe—or thru Public-Private-Partnership (PPP) approaches. Key players from government are the Department of Trade and Industry (DTI), the Commission on Information and Communications Technology (CICT), the Technical Education and Skills Development Authority (TESDA), the Department of Labor and Employment (DOLE), and the Commission Higher Education (CEHD); while the industry is represented by the Business Processing Association of the Philippines (BPA/P).
In general, excellent PPP initiatives are already existing and on-going in the BPO industry. These initiatives can just be up-scaled or enhanced.
These PPP approaches, arranged according to the timing of their intended impact and the relevant stage in the supply pipeline of BPO talent, are enumerated in Table 4.

CRC Foundation Inc. - - The Global Recession and the Philippine Economy
106
Table 4.4 Selected PPP initiatives in the BPO industry
Timing of intended impact: Short-term Medium Term Long-term
No. of graduates / job seekers
• Expanding BPO locations to outside of Metro Manila and Metro Cebu (e.g. Next Wave Cities within the Cyber Corridor initiative of the BPA/P, CICT, and DTI)
• Maintaining BPO-friendly business environments in localities [e.g. thru more intensified Industry-LGU-NG dialogues and partnerships, as initiated by local ICT Councils]
• Addressing the decline in Philippine educational system, especially as it relates to following specific skills: language proficiency (e.g. English), computer skills, critical thinking, analytics, problem-solving, and soft skills (incl. leadership, teamwork, initiative, customer service)
• At the tertiary-level, the Service Science Management and Engineering initiative of CICT and industry players
No. of applicants to BPOs
No. of qualified / accepted applicants
• Addressing mismatch between skills and job requirements via training, especially of the near-hires (e.g. TESDA - BPA/P partnership on the Pangulong Gloria Scholarships)
• Promoting industry-specific exposure to students, [e.g. longer internships as being advocated by the ECCP and currently practiced by a number of academic institutions; BPO-specific elective subjects embedded in college courses; and the Advanced English Proficiency Training Program (ADEPT), a tie-up between BPA/P and the Coordinating Council of Private Educational Associations (COCOPEA)]

CRC Foundation Inc. - - The Global Recession and the Philippine Economy
107
Table 4.4 Selected PPP initiatives in the BPO industry
Timing of intended impact: Short-term Medium Term Long-term
No. of retained employees
• Joint Industry-Academe management development programs [e.g. Training for Offshoring and Outsourcing Leadership Program (TOOL) - middle management program for the in partnership with Ateneo and De La Salle]

CRC Foundation Inc. - - The Global Recession and the Philippine Economy
108
4.3.3 Specific Recommendations: What (Else) Can Be Done?
The BPO industry resulted from the close partnership between the industry (or the entrepreneurs who early-on saw the possibility of developing the sector) and government (principally, thru then DTI Sec. Manuel A. Roxas III). Gradually, the Academe became involved as the importance of ensuring supply of BPO talent became apparent; and as universities saw the economic opportunities that the industry
can open to their graduates.30
In the context of the global crisis and cognizant of the industry’s deep experience and certain level of success in pursuing PPP projects, specific steps can still be pursued in order to ensure the sustainable development of the industry. These include the following:
• Ensure compliance with the Implementing Guidelines of MOA signed between TESDA and BPA/P on February 4, 2008 under the PGMA-TWSP. The Memorandum of Agreement (MOA) specified that the BPA/P “shall have sole
discretion to distribute and allocate” the training vouchers for the O&O sector; while “TESDA shall be responsible for the release of funds to the Regional
Offices for payment to BPA/P training providers.” Such a delineation of roles is critical in ensuring that the training vouchers are efficiently distributed only to qualified prospective BPO candidates, or more specifically to the “near-hires.”
In 2008, the BPA/P distributed over 44,000 certificates worth Php260M resulting in the following employment yield rates (i.e. percentage of trainees who were eventually employed) for the BPOs: 67% for Contact Centers; 82% for Medical
Transcription; and 100% for Software and 100% Animation.31
• Form ICT Councils in the NCR. There are already 23 ICT councils nationwide, with only one (Quezon City) in the NCR. ICT Councils can be very effective in advocating location-specific improvements in the business environment. Currently, in the NCR, this function is being performed by the BPA/P and the CICT. However, these national-level institutions are not direct political constituencies of local government units (LGUs) and may thus have limitations on their impact given the dynamics of local policymaking.
Even as BPOs enjoy PEZA incentives that exempt them from certain national and local-level taxes and fees, there are anecdotes of LGUs within NCR that impose various kinds of regulations and try to collect different fees specifically targeting BPOs. While there are indeed additional local-level public services required to support an industry with 24/7 operations, e.g. security, traffic enforcement, etc., care must be exercised to ensure that any additional fees and regulations will not be seen as capricious steps meant to cash-in on a growing industry. Since the fees seem to be directed primarily at BPOs, it is important for LGUs to actually deliver
30 Not surprisingly, “second-tier” academic institutions and those in the provinces—who are more aggressive in searching for employment opportunities and career advantages for their students—proved to be more open and active in promoting BPO careers among their students. 31 Presentation to the BPA/P General Membership Assembly, March 2009, accessed from the BPA/P website (www.bpap.org) May 2009.

CRC Foundation Inc. - - The Global Recession and the Philippine Economy
109
the promised services at the efficiency- and quality-levels required by BPO operations. For instance, if a certain locality is, in the first place, already finding it difficult to deliver public health services to its residents, would it have the capability to provide these same services to BPOs? As time is a very valuable resource for BPOs, does the LGU have adequately-supported health facilities proximate to BPO locations and which can provide the health services at the least amount of waiting time? Will these health services not be a duplication of the private health insurance benefits normally provided to BPO agents?
Over and above the issue of additional fees are questions of: (1) timing, i.e. prudence of imposing additional fees in the context of the current global crisis and (2) the real possibility that these fees and regulations will create another layer of complex procedures and add to transaction costs. It is in this context that the formation of ICT councils in the NCR—where BPOs are concentrated—is critical. The ICT councils can provide the venue for discussing how localities and their LGUs can maximize benefits from BPOs and, at the same time, enhance the competitiveness of their localities.
As mentioned, though BPOs enjoy incentives that exempt them from certain national- and local-level taxes and fees, they however enlarge the tax revenue base by attracting commercial activity and providing employment and income opportunities for residents. ICT councils can be very instrumental in upgrading local residents’ skills, through for example PPP projects in private and public
(including those operated and/or supported run by the LGUs) universities.32 Enhancing local workforce’ skills is important in making the benefits of BPOs tangible in the localities where they operate. BPOs, for their part, already face market-based incentives to hire agents who reside near the workplace. (See 4.2.5
Linkages with the national and local economy)
Another approach is to formalize the collection of fees, as in the case of a particular LGU in NCR which recently signed a Memorandum of Agreement (MOA) with PEZA for the collection of additional fees and taxes for locators of
an IT building in the city.33 Currently, Republic Act No. 7916 or the Special Economic Zone Act of 1995 (as amended) provides that PEZA locators are subject only to a five percent (5%) tax on gross income, remitted as follows: 3% to the National Government and 2% to the municipality or city where it is located.
32 For example, ICT councils may push for PPP projects in local universities that would provide part-time BPO employment opportunities for students, internships in BPOs, and introduce BPO-embedded courses. 33 The MOA mandates the collection of the following fees:
- Quarterly waste management fee of Php50-Php1,000, depending on the aggregate area of the business;
- a Php6,000 annual mayor’s permit fee;
- an annual permit fee on exercise of profession of Php300 per employee;
- an annual health certificate fee of Php100 per person of managerial or supervisory rank, and Php50 per person for rank and file;
- an annual sanitary inspection fee ranging from Php50-Php1,000 depending on aggregate area; and,
- a City Card fee of Php750 for non-residents of the City that entitles holders to free lab and other health care benefits.

CRC Foundation Inc. - - The Global Recession and the Philippine Economy
110
The MOA at least provides a certain degree of transparency to the collection of local-level fees.
However, with high probability that it will be replicated in other localities, the implementation of the MOA should be closely monitored in terms of the manner by which these fees would be collected and the actual levels of additional costs as compared to the services actually delivered. The last thing that the country needs is to erode its competitiveness at the time when the attracting global investments (including into BPOs projects) have been very challenging.
However, in as much as LGUs in NCR (and perhaps Metro Cebu) are faced with greater challenges in delivering public services (e.g. due to over- concentration of population in urban areas) and, at the same time, are already attracting high investor interest, local-level fees may not be pursued by LGUs outside of the NCR. This can then make them more attractive to investors and can in fact hasten the development of alternative BPO locations.
BPOs are by nature global in terms of their outlook and are a stickler for global standards and procedures. Local ICT councils can provide the industry with the local perspective needed in the expanding BPOs to different locations and to develop win-win local solutions for all stakeholders.
• Intensify holding of Training Matching and Job Assistance Events. The existing partnership between government (e.g. TESDA, CICT, DOLE, DTI, etc.), BPA/P and its member companies, and other industry associations (e.g. Semiconductor and Electronics Industries in the Philippines, Inc. or SEIPI) should be intensified further as they provide an effective way for matching the job seekers with industries where they are needed.
For instance, a Training Matching and Job Assistance Event (TMJAE) event was held last February 16, 2009 at TESDA Complex, Taguig City. There were 6,240 registrants, mainly from the NCR and Region IV-A; of whom, 277 were OFWs, 3,871 displaced workers, 512 dependents, and 1,580 walk-ins). About 18 BPAP members participated, offering a total of 12,420 job openings broken down as follows: call centers-11,820, Animation-500; and Medical Transcrition-100). There were 295 who registered for language proficiency tests, and about 130 actually qualified for assessment with the “Pro-Speak” language software. Both local and overseas employers participated in the TMJAE.
• Ensure strict implementation of Republic Act No. 9492 “An Act Rationalizing the Celebration of National Holidays,” and rationalize declaration of holidays at the local level. For a labor-intensive industry supporting a 24/7 operation, the impact of holidays—local and national—can be substantial. The whole industry reportedly loses about US$1 million for each day that is declared a holiday. The country must ensure that the number of its regular work days remain competitive with those of other countries.
• Continue aggressively promoting the Philippines internationally. The Philippines continues to suffer from negative perception problems abroad, most of which are totally unrelated and irrelevant to the BPO industry. For instance, isolated terrorist activities and kidnappings are highlighted in foreign media. There is a need to

CRC Foundation Inc. - - The Global Recession and the Philippine Economy
111
continue, and even intensify, joint government-industry efforts to highlight the advantages of the Philippines as a BPO location.
While the industry has grown sufficiently large to have the capability to engage in international promotion activities, there is still scope for government involvement because of two (2) important reasons.
First international promotional activities can be considered as a public good since it creates positive externalities for the whole industry. Moreover, given the shortage in the supply of a critical input (i.e. BPO professionals), there is actually
incentive for current players to limit the number of entrants into the industry.34
Second, it is also imperative that the Philippines—if it wants to grab global BPO market share—immediately embarks on an aggressive international promotion campaign, especially given the difficulties being experienced by India. However, with the global crisis, BPOs may not be in a position to prioritize this and instead may be concentrating on internally growing their respective businesses. Promotional efforts could therefore be led by government (e.g. CICT and DTI, thru CITEM and/or BOI).
• Ensure continued attractiveness of government investment incentives for BPOs. At present, the Philippines’ investment incentives (primarily administered by DTI’s Board of Investments or by the PEZA) are comparable with those being awarded by other countries. Incentives are critical in attracting investors, especially in industry models that revolve on cost arbitrage. Given the strong interest among other countries to aggressively promote their own O&O sectors, the Philippines must ensure that the incentives it provides are at the very least, not diluted (e.g. that BPOs continue to be included in relevant priority lists, such as the Investment Priorities Plan) if not enhanced. One particular country which is expected to be more aggressive in promoting O&O investments is Sri Lanka, now that its prolonged civil war has ended. Attempts by LGUs to collect additional fees may be blown-up in press coverages and affect perceptions about the BPO and the continuity of its being a priority sector in the Philippines.
• Support the passage of key legislations. There are two pending bills in Congress which are critical to the BPO sector. The first is House Bill No. 03828 or “An Act
Protecting Individual Personal Data in Information and Communications Systems
in the Government and the Private Sector, creating for this purpose a National
Data Protection Commission, and for other purposes.” This was filed by Congresswoman Liwayway Vinzons-Chato on April 16, 2008 and seeks “to
regulate how an individual's personal information is used and protected from
misuse in both private and government information and communications
systems.” A data privacy law will assure stakeholders that the country has the relevant regulatory framework for ensuring data protection. This is critical as, among others, investors still perceive that intellectual property and confidential
34 It can however be argued that the industry association, rather than government, can perform these functions that take the nature of a public good.

CRC Foundation Inc. - - The Global Recession and the Philippine Economy
112
data are not adequately protected in the country (e.g. the Philippines continues to
be in the USTR’s Special 301 Watch List,35 as well as the Business Software
Alliance’s annual report on software piracy36).
The Data Privacy Act will provide an overall framework for data privacy and security. Currently, this is being provided by several different agencies and regulations, e.g. the Department Administrative Order No. 8 of the DTI, that focuses on guidelines for the protection of personal data in information and communications systems in the private sector; BSP Circular Number 542 of the Banko Sentral ng Pilipinas, which provides consumer protection for electronic banking; and various guidelines issued by the National Telecommunications Commission (NTC) on consumer protection, as well as on storing of data logs of traffics by telecommunications companies. Moreover, although the Philippines has an E-Commerce Law, it does not provide details on the implementation of data protection and privacy.
The other critical bill is Senate Bill No. 2546 or “The Department of Information and Communications Technology Act of 2008” filed on August 14, 2008 and sponsored by Senators Edgardo Angara and Loren Legarda. The bill seeks to form a permanent entity that would promote ICT utilization and to effectively coordinate and implement national and local ICT services. The proposed Department of Information and Communications Technology (DICT), as a separate Cabinet-level department, would help ensure policy coherence and consistency for the formulation and implementation of a long-term ICT development strategy, as coordinated with other relevant agencies including: the Department of Transportation and Communication, the Department of Trade and Industry (e.g. the Board of Investments and the Center for International Trade Expositions and Missions), TESDA, CHED, and DOLE. But, equally important, the DICT will communicate to foreign investors the level of national priority being provided to the industry. If elevated into a DICT, the current CICT will have greater influence and access to resources in implementing the Philippine Cyber Corridor project. Under Executive Order No. 561, signed by President Gloria Macapagal-Arroyo on August 19, 2006, the country was divided into five economic super regions: Northern Luzon Agribusiness Quadrangle, Luzon Urban Beltway, Central Philippines, Agribusiness Mindanao, and the Cyber Corridor. The Cyber Corridor traverses the other super regions from Baguio to Cebu to Davao. The Philippine
35 The “Special 301” Report is an annual review of the global state of intellectual property rights (IPR) protection and enforcement, conducted by the Office of the United States Trade Representative (USTR) pursuant to Section 182 of the Trade Act of 1974, as amended by the Omnibus Trade and Competitiveness Act of 1988 and the Uruguay Round Agreements Act (enacted in 1994). The 2009 Special 301 Report was released on April 30, 2009 by the Office of the United States Trade Representative [accessed from www.ustr.gov, May 2009] 36 The Business Software Alliance (BSA) is a nonprofit trade association of software companies and their hardware partners. Its goal is to promote a safe and legal digital world. Its latest report (2009) indicated that the personal computer (PC) software piracy level in Philippines in 2008 was at 69%, resulting in US$202 million losses for software companies. RP PC Software Piracy Rate Remains At 69%, but Losses Increase to US$202 Million [Accessed from www.bsa.org, May 2009]

CRC Foundation Inc. - - The Global Recession and the Philippine Economy
113
Cyber Corridor aims to create interconnected centers of BPO services all over the country.
• Study the possibility of up-scaling alternative BPO models, e.g. home-based outsourced service work. With broadband internet connection becoming more available and affordable, opportunities are being opened for home-based services that can be delivered via the internet e.g. virtual administrative assistants, data encoders, transcriptionists, etc.
This BPO sub-segment is in its nascent stage. There are already interesting anecdotes of how it provides employment opportunities (e.g. a Filipina nurse used to work in a New York hospital but is now providing medical transcription services to a US doctor from her home in Taguig City.
4.3.4 Areas for Further Study / Activities at the Level of Individual Bpos
While PPP approaches are needed to address critical challenges that the industry faces as a whole, competitive realities require that individual BPOs also implement their own would respective strategies. These strategies can include:
• Management Development Programs – while recruitment of entry-level BPO professionals (e.g. call center agents) is one of the most pressing problems in the industry, BPOs are faced with the equally critical problem of developing a deep pool of qualified supervisors and managers. Typically, a BPO manager would have risen from the ranks through the following career path: 3 years as an agent; followed by 2 years as team leader, responsible for about 8-15 people; then about 2 years as a shift leader, responsible for about 30-90 persons; and then 4 years as an operations leader, with about 60-450 people.
It is therefore not uncommon to find mid-level BPO managers who are only in their mid-to-late 20s but are already handling over 100 people and are responsible for multi-million dollar accounts. Given the pressure-filled BPO work environment, even a seasoned manager would find it difficult to handle such an assignment. Inexperienced managers, though possessing technical skills, would find it difficult to arrest high attrition rates as they may not be able to enhance workforce motivation and morale by developing the agents (and their careers) under them.
BPOs can therefore institute formal management development programs to enhance the leadership and managerial skills of their high-potential BPO talents. The Program can be customized to address problems specific to a particular BPO, as well as create a common understanding of the issues that the company is facing.
Alternatively, as an interim measure, should a BPO still not have the resources and competence to develop its own management program, it can take advantage of industry and academe initiatives on this matter. For instance, the BPA/P partnered with the Ateneo Center for Continuing Education (CCE) in offering an industry-specific Leadership and Management Development Program that seeks to equip the young BPO manager.
CRC Foundation Inc. - - The Global Recession and the Philippine Economy
114
• Employer branding, work-life balance initiatives, and development of career paths – industry-wide efforts to improve the image of the industry as an employer would have to be match by: (1) company-level branding strategies, (2) actual improvements in the quality of life of BPO professionals, and (3) development of alternative career paths for BPO professionals.
BPOs must aggressively strengthen their brands as employers, much in the same way that multinational companies in the fast-moving consumer goods (FMCG) sector have been able to position their brands as among the employer of choice among new graduates. To recruit agents, BPOs, when the industry was still starting, highlighted the economic benefits of joining the industry; later on, non-economic benefits were emphasized, such those related to social- and aspirational goals.
In terms of developing career paths, the industry can look at the possibility of supporting agents in pursuing advanced management degrees. If this can be linked to tenure and performance, advanced studies can both develop job-related skills (e.g. leadership and management skills) and provide incentives to stay longer with the company. Another possibility would be to highlight opportunities for overseas assignment, especially as BPOs now look at the Philippines as talent source for future China operations.
• Invest in and support academic studies. As a relatively young industry, there are still a small number of rigorous studies on the industry. BPOs, given the numerous urgent operational challenges that vie for their time, attention and resources, may benefit from industry-academe partnerships for studying industry issues and problems.
For instance, recent professional internship assignments and thesis work of students at the University of Asia and the Pacific (UA&P) have revealed interesting insights.
o Student-interns from the Master of Science in Management (MScM) Program were tasked by a particular BPO to provide inputs for the development of a recruitment and employer-branding strategy. The students designed and conducted an extensive survey (in the NCR and in selected Philippine regions) of various target BPO candidate categories (e.g. students of “tier 1” colleges, students of “tier 2” colleges, industry shifters, and call center shifters), regarding factors affecting job choice, sources of info about jobs, major influencers when making job choices, perceptions on BPOs, influencers on BPO perceptions, and willingness to work in a BPO or in a callcenter.
o A student of the Industrial Economics Program (IEP) modeled voluntary attrition in a particular BPO company. Based on the model, the student was able to estimate the probability that specific employees will either leave or will stay with the company, based on the following variables: previous work experience in BPOs, nature of course taken in college (technical vs. non-technical) and type of school (private vs. public), variety in type of work assigned to, distance of residence to workplace,

CRC Foundation Inc. - - The Global Recession and the Philippine Economy
115
performance evaluation rating, type of account being handled, length of pre-employment training, and unemployment level in the economy.
Further studies could focus on two important areas: first, re-defining the BPO human resource recruitment and retention model; and, estimating the real cost of attrition.
There is a segment of BPO agents that look at BPO employment only as a stepping stone towards a career in another industry. Rather than wrestling with this reality,, BPOs can instead use it to their advantage—in much the same way, for example, as certain auditing firms (known for their low-pay and absence of work-life balance) have used their reputation to attract the best applicants (and eventually lose them to client companies). BPO-related experience provides excellent training in critical skills which are equally valued in other industries (e.g. non O&O IT, FMCG, banking & finance, etc.). BPOs can leverage this to forge partnerships with other industries (e.g. the relevant industry-wide association of HR managers) to develop a protocol for hiring and recruiting professionals from BPOs.
It is also interesting to study the real cost of voluntary BPO attrition, with a view to possibly enhancing either BPO salaries or training opportunities. For instance, the cost of replacing a worker includes advertising expense for attracting applicants (doubly difficult given a hiring success rate of between 5% to 10%--which means that to recruit one successful applicant, a BPO must interview between 10 to 20); the cost of processing and interviewing the applicants; training expenses; etc. These costs can instead be added to enhance the salaries or benefits (e.g. training) of BPO agents.
It may also be useful to study the experience of other industries which have undergone either rapid growth (e.g. IT industry) and or have suffered from negative perceptions about workers’ quality of life or limited career opportunities
(e.g. sales-oriented sectors).37 They may present lessons on how they were able to surmount recruitment and retention challenges.
37 It may however be difficult to find an industry that suffered from both of these situations.

CRC Foundation Inc. - - The Global Recession and the Philippine Economy
116
Table 4.5 Summary of Recommendations
Government Industry Academe
(1) Sustainable supply of BPO professionals Attractiveness of BPO employment / career
Intensify holding of Training Matching and Job Assistance Events, as a partnership between government, BPA/P, and other industry associations (e.g. SEIPI).
Employer branding Exposure of students to BPOs as a viable career (going beyond call centers), via internships and specific BPO-focused courses
Short-term - training courses on specific skills, addressed to near-hires; ensure implementation of joint TESDA – BPA/P circular
Business-Academe partnerships; Internship programs, BPO-focused subjects in the tertiary curricula
Applicants’ Skills gap
Long-term – enhancing tertiary-level curricula, as well as elementary & secondary education; Service sector focused curricula, as initiated by the CICT and industry players. Promote CHED-Academe dialogue, facilitated by CICT (or, in the future, the DICT) ADEPT
Management Skills gap
Management development programs, jointly developed by BPA/P and the Academe
(2) Maintaining BPO-friendly environment at the level of localities BPO-LGU-NG dialogues/partnerships at the
local level, led by the ICT Councils (especially in the NCR); Promote LGU-NG-Academe partnerships, to include participation of LGU-run or LGU-supported universities.
Ensure strict implementation of RA No. 9492 (on celebration of national holidays) and Rationalize declaration of holidays at the local level.
(3) More aggressive promotion of the Philippines as a BPO location Continue aggressively promoting the Philippines as a BPO location, jointly by the BPA/P, CICT and DTI
Continued inclusion of BPOs in BOI / PEZA incentives
Passage of a Data Privacy Law

CRC Foundation Inc. - - The Global Recession and the Philippine Economy
117
5 The Philippine Electronics Industry in a Global Recession
Winston Conrad B. Padojinog
38
Over the years, the fortunes of the Philippine electronics industry have moved in tandem with prospects in the global electronics market. As a producer of primary inputs in a global supply chain, the Philippine electronics industry is sensitive to fluctuations in international demand. This means Philippine electronics exports will continue to grow as long as global electronics sales are sustained. This paper seeks to:
a. Analyze the structure of the Philippine electronics industry specifically its role in the production strategy of MNCs, the country’s share on global output and the share of electronics to total economic activity; and,
b. Determine the impact of the global recession on the electronics industry in particular and the Philippine economy in general.
Study Framework
� Role in the Production Strategy of MNCs
� Share on the Global Chain
� Export Structure of Phil. Electronics
The Philippine Electronics Industry in the Global Electronics Industry
Impact on the Philippine Economy: National and
Regional Economy
� Jobs� Exports� National Income� Technology & skills
transfer
Global Electronics Industry
The study will provide a brief discussion of the global electronics industry. It will then link the performance of the Philippine electronics industry to the global industry taking into account the share of the Philippines in the global production, structure and the trends in the share of the Philippine electronics industry to total country exports.
The study will then focus on the impact of the global recession on the industry in particular and the Philippine economy in general with specific focus on jobs, exports, national income and technology. The study will end by identifying competitiveness issues and recommending actionable measures on how to mitigate the adverse impact of the global crisis on the electronics industry. Most of the inputs for the latter part
38 Senior Economist, University of Asia and the Pacific

CRC Foundation Inc. - - The Global Recession and the Philippine Economy
118
especially the competitive issues facing the industry and actionable measures on how to address these and the impact of the global crisis will come from roundtable discussion with the players in the semiconductor industry.
5.1 Global Electronics Industry and the Philippines
The rapid growth in Philippine electronics manufacturing is a direct effect of
the decision of multinational electronics makers to move production activities to more cost-effective locations like the Philippines. Over the 10-year period between 1995 and 2005, the percentage of electronics inputs manufactured in low-cost locations has grown from 25% to 47% or nearly half of all inputs. The platform shift makes sense to manufacturers—drastically lowered costs help them sustain their competitiveness—as well as generate the jobs and export receipts for less developed economies.
Figure 5.1
The Percentage Share of Electronics Output Classified According to High Cost and Low Cost Countries
The Philippines is vulnerable to external shocks in the global electronics industry because of its growing share in the global output and the nature of its production activity. The Philippines is ranked seventh most cost-competitive location for electronics manufacturing, after China (first), South Korea (third), Malaysia (fourth) and Taiwan (sixth). With this, the prospects of the Philippine electronics industry are invariably linked with movements in the markets of the global electronics industry. Electronics production in the Philippines can be classified into two types of activities: (1) electronics manufacturing services (EMS), which make intermediate inputs to other downstream goods (about 26% of local manufacturing activity); and (2) semiconductor manufacturing services (SMS), which are primary inputs and therefore more vulnerable to shifts in global output. Semiconductor manufacturing makes up 74% of manufacturing activity in the sector.

CRC Foundation Inc. - - The Global Recession and the Philippine Economy
119
Figure 5.2
The Rank of the Philippines in Terms of Total Global Exports of Electronics
High-cost locations: US, Canada, Japan, Western Europe Low-cost locations: Asia/Pacific, China, Eastern Europe, ROW Source: World Economic Forum
In terms of industry structure, the local electronics industry accounts for almost 60% of total Philippine exports. Estimates indicate that without this sector, Philippine GDP would contract hypothetically by an estimated 38.6%.
Figure 5.3 Share of Exports of the Philippine Electronics Sector to Total Philippine Exports
3 0 3 5 4 0 4 5 5 0 5 5 6 0
%
6 5 7 0 7 5
1995 1996 1997 1998 1999 2000 2001 2002 2003 2004 2005 2006 2007 2008
Firms in the electronics industry are regionally dispersed, generating a significant number of jobs in the countryside. There are total of 926 firms in the industry employing an estimate 460,000 workers (2008). Only a small number of these firms are located in the National Capital Region (NCR); most are in regions III, IV and VII.

CRC Foundation Inc. - - The Global Recession and the Philippine Economy
120
Cebu12%
Batangas3%
NCR3%
Baguio1%
Region 33%
Cavite39%
Laguna39%
Figure 5.4
Regional Dispersal of Firms in the Electronics Industry
Source: PEZA sample of 345 companies
5.2 Impact of Global Electronics Slowdown
Simulations show that a 10% increase in global electronics output was followed by a corresponding 4.66% increase in Philippine electronics exports and a 2.6% increase in employment in the industry. It is logical to assume then that decreases in global output will result in corresponding dips in export output and employment. Hence, a 21% change in global output will lead to a 10% decline in Philippine exports. This will translate to job losses of at least 8,000 (see Table 4.1). Since, the local industry is projecting a 30% decline in exports this year (i.e, 2009), a total of at least 24,600 jobs are expected to be lost. A 2009 decline in export levels will for the first time bring Philippine exports of electronics to experience at least two consecutive years of contraction. More jobs are expected to be lost if the global outlook in 2010 will not improve.
Table 5.1
Estimated impact of the Assumed Annual Change in Global Electronics Output on Philippine Electronics Exports and Local Jobs
Assumed annual change in global
output (%)
Impact of change in global output on
Philippine electronics exports
(%)
Estimated job losses in the
Electronics Sector
2009 -21 -10 (8,291)
2010 -17 -8 (6,608)

CRC Foundation Inc. - - The Global Recession and the Philippine Economy
121
The slowdown will be keenly felt by domestic regional economies. With more electronics factories located in the countryside, the adverse economic effects of the slowdown in electronics exports will be felt more keenly outside NCR. About 90% of the industry’s workforce are women, so they will bear the brunt of job displacement caused by the crisis. No doubt the economic effects of the slowdown in electronics exports will be felt in other sectors as well. The electronics exports slowdown will have a direct impact on jobs, household incomes, national output and even on taxes. Table 4.2 shows estimates of the impact of this slowdown. Assuming that the exports of the electronics industry contracts 10% and 8% in 2009 and 2010, respectively, there will be substantial reductions in household incomes, taxes and trimming of current GDP levels and thus GDP growth.
Table 5.2
Impact of Electronics Exports Slowdown On Other Sectors
Change in exports
($ billion)
Change in exports
(P billion)
Change in household incomes
(P billion)
Change in taxes (P billion)
Impact on GDP
(P billion)
Expected contributio
n to reduction
in 2009/2010 GDP (%) (current prices)
2009 (2.90) (136.30) (42.25) (19.08) (398.00) -5
2010 (2.08) (97.77) (30.31) (13.69) (285.49) -4
USD1.0 = PHP47.00 GDP 2008 current prices = P7,498B
A weaker electronics industry also means drastically reduced opportunities for knowledge and skills development. The industry is estimated to provide 13 million hours of training per year or an average of 40 hours per employee. Training modules are usually diverse, ranging from process, product and equipment engineering knowledge and skills upgrading to IT-training and interpersonal skills development. Spending on training can range from P60,000–100,000. Others firms also provide scholarships, research support and in-house degree granting programs to their employees.

CRC Foundation Inc. - - The Global Recession and the Philippine Economy
122
Impact of the Crisis on Output and Employment of Electronics Industry
Current Situation Impact of the Crisis Possible Interventions
Output
• In terms of industry structure, the local electronics industry accounts for almost 60% of total Philippine exports. Estimates indicate that without this sector, Philippine GDP would contract hypothetically by an estimated 38.6%.
• A 21% change in global output will lead to a 10% decline in Philippine exports.
• Assuming that the exports of the electronics industry contracts 10% and 8% in 2009 and 2010, respectively, there will be substantial reductions in household incomes, taxes and trimming of current GDP levels and thus GDP growth.
• Ensure credit availability to electronics firms operating and expanding in the Philippines. The industry proposes that government can allocate part of its stimulus package by extending a credit guarantee to existing electronics and semiconductor firms expanding and/or investing in the Philippines.
• Move up the value chain of the electronics industry. The Philippines cannot remain in the same level of skills and capabilities. It must move up the value chain. Some of the concrete steps include (a) establishing R&D and incubation centers funded and/or supported by the government, the industry and the academic institutions; (b) eliminate donors taxes and accelerate processing of documents for equipment donated by the industry to the academe; (c) promote the development of the upstream component of the electronics industry (i.e., wafer fabs) in order to preserve testing and assembly operations in the Philippines and (d) promote a stronger partnership between the academe, the industry and other stakeholders to meet the manpower and other needs of the electronics and semiconductor industry to remain competitive.
• Encourage consolidation of global operations in the Philippines. The global crisis has forced companies to consolidate their global operations into a select few of geographical locations where their competitiveness are sustained or enhanced. Thus government must conduct investment promotion activities directed at parent

CRC Foundation Inc. - - The Global Recession and the Philippine Economy
123
Impact of the Crisis on Output and Employment of Electronics Industry
Current Situation Impact of the Crisis Possible Interventions companies that have manufacturing operations in the Philippines and to harmonize investment-related incentives of LGUs, Ecozones and SEZ’s.
Employment
• Firms in the electronics industry are regionally dispersed, generating a significant number of jobs in the countryside. There are total of 926 firms in the industry employing an estimate 460,000 workers (2008). Only a small number of these firms are located in the National Capital Region (NCR); most are in regions III, IV and VII.
• A 10% decline in Philippine exports, as a result of decline in global output, will translate to job losses of at least 8,000.
• A weaker electronics industry also means drastically reduced opportunities for knowledge and skills development. The industry is estimated to provide 13 million hours of training per year or an average of 40 hours per employee. Training modules are usually diverse, ranging from process, product and equipment engineering knowledge and skills upgrading to IT-training and interpersonal skills development. Spending on training can range from P60,000–100,000. Others firms also provide scholarships, research support and in-house degree granting programs to their employees.
• Improve efficiency of business operations to sustain cost competitiveness. To improve the industry’s state of competitiveness, the industry must in coordination with government provide continuous training of production managers to improve manufacturing knowledge and skills; improve the quality and reliability of power supply and reduce the cost of doing business in the country.

CRC Foundation Inc. - - The Global Recession and the Philippine Economy
124
5.3 Competitiveness Issues
The global crisis has also magnified the competitive issues of the industry. The following are issues confronting the electronics industry: Low value-added manufacturing operations. The concentration of the activities of the Philippine electronics industry is on assembly, testing, cleaning and packaging. R&D and design capabilities of the industry are very limited. Most of these activities are now being moved either to areas where labor is inexpensive (e.g., Vietnam) or to countries with wafer fab operations. In fact, according to industry players, countries that have wafer fabs tend to attract already testing and assembly operations, which before locate in a different geographical location. Credit is tight for the sector. Local financial institutions are believed to have tightened credit to the industry due to the global crisis. Unlike in other countries, there are limited government-guarantees to loans extended to vulnerable sectors like electronics in the Philippines. Limited pool of managerial knowledge and skills in production. The industry still considers the senior managerial skills and knowledge of Filipino production managers as limited. There is a lack of culture on productivity enhancement and practices among the ranks and managers in the production line. Lack of incubation centers. The Philippines do have any incubation center to test and model their projects. The link between the academe and the industry remains weak. Some companies even complain about the bureaucracy involved if they decide to donate their equipment to educational institutions. Lack of Policy Consistency at the Local Level. SEZs, Ecozones and even LGUs tend to undercut each other in order to attract or retain investments or locators in their locality. This leads to inconsistency in the application or implementation and even unpredictability of policies.
5.4 Actionable Measures to Mitigate the Impact of the Global Crisis Ensure credit availability to electronics firms operating and expanding in the Philippines. The industry proposes that government can allocate part of its stimulus package by extending a credit guarantee to existing electronics and semiconductor firms expanding and/or investing in the Philippines. Move up the value chain of the electronics industry. The Philippines cannot remain in the same level of skills and capabilities. It must move up the value chain. Some of the concrete steps include (a) establishing R&D and incubation centers funded and/or supported by the government, the industry and the academic institutions; (b) eliminate donors taxes and accelerate processing of documents for equipment donated by the industry to the academe; (c) promote the development of the upstream component of the electronics industry (i.e., wafer fabs) in order to preserve testing and assembly operations in the Philippines and (d) promote a stronger partnership between the
CRC Foundation Inc. - - The Global Recession and the Philippine Economy
125
academe, the industry and other stakeholders to meet the manpower and other needs of the electronics and semiconductor industry to remain competitive Improve efficiency of business operations to sustain cost competitiveness. To improve the industry’s state of competitiveness, the industry must in coordination with government provide continuous training of production managers to improve manufacturing knowledge and skills; improve the quality and reliability of power supply and reduce the cost of doing business in the country Encourage consolidation of global operations in the Philippines. The global crisis has forced companies to consolidate their global operations into a select few of geographical locations where their competitiveness are sustained or enhanced. Thus government must conduct investment promotion activities directed at parent companies that have manufacturing operations in the Philippines and to harmonize investment-related incentives of LGUs, Ecozones and SEZ’s.
References
Santiago, E. “SEIPI Today” (2008). Presentation Slides of the SEIPI. RCBC, Makati City. Center for Research and Communication (2006). “Economic Impact of the Electronics Industry on the Philippine National and Local Economies. Presentation Slides. Ortigas Center, Pasig City.
Industry Workshops and Consultations Interview of Ernie Santiago, Executive Director, SEIPI at the SEIPI Office, RCBC Tower, Makati City, 19 February 2009. Roundtable discussion during the SEIPI Board Meeting held at RCBC Tower, Makati City, 13 March 2009.

CRC Foundation Inc. - - The Global Recession and the Philippine Economy
126
Year GDP
(PhP bn)
Employment
(‘000)
Direct
2005 190.6 1,185.9
2006 245.3 1,357.2
2007 269.7 1,385.0
2008f 285.2 1,377.1
T & T Economy
2005 190.6 1,185.9
2006 245.3 1,357.2
2007 269.7 1,385.0
2008f 285.2 1,377.1
% Share (Direct)
2005 3.5 3.7
2006 4.1 4.1
2007 4.1 4.1
2008f 3.9 4.0
% Share (Direct and Indirect)
2005 8.2 9.9
2006 9.1 10.6
2007 9.1 10.6
2008f 8.8 10.3
6 The Global Crisis and Philippine Tourism
Maria Cherry Lyn S. Rodolfo
39
Given the natural, cultural and human resource endowments of the country, tourism has been identified as a sunrise and globally competitive industry by the national government. An agglomeration of service-oriented activities, tourism is a major contributor to economic growth and development. Tourism is one of the largest employers in the Philippines, offering a wide array of jobs to the unskilled, semi-skilled and highly skilled workforce. In 2008, the World Travel and Tourism Council (WTTC) estimated that tourism in the Philippines contributed 8.8 percent to the GDP and 10.3 percent to national employment (see Table 5.1).
Table 6.1 Economic Impact of Philippine Tourism
Source: The 2009 Travel and Tourism Economic Research Report on the Tourism Satellite Accounts of the Philippines. WTTC, London. Reality Check: Crisis Slows Down Global Travel
Tourism’s power to reduce poverty is threatened by the global financial crisis. On the other hand, the correct policy responses to mitigate the negative effects of the crisis are deemed to make tourism play a key role in global recovery.
39 Economist, University of Asia and the Pacific and Director, CRC Tourism Institute. The author would like to acknowledge the assistance of Ms. Louie Anne Bercasio in the preparation of this report.

CRC Foundation Inc. - - The Global Recession and the Philippine Economy
127
In 2008, global tourism’s growth slowed down to 1.8 percent, from 6.9 percent in 2007 (see Figure 5.1). In February 2009, the World Tourism Organization (WTO) projected that growth will range from -2 percent to 0 percent by the end of the year.40 In May, the WTO reported that the results for the first two months of 2009 demonstrated the lingering effects of the crisis when world tourism volume dipped by 8 percent from its year-ago level. It expected global tourism to decline by 2 percent to 3 percent in 2009.41 Recovery is projected to require a longer period due to the threat of the Influenza A(H1N1) virus scare that started in April of this year.
Figure 6.1
Growth in Global Tourist Arrivals
But Tourism is Still Key in Global Recovery
The WTO affirmed its message that tourism is a key driver in economic recovery during the 5th UNWTO International Conference on Tourism Statistics (Bali, Indonesia, 30 March-2 April).42 To date, as reported by the WTO Crisis Committee, a number of countries have already developed and continue to develop stimulus measures to mitigate the negative impact of the crisis on tourism. Recognizing the role of tourism as key driver in global economic recovery, many countries are already developing stimulus measures and some destinations are reducing taxes and improving travel facilitation, recognizing that it is now crucial to remove all obstacles to tourism, especially taxation and over regulation. 43 This report aims to address the following questions:
40Tourism confronting the Economic Downturn Madrid, Spain, 5 March 2009 http://www.unwto.org/media/news/en/press_det.php?id=3781 41 “Tourism: An Engine for Employment Creation and Economic Stimulus,” Bali, Indonesia, 3 April 2009 http://www.unwto.org/media/news/en/press_det.php?id=3891 42 “World Tourism in the Face of the Global Economic Crisis,” Madrid, Spain, 12 May 2009 http://www.unwto.org/media/news/en/press_det.php?id=4181&idioma=E 43 Ibid

CRC Foundation Inc. - - The Global Recession and the Philippine Economy
128
Tourism Targets: Visitor Arrivals
2.3
2.963.4
3.884.42
5
2.55
0
1
2
3
4
5
6
2004 2005 2006 2007 2008 2009 2010
Source: DOT
Arr
ials
in
mill
ion
s
0
5
10
15
20
25
Gro
wth
Ra
te
Volume
Grow th Rate
(1) How has the crisis affected Philippine tourism? (2) Is the industry vulnerable to the crisis due to the contraction in demand? (3) Is it in a better state to absorb the impact of the global economic crunch? (4) How are the government and private sector responding to mitigate the
negative effects of the crisis in the short-term and in the long-term? (5) How can competitiveness be enhanced and sustained?
6.1 Impact of the Crisis on Philippine Tourism
Is the industry vulnerable to the crisis due to the contraction in demand? The
answer depends on how the Philippine tourism industry is linked to the US and other major economies that are significantly exposed – directly and indirectly – to the global crisis and the trends in the factors that significantly influence the demand for tourism to the Philippines.
Is it in a better state to absorb the impact of the global economic crunch? To answer this question, it is important to examine the impact of the crisis on the tourism suppliers.
6.1.1 Impact on Market Demand
Prior to the current global crisis, the DOT aimed to attract 5 million visitors by
the year 2010, an average of 14 percent growth from 2007 to 2010 (see Figure 5.2). These visitors are projected to contribute a total of US$ 4.5 billion by 2010 (see Figure 5.3).
Figure 6.2 Tourism Targets: Visitor Arrivals
Figure 6.3

CRC Foundation Inc. - - The Global Recession and the Philippine Economy
129
Tourism Targets: Foreign Exchange Revenues
Tourism Targets: Receipts
0
0.5
1
1.5
2
2.5
3
3.5
4
4.5
5
2005 2006 2007 2008 2009 2010
Source: DOT
Receip
ts in
US
$ B
illio
ns
0
2
4
6
8
10
12
14
16
18
Gro
wth
Rate
(%
)
Receipts
Grow th Rate
In 2007, the country recorded a total of 3 million arrivals, slightly below the target of 3.4 million as shown in Figure 2. Nevertheless, in terms of receipts, the DOT surpassed its 2010 target of $4.5 B in 2007, 3 years ahead of the projected timeline. During that year, the Bangko Sentral ng Pilipinas (BSP) reported that exports of travel and tourism amounted to $4.9 B. Travel and tourism ranked as the fourth largest source of foreign exchange revenues (the top three are electronics exports –$28.5 B, overseas workers remittances - $16B, and business process outsourcing - $6B) for the country in 2008. Its receipts of US$4.4 B accounted for 43 percent of total service exports. Channels of Impact on the Markets
The determinants that affect the tourists’ decision to travel and consume tourism include: socioeconomic factors (income, relative prices between origin and destination countries, population, length of stay), technical factors (ease of communication and travel), psychological and cultural factors (preferences and way of life of tourists) and random factors related to unexpected events (political instability and natural calamities). Income The most direct impact of the crisis is on the income or purchasing power of the origin markets. The lower incomes diminish the capacity for international travel to the Philippines. Local residents may also tend to substitute domestic tourism over outbound travel as a result of the crisis, if local tour packages prove to be significantly cheaper than other overseas tours. However, it is also possible for local residents to reduce their domestic leisure consumption in favour of more necessity goods and services or savings in anticipation of prolonged crisis. Relative Prices Assuming all else constant, the higher the price of the Philippine’s tourism products and service, the lower is the demand for tourism – foreign and domestic. There are various proxies for price. They include the real effective exchange rate index, price of oil per barrel, and distance as proxy for transportation cost.
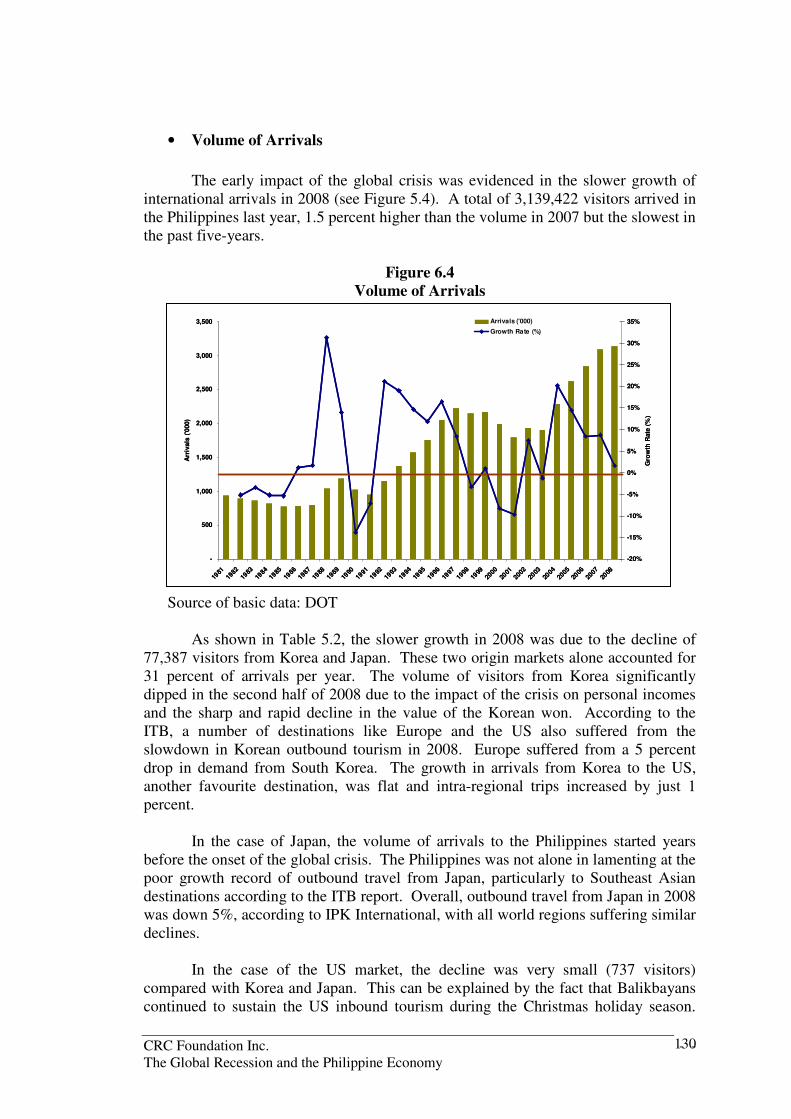
CRC Foundation Inc. - - The Global Recession and the Philippine Economy
130
• Volume of Arrivals
The early impact of the global crisis was evidenced in the slower growth of
international arrivals in 2008 (see Figure 5.4). A total of 3,139,422 visitors arrived in the Philippines last year, 1.5 percent higher than the volume in 2007 but the slowest in the past five-years.
Figure 6.4 Volume of Arrivals
Source of basic data: DOT
As shown in Table 5.2, the slower growth in 2008 was due to the decline of
77,387 visitors from Korea and Japan. These two origin markets alone accounted for 31 percent of arrivals per year. The volume of visitors from Korea significantly dipped in the second half of 2008 due to the impact of the crisis on personal incomes and the sharp and rapid decline in the value of the Korean won. According to the ITB, a number of destinations like Europe and the US also suffered from the slowdown in Korean outbound tourism in 2008. Europe suffered from a 5 percent drop in demand from South Korea. The growth in arrivals from Korea to the US, another favourite destination, was flat and intra-regional trips increased by just 1 percent.
In the case of Japan, the volume of arrivals to the Philippines started years before the onset of the global crisis. The Philippines was not alone in lamenting at the poor growth record of outbound travel from Japan, particularly to Southeast Asian destinations according to the ITB report. Overall, outbound travel from Japan in 2008 was down 5%, according to IPK International, with all world regions suffering similar declines.
In the case of the US market, the decline was very small (737 visitors) compared with Korea and Japan. This can be explained by the fact that Balikbayans continued to sustain the US inbound tourism during the Christmas holiday season.
-
500
1,000
1,500
2,000
2,500
3,000
3,500
1981
1982
1983
1984
1985
1986
1987
1988
1989
1990
1991
1992
1993
1994
1995
1996
1997
1998
1999
2000
2001
2002
2003
2004
2005
2006
2007
2008
Arr
ivals
('0
00)
-20%
-15%
-10%
-5%
0%
5%
10%
15%
20%
25%
30%
35%
Gro
wth
Rate
(%
)
Arrivals ('000)
Growth Rate (%)
-
500
1,000
1,500
2,000
2,500
3,000
3,500
1981
1982
1983
1984
1985
1986
1987
1988
1989
1990
1991
1992
1993
1994
1995
1996
1997
1998
1999
2000
2001
2002
2003
2004
2005
2006
2007
2008
Arr
ivals
('0
00)
-20%
-15%
-10%
-5%
0%
5%
10%
15%
20%
25%
30%
35%
Gro
wth
Rate
(%
)
Arrivals ('000)
Growth Rate (%)

CRC Foundation Inc. - - The Global Recession and the Philippine Economy
131
Among the Asian destinations, both the Philippines and Vietnam suffered the least from the slowdown, largely because of a relatively significant VFR markets. In contrast, both Thailand and Singapore, top destinations of US outbound travel in Southeast Asia, suffered from 10 percent and 8 percent reduction in US visitors, respectively.
Table 6.2 Performance of the Top 12 Source Markets
Country Arrivals GDP Growth 2008 percent
Share to Total
Growth (in
percent)
2008 2009f 2010f 2011f
Korea 611,629 19.48 -6.38 4.3 -2.8 0.1 4.4
USA 578,246 18.42 -0.13 1.4 -2.0 0.6 1.5
Japan 359,306 11.44 -9.04 0.7 -3.8 -0.1 1.0
China 163,689 5.21 3.86 9.8 6.0 7.2 8.2
Australia 121,514 3.87 8.05 2.1 -1.2 0.5 1.2
Taiwan 118,782 3.78 5.86 1.7 -3.5 1.1 4.3
Hong Kong
116,653 3.72 4.20 2.8 -4.7 0.2 3.1
Canada 102,381 3.26 12.13 0.5 -2.2 0.7 1.9
Singapore 100,177 3.19 6.56 3.0 -7.2 1.8 2.9
United Kingdom
87,422 2.78 9.73 0.7 -3.8 -1.1 0.7
Malaysia 69,676 2.22 6.06 5.5 -0.3 2.8 5.1
Germany 55,303 1.76 -1.06 1.3 -5.3 -0.8 1.3
Sources: Philippine’s Department of Tourism; Euromonitor International; Economist Intelligence Unit
The 5.2 percent decline in the top 3 markets was compensated by the growth in the rest of the Top 12 markets and the double digit growth of emerging markets such as Russia, Emirates, Vietnam, France, Norway, India, and Spain. These markets are also high yield markets, with higher average daily expenditures and average length of stay.

CRC Foundation Inc. - - The Global Recession and the Philippine Economy
132
Table 6.3 Fast Growing Markets in 2008
Rank Country Jan-Dec Growth
2008 Rate
1 Russian Federation 10,959 34.25%
2 United Arab Emirates 10,931 28.75%
3 Vietnam 13,675 28.09%
4 France 22,891 18.77%
5 Norway 14,963 15.77%
6 India 31,135 13.88%
7 Canada 102,381 12.13%
8 Spain 12,946 10.97%
9 United Kingdom 87,422 9.73%
10 Indonesia 27,830 8.99%
11 Australia 121,514 8.05%
12 Saudi Arabia 17,515 7.07%
13 Singapore 100,177 6.56%
14 Taiwan 118,782 5.86%
Source: DOT Compared with our Asian neighbours in 2008, the Philippines performed better than Vietnam, Thailand and Singapore. Others like Malaysia and Indonesia had relatively more impressive records in 2008 due to higher shares of intra-ASEAN visitors.
Table 6.4 International Tourism in ASEAN in 2008
2008 2007 Growth
Malaysia 22,052 20,973 5.14%
Vietnam 4,172 4,254 -1.93%
Indonesia 6,230 5,506 13.15%
Thailand 14,536 14,464 0.50%
Philippines 3,139 3,091 1.55%
Singapore 10,116 10,284 -1.63%
Source: Various Tourism Authorities
The leisure market, accounting for one third of arrivals, was the hardest hit by the crisis due to its sensitivity to income changes. As regards the MICE market, according to the Philippine Convention and Visitors’ Bureau (PCVC), contraction in corporate events and product launches has been noted as local and foreign companies implement cost-cutting measures. Some association conferences and trade exhibitions are being postponed. As MICE foreign arrivals constitute only 1.16% of total foreign visitor arrivals to the country, any decrease will have minimal impact on overall visitor traffic. To date, the domestic market, especially association events continue to

CRC Foundation Inc. - - The Global Recession and the Philippine Economy
133
0
1
2
3
4
5
6
80 81 82 83 84 85 86 87 88 89 90 91 92 93 94 95 96 97 98 99 00 01 02 03 04 05 06 07 08
Re
ce
ipts
in
US
$B
-40
-20
0
20
40
60
80
100
Gro
wth
Ra
te i
n %
0
1
2
3
4
5
6
80 81 82 83 84 85 86 87 88 89 90 91 92 93 94 95 96 97 98 99 00 01 02 03 04 05 06 07 08
Re
ce
ipts
in
US
$B
-40
-20
0
20
40
60
80
100
Gro
wth
Ra
te i
n %
provide good source of business for this industry.44 The role of the domestic market in the survival of the convention industry amidst the crisis was also noted by the private sector. From the private sector’s perspective, the crisis has provided opportunity for the Philippine convention industry to catch up with the rest of Asia where MICE events are at least three times more than the volume in the Philippines. There are programs to expand the capacity for conventions by the industry. The SM group, for example, is pursuing to build mini SMX Convention Centers given the opportunities to develop secondary destinations.45
• Tourism Receipts
For the whole year of 2008, receipts dipped to $4.4 B in 2008, 11.1 percent
lower than the earnings in 2007 (see Figure 5.5). It was during the 4th quarter of 2008 when tourism export revenues significantly declined by 22.7 percent, from U$1,355 M to $ 1,047 M. In peso terms, however, the receipts contracted by only 7.01 percent but their direct and indirect impact was estimated at PhP 35 B for the whole economy.
Figure 6.5 Tourism Receipts
Sources of basic data: DOT and BSP
The DOT has stopped releasing the data on monthly volume of arrivals in order to mitigate the impact of pessimistic perceptions about the industry’s performance.46 The preliminary BSP data on export receipts from travel and tourism serve as an indicator of international tourism demand. The 1st quarter results revealed that revenue flows declined from $1,155 M to $744 M (35.6 percent). In peso terms, the decline was only 8.43 percent. The receipts are estimated to fall by 12 percent but this is only a preliminary estimate. The final results will also depend on the
44 Response of Director Danilo Corpuz, Executive Director of the Philippine Convention and Visitors Bureau, 30 March 2009. 45 Interview with Mr. Dexter Deyto, Executive Director of PACEOS. 46 Commentary by Undersecretary Eduardo Jarque, Office of Tourism Promotions. Delivered by Director Rolando Canizal, Office of Tourism Development Planning, during the Forum on Global Crisis and the Philippine Economy, April 23, 2009 at the Dusit Hotel, Makati City.

CRC Foundation Inc. - - The Global Recession and the Philippine Economy
134
effects of the A(H1N1) on the volume of arrivals in May and June. The reversal of trends by the 3rd and 4th quarter through higher expenditures or longer length of stay or more arrivals or better, a combination of all factors will be very crucial for the survival of firms significantly exposed to international tourism.
• Outlook for 2009
The industry is vulnerable to the contraction in global demand for
international tourism due to the strong linkages of the Philippines with the US, Korea and Japan. As revealed in Table 2, the economic recovery of the Top source markets of Philippine tourism is expected to happen in 2010. The DOT projected that growth in arrivals will only range between 0 - 0.5 percent in 2009 under a medium growth scenario.47 These forecasts do not necessarily represent the targets of the DOT. As commented by Mr. Samie Lim, the DOT should set a target higher than the predictions of the model. As representative from the private sector, he believed that the DOT and the private sector can jointly aim to reverse the slowdown in arrivals by coming up with more innovative packages (such as those offered by Singapore) beyond the traditional Balikbayan promotions. 48
• Some Trends in Outbound Travel US Travel Trends
49 The overall U.S. outbound market totaled 63.6 million in 2008, down by one percent compared to 2007. During the 1st quarter of 2009, outbound travel reached 8.3 million, 8.9 percent lower than its year-ago level. US travel to the Asian region was lower by 13.2 percent. Northeast Asia
China is the more promising origin market in Northeast Asia for the
Philippines and the rest of Asia according to the ITB Berlin report. Chinese tourists have been listed in the World's top five holiday consumer groups and they have become a significant force in overseas shopping and created a great consumption value. Although the International Monetary Fund expects the GDP growth to be 6.5 per cent in 2009 and 7.5 per cent in 2010, declines in bookings from China to various destinations in Asia Pacific have been noted due to the H1N1 Influenza than the global crisis. Non-essential travel has been discouraged or banned.
47 Commentary by Undersecretary Eduardo Jarque, Office of Tourism Promotions. Delivered by Director Rolando Canizal, Office of Tourism Development Planning, during the Forum on Global Crisis and the Philippine Economy, April 23, 2009 at the Dusit Hotel, Makati City. 48 Commentary by Mr. Samie Lim, Chairman of the Tourism Committee of the Philippine Chamber of Commerce and Industry and private sector representative during the Forum on Global Crisis and the Philippine Economy, April 23, 2009 at the Dusit Hotel, Makati City. 49 Based on data from the US Office of Travel and Tourism Industries http://www.tinet.ita.doc.gov/view/m-2009-O-001/index.html

CRC Foundation Inc. - - The Global Recession and the Philippine Economy
135
• Trends in Travel Costs
• Oil Prices
Higher oil prices lead to higher travel costs, lower mobility of travellers, and
lower profitability of travel and tourism businesses (via its impact on demand and cost structure). Since August 2008, oil prices (monthly averages and indices) exhibited a downward trend. However, they started to rise again in January 2009. The price inched up to $58 per barrel last month, its level sometime in September 2008. Although there are no immediate indications that prices will shoot up to the high levels reached in 2008, it is very important for tourism enterprises to monitor its movements given its impact on industry bottomline.
Figure 6.6 Monthly Petroleum Price Index
0
50
100
150
200
250
300
Jun-0
4
Aug-0
4
Oct
-04
Dec
-04
Feb-0
5
Apr-
05
Jun-0
5
Aug-0
5
Oct
-05
Dec-
05
Feb-0
6
Apr-
06
Jun-0
6
Aug-0
6
Oct
-06
Dec
-06
Feb-0
7
Apr-
07
Jun-0
7
Aug-0
7
Oct
-07
Dec
-07
Feb-0
8
Apr-
08
Jun-0
8
Aug-0
8
Oct
-08
Dec-
08
Feb-0
9
Apr-
09
Ind
ex
• Relative Prices
The rapid decline in the value of their currencies against the US dollar, notably during the second half of 2008, increased the cost of overseas travel for major revenue origin markets such as the Japan, Korea, Russia and Australia. The Philippines was one of those negatively affected by the lower mobility of these markets last year. In tourism, it is important to maintain a competitive level for the exchange rate to encourage tourist flows. The real effective exchange rate index can serve as proxy indicator for the relative prices of tourism products and service.
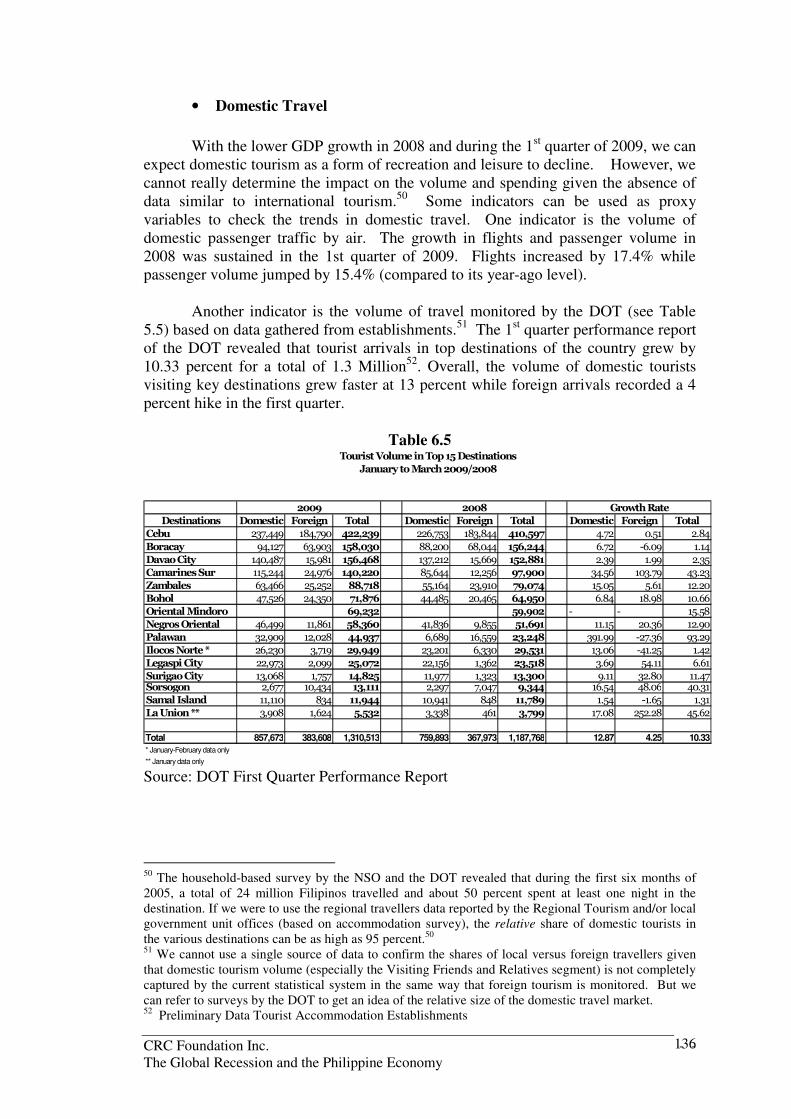
CRC Foundation Inc. - - The Global Recession and the Philippine Economy
136
• Domestic Travel
With the lower GDP growth in 2008 and during the 1st quarter of 2009, we can
expect domestic tourism as a form of recreation and leisure to decline. However, we cannot really determine the impact on the volume and spending given the absence of data similar to international tourism.50 Some indicators can be used as proxy variables to check the trends in domestic travel. One indicator is the volume of domestic passenger traffic by air. The growth in flights and passenger volume in 2008 was sustained in the 1st quarter of 2009. Flights increased by 17.4% while passenger volume jumped by 15.4% (compared to its year-ago level).
Another indicator is the volume of travel monitored by the DOT (see Table 5.5) based on data gathered from establishments.51 The 1st quarter performance report of the DOT revealed that tourist arrivals in top destinations of the country grew by 10.33 percent for a total of 1.3 Million52. Overall, the volume of domestic tourists visiting key destinations grew faster at 13 percent while foreign arrivals recorded a 4 percent hike in the first quarter.
Table 6.5
Destinations Domestic Foreign Total Domestic Foreign Total Domestic Foreign Total
Cebu 237,449 184,790 422,239 226,753 183,844 410,597 4.72 0.51 2.84
Boracay 94,127 63,903 158,030 88,200 68,044 156,244 6.72 -6.09 1.14
Davao City 140,487 15,981 156,468 137,212 15,669 152,881 2.39 1.99 2.35
Camarines Sur 115,244 24,976 140,220 85,644 12,256 97,900 34.56 103.79 43.23
Zambales 63,466 25,252 88,718 55,164 23,910 79,074 15.05 5.61 12.20
Bohol 47,526 24,350 71,876 44,485 20,465 64,950 6.84 18.98 10.66
Oriental Mindoro 69,232 59,902 - - 15.58
Negros Oriental 46,499 11,861 58,360 41,836 9,855 51,691 11.15 20.36 12.90
Palawan 32,909 12,028 44,937 6,689 16,559 23,248 391.99 -27.36 93.29
Ilocos Norte * 26,230 3,719 29,949 23,201 6,330 29,531 13.06 -41.25 1.42
Legaspi City 22,973 2,099 25,072 22,156 1,362 23,518 3.69 54.11 6.61
Surigao City 13,068 1,757 14,825 11,977 1,323 13,300 9.11 32.80 11.47Sorsogon 2,677 10,434 13,111 2,297 7,047 9,344 16.54 48.06 40.31
Samal Island 11,110 834 11,944 10,941 848 11,789 1.54 -1.65 1.31
La Union ** 3,908 1,624 5,532 3,338 461 3,799 17.08 252.28 45.62
Total 857,673 383,608 1,310,513 759,893 367,973 1,187,768 12.87 4.25 10.33
* January-February data only
** January data only
Tourist Volume in Top 15 Destinations
January to March 2009/2008
2009 2008 Growth Rate
Source: DOT First Quarter Performance Report
50 The household-based survey by the NSO and the DOT revealed that during the first six months of 2005, a total of 24 million Filipinos travelled and about 50 percent spent at least one night in the destination. If we were to use the regional travellers data reported by the Regional Tourism and/or local government unit offices (based on accommodation survey), the relative share of domestic tourists in the various destinations can be as high as 95 percent.50 51 We cannot use a single source of data to confirm the shares of local versus foreign travellers given that domestic tourism volume (especially the Visiting Friends and Relatives segment) is not completely captured by the current statistical system in the same way that foreign tourism is monitored. But we can refer to surveys by the DOT to get an idea of the relative size of the domestic travel market. 52 Preliminary Data Tourist Accommodation Establishments

CRC Foundation Inc. - - The Global Recession and the Philippine Economy
137
6.1.2 Impact on Suppliers
� Air Transport
• Lower International Traffic Volume and Yields
Among the providers, the most vulnerable to the global tourism slowdown is the international airline sector which carries 98 percent of international arrivals to the Philippines. About half of international inbound passengers are tourists and the rest are returning Philippine residents (e.g. tourists and Overseas Filipino Workers).
The vulnerabilities have been evident in the reduction of flights (with the
exemption of Middle East carriers), decline in passenger volumes and most importantly in yields (about 35 to 50 percent). During the 1st quarter of 2009, international flights in the NAIA increased by 8.4 percent but passenger volumes declined by 4.0 percent. Terminal 1 alone, where foreign airline operations are concentrated, already suffered from a reduction of 20.9 percent in flights and 17.4 percent in passenger volume. The Mactan-Cebu International Airport (MCIA), the main port of entry for tourists to the Central Philippines Super Region, also registered a decline of 5 percent in flights and 9 percent in passenger volume during the same quarter. However, the operations of the low cost carriers in the Diosdado Macapagal International Airport (DMIA) in Clark defied the trends given the rise in international flights and passenger volumes by 35.5 percent and 16.2 percent, respectively, during the same quarter. Nevertheless, the low cost operators also suffered from lower yields and profits. For 2009, international passenger traffic for the Philippines is expected to fall by 7 to 12 percent (preliminary estimate).
The severity of the impact of the crisis on the foreign airlines that carry half of the international traffic volume to and from the Philippines was highly evident during the 1st quarter of 2009 based on their gross receipts53 from the sale of international passenger tickets. In 2008, they were still able to generate US$565 M, 44.1 percent more than their earnings in 2007. But their 1st quarter gross receipts fell by 8.7 percent, indicating that the 41.1 percent growth last year will not be sustained, given AH1N1 outbreak in the Philippines and the upward trend in fuel prices.
• Slower Growth in Gross Value-Added
The effects of the crisis on the local airlines are evident on the slower growth of the gross value-added (GVA) in 2008 and in the 1st quarter of 2009. In 2008, the GVA of air transport rose only by 5.9 percent in real terms. In 2007, the industry’s output expanded by 14.4 percent, faster than the 7.2 percent growth in the GDP. On a quarterly basis, the industry posted a poor record during the 3rd quarter, when GVA increased by only 2.3 percent. The 1st quarter growth of 3.5 percent paled in comparison with the high growth rates during the same quarter in the previous years. The projected real GVA growth for 2009 is only 1.4 percent.
53 Note, however, that refunds will still be deducted from these receipts.

CRC Foundation Inc. - - The Global Recession and the Philippine Economy
138
Figure 6.7
Growth in GDP and GVA of Air Transportation
0
2
4
6
8
10
12
14
16
18
20
Q1 Q2 Q3 Q4 Q1 Q2 Q3 Q4 Q1 Q2 Q3 Q4 Q1
05-06 06-07 07-08 08-09
Perc
en
t
GDP
Air Transport
Source of basic data: NSCB
As mentioned in the previous section, local traffic volume by Philippine carriers rose in 2008 and continued to do so during the first quarter of the year. However, yields were still relatively low. Profit-squeezing is evidenced in slower growth in export revenues of carriers with international operations. Their dollar revenues last year were 2.6 percent higher than in 2007 but significantly lower than the growth record of 13.3 percent in 2007. It was during the 4th quarter of 2008 when gross earnings from the sale of international tickets plunged by 24 percent (from US$154 M to $ 117 M). The 1st quarter 2009 record showed gross receipts to be higher by 2.9 percent from its year-ago level.
The gross value added figure also reflects the performance of the cargo operations of local carriers. As a result of the global trade slowdown, PAL was one of the worst affected in terms of declines in freight ton kilometres based on the records of the Association of Asia Pacific Airlines (AAPA). PAL’s FTK declined by 52.6 percent during the 1st quarter of 2009. The performance of PAL clearly reflected the general trend in the industry in the Asia Pacific region. Data from the AAPA revealed that for the 1st quarter of the year, international passenger numbers were 10.8 percent lower than the same period last year when traffic was still buoyant. Apart from the decline in capacity, passenger load factors declined to below 75 percent levels and year-to-date international passenger traffic in revenue passenger kilometre terms slipped by 12 percent.

CRC Foundation Inc. - - The Global Recession and the Philippine Economy
139
• Forecast for 2009
In March 2009, the International Air Transport Association (IATA) revised
(downward) its forecasts for passenger and cargo services and airline revenues for the global airline industry. Cargo traffic is expected to fall 13 percent, passenger traffic by 5.7 percent and airline revenues to decline by 12 percent or $63 billion for the year 2009. Based on preliminary estimates, gross foreign exchange receipts of Philippine-based foreign and local airlines from the sale of passenger tickets are expected to decline by 18 percent and 12 percent, respectively, for 2009.
� Tours and Travel Agencies
Those handling inbound tourists, especially from Korea, Japan, and China have experienced sharp reductions, as high as 35 to 50 percent, in their bookings. Airlines have reduced their commission rates for these agencies, particularly in the business and first class seats. The industry is very competitive and switching costs are lower, forcing agencies to reduce their mark ups on economy class seats and to consider adopting new business models (e.g. integrators/syndicators for niche markets such as medical tourism, long stay tourism, educational tourism) to generate higher value-added.54
� Accommodation
Growth in international tourism is positively related with the performance of the accommodation industry. Foreign tourism is also a major driver of demand for rooms and is highly associated with the Korean and the Japanese markets.55 Correlation analysis reveals that the demand for hotel rooms (all four categories) in Metro Manila is closely associated with the volume of visitor arrivals.56 Specifically, there is a relatively high correlation between monthly tourism demand and de luxe hotel room demand.
• Lower Occupancy Rates
The occupancy rates of hotels in Metro Manila already declined from 73.8 percent in 2007 to 69.8 percent in 2008 (or a decline by 4.5 percent). The year-end figure was still above the average of 65 percent over a 20-year period (see Figure 5.8). For January 2009, the occupancy rate reached only 64.7 percent, 12.7 percent lower than its year-ago level.
54 Interviews with Mrs. Alejandra Clemente, President of the Federation of Tourism Industries of the Philippines, Mr. Cesar Cruz, President of Philippine Tour Operators Association, Mr. Paul So (Angala Travel) and Mr. Teodoro Bautista (Roundtrip Travel ), members of the Philippine Tours and Travel Agencies Association. 55 The Pearson correlation coefficient of 0.610 is significant at 0.01 level (2-tailed test). The Spearman’s rho coefficient is higher at 0.625. 56 Using annual data the Pearson correlation coefficient of 0.84 is significant at 0.01(2-tailed test). The coefficient of 0.70 is significant at 0.01 (2-tailed test) using monthly data (1998 to December 2008). The coefficient is higher (0.841) using seasonally adjusted series.

CRC Foundation Inc. - - The Global Recession and the Philippine Economy
140
Based on the DOT data, hardest hit were the bay area, Makati/Mandaluyong/Pasig and Alabang hotels. Category-wise, the de luxe and first class hotels registered the most significant drop in occupancy due to the lower inbound travel from Korea and Japan and the cost-cutting measures of the local corporate markets. For the year 2009, the average occupancy rate is expected to reach only 61 percent for all hotels in Metro Manila.
Figure 6.8 Occupancy Rates of Hotels in Metro Manila
• Lower Gross Value-Added
Similar to the air transport sector’s output performance, the GVA of the hotel and restaurant sector slowed down in 2008 after an impressive record in 2007, when it grew faster than the growth in GDP (see Figure 5.9). The slowest growth of 0.78 percent occurred during the 3rd quarter of 2008. The holiday season contributed to the recovery and modest growth of 4.01 percent in the 4th quarter. The projected GVA growth for the hotel and restaurant sector is 2.1 percent for 2009.
0
10
20
30
40
50
60
70
80
1988 1989 1990 1991 1992 1993 1994 1995 1996 1997 1998 1999 2000 2001 2002 2003 2004 2005 2006 2007 2008
Occu
pan
cy R
ate
(%
)
-20%
-15%
-10%
-5%
0%
5%
10%
15%
20%
Gro
wth
OR
Growth

CRC Foundation Inc. - - The Global Recession and the Philippine Economy
141
Figure 6.9
Growth in GDP and GVA of the Hotel and Restaurant Sector
0
2
4
6
8
10
12
Q1 Q2 Q3 Q4 Q1 Q2 Q3 Q4 Q1 Q2 Q3 Q4 Q1
05-06 06-07 07-08 08-09
Perc
en
t
GDP
H & R
Source of basic data: NSCB
6.1.3 Impact on Employment
Total employment in tourism-related industries reached 3.3 million in 2008,
1.5 percent higher than the previous year’s level. The growth was slower than its 2007 record of 3.7 percent and the growth of 2.5 percent for total Philippine employment (see Table 5.6). In 2008, the about a thousand workers in the passenger transport and tour and travel agency industries were displaced. The hotel and restaurant industries managed to increase its workforce overall. But it also had to displace some workers due to the slower tourism business, particularly from the international markets. From October 2008 to April 2009, the DOLE reported that about 147 workers (50-50 male/female) working in hotels and resorts nationwide were displaced, mostly food attendants and kitchen related service workers (see Table 5.7). The hotel and restaurant industries employ a significant number of women, about 40 percent in all medium to large establishments (those with 20 or more employees).57
57 Based on the employment data for establishments with 20 or more employees (NSO ASPBI 2006).

CRC Foundation Inc. - - The Global Recession and the Philippine Economy
142
Table 6.6 Total Employment in the Philippines and Employment in Tourism Industries
(in '000 persons)
Source: Romulo Virola, Tourism as Employment Engine, April 2009 (www.nscb.gov.ph)
There are promising employment prospects in tourism for the year 2009 given the opening of ongoing projects by the end of the year until 2010. Based on the 1st quarter performance report of the DOT, for the period January to March 2009, a total of 1,231 additional rooms, estimated at a cost of P8.016 B were opened to provide direct employment to 1,286 people. By year-end, some 1,946 people will be directly employed nationwide once the additional 2,315 rooms become operational in major tourism destinations like Cebu, Palawan, Boracay in the country. A US$ 200-Million luxury spa and resort is also set to be developed by Banyan Tree in a 55-hectare property in Diwaran Island of Palawan. About 8,000 direct and indirect jobs will be created during the planning, construction and operational stages from 2009 to 2012.

CRC Foundation Inc. - - The Global Recession and the Philippine Economy
143
Table 6.7 Displaced Workers in Hotels
Position Count % Share Barista 4 2.72%
Bartender 8 5.44%
F&B Manager 1 0.68%
F&B Supervisor 1 0.68%
Food Attendant 20 13.61%
Headwaiter 5 3.40%
Hospitality Girl 2 1.36%
H&R Manager 2 1.36%
H&R Salesperson 1 0.68%
Housekeeping Attendant 8 5.44%
Receptionist 5 3.40%
Supervisor 2 1.36%
Steward 1 0.68%
Housekeeper (Hotel and Resort 4 2.72%
Housekeeper (Private) 4 2.72%
Housekeeping Services Assistant 3 2.04%
Housekeeping Supervisor 2 1.36%
Kitchen Crew 23 15.65%
Kitchen Helper 20 13.61%
Proprietor 1 0.68%
Supervisor 3 2.04%
Room Attendant 27 18.37%
Total 147 100.00% Source of basic data: DOLE
6.1.4 Impact on Investments
The Philippines was not a recipient of foreign direct equity investments (FDI)
in the hotel and restaurant industries for the past decade (see Table 5.8). In 2007 new equity infusion worth US$2.6 M was recorded. There were significant increases in FDI from 2004 onwards, as evidenced in the real estate sector. These investments reflect the endorsed investment projects by the DOT during the period. In fact, from 2005 to 2008, the DOT endorsed PhP 146 B worth of cumulative private investments. Total investments per year reached PhP 36 B or 1,616 times larger than those generated during the period 2001 to 2004. These investments were placed largely in tourism economic zones.
The DOT already endorsed five development projects worth P6.323 Billion in 1st quarter of the year. These projects are projected to create 6,340 jobs for local residents. The preliminary figures from the BSP already revealed that tourism continues to attract interest from the international community and that the industry will not surely post zero investment despite the crisis. In fact, the private sector views

CRC Foundation Inc. - - The Global Recession and the Philippine Economy
144
the implementation of the Tourism Act of 2009 as an engine of quick recovery through investment mobilization.58
Table 6.8 BSP Foreign Direct Equity Investments (M US$)
Hotels
TOTAL Restaurants Real Estate
2000 1,333.00 0 2.62
2001 556 0 6.74
2002 1,607.00 0 0
2003 249 0 27.49
2004 750 0 54.76
2005 1,181.00 0 111.93
2006 1,324.00 0 120.49
2007 1,949.00 2.6 137.66
2008 p/ 1,350.00 20.65 154.78
Jan '2008 p/ 82 0.34 6.17
Jan '2009 p/ 54 0.08 9.92
Source: BSP
6.1.5 Impact on Local Destinations
The DOT data on regional travellers serve as indicator of the minimum
volume of visits since they do not fully capture the VFR market segments. The dataset reveal travellers tend to flock to the National Capital Region, Region 7 (Cebu and Bohol), Region 6 (Aklan and Boracay), Region 3 (Pampanga and Subic) and Region 4 (Laguna, Batangas, Cavite). Investments in the past five years are also concentrated in most of these areas as shown in Table 5.9. The LGUs in these destinations have to monitor tourism closely because they are likely to experience displacement in tourism workers if the dramatic slowdown in global travel happens and if the appropriate response measures are not pursued.
58 Interview with Mrs. Alejandra Clemente, President, Federation of Tourism Industries of the Philippines.

CRC Foundation Inc. - - The Global Recession and the Philippine Economy
145
Table 6.9 Total Tourism Investment by Region, 2000 - 2008
Tourism Investment (in Million pesos)
Region 2000 2001 2002 2003 2004 2005 2006 2007 2008 Total
CAR 38 3 88 - - 484 2,600 - - 3,214
NCR 838 542 429 279 456 5,086 35,818 17,559 10,409 71,418
I 2 6 11 1 575 - 44,143 - 4 44,742
II - - - - - - 55 - 50 105
III 6 119 13 239 - - 186 44 1,433 2,039
IV 841 244 280 3,75
5 98 2,768 1,543 2,979 2,870 15,378
V - - - - - 375 191 1,327 854 2,747
VI 118 - - 864 - 254 4,158 175 187 5,756
VII 759 12 8 284 70 2,795 5,059 165 2,204 11,356
VIII - - - - 88 - - - 58 146
IX - - 4 - - - - - 4
X 464 - - 30 - - - - - 494
XI - - - - - - - 95 - 95
XII - - - 18 - 25 12 - - 55
XIII - - - - - 151 - - - 151 Total Investment 3,065 927 829 5,473 1,288 11,938 93,766 22,344 18,070 157,700
Source of basic data: DOT – Office of Tourism Standard
The DOT’s 1st quarter report revealed that the 1st quarter of the year witnessed a relatively robust tourism in secondary destinations such as Cebu, Boracay, Zambales, Camarines Sur, and Bohol. Domestic travellers to Puerto Princesa City and Coron in Palawan posted a record breaking growth of 392 percent as more flights were mounted to these destinations from Manila, Cebu, and Caticlan as well as Kota Kinabalu in Malaysia. Likewise, local visitors flocked to Camarines Sur for wakeboarding, Surigao del Sur, Sorsogon (Donsol) for whale shark interaction, Zambales (Subic) for recreation, Ilocos Norte and La Union for sightseeing and beach holiday resulting in double digit gains in these destinations.

CRC Foundation Inc. - - The Global Recession and the Philippine Economy
146
6.2 Industry and Government Response
On the demand-side, the tourism industry is vulnerable to the crisis in so far as
the contraction in the volume of arrivals from traditional and mass-based markets, particularly from Northeast Asia, will continue throughout the year without significant increases in new and emerging markets. Thus, diversification is a key element of survival and eventually sustainability. The volume to be generated from these other markets may not be sufficient to compensate for the expected declines in the traditional markets. Nevertheless, the additional arrivals will still provide income opportunities to the industry and enable the providers to survive the crisis period. Based on the 2008 arrivals data from the DOT, the fastest growing markets include: Russian Federation, United Arab Emirates, Vietnam, France, Norway, India, Canada, Spain and United Kingdom to name a few.
The industry has turned to the domestic market for survival opportunities.
However, opportunities to further enlarge the base of travellers to secondary destinations also hinge on the international tourism market and its recovery from the crisis and the AH1N1 outbreak. The Philippines is still a relatively small player at this time and opportunities exist to expand the market shares of tourism-related businesses and destinations in the global industry.
One major opportunity is to support the survival, recovery and long term
competitiveness of the industry by identifying areas where stimulus measures can be pursued in exchange for the long-term benefits and where growth and investment climate can be enhanced. This is true especially in the case of tourism suppliers whose vulnerabilities are rooted in the unfavourable business and investment climate in the country. It makes it easier for these suppliers to close down their operations and to shift to more lucrative markets outside of the Philippines.
6.2.1 Current Response
• Fiscal The Board of Airline Representatives and the IATA requested for some stimulus package from the government, thru the aviation authorities – Manila International Airport Authority, Mactan Cebu International Airport Authority and Civil Aviation Authority of the Philippines. In April 2009, BAR specifically asked for 50 percent reduction in airport-related charges effective for one year with a review at the end of the one-year period as an incentive for continuous operations. As part of its global campaign for support to the airline industry, the IATA recommended the following actions to all airport authorities (including the Philippines): waiving of certain fees and charges, a cut in present fees and charges or temporary discounts for a given period, postponement of all non-essential costs and investments flowing through to a mid-year adjustment in 2009 rates, and acceleration of initiatives/projects that will bring cost efficiency benefits.
The request of the industry to the MIAA board was indorsed by both the DOT and the DOTC. In May, the MIAA granted 10 percent discount on airport related charges for all commercial flights and 15 percent for all extra

CRC Foundation Inc. - - The Global Recession and the Philippine Economy
147
section flights for a period of six months or until the end of 2009. The Philippines therefore joins the ongoing efforts in the region to help mitigate the negative impact of the crisis on airlines:
• Malaysia has granted 50 per cent rebate on landing charges for two years, starting April 1, 2009.
• A 25 percent reduction in landing charges is now implemented in Singapore’s Changi airport.
• 10 percent reduction in landing and parking charges (Korea Airports Corporation)
• 25 percent reduction in cargo landing fees (Toronto Airport)
• In Thailand, the Department of Civil Aviation was told to cut the landing and parking fees for all airports under its supervision by 50 percent for chartered flights and by 20 percent for scheduled flights.
The government has also committed to accelerate the development of tourism-related infrastructure such as the Caticlan airport in order to expand the capacity of local destinations.
• Marketing At the start of the year, the DOT already announced a “stimulus package” aimed at stimulating travel from the US, Japan, Korea and China. This stimulus package is more of a re-allocation of marketing funds rather than infusion of new funds in order to support the industry. There is already an ongoing promotional program of US$999 to bring in more residents from the US, particularly the Balikbayans.59 The promo includes roundtrip international airfare via PAL, two (2) night hotel accommodation in any of the selected deluxe hotels, daily American breakfast and one-way transfer from the airport to hotel or vice versa and extension adventure tours to Palawan, Cebu, Bohol, Boracay and Cagayan de Oro are also offered at affordable costs.
The private tour operators also launched programs such as the Island Get Away packages in order to encourage domestic travel particularly during the summer months.
• Public-Private Partnership The PPP approach was prominent in product development and marketing at the local destinations. For example, the DOT reported in its 1st quarter performance report that the DOT and the Cagayan Economic Zone Authority have combined their resources in organizing the recently concluded international windsurfing exhibition in Anguib beach in Sta Ana, Cagayan. In other areas such as Candaba, Hundred Islands, Puerto Princesa, Mount Apo and Pantabangan Dam, syndicated efforts of the DOT, the Wild Bird Club of the Philippines, tour operators and the LGUs in key destinations, were directed at developing birdwatching tours to address the
59 The tour operator consortium is composed of Air Travel Center , GTT International, LBC Travel, Pacific Air Leisure, and Travelfast/Mango Tours. The official ground-handler for this extraordinary tour package is San Francisco-based Rajah Tours International; while the participating hotels are Sofitel Philippine Plaza, Crowne Plaza Galleria, Diamond Hotel, Holiday Inn Galleria and Dusit Thani Hotel. This package is available only up to May 23, 2009.

CRC Foundation Inc. - - The Global Recession and the Philippine Economy
148
increased demand for nature and wildlife adventure. The same PPP approach was adopted in Aliminos Pangasinan to design and promote sea kayak tours to be managed by the Hundred Islands Eco-Tour Association (HIETA), a community-based organization of out-of-school youth.
To support associations and companies in trying to bring down costs for the conduct of MICE events, PCVC shall promote “GREEN EVENTS” by advocating less use of paper, reducing waste, introducing energy efficient facilities and designing compact meeting schedules. This should result in lower administrative costs.60
• Human Resources The private sector is using the crisis period as opportunity to train its current workforce in anticipation of more discriminating markets in the next two years. Under a PPP approach, the PCVC has teamed up with the Philippine Association of Professional Congress & Exhibit Organizers (PACEOS) to run training programs and Events Management and Marketing in selected secondary destinations initially Bacolod, Subic/Clark. Domestic events continue to be the backbone of the local MICE industry and are an excellent vehicle to disperse revenues to provincial areas.
• Monetary None
6.2.2 Industry Expectations and Other Proposed Interventions
The private sector is seeking the support of the government in truly making tourism as key tool for economic recovery by responding to these additional proposed interventions. It echoes the call of the UNWTO to reduce barriers to mobility and to remove all obstacles such as taxation and over regulation.
• Fiscal In June 2009, the airlines requested the MIAA, the MCIAA and the Civil Aviation Authority of the Philippines to follow the lead of other airport authorities in the region by increasing the discount in airport landing and take-off fees. The approved 10 percent discount was insufficient to enable their survival from the combined impact of the AH1N1 outbreak, global crisis and increasing fuel prices on travel demand and on their viability.
Apart from reductions in aeronautical fees, the airlines appealed to the government to help them reduce their costs of doing business by removing airlines from the enumeration of users to be charged for the overtime work by Customs, Immigration and Quarantine personnel and by reviewing the tax regime (gross receipts tax for foreign airlines and Philippine travel tax).61
Foreign airlines seek for a review of the tax regime that governs their operations in the Philippines. They are currently taxed on gross receipts
60 Email response of Director Danilo Corpuz, Executive Director of PCVC 61 Consultation with Board of Airline Representatives, Pasay City, 01 April 2009.

CRC Foundation Inc. - - The Global Recession and the Philippine Economy
149
basis regardless of the place of issuance and /or payment of tickets (based on the 1997 Tax Code). The airlines seek a PPP approach with the Department of Finance (DOF) and the Bureau of Internal Revenue (BIR) to help address their concerns, that is, for the tax experts of the industry to work together with the DOF and BIR in implementing revised rules that will make the Philippines a more attractive investment destination. Practices from other countries can be used as basis for revising the rules.
The implementation of the Philippine travel tax also contributes to the higher costs of doing business for airlines and travel agencies and additional transaction costs (cost of exemption, transportation expense, opportunity cost of time) for the travelling public. It is also not consistent to the promotion of green tourism and green tourism businesses for environmental sustainability. Some airlines are required to handle about 35,000 travel tax-related documents every month and to spend on additional manpower (at least two) per month to collect, compile and prepare the documents for the travel tax audit conducted by the Philippine Tourism Authority.
Local government units in major tourist destinations are also requested to consider suspending rate increases and/or waiving or reducing fees for business permits for one year.
• Marketing Per recommendation from the private sector, the DOT should develop and match the innovative and competitive packages of Singapore and Vietnam. Such promotional activities are needed given that the country is competing with its neighbours that have poured in new resources to address the impact of the crisis.
• Vietnam launched its “Impressive Vietnam”campaign by offering 30-50 percent discounts on tours (by Vietnam Airlines) particularly to central and northern Vietnam. Under the programme, there will be a 30-50 percent discount for hotel rooms as well as airfares for both international and domestic flights. Target markets by hotels specializing in conventions include Australia, Korea, America, and Europe.
• Cambodia has removed the US$20 visa fee for tourists and is working on improving connectivity from Thailand.
• Taiwan unveiled a plan to spend almost 900 million US dollars on a bid to attract more tourists to the island over the next four years; The draft plan allows for the government to pour 30 billion Taiwan dollars (887.5 million US) into various projects including updating popular sightseeing spots, promotion at home and abroad, renovating hotels and training tourism personnel.
• The Malaysian Tourism Ministry allocated RM 200 million to be spent on infrastructural upgrade in tourist areas, diversifying tourism products, organising more international conferences and exhibitions in Malaysia and improving the homestay programme. It has also partnered with its counterpart in Indonesia to jointly promote Malaysia and the Indonesia as twin destinations.

CRC Foundation Inc. - - The Global Recession and the Philippine Economy
150
• In Thailand, the government has granted visa exemptions for a period of three months to tourists and waived visa fees for all tourists.
According to the PCVC, tour operators and hotel/resort establishments would
want to see more buyers brought into the country in the form of familiarization trips to be able to introduce new packages and conduct business appointments. Both DOT and PCVC has plans to increase these multinationals this year by expanding the Travel Mart Exchange (TRAMEX) in Cebu this July and the Philippine Travel Exchange (PHITEX) in Manila this September. Likewise, a MICE Buyers Forum during the latter part of the year is being planned.
• Public-Private Partnership There is scope for stronger partnership with the private sector and the local government units. They can support the central DOT’s initiatives by offering competitive or cheaper rates for their products and services (in the case of the private sector). In the case of the local government units, they can help mobilize their local communities to make the tourism experience truly worthwhile (in the case of the local government units) through more efficient transport management systems, clean and safe (and secure) tourist environment – ports, airports, bus terminals, tourist sites as examples. Private stakeholders in some destinations have started to tap new markets (e.g. India and Middle East) as part of their diversification program (as in the case of Cebu). The local government units can help expand this program by supporting the initiatives of the private sector through the measures mentioned earlier. For these new markets, their good experience in the Philippines will have a positive effect on the destination through word of mouth advertising.
This PPP can be strengthened further through the Implementing Rules and Regulations of the Tourism Act of 2009.
6.3 Competitiveness Issues and Strategic Response
As mentioned in the previous section, the crisis serves as the right opportunity
to make the Philippines a more favourable and competitive investment destination. Now is the time to remove the obstacles to mobility and to competitiveness. The objective is to make it more difficult for existing investors to leave and for new investors to ignore the Philippines.
Based on global competitiveness reports (by the World Economic Forum), the areas which contribute to the lack of tourism competitiveness include: transport and tourism infrastructure, investment rules, regulatory environment and health and hygiene. The safety and security issue cited in these reports is more of a perception problem.62 The secondary destinations of the country are safe for both foreign and local tourists. Unsafe destinations are isolated and not recommended for tourism. Both the government and the private sector should continue to address this perception problem.
62 Commentary provided by Undersecretary Oscar Palabyab during the inter-agency meeting at the Board of Investments, April 17, 2009.

CRC Foundation Inc. - - The Global Recession and the Philippine Economy
151
6.3.1 Enhance international and local connectivity through improved infrastructure and more enabling business and investment climate
This crisis period is the right time to mobilize investments to generate jobs and
income and prepare infrastructure and human resources in time for the economic recovery. In general, infrastructure to improve farm to market access in the countryside and in the metropolis will benefit tourism as evidenced in the case of Thailand. The DPWH, DOT, DOTC already have a list of these projects. The airports and ports should be a priority in relation to improving processes and ensuring safety of travellers. There has been underinvestment in airport facilities and process improvements in the past decades.
Local connectivity can also be improved with the completion of mass transport projects (e.g. rail system) within the metropolis and between the metropolis and its environs. Connectivity can also be improved with the development of port facilities to support domestic travel via the RORO. New products such as cruise tourism can be designed and promoted with the right port infrastructure.63 Monitoring will be another critical component in overall competitiveness.
There has been underinvestment in room infrastructure to tap and expand the high yield international MICE markets. The capacity will significantly expand in the next two years with the completion of a number of endorsed projects by the DOT. But room infrastructure must improve as the country sets higher targets for tourism.
As regards infrastructure, the spending record has been quite low in previous years. There is very limited connectivity in terms of number of international flights operating in the country, relative to the regional hubs. Some reasons to explain this situation include: the restrictions imposed by the bilateral air services agreements of the Philippines and the limited capacity of the Philippine carriers to expand overseas operations. Some foreign airlines have shifted to off-line operations which have reduced employment opportunities at the airport due to the relatively high costs of doing business (e.g. related to overtime pay for CIQ personnel) for international carriers (including the Philippines’ carriers), and gross receipts taxation for foreign airlines.
From May 2007 to March 2009, the DOTC pursued and concluded bilateral air talks with a number of countries, thus leading to significant increases in air seat capacity. This has been a marked improvement from the relatively low record of one air talk per year during the period 1997 to 2007. The government should continue enabling secondary gateways to develop outside of the restrictions of the bilateral framework. Liberalizing the entry into secondary international gateways can enable the faster development of tourism destinations through faster and cheaper access. The recent agreement with Australia provides unrestricted point to point capacity to and from some secondary points of Australia to Cebu, Davao and other gateways outside of Manila and Clark. This should serve as opportunity to expand the arrivals from Australia and to compete with favourites such as Bali and Phuket.
63 Comments by Undersecretary Oscar Palabyab, April 17, 2009.

CRC Foundation Inc. - - The Global Recession and the Philippine Economy
152
6.3.2 Improve the investment and business climate to support investment
mobilization and job generation
Tourism has been identified as a globally competitive and sunrise industry by the government. Hence, government should seek to reduce transaction costs. In the case of the airline industry, the issues on CIQ charges (e.g. overtime, meals and allowances etc) paid directly to the personnel has yet to be resolved despite the fact that this has been cited as an impediment to competitiveness, expansion and connectivity in a number of consultations for almost a decade already. The taxation regime should also be benchmarked with other competitive destinations. Other costs associated with the implementation of policies (e.g. travel tax) and regulations in all tourism-related services should be included in the agenda. Another strategic response is to streamline procedures and processes (e.g. registration, access to information, licensing, etc) at the LGUs through one-stop shop tourism investment centers (including website).
6.3.3 Implement product development and service improvement programs
When demand is down, it is the best time to implement maintenance work in the facilities, train people, develop service manuals, upgrade standards of facilities and services, implement GREEN TOURISM programs or projects, develop new products and improve the existing products (in terms of packaging, labeling, etc.), enhance data collection systems especially at the destination levels. Training human resources is a strategy pursued by global tourism brands during crisis, thus making them more competitive after the crisis. The government can consider giving incentives for those that will conduct training programs in the country (e.g. rebates etc.).
6.3.4 Develop globally competitive tourism workforce
Long term tourism growth and competitiveness cannot be achieved without the support of a globally competitive workforce and human resources plan. This plan should cover human resource development even at the grassroots level. This is where international donor agencies can help tourism development, by supporting the human resource training needs of SMEs and microfinance groups in tourism, especially the women and out of school youth.
The requirement for competitive human resources, both in numbers and in quality, has been a subject of a number of stakeholders’ consultations in the past. During the National Manpower Summit in 2006, the Technical Education Skills Development Authority (TESDA) explicitly highlighted the gap in critical skills of about 150,000 workers in the hospitality services - housekeeping, cooking, bartending, waitering, food serving and handling, baking, front desk services, and room attendant. The TESDA reported that while the number of deployed workers in these hospitality service fields has not yet reached critical level, the country must be prepared to address the growing demand for hospitality workers in the Philippines and abroad (e.g. Canada, Australia, New Zealand, USA, Middle East and Africa). The POEA data on overseas employment reflect that one of the dominant sectors for overseas

CRC Foundation Inc. - - The Global Recession and the Philippine Economy
153
employment is Hotel and Restaurant. According to the data, the sector will be needing a total of 86,962 workers in the next five years. The wide disparity in wages and benefits will pull more and more graduates of the Tech-Voc as well as HEIs out of the country in the next three to five years. During the National Competitiveness Council People Summit last November 15, 2007, the stakeholders raised concerns about the quality of graduates in hospitality courses. The Hotel and Restaurant Association of the Philippines reported that only about 8 percent of the annual graduates of hotel and restaurant management courses in the Philippines are fully qualified to take on the job responsibilities with hardly any retraining or very minimal retooling.
Based on the projections by the Technical Skills Development Authority (TESDA), manpower shortage in the hospitality industry is expected to reach 174,864 for 2006-2010 period. The five (5) occupations with highest manpower shortages are: waiters, food and beverage service attendants, cooks, food servers and handlers, and bartenders. There are already existing channels (e.g. school-based, center-based, community-based and enterprise-based programs) by which the TESDA can be supported to further uplift the quality of tourism workers. The recommendations during the Manpower Summit in 2006 are more relevant and urgent given the potentials of the Tourism Act to generate more investments in tourism:
� Encourage more training providers in the sector and possible expansion of the capacity of the existing TVET providers;
� Encourage active participation of private sector in dual training system, apprenticeship program, enterprise-based training, and more on-the-job training (OJT); and
� Promote assessment and certification especially in food and beverages and particularly on standards of safety on food and beverage handling.
6.3.5 Public-Private Partnership The Philippines has already gained the attention of the international
investment community with the entry of global tourism brands in the past four years. Now is the time to intensify the interest of both foreign and local investors in the potentials of tourism. Promotions should continue to generate interest in the Philippines not only as a tourism site but also as an investment location. The promotional programs should also cater to local investors that have either the land or the network to put together projects.
This program should be accompanied by the improvement of LGU capabilities, particularly in ensuring high quality of standards of facilities and services. The Tourism Act of 2009 (Republic Act No. 9593) spells out the national policy for tourism as an engine of investment, employment, growth and national development. Critical to this policy is the institutional framework that will define the rules of the games in the pursuit of the above objective.
Investment mobilization can also be supported by the national government stimulus program. In the case of tourism, the DOT, through its Grassroots for Entrepreneurship and Employment in Tourism (GREET) has stepped up the granting

CRC Foundation Inc. - - The Global Recession and the Philippine Economy
154
of financial subsidies to tourism establishments located in provincial areas to upgrade both facilities and services to local and foreign travelers. Now on its second year of implementation, the GREET has expanded from eco-tourism programs to tourism livelihood projects in general. The private sector, LGUs and international agencies are welcome to provide counterpart funding or support.

CRC Foundation Inc. - - The Global Recession and the Philippine Economy
155
Impact of the Crisis on Tourism and Possible Interventions Current Situation Impact of the Crisis Possible Interventions
Market demand
In 2007, the country recorded a total of 3 million arrivals, slightly below the target of 3.4 million. Nevertheless, in terms of receipts, the DOT surpassed its 2010 target of $4.5 B in 2007, 3 years ahead of the projected timeline. Travel and tourism ranked as the fourth largest source of foreign exchange revenues (the top three are electronics exports –$28.5 B, overseas workers remittances - $16B, and BPO - $6B) for the country in 2008.
Volume of Arrivals
The early impact of the global crisis was evidenced in the slower growth of international arrivals in 2008. A total of 3,139,422 visitors arrived in the Philippines last year, 1.5 percent higher than the volume in 2007 but the slowest in the past five-years.
Tourism Receipts For the whole year of 2008, receipts dipped to $4.4 B in 2008, 11.1 percent lower than the earnings in 2007. The 1st quarter results revealed that revenue flows declined from $1,155 M to $744 M (35.6 percent).
Per recommendation during the April 23 forum, more innovative packages should be developed for markets other than the US or Balikbayans. Development or improvement of marketing channels such as websites and booking channels especially at the LGU levels Review of fees charged by tourism suppliers and LGUs to tourists, especially to high value market segments such as divers in line with sustainable tourism revenue (and taxation) generation mechanisms LGUs can help mobilize their local communities to make the tourism experience of current and new market segments truly worthwhile through more efficient transport management systems, clean and safe (and secure) tourist environment – ports, airports, bus terminals, tourist sites. For these new markets, their good experience in the Philippines will have a positive effect on the destination through word of mouth advertising. Funding support by international agencies in tourism can be directed towards these types of projects.
Market Supply
Among the providers, the most vulnerable to the global tourism
Air Transport The vulnerabilities have been evident
The Board of Airline Representatives requested for discounts on airport charges. In May, the MIAA granted

CRC Foundation Inc. - - The Global Recession and the Philippine Economy
156
Impact of the Crisis on Tourism and Possible Interventions
Current Situation Impact of the Crisis Possible Interventions slowdown is the international airline sector which carries 98 percent of international arrivals to the Philippines. About half of international inbound passengers are tourists and the rest are returning Philippine residents (e.g. tourists and Overseas Filipino Workers).
in the reduction of flights (with the exemption of Middle East carriers), decline in passenger volumes and most importantly in yields (about 35 to 50 percent). Gross Value Added (GVA) The effects of the crisis on the local airlines are evident on the slower growth of the gross value-added (GVA) in 2008 and in the 1st quarter of 2009. Tours and Travel Agencies Those handling inbound tourists, especially from Korea, Japan, and China have experienced sharp reductions, as high as 35 to 50 percent, in their bookings. Airlines have reduced their commission rates for these agencies, particularly in the business and first class seats.
Accommodation
The occupancy rates of hotels in Metro Manila already declined from 73.8 percent in 2007 to 69.8 percent in 2008 (or a decline by 4.5 percent). The GVA growth of the hotel and
10 percent discount on airport related charges for all commercial flights and 15 percent for all extra section flights for a period of six months or until the end of 2009. Requests submitted to the Mactan Airport Authority and Civil Aviation Authority of the Philippines have been denied because airport authorities have not increased their rates in previous years. Pro-active dialogue between the DOTC and the airlines for them to make a case for the stimulus package or extension beyond December 2009. The long-term benefits of the package should outweigh the foregone revenues of the airport authorities or the DOTC for a fiscal year or two. Review of investment incentives for SMEs in tourism. Most of the tour operators are SMEs that cannot meet the minimum fleet requirements for buses by the government.

CRC Foundation Inc. - - The Global Recession and the Philippine Economy
157
Impact of the Crisis on Tourism and Possible Interventions
Current Situation Impact of the Crisis Possible Interventions restaurant sector slowed down in 2008 after an impressive record in 2007, when it grew faster than the growth in GDP.
Employment
Total employment in tourism-related industries reached 3.3 million in 2008, 1.5 percent higher than the previous year’s level. The growth was slower than its 2007 record of 3.7 percent and the growth of 2.5 percent for total Philippine employment.
From October 2008 to April 2009, the DOLE reported that about 147 workers (50-50 male/female) working in hotels and resorts nationwide were displaced, mostly food attendants and kitchen related service workers. The hotel and restaurant industries employ a significant number of women, about 40 percent in all medium to large establishments (those with 20 or more employees).
International agencies/chambers of commerce can extend support to the DOT through the GREET program in order to expand the pool of funds for the SMEs and microfinance projects proposed by local communities and enterprises. These projects can support the women entrepreneurs. Link-up projects for women in tourism with private sector initiatives such as the 10,000 women project of the Goldman Sachs and the University of Asia and the Pacific. Provide training programs, develop service manuals to prepare the industry for the rebound. Some proposals from the 2006 Manpower Summit include: encourage more training providers in the sector and possible expansion of the capacity of the existing TVET providers; encourage active participation of private sector in dual training system, apprenticeship program, enterprise-based training, and more on-the-job training (OJT); and promote assessment and certification especially in food and beverages and particularly on standards of safety on food and beverage handling.

CRC Foundation Inc. - - The Global Recession and the Philippine Economy
158
Impact of the Crisis on Tourism and Possible Interventions
Current Situation Impact of the Crisis Possible Interventions Support through discounts or rebates can be given especially to SMEs participating in training programs
Business and Investment Climate
From 2005 to 2008, the DOT endorsed PhP 146 B worth of cumulative private investments. Total investments per year reached PhP 36 B or 1,616 times larger than those generated during the period 2001 to 2004. These investments were placed largely in tourism economic zones.
The DOT already endorsed five Development projects worth P6.323 Billion in 1st quarter of the year. These projects are projected to create 6,340 jobs for local residents. The preliminary figures from the BSP already revealed that tourism continues to attract interest from the international community and that the industry will not surely post zero investment despite the crisis
The Implementing Rules and Regulations of the Tourism Act of 2009 (Republic Act 9593) need to be drafted and promulgated by second week of November.
Other salient points of the Act with implications on LGUs include: masterplanning, identification of lands for tourism development, implementation of standards for accreditation, development of one-stop shops for investments and businesses to reduce time and financial costs (particularly in licensing and registration, land titling – including verification and authentication). Projects of international donor agencies can focus on these areas to help LGUs mobilize tourism investments in light of the Tourism Act of 2009
Certain transaction costs tend to raise the costs of doing business in the country and make it easier for investors to shift operations to more competitive tourism destinations. Specifically, in the airline sector: gross receipts taxation (global sales and not just the business turnover in the Philippines) imposed on foreign airlines, costs of overtime payments (overtime rate per hour,
The crisis magnified the burden of these costs on the tourism suppliers
Review of the rationale for the collection of these charges and the taxation regime for foreign airlines, and make amendments to the rules and regulations that govern such practices in light of global practices and the long-term international connectivity and competitiveness of Philippine tourism. It is important to identify the remedies needed – administrative, legislative, executive, judiciary and the lead agencies to enable the reform process. To develop competitive and sustainable tourism taxation in the country, the pertinent laws and regulations on taxes and charges being applied to the entire tourism value chain

CRC Foundation Inc. - - The Global Recession and the Philippine Economy
159
Impact of the Crisis on Tourism and Possible Interventions
Current Situation Impact of the Crisis Possible Interventions meals and transportation allowances) to customs, immigration and quarantine personnel (CIQ), and impact of travel tax procedures
(airlines, hotels, travel agencies, tour operators, facilities) need to be reviewed with a wholistic perspective – long term development of tourism. International agencies can support projects to assess the impact of the current tourism taxation regime on the value chain and propose ways to generate more innovative, competitive and sustainable sources of taxation revenues
Infrastructure
The Philippines’ ranking has not improved based on international surveys
Government has decided to channel some funds to infrastructure development, including tourism, in order to generate jobs
In general, infrastructure to improve farm to market access in the countryside and in the metropolis will benefit tourism as evidenced in the case of Thailand. The DPWH, DOT, DOTC already have a list of these projects. The airports and ports should be a priority in relation to improving processes and ensuring safety of travellers. There has been underinvestment in airport facilities and process improvements in the past decades. Local connectivity can also be improved with the completion of mass transport projects (e.g. rail system) within the metropolis and between the metropolis and its environs. Connectivity can also be improved with the development of port facilities to support domestic travel via the RORO.

CRC Foundation Inc. - - The Global Recession and the Philippine Economy
160
7. The Philippine Automotive Industry and the Global Financial Crisis
Ceferino S. Rodolfo
7.1 Current Industry Status
7.1.1 Sales, Production, Imports and Exports
The Philippine automotive industry can be characterized as small, domestic-oriented, and import-dependent. In 2008, the industry’s brand-new vehicle sales of 124,449 were at just about same level as the 124,381 units sold in 1995. In fact, the industry still has to match the 157,361 units it sold in 1996, prior to the Asian Financial Crisis.
Figure 7.1
Chart 1. New Vehicle Sales (in units, 1971-2008)
0
20,000
40,000
60,000
80,000
100,000
120,000
140,000
160,000
180,000
1971 1976 1981 1986 1991 1996 2001 2006
Source: CAMPI
157,361
124,449
Worse, of the brand-new vehicle sales, only about half are actually assembled in the country as the rest were imported as completely built units (CBU). For instance, Hyundai—which has now become a popular car brand cornering a market share of 8.2% in 2008—does not have an assembly facility in the country and imports all of the vehicles that it sells in the Philippines. The share of imported CBU vehicles to total industry sales had increased from just about 4% (or 3,149 units) in 2000 to 48% (56,775 units) in 2007.64
64 Page 14. Table 9. Globalization and the Need for Strategic Government-Industry Cooperation in the Philippine Automotive Industry. Rafaelita M. Aldaba. DISCUSSION PAPER SERIES NO. 2008-21. August 2008.

CRC Foundation Inc. - - The Global Recession and the Philippine Economy
161
Figure 7.2
Chart 2. CBU Imports
(in units; in % share to total new vehicle sales)
0
10,000
20,000
30,000
40,000
50,000
60,000
in u
nit
s
0
0.1
0.2
0.3
0.4
0.5
0.6
% t
o t
ota
l sa
les
CBU Imports
% to Total Sales
CBU Imports 1461 1609 4125 1146 24730 23947 12328 9779 3149 11468 10853 6948 29246 38497 43491 56775
% to Total Sales 0.0242 0.0192 0.0399 0.0089 0.1526 0.1658 0.1537 0.1314 0.0426 0.1496 0.1268 0.0752 0.3321 0.3966 0.4369 0.4815
1992 1993 1994 1995 1996 1997 1998 1999 2000 2001 2002 2003 2004 2005 2006 2007
Source of basic data: Aldaba, R. "Globalization and the Need for Strategic Government-Industry Cooperation in the Philippine Automotive
Industry," p.14, 2008.
In 1996, the Philippines produced about 131,000 vehicles; by 2008, this had gone down to about 66,000.65 In contrast, other ASEAN countries were already able to fully recover from the 1997 crisis. Thailand, for example, produced almost 1.4 million (M) vehicles in 2008; compared with just 559,000 in 1996. Its domestic market of 615,270 units (2008) is almost five times bigger than the Philippines’. It exports more than 500,000 vehicles every year.66 Thailand’s production size is about 21 times larger than the Philippines’; Malaysia’s is nearly eight times; while Indonesia’s is more than seven times bigger.
Table 7.1 Comparative Vehicle Production
Country Pre-1997 Crisis
Estimated Production 2008* in ‘000 units Indonesia 386 (in 1997) 465 Malaysia 462 (in 1997) 507 Philippines 131 (in 1996) 66 Thailand 559 (in 1996) 1,372
* light vehicles Source: U (2003) for 1996-1997 data, www.csmauto.com for 2008
65 Four-wheel vehicles (e.g. passenger cars, jeeps, pick-ups, vans, four-wheel drives, sports utility vehicles, etc.), excluding trucks & buses. 66 Aldaba, Policy Notes, p. 7

CRC Foundation Inc. - - The Global Recession and the Philippine Economy
162
Measured in terms of value, the Philippines exported almost US$90 M-worth of automobiles in 2006; while Thailand exported almost US$3 billion (B). Thailand’s automobile exports were more than six times larger than the value of its imports; the Philippines, on the other hand, is in the opposite situation—its imports were more than six times the size of its exports.
Table 7.2 Comparative Value of Exports & Imports of Motor Vehicles
2006, trucks, buses & automobiles
Country Exports Imports Ratio of Exports
to Imports
(in '000 US$)
Thailand 2,925,828 469,641 6.23 Philippines 89,738 561,440 0.16 Indonesia 366,069 504,180 0.73 Malaysia 179,540 1,419,319 0.13
Source of basic data: www.macmap.org
The total size of the Philippine auto market is actually much higher than that suggested by brand-new car sales. In 2004, total first-time vehicle registrations reached 226,855 units—but only 88,075 units represented brand-new vehicle sales by the industry; more than 60% (or 138,780) were from other sources, e.g. those brought in by balikbayans or diplomats, those from assembled by informal motor shops (e.g. owner-type jeeps) and, most importantly, second-hand motor vehicles imported through special economic zones. For an industry that is sensitive to scale, the importation of second-hand vehicles has a significant impact. For instance, the current best selling passenger car model is the Toyota Vios, with sales in 2008 of about 12,000 units. This still falls short of the estimated 40,000-50,000 units needed to efficiently produce a given vehicle model. (source:__ ). Disallowing the importation of second-hand vehicles does not however automatically increase the domestic market. The industry must also find a way of servicing the needs of those who buy imported second-hand at the price-level that they can afford.

CRC Foundation Inc. - - The Global Recession and the Philippine Economy
163
Chart 3. New Vehicle Registrationsbrand-new industry sales vs. other sources
0
50,000
100,000
150,000
200,000
250,000
1982 1987 1992 1997 2002 2007
un
its
Other Sources
Industry Sales
Source of basic data: CAMPI, LTO
61% of
total new
registered
vehicles in
2004
~227k first-
time
vehicles
registration
s
~139k
from
other
sources
~88k
industry
brandnew
sales
Figure 7.3
7.1.2 Contribution to the Economy
The Automotive industry has the potential to contribute significantly to the Philippine economy. It is one of the sectors with the highest, if not the highest, output multiplier. Its multiplier of 2.42 means that a Php1 increase in the sector’s output leads to an additional Php2.42 increase in the output of other industries. It is not difficult to visualize why the industry has a high multiplier. To manufacture, assemble, and sell motor vehicles require a wide range of parts, raw materials, and services. A vehicle contains parts made of steel and other metals, plastics, rubber, glass, leather, etc.

CRC Foundation Inc. - - The Global Recession and the Philippine Economy
164
Figure 7.4
Chart 4. Output Multipliers (selected sectors, based on 2000 Input-Output table, aggregated into 29 sectors)
1.97
1.70
2.19
2.28
2.06
2.42
2.24
1.66
1.20
1.60
0 0.5 1 1.5 2 2.5 3
Agribusiness
Mining
Garments
Furniture
Electronics
Automotives
Tourism
Finance
Real Estate
BPOs
Source of Basic Data: NSCB
However, for the Philippines to realize the benefits from the auto industry’s high output multiplier, the local economy must first be able to competitively supply the raw materials and parts needed by industry. As it is, the Philippine auto industry is heavily dependent on imported parts and components—thereby missing-out on the potential multiplier impact of the industry on economic output. Of the total costs of the industry, about 61% are imported (especially from Japan and Thailand); 23% are locally-sourced; while 16% represent assembly costs.

CRC Foundation Inc. - - The Global Recession and the Philippine Economy
165
Table 7.3
Cost Comparison between RP and Thailand
Cost Item RP Thailand Assembly costs 16 13
Local components 23 67
Multi-supplier parts 61 20
- supplied from Japan 12 13
- supplier from ASEAN (e.g. Thailand or RP)
49 7
100 100 Source: Adapted from Aldaba, R. “A call for strategic government–industry coordination. The autobus is leaving...Can the Philippines catch it?,” Figure 2. Comparative cost study between Thailand and the Philippines. PIDS Policy Notes. No. 2008-02 (March 2008)
The lower assembly cost of Thailand is derived primarily from the economies of scale that it enjoys from having a larger domestic market. It can spread its fixed costs over larger production runs and it can fully utilize its production capacity. In 2006, Thailand has a production capacity of 1,576,500 units. Based on its annual production levels, the capacity utilization in Thailand is more than 85%. In contrast, with production capacity in the Philippines pegged at about 230,000 units (2008), capacity utilization is only about 29%.67 The comparative cost structure between the Philippines and Thailand highlights two critical problems faced by the local auto industry:
- a small domestic market (in an industry where economies of scale is important) that is being competed for by a number of players (including those which import CBUs), and
- low level of parts localization. The Philippine parts and components sector has about 256 companies, producing around 330 different parts and components made of metals, plastic, rubber, and composite materials. Of the parts manufacturers, around 124 are considered as first-tier manufacturers (direct suppliers of domestic automotive assemblers); while the rest are mostly small and medium enterprises (SMEs). In contrast, Thailand, in 2002, already had about 1,800 locally-based parts suppliers, with about 700 belonging to the first-tier.68 As a result, the industry, despite its potential to serve as a leading output catalyst, has failed to make a significant impact on the economy. Its share of total value of industrial output is only 4.3%; while contributing only 2.3% of total employment.
67 Industry capacity estimate is based on the presentation of Atty. Homer Maranan, Secretary General of the Chamber of Automotive Manufacturers and Producers, Inc. during the seminar on “The Present Situation of the Philippine Auto Industry and Its Position in East Asia,” December 2007 at the UA&P, as contained in the UA&P SGRA Report No.002 (2008). 68 Aldaba. Policy Notes. p4.

CRC Foundation Inc. - - The Global Recession and the Philippine Economy
166
Table 7.4 Contribution to Total Industry
Total Industry (in Php)
Manufacture of Motor Vehicles
(in Php)
Share of Motor Vehicles to
Total Philippine Industries
No. of Firms 6,554 126 1.9% Total Value of Output 2,912,184,831 125,754,261 4.3% Employment 1,025,814 23,539 2.3% Value-Added 684,837,519 21,573,460 3.2% Total Revenue 2,949,134,088 138,297,565 4.7%
Source of Basic Data: NSO
7.2 Impact of the Crisis on the Auto Industry
Trade represents a considerable part of the Philippine economy—with the absolute share of exports to GDP at 43%, and imports at 42%. However, it is still a domestic-oriented economy, with domestic private consumption accounting for close to 70% of total GDP. In contrast, in neighboring countries such as Thailand and Malaysia, private consumption expenditures account for only about 50% of GDP. During periods of high global growth, the Philippines’ relatively lower share of exports to GDP (compared with Thailand’s 73% and Malaysia’s 110%) prevents it from experiencing greater economic expansion. However, during times of global contraction, a large domestic-oriented market provides a higher level of resiliency to the country.
Table 7.5 Structure of Gross Domestic Product
2007, in %, based on current prices
PCE * Gov't. ** GDCF *** Exports Imports
RP 69 10 15 43 (42)
Japan 57 18 24 18 (16)
Thai 53 13 27 73 (66)
Indon 63 8 25 29 (25)
Malay 46 12 22 110 (90)
Viet 65 6 42 77 (90)
China 37 14 44 41 (31)
India 55 10 38 21 (24)
* Private Consumption Expenditure; ** Gov't. Consumption
*** Gross Domestic Capital Formation
Source: Asian Development Bank

CRC Foundation Inc. - - The Global Recession and the Philippine Economy
167
The Philippine automotive industry is domestic-oriented and is less exposed to the depressed global demand. There are specific companies though which are more reliant on exports, for instance those which use the Philippines as hub for regional production under the ASEAN Industrial Cooperation (AICO) scheme. Previous growth in domestic demand has been driven by availability (i.e. ease of availment and low interest cost) of financing and buoyant demand from OFWs and their families. Based on interviews, as well as business news reports, about 70% of brand-new car buyers rely on bank loans; while OFWs account for about 25% of the market for vehicles.
7.2.1 Trends in Loan Rates
Despite the global financial crisis, the financing environment has been relatively conducive to the growth of the auto industry. Average loan rates in the country had been relatively stable over the past decade, resulting in higher auto loan availments.
Figure 7.5
Chart 5. Average Loan Rate (in %, average annual rates)
0
5
10
15
20
25
30
1982 1987 1992 1997 2002 2007
Year
%
8.28%
Source: www.bsp.gov.ph
28.23%
18.39%
Equally important, the crisis does not seem to have led to a substantial deterioration in auto loan payments—which, if it materializes, could lead banks to be more conservative in lending to car buyers (e.g. by increasing loan rates, increasing downpayment levels, shortening loan repayment terms, adopting stricter applicant screening procedures, etc.). In the first three quarters of 2008, auto loans (ALs) have

CRC Foundation Inc. - - The Global Recession and the Philippine Economy
168
been relatively stable; and there was no significant increase in non-performing loans (NPLs).
Table 7.6 Auto Loan Indicators
Universal, commercial & thrif banks As of end periods indicated, in Php B
March
'08 June '08 Sept '08
Total Auto Loans (AL) 76.559 79.084 77.171 - Performing 72.298 75.042 73.241 - Non-Performing 4.261 4.041 3.931 Total Loan Portfolio (TLP) 2,137.409 2,325.543 2,393.360 Non-Performing Loans (NPL) 133.257 133.725 140.348 Total ALs to TLP(%) 3.58 3.4 3.22 Non-Performing ALs to total NPLs (%) 3.2 3.02 2.8 Non-Performing ALs to TLP (%) 0.2 0.17 0.16 Non-Performing ALs to total ALs (%) 5.57 5.11 5.09 Source: www.bsp.gov.ph
In fact, according to Ms. Elizabeth Lee, President of the Chamber of Automotive Manufacturer’s and Producers, Inc. (CAMPI), what has been important for the sustained sales of the auto industry “is the stable financing environment which allows
buyers to take out loans to finance their purchases.” 69
This sentiment was echoed by Mr. Froilan Dytianquin, Assistant Vice President for Marketing Services of Mitsubishi Motors Philippines Co. (MMPC). Aside from the introduction of new models and model variants, he attributes Mitsubishi’s notable sales performance “to
the aggressiveness of financial institutions to accept auto financing loans, especially
for entry level buyers such as small-medium entrepreneurs and OFWs.” Mr. Dytianquin added that: “Unlike other markets, we believe that the local financial institutions remain to be healthy and have actually kept the local automotive industry buoyant in the midst of the global recession.”70
7.2.2 Trends in OFW remittances
In terms of OFW remittances, the inflow of remittances has surprisingly been robust even in the face of the global crisis. OFW remittances account for roughly 9% of total GNP (2008).
69 As cited in CAMPI: Local Auto Sales Climb 4.6% in May. CAMPI: Local Auto Sales Climb 4.6% in May. June 9, 2009. (www.tsikot.com, accessed June 2009) 70 Mitsubishi Motors Philippines Registers Impressive 32% Growth in 1Q 2009. May 22, 2009. (www.tsikot.com, accessed June 2009)

CRC Foundation Inc. - - The Global Recession and the Philippine Economy
169
Vehicles are popular among OFWs not only for their personal use but also for pursuing possible business opportunities, e.g. for the logistics needs of their small businesses or for shuttle services.
Table 7.7 Overseas Filipinos' Remittances
annual, in '000 US$
000 US$ growth 2003 7,578,458 2004 8,550,371 13% 2005 10,689,005 25% 2006 12,761,308 19% 2007 14,449,928 13%
2008 p/ 16,426,854 14%
Jan-Mar 2008 3,950,481 2009 4,057,029 3%
Source: www.bsp.gov.ph
In 2008, even with the crisis, OFW remittance increased by 14% in dollar terms. For the first quarter of 2009, remittances managed to grow by 3%.
7.2.3 Trends in Fuel Prices
Another important factor that affects sales of motor vehicles is the price of fuel. This may however have a counter-intuitive effect as higher fuel prices may actually attract car owners to buy smaller, more fuel efficient vehicles or shift from gas-powered engines to diesel or even hybrid fuel—thereby, at least initially, increasing vehicle sales. It is noteworthy that sales of vehicles even increased in early 2008 at the height of fuel price increases. The global crisis has however eased the upward pressure on fuel prices. From a high of almost Php60 per liter of unleaded fuel in July 2008 (Metro Manila), fuel price had consistently gone down to reach a low of about Php31 in February 2009. In general, this has made it more affordable to own and use a vehicle. Fuel prices have started to again increase with signs of impending global economic recovery.

CRC Foundation Inc. - - The Global Recession and the Philippine Economy
170
Figure 7.6
Chart 6. Fuel Price(Php per liter, unleaded, Metro Manila)
-
10
20
30
40
50
60
70
J-
06
F-
06
M-
06
A-
06
M-
06
J-
06
J-
06
A-
06
S-
06
O-
06
N-
06
D-
06
J-
07
F-
07
M-
07
A-
07
M-
07
J-
07
J-
07
A-
07
S-
07
O-
07
N-
07
D-
07
J-
08
F-
08
M-
08
A-
08
M-
08
J-
08
J-
08
A-
08
S-
08
O-
08
N-
08
D-
08
J-
09
F-
09
M-
09
Php
59.76
31.14Source:
Based on DOE (www.doe.gov.ph) reported
prices of Shell, Caltex & Petron; selected days
of the month; months with missing prices were
based on average of previous & succeeding
months.
7.2.4 Summary: Impact of Crisis on Vehicle Sales
While the sales of brand-new vehicles in the country have not yet even returned to its pre-1997 level, the industry was at least able to grow, albeit at a slower pace in 2008. In fact, even in the first quarter of 2009, the industry still managed to grow slightly by 2.6%. This is in sharp contrast to the more than 50% contraction being reported in the North America (which includes the United States).
Table 7.8 New Vehicle Sales
(annual, sales in units, growth in %) RP North America
Year units growth units growth
2000 83,949 23.3% 206,033,967 0.5%
2001 76,670 -8.7% 186,534,550 -9.5%
2002 85,587 11.6% 197,232,449 5.7%
2003 92,336 7.9% 191,891,111 -2.7%
2004 88,075 -4.6% 189,508,877 -1.2%
2005 97,063 10.2% 189,029,245 -0.3%
2006 99,541 2.6% 183,229,317 -3.1%
2007 117,903 18.4% 181,414,609 -1.0%
2008 124,449 5.6% 152,645,706 -15.9%
Jan-Mar
2008 28,907 41,693,778
2009 28,564 2.6% 20,033,755 -52.0%
Source of basic data: CAMPI for RP data; www.csm.com for North American figures

CRC Foundation Inc. - - The Global Recession and the Philippine Economy
171
The Philippines, thus is relatively still in a better situation than most other countries. Its domestic orientation has been sustaining the industry. The industry is expected to register flat growth this year—as long as the following are sustained: stable interest rates on auto loans, inflow of OFW remittances, and stable (and low) fuel prices.
Figure 7.7
Chart 7. Monthly New Vehicle Sales (in units, 2006-March 2009)
0
2000
4000
6000
8000
10000
12000
14000
January February March April May June July August September October November December
2006
2007
2008
2009
Source of Basic Data: CAMPI

CRC Foundation Inc. - - The Global Recession and the Philippine Economy
172
Impact of the Crisis on Sales of Automotive Industry
Current Situation Impact of the Crisis Possible Interventions
Loan rates
• Despite the global financial crisis, the financing environment has been relatively conducive to the growth of the auto industry. Average loan rates in the country had been relatively stable over the past decade, resulting in higher auto loan availments.
• The crisis does not seem to have led to a substantial deterioration in auto loan payments—which, if it materializes, could lead banks to be more conservative in lending to car buyers (e.g. by increasing loan rates, increasing downpayment levels, shortening loan repayment terms, adopting stricter applicant screening procedures, etc.). In the first three quarters of 2008, auto loans (ALs) have been relatively stable; and there was no significant increase in non-performing loans (NPLs).
• Unlike other markets, it seems that the local financial institutions remain to be healthy and have actually kept the local automotive industry buoyant in the midst of the global recession.
• Financial institutions should further come up with more attractive auto loan rates
• The government can also come up with its own auto loan system that can encourage consumers to buy cars
OFW Remittances
• In terms of OFW remittances, the inflow of remittances has surprisingly been robust even in the face of the global crisis. OFW remittances account for roughly 9% of total GNP (2008).
• In 2008, even with the crisis, OFW remittance increased by 14% in dollar terms. For the first quarter of 2009, remittances managed to grow by 3%.
• The government should continue to look for fresh job opportunities abroad to sustain growth in remittances
• Encourage competition among banks offering transfer of remittances services to bring down transfer fees

CRC Foundation Inc. - - The Global Recession and the Philippine Economy
173
Impact of the Crisis on Sales of Automotive Industry
Current Situation Impact of the Crisis Possible Interventions
• Vehicles are popular among OFWs not only for their personal use but also for pursuing possible business opportunities, e.g. for the logistics needs of their small businesses or for shuttle services.
Fuel prices
• Another important factor that affects sales of motor vehicles is the price of fuel. This may however have a counter-intuitive effect as higher fuel prices may actually attract car owners to buy smaller, more fuel efficient vehicles or shift from gas-powered engines to diesel or even hybrid fuel—thereby, at least initially, increasing vehicle sales. It is noteworthy that sales of vehicles even increased in early 2008 at the height of fuel price increases.
• The global crisis has however eased the upward pressure on fuel prices. From a high of almost Php60 per liter of unleaded fuel in July 2008 (Metro Manila), fuel price had consistently gone down to reach a low of about Php31 in February 2009. In general, this has made it more affordable to own and use a vehicle.
• The government and oil companies must have a concerted effort to make sure that domestic prices really reflect the movements of oil prices in the world market

CRC Foundation Inc. - - The Global Recession and the Philippine Economy
174
Impact of the Crisis on Sales of Automotive Industry
Current Situation Impact of the Crisis Possible Interventions
Overall Sales
• While the sales of brand-new vehicles in the country have not yet even returned to its pre-1997 level, the industry was at least able to grow, albeit at a slower pace in 2008. In fact, even in the first quarter of 2009, the industry still managed to grow slightly by 2.6%. This is in sharp contrast to the more than 50% contraction being reported in the North America (which includes the United States).
• The Philippines, thus is relatively still in a better situation than most other countries. Its domestic orientation has been sustaining the industry. The industry is expected to register flat growth this year—as long as the following are sustained: stable interest rates on auto loans, inflow of OFW remittances, and stable (and low) fuel prices.
• Implement more effectively EO 156

CRC Foundation Inc. - - The Global Recession and the Philippine Economy
175
7.3 Recommendations
This paper will concentrate on viable short-term recommendations to help the industry cope with the impact of the global financial crisis. However, a short review of the experience of Thailand—considered as the automotive hub in Southeast Asia—may be illustrative.
7.3.1 The Experience of Thailand
In the late 1980s to early 1990s,71 as the Japanese Yen appreciated, manufacturing capacity left Japan and migrated to other countries to maintain competitiveness. In addition, automotive companies saw an opportunity to consolidate production in regional hubs as: (1) quantitative restrictions declined globally as well as tariffs and (2) regional trade initiatives accelerated to promote intra-region trade and production, e.g. the ASEAN Industrial Cooperation (AICO) scheme. In Southeast Asia, Thailand was chosen by automotive manufacturers to be their regional hub for market and policy considerations. First, automotive manufacturing, as noted earlier, is sensitive to economies of scale. Hence, locating in a country with a larger vehicle market size and better growth prospects can make it easier for an assembler to attain economies of scale.72 In ASEAN, Thailand had the largest domestic market. For instance, from 1989–1996, Thailand’s annual vehicle sales of slightly more than 400 thousand units accounted for about 42% of total vehicle sales in the ASEAN 4 (i.e. Thailand, Indonesia, Malaysia, and the Philippines). Indonesia had about 27%; Malaysia, 21%; and the Philippines, 10%.73 Second, policy environment also played a critical role. In general, investors—including auto manufacturers—would want to invest in countries which have more liberal and stable policy environments. Policy consistency is especially important especially considering the amount of investments involved and the long period within which these can be recovered. Thailand had the edge in terms of the policy environment. For example, unlike Malaysia, it never had an explicit policy of developing its own national car and was therefore seen as offering a “level playing field.” Neither did it have an explicit target in nationalizing local parts, as was the case in Indonesia and the Philippines.74 And, although Thailand had high tariff rates on auto, it was the first country to begin unilaterally liberalizing its automotive industry. It was also more consistent with its policies than the Philippines and, most especially, Indonesia. Furthermore, it committed to remove the local content rule by 2000, along with foreign ownership restrictions.
71 For instance, the 1985 Plaza Accord triggered significant increase in Japan FDI outflows. 72 Kohpaiboon (2004) noted that an efficient scale can be attained at 40,000 to 50,000 units per model (page 14) 73 Kohnpaiboon (2004) page 14 74 (Doner, 1991: p.61); as cited in p. 15 Pookhabia.

CRC Foundation Inc. - - The Global Recession and the Philippine Economy
176
Equally important, Thailand had consistently subjected the commercial vehicle segment to lower tariffs and consumption (excise) tax (i.e. compared with passenger vehicles). As a result, the price of a one-ton pickup in Thailand was about half that of a medium-size passenger car. This allowed the country to attain economies of scale in the one-ton pick-up segment and enhanced its competitiveness as regional hub for these vehicles. In fact, it had become the world’s second largest production base for one-ton pickups.75
7.3.2 Implications for the Philippines
1. Long-term measures The Philippines would have to make a decision on whether it would like to develop its own automotive industry. As mentioned, the industry has the potential to significantly contribute to the economy. However this requires a large domestic market base and a stable policy environment. Though Thailand is already ahead in terms of being a regional hub, it is currently faced with difficult challenges as its production is more intricately related to the global market and it has been intermittently experiencing political turmoil. Now is the most opportune time for the Philippines to aggressively present itself as an alternative regional production hub for specific types of vehicles (e.g. hybrid vehicles). This will however require reviewing the current Motor Vehicle Development Program to ensure that a stable and consistent policy framework, with realistic goals and targets, is formulated and implemented. This will encompass questions on fiscal incentives, tariff differentials (between CBU and CKD parts), taxes, human resource and development, international promotions, and other relevant investment policy variables; as well as policies on used vehicle importation, quality and standards, etc. The whole exercise should be geared towards providing a stable and consistent framework, identifying specific segments or niches where the country can still be competitive, and—at least in the identified segment or niche—making the country more attractive than Thailand and even China. An alternative policy option, however, is for the country to abandon its motor vehicle development program and follow market-based policies with respect to the importation of vehicles. This policy, while foregoing the economic benefits from having a fully-developed automotive industry, will provide car buyers with choices—both in terms of quality, service, and price. In a few years, after the market has sufficiently enlarged, the country may by then have already become an attractive production location for automotive manufacturers.
75 (Doner et al., 2004: p. 187-188). Doner, R. F., G. W. Noble, and J. Ravenhill (2004), ‘Production Networks in East Asia's Auto Parts Industry’, in S. Yusuf, M.A. Altak and K. Nabeshima (eds.), Global Production Networking and Technological Change in East Asia, Oxford University Press, Washington, DC.

CRC Foundation Inc. - - The Global Recession and the Philippine Economy
177
7. Short-term measures Regardless of the choice, however, the current crisis compels the implementation of measures to assist the industry in the short-term. While the industry’s domestic orientation somehow insulates it from the crisis, the industry will, at best, register flat growth for this year. Moreover, it must be emphasized that this same domestic orientation prevents the local auto industry from taking advantage of any global upswing. There are a number of measures that can be recommended, albeit with varying chances of actually being implemented. These include:
- Exchange rate depreciation – some economists76 have argued that the Philippine peso is overvalued (e.g. some estimates put this at about 20%). Its impact has been to make the imported parts and CBUs less expensive. While some industry players have been complaining about the free trade agreement (FTA) talks which the government has engaged in, the impact of an overvalued exchange rate on the sector’s price competitiveness is conceivably greater.
- Reduction in taxes – taxes on new vehicles average about 20% of their retail price. Economists have noted that, based on the first quarter GNP results, income (e.g. OFW remittances) seems to still continue flowing into the economy but consumer confidence and purchases seem to bee down. In the United States, as well as other developed economies, governments have offered tax rebates (e.g. for families who will buy vehicles for the first time) to spur people to buy cars.
To the extent that tax rebates will encourage families who were previously not intending to buy a new car, it will be revenue neutral for the government.
- Encourage buying locally-assembled vehicles – previous motor vehicle development programs contain provisions that encourage buying locally-assembled over imported CBUs. For instance, governments were mandated to buy locally-assembled Asian Utility Vehicles (AUVs). Such a stipulation may however no longer be allowed given the rules under the multilateral trading system. An alternative way of pursuing this, however, can be in terms of providing specifications slanted to favor locally-assembled vehicles. For instance, as some LGUs have now been buying newly-introduced China-made brands, a requirement can be in terms of having products which have been proven—for a number of years—to be acclimatized with Philippine road conditions, a wider dealership network (e.g. to ensure after-sales service), etc. Given a diffused industry, policies that favor locally-produced / assembled vehicles may not be as unanimously supported at present. Industry players now consist of those which import CKDs and assemble the units here, those which import CBUs, and those which do both. Moreover, whereas in the past the
76 For instance, Prof. Benjamin Diokno of the U.P. School of Economics and Professors Victor Abola and Emilio Antonio, Jr. of the University of Asia and the Pacific.

CRC Foundation Inc. - - The Global Recession and the Philippine Economy
178
industry was dominated by Japanese manufacturers, today there this dominance is being challenged by American, Korean, and Chinese brands. Vehicle buyers would also be adversely affected by such as policy.
- Prevent the importation of second-hand vehicles. Based on industry interviews, however, the most important measure that should be implemented is the prohibition of the importation of second-hand vehicles. However, while for certain sectors this simply means the implementation of E.O. 156 (i.e. the Motor Vehicle Development Program), it has actually taken a complex legal question. Suffice to say, this contributes to an industry development framework that is not stable and inconsistent. It must be emphasized though that it is the most realistic policy response and the one which will yield the largest impact. Aside from being a complex legal issue, it also requires considerable political will.

CRC Foundation Inc. - - The Global Recession and the Philippine Economy
179
8. Assessing the Impact of Global Economic Slowdown on Philippine Regions and the Subic-Clark-Batangas Corridor
Enrico L. Basilio77
While the global economy is going through a “storm”, the
Philippines must seize this opportunity to prepare itself for the
eventual takeoff that will take place sooner than expected. An
assessment of the macro-economy indicates the country’s resiliency in
the midst of the financial crisis. However, there are some export-
oriented sectors that exhibited certain levels of vulnerabilities –
automotive, electronics, tourism, agri-business. Similarly, these
industry-based effects are likewise felt in specific regions where the
exporters and manufacturers of these products operate. The good news
is that the impact has been minimal and the administrations of special
economic zones in Clark, Subic and CALABA areas have instituted
programs to mitigate the effects of the economic slowdown.
On the transport sector, the rapid expansion of the Strong
Republic Nautical Highway (SRNH) and the service efficiency and cost
reduction the system brought about have provided the economy a
welcome relief. It has cushioned the impact of the reduction of fleet
capacity in domestic trade due to the recent maritime tragedy. There
are proponents for a region-wide adoption of the RO-RO concept in
South Asia to improve “regional connectivity”. The massive
development of land transport infrastructure in the Greater Mekong
Sub-region supports this initiative. In line with this, the National
Competitiveness Council (NCC) is pushing for the development of the
Subic-Clark-Batangas Corridor to promote the country as a regional
logistics and transshipment hub. But to attain this vision, there
remains some tasks that needs to be competed – i.e., further investment
in infrastructure to address gaps (e.g., high speed rail system from
Clark to Central Business Districts in Manila, NLEX-SLEX connection
via C6), and policy enhancements to promote greater public-private
partnerships in infrastructure development.
77 Senior Economist, University of Asia and the Pacific and Director, CRC Transport and Logistics Institute .The author would like to thank the assistance of Messrs. Rafael Hernandez and Keene Antolm Calipara, CRC Transport and Logistics Institute, in the preparation of this paper.

CRC Foundation Inc. - - The Global Recession and the Philippine Economy
180
8.1 Decline in Global Output, Trade and Transport
The collapse of global investment banking and the resulting credit crunch led to the sharp decline in industrial production, commercial operations, and capital spending across the world. The World Bank (2009) forecasts a 6.1% reduction in the volume of world trade in goods and services. The estimated growth for East Asia and the Pacific will ease at 5.3% in 2009, mainly because of weaker export demand. Roughly 6% of total containership fleet capacity has been laid up as of February 2009. Furthermore, this global economic malaise is causing havoc on the global supply base especially in developing countries. China, for one, has closed down more than 150,000 factories of various sizes at the end of 2008. The automotive sector have also felt the havoc as the Big Three US automakers have filed bankruptcy which will impact not only domestic suppliers but also the offshore suppliers that make up an increasingly important share of auto parts supply.
Figure 8.1 GDP Forecasts of Select Economies
Source: World Economic Outlook, IMF (2008) The Philippines is not totally immune from the effects of this economic
slowdown. While the macroeconomy remains stable, effects are felt in specific export-oriented industries such as electronics, automotive, tourism, and agribusiness. These sectors of the economy have manifested certain levels of vulnerabilities. The decline in the consumer electronics industry has already affected the entire electronics value chain, right from the raw material suppliers, chipset manufacturers, silicon foundries, computer manufactures. In January 2009, electronic exports sunk by about 50.3% y-o-y. Since electronics manufacture is dependent on imported raw materials, its continuous decline will pull down both export receipts as well as import expenditures. In fact, electronic products which accounts for 35% of country’s total imports, sharply declined by 46% in December 2008 (UA&P, March 2009).
0.0
1.0
2.0
3.0
4.0
2002
2003
2004
2005
2006
2007
2008F
2009F
US Euro Area Japan

CRC Foundation Inc. - - The Global Recession and the Philippine Economy
181
8.2 Impact on the Philippine Regions
Similarly, these industry-based effects are likewise felt in specific regions where the exporters and manufacturers of these products operate. The 2008 regional GDP figures affirm this observation. From a record-high of 7.2% growth in 2007, the Philippines only managed to grow by 4.6% in GDP. The marked decline in economic output can be observed in regions where the heavily hit industries (electronics, automotive) operate. Together, these regions (NCR, Central Luzon, CALABARZON, Western and Central Visayas) account for 68% of the country’s total GDP.
Table 8.1 Philippine Region’s Growth Trends (2006 – 2008)
REGION / YEAR 2006 2007 2008 PHILIPPINES 5.6% 7.2% 4.6%
NCR METRO MANILA 7.5% 7.8% 5.1%
CAR CORDILLERA 3.8% 7.2% 3.0%
I ILOCOS 5.5% 5.8% 3.5%
II CAGAYAN VALLEY 8.0% 6.6% 3.7%
III CENTRAL LUZON 4.9% 6.1% 3.6%
IVA CALABARZON 4.3% 5.5% 3.8%
IVB MIMAROPA 1.6% 9.4% 7.3%
V BICOL 2.8% 7.7% 4.9%
VI WESTERN VISAYAS 4.2% 7.7% 5.9%
VII CENTRAL VISAYAS 5.1% 8.7% 4.6%
VIII EASTERN VISAYAS 4.6% 3.2% 5.3%
IX ZAMBOANGA PENINSULA
1.9% 7.4% 4.5%
X NORTHERN MINDANAO 7.8% 7.9% 5.6%
XI DAVAO REGION 3.6% 6.7% 4.2%
XII SOCCSKSARGEN 6.8% 6.8% 3.9%
ARMM MUSLIM MINDANAO 3.7% 5.4% 2.6%
XIII CARAGA 6.6% 8.6% 0.9%
Sources: NSO; Philippine Statistical Yearbook 2008

CRC Foundation Inc. - - The Global Recession and the Philippine Economy
182
Table 8.2
Philippine Regions and Share to Total Gross Domestic Product
REGION 2007 % Share in
GDP 2008
% Share in GDP
PHILIPPINES – TOTAL GDP 1,369 100 1,432 100 NCR METRO MANILA 447 32.6% 470 32.8%
CAR CORDILLERA 30 2.2% 31 2.2%
I ILOCOS 40 3.0% 42 2.9%
II CAGAYAN VALLEY 27 2.0% 28 2.0%
III CENTRAL LUZON 114 8.3% 118 8.2%
IVA CALABARZON 166 12.1% 172 12.0%
IVB MIMAROPA 38 2.7% 40 2.8%
V BICOL 38 2.8% 40 2.8%
VI WESTERN VISAYAS 99 7.2% 105 7.3%
VII CENTRAL VISAYAS 98 7.2% 103 7.2%
VIII EASTERN VISAYAS 29 2.1% 31 2.1%
IX ZAMBOANGA PENINSULA 35 2.6% 37 2.6%
X NORTHERN MINDANAO 68 4.9% 71 5.0%
XI DAVAO REGION 62 4.5% 64 4.5%
XII SOCCSKSARGEN 48 3.5% 50 3.5%
ARMM MUSLIM MINDANAO 12 0.9% 12 0.9%
XIII CARAGA 18 1.3% 18 1.3%
Sources: NSO; Philippine Statistical Yearbook 2008 * 2007 and 2008 values in million pesos
Accordingly, some locator-firms operating in special economic and freeport zones scaled down operations and laid-off some workers. In Subic, two major electronics companies have laid-off approximately 5,000 workers. As a result of decline in maritime trade and increase of ships being laid-up, few orders for ship construction were cancelled. On a positive note, the downtrend in container fleet capacity worldwide provides some opportunities for ship lay-ups. Currently, twenty (20) international vessels are laid-up in Subic. Another ship lay-up facility is being developed in Davao. SBMA is trying to address and manage the crisis by: (1) offering re-tooling and livelihood programs to displaced workers (so that they can be re-integrated in other manufacturing companies; (2) assisting locators in availing loans from local and foreign banks; and (3) providing rental adjustments. In Clark, employment is minimally affected. While companies slowed down their operations, minimal lay-offs occurred. About 2,000 workers from 12 firms were displaced as of December 2008. Of the 12 companies, 6 are into garments manufacture, 4 in ICT, and 2 from the industrial sector. These laid-off workers account for only 3% of the total employment level in Clark. It is, however, important to point out that most of the displaced workers were contractual employees hired during peak season. In any case, some Clark locators companies organized their workers in shifts to mitigate the lay-offs and provide everyone the opportunity to work and earn. And by January 2009, despite the crisis and the lay-offs, Clark’s employment reached its record-high level (57,790 workers). This is mainly attributable to the increase in actual investments (roughly P69 billion) from various
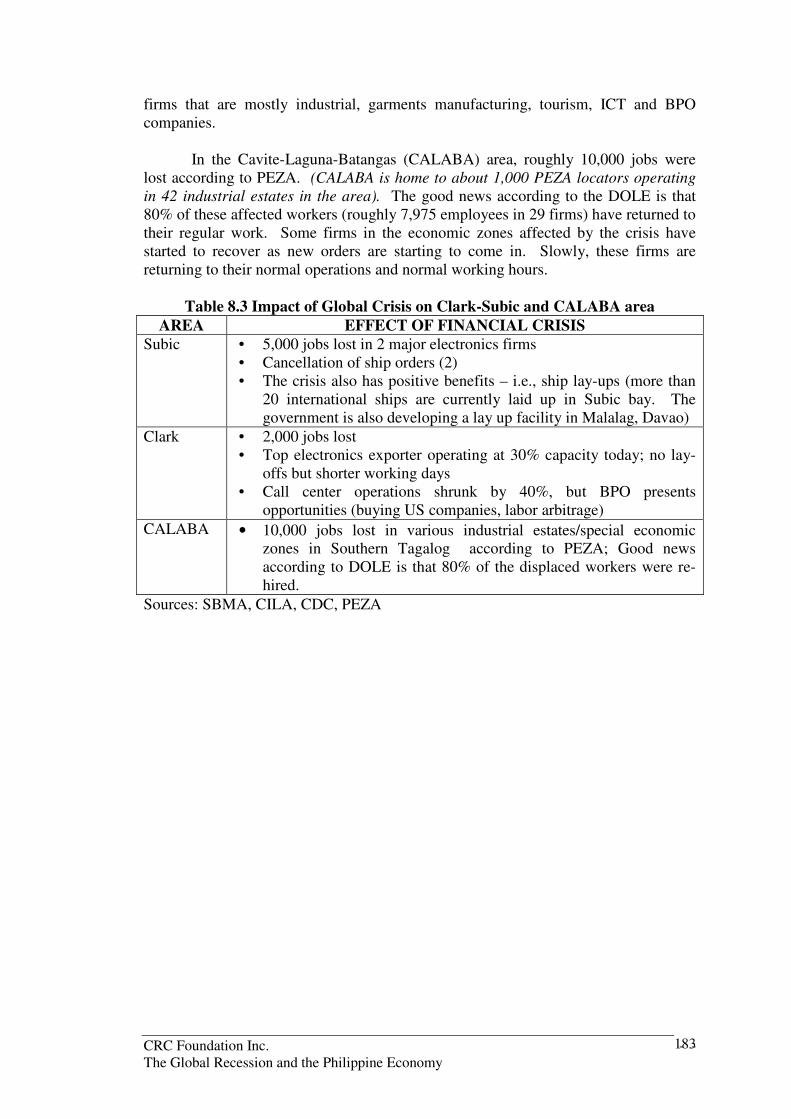
CRC Foundation Inc. - - The Global Recession and the Philippine Economy
183
firms that are mostly industrial, garments manufacturing, tourism, ICT and BPO companies.
In the Cavite-Laguna-Batangas (CALABA) area, roughly 10,000 jobs were lost according to PEZA. (CALABA is home to about 1,000 PEZA locators operating
in 42 industrial estates in the area). The good news according to the DOLE is that 80% of these affected workers (roughly 7,975 employees in 29 firms) have returned to their regular work. Some firms in the economic zones affected by the crisis have started to recover as new orders are starting to come in. Slowly, these firms are returning to their normal operations and normal working hours.
Table 8.3 Impact of Global Crisis on Clark-Subic and CALABA area AREA EFFECT OF FINANCIAL CRISIS
Subic • 5,000 jobs lost in 2 major electronics firms • Cancellation of ship orders (2) • The crisis also has positive benefits – i.e., ship lay-ups (more than
20 international ships are currently laid up in Subic bay. The government is also developing a lay up facility in Malalag, Davao)
Clark • 2,000 jobs lost • Top electronics exporter operating at 30% capacity today; no lay-
offs but shorter working days • Call center operations shrunk by 40%, but BPO presents
opportunities (buying US companies, labor arbitrage)
CALABA • 10,000 jobs lost in various industrial estates/special economic zones in Southern Tagalog according to PEZA; Good news according to DOLE is that 80% of the displaced workers were re-hired.
Sources: SBMA, CILA, CDC, PEZA

CRC Foundation Inc. - - The Global Recession and the Philippine Economy
184
Impact of the Crisis on Subic-Clark-CALABA area Impact of the Crisis Possible Interventions
Subic
• 5,000 jobs lost in 2 major electronics firms
• Cancellation of ship orders (2)
• The crisis also has positive benefits – i.e., ship lay-ups (more than 20 international ships are currently laid up in Subic bay. The government is also developing a lay up facility in Malalag, Davao)
Clark
• 2,000 jobs lost
• Top electronics exporter operating at 30% capacity today; no layoffs but shorter working days
• Call center operations shrunk by 40%, but BPO presents opportunities (buying US companies, labor arbitrage)
CALABA
• 10,000 jobs lost in various industrial estates/special economic zones in Southern Tagalog according to PEZA; Good news according to DOLE is that 80% of the displaced workers were rehired.
• The government in coordination with private sector must continue to implement infrastructure development along the Subic-Clark-Area to promote more employment and growth in this area.
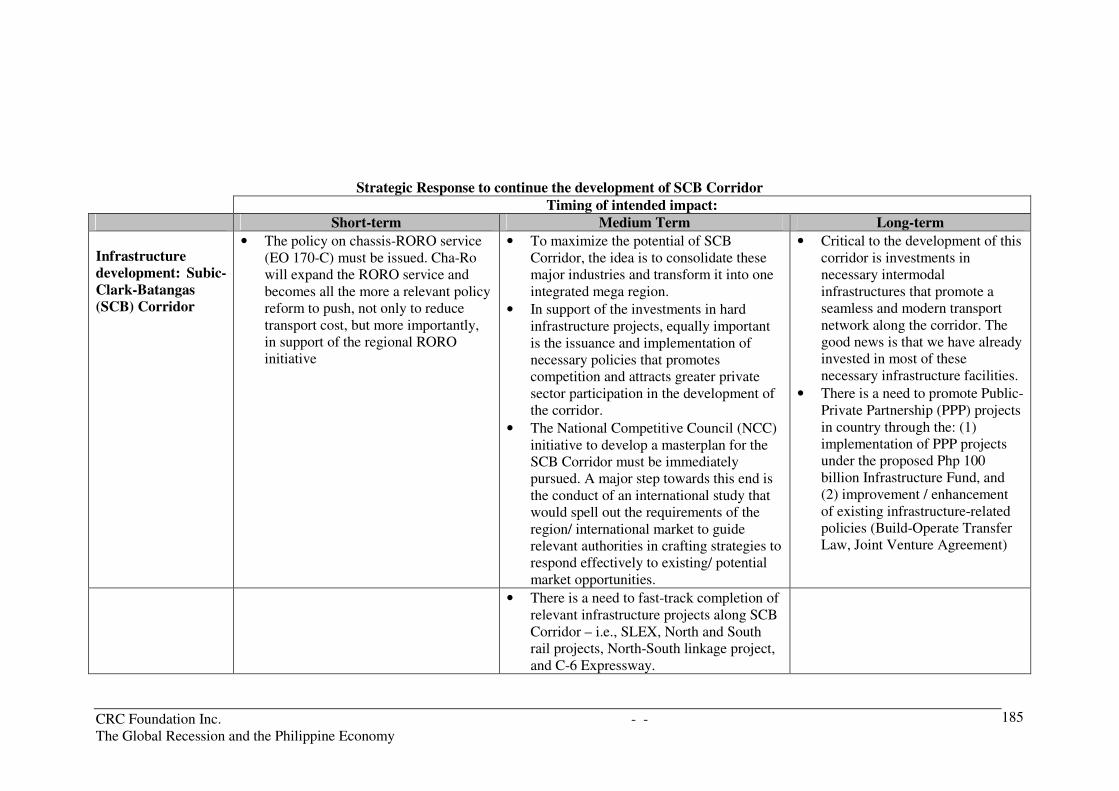
CRC Foundation Inc. - - The Global Recession and the Philippine Economy
185
Strategic Response to continue the development of SCB Corridor
Timing of intended impact: Short-term Medium Term Long-term
Infrastructure development: Subic-Clark-Batangas (SCB) Corridor
• The policy on chassis-RORO service (EO 170-C) must be issued. Cha-Ro will expand the RORO service and becomes all the more a relevant policy reform to push, not only to reduce transport cost, but more importantly, in support of the regional RORO initiative
• To maximize the potential of SCB Corridor, the idea is to consolidate these major industries and transform it into one integrated mega region.
• In support of the investments in hard infrastructure projects, equally important is the issuance and implementation of necessary policies that promotes competition and attracts greater private sector participation in the development of the corridor.
• The National Competitive Council (NCC) initiative to develop a masterplan for the SCB Corridor must be immediately pursued. A major step towards this end is the conduct of an international study that would spell out the requirements of the region/ international market to guide relevant authorities in crafting strategies to respond effectively to existing/ potential market opportunities.
• Critical to the development of this corridor is investments in necessary intermodal infrastructures that promote a seamless and modern transport network along the corridor. The good news is that we have already invested in most of these necessary infrastructure facilities.
• There is a need to promote Public-Private Partnership (PPP) projects in country through the: (1) implementation of PPP projects under the proposed Php 100 billion Infrastructure Fund, and (2) improvement / enhancement of existing infrastructure-related policies (Build-Operate Transfer Law, Joint Venture Agreement)
• There is a need to fast-track completion of
relevant infrastructure projects along SCB Corridor – i.e., SLEX, North and South rail projects, North-South linkage project, and C-6 Expressway.

CRC Foundation Inc. - - The Global Recession and the Philippine Economy
186
NCR METRO MANILA - -
CAR CORDILLERA 1 0.01
I ILOCOS 1 0.78II CAGAYAN VALLEY - -
III CENTRAL LUZON 4 31.02
IVA CALABARZON 4 8.57IVB MIMAROPA 1 0.03
V BICOL 3 1.42VI WESTERN VISAYAS 4 13.06
VII CENTRAL VISAYAS 5 2.38
VIII EASTERN VISAYAS 3 0.16IX ZAMBOANGA PENINSULA - -
X NORTHERN MINDANAO 4 18.71XI DAVAO REGION 1 0.42
XII SOCCSKSARGEN 1 0.0015
ARMM MUSLIM MINDANAO - -XIII CARAGA - -
32 76.6
Number of
Projects
Completed
Total
Spending
TOTAL
REGION
8.3 Infrastructure Development as a Key to Mitigating the Impact of the Crisis
Infrastructure creates a direct impact on the country’s economic growth and
global competitiveness. Good roads and bridges expand market opportunities, lower the cost of goods and services, and enable countries to use their productivity. The impact of infrastructure on trade, tourism, industries and technology development, not forgetting poverty alleviation and reduction of income inequality, is remarkable in those Asian countries which adequately invested on infrastructure projects to attract foreign investments and to achieve global competitiveness.
Table 8.4 Completed Infra Projects by Region (as of December 2008; in Billion Pesos)
Realizing the importance of investing on infrastructure, the government since 2006 has implemented a 5-year infrastructure development program. As of December 2008, 32 key infrastructure projects of different types (roads, airport, seaports, energy projects) were completed to the tune of Php77 billion. Much of the actual expenditures went to Central Luzon (Region III), CALABARZON (region IV-A), Western Visayas (Region VI), and Northern Mindanao (Region X). The big ticket projects completed in region 3 – which got the highest share in total spending (40%) – include the Subic-Clark-Tarlac Expressway and Subic Bay Port Terminals 1 and 2. These projects are critical to the integrated development of Subic-Clark-Batangas Corridor. In CALABARZON, the Southern Tagalog Arterial Road was extended from Lipa City to Batangas City (STAR 2) to provide seamless road link to the Batangas International Port. Meanwhile, two major airports were constructed in Western Visayas, particularly in Sta. Barbara, Iloilo and Silay, Bacolod. These two new airports and the other ongoing airport projects in Visayan region will be part of intra-regional and extra-regional air transport system that will make key tourist destinations in the Central Philippines more accessible. Lastly, two power plants in Misamis Oriental, Northern Mindanao were built to increase and ensure the sufficient supply of energy in the region. With higher spending and stricter monitoring of projects, the government is now bent on ensuring the timely and effective implementation of the remaining SONA commitments. There are 122 social and physical infrastructure projects more across
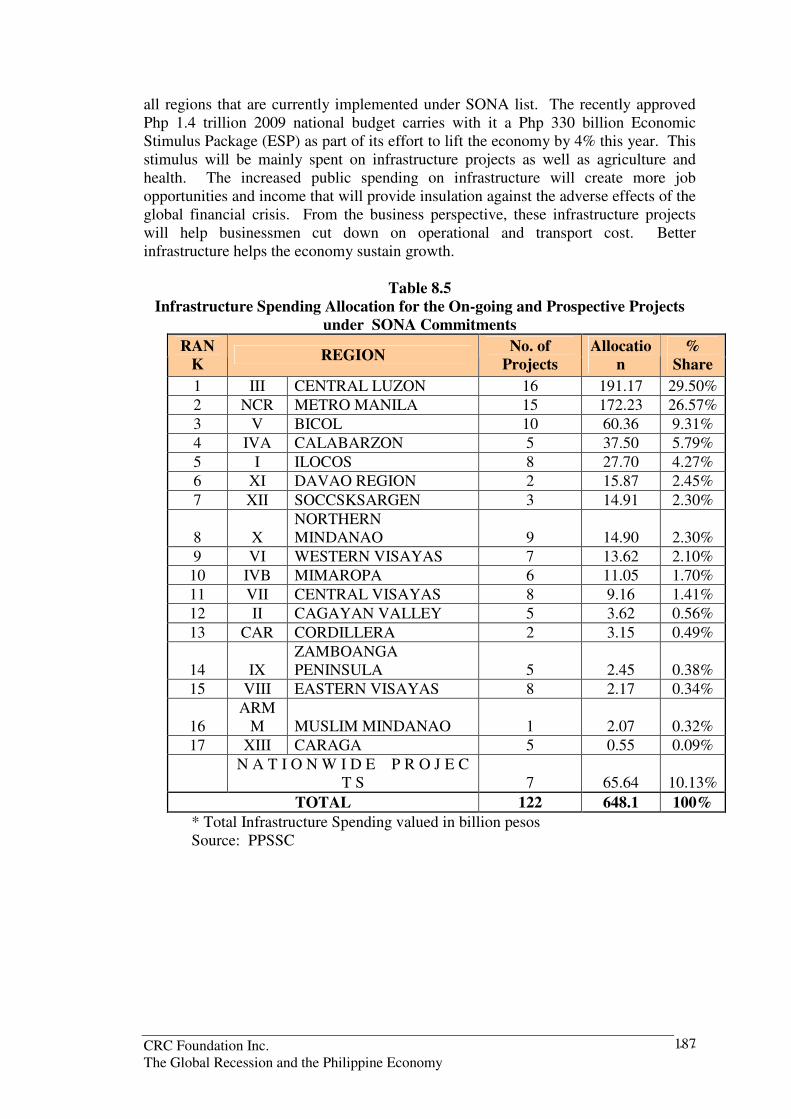
CRC Foundation Inc. - - The Global Recession and the Philippine Economy
187
all regions that are currently implemented under SONA list. The recently approved Php 1.4 trillion 2009 national budget carries with it a Php 330 billion Economic Stimulus Package (ESP) as part of its effort to lift the economy by 4% this year. This stimulus will be mainly spent on infrastructure projects as well as agriculture and health. The increased public spending on infrastructure will create more job opportunities and income that will provide insulation against the adverse effects of the global financial crisis. From the business perspective, these infrastructure projects will help businessmen cut down on operational and transport cost. Better infrastructure helps the economy sustain growth.
Table 8.5 Infrastructure Spending Allocation for the On-going and Prospective Projects
under SONA Commitments
RANK
REGION No. of
Projects Allocatio
n %
Share
1 III CENTRAL LUZON 16 191.17 29.50%
2 NCR METRO MANILA 15 172.23 26.57%
3 V BICOL 10 60.36 9.31%
4 IVA CALABARZON 5 37.50 5.79%
5 I ILOCOS 8 27.70 4.27%
6 XI DAVAO REGION 2 15.87 2.45%
7 XII SOCCSKSARGEN 3 14.91 2.30%
8 X NORTHERN MINDANAO 9 14.90 2.30%
9 VI WESTERN VISAYAS 7 13.62 2.10%
10 IVB MIMAROPA 6 11.05 1.70%
11 VII CENTRAL VISAYAS 8 9.16 1.41%
12 II CAGAYAN VALLEY 5 3.62 0.56%
13 CAR CORDILLERA 2 3.15 0.49%
14 IX ZAMBOANGA PENINSULA 5 2.45 0.38%
15 VIII EASTERN VISAYAS 8 2.17 0.34%
16 ARM
M MUSLIM MINDANAO 1 2.07 0.32%
17 XIII CARAGA 5 0.55 0.09%
N A T I O N W I D E P R O J E C
T S 7 65.64 10.13%
TOTAL 122 648.1 100%
* Total Infrastructure Spending valued in billion pesos Source: PPSSC

CRC Foundation Inc. - - The Global Recession and the Philippine Economy
188
8.4 From Inter-Island Connectivity to Regional Connectivity
An archipelagic country with fragmented island economies, the Philippines is invariably affected by accessibility and mobility for the transport of goods and people within its geographical boundaries. In 2003, the national government laid down a policy initiative supporting a transport infrastructure network that will later become a major “legacy” program of the administration. Dubbed as the RO-RO Road Terminal System (RRTS) with its government-initiated marketing program Strong Republic
Nautical Highway (SRNH), the system is aimed at binding local economies more closely together and working for better domestic integration through Roll on-Roll off (RO-RO) vessels or “moving bridges.” The RO-RO policy is embodied in Executive Order 170 which encourages private sector investments in the development of the RRTS.
Figure 8.2
In sum, implementing the RRTS presented both market opportunities for business as well as infrastructure support facilities required to make the RRTS work. On the market side, the RRTS altered the way (a) tourism was promoted; (b) goods were transported and distributed - i.e. reducing transport costs and improving efficiency in loading/unloading of cargoes; and (c) people mobility was enhanced. It also presented a new approach in countryside development and agriculture-fisheries sector modernization.
Strong Republic Nautical Highway
Matnog, Sorsogon
Allen, Sama r
Li loan, SouthernLeyte
Lipata, Surigao
De l Sur
Pi lar, Sorsogon
Aro roy, Masbate
Cawayan, Masbate
Daanbantayan,Cebu
Mandaue City,
CebuTagbil aran,
Bohol
Jagna, Bohol
Mambajao,
Camiguin
Guinsi liban,Camiguin
Bal ingoan, Misami s
Orie nta l
Batangas City,Batangas
Calapan, Orienta lM indoro
Roxa s, OrientalMindoro
Caticlan, A klan
Dumangas, Il olio
Dumaguete, NegroOriental
Dapi tan, Zamboangadel Norte
Ba colod, Negros Occidental
CE NT ER F OR R ESE A RC H A ND COMMUNICA T ION
Weste rn Nautical Highway
Central Nautical Highway
Eastern Nautical Highway
Legend:

CRC Foundation Inc. - - The Global Recession and the Philippine Economy
189
Figure 8.3
Western, Central and Eastern Nautical Highways
The Western, Central, and Eastern Nautical Highways serve as the main routes of the SRNH system that efficiently link up Mindanao and Luzon through the islands of Visayas. There are also east-west lateral RORO links that connect these major nautical highways.
The Western and Central-Eastern Nautical Highways are complementary. Traffic in the Eastern seaboard did not decline (in fact it continued to grow) with the establishment of Western seaboard. What RO-RO operations affected was the direct long-haul Liner shipping operations from Manila to Iloilo, Dumaguete, and Cebu. This is the locus of competition. RO-RO also softened the impact of the Liner shipping crisis in June (2008). The grounding of the Sulpicio ships as a result of the Princess of the Stars tragedy reduced the supply of ships that would transport the goods and people within the country. It was RO-RO that provided the alternative mode of sea transport. In general, transport costs increased in recent years due to the steep rise in fuel prices worldwide. The efficiency of RO-RO operations provided the countervailing force to mitigate the rising costs. Agricultural products passing through the SRNH include fruits and vegetables as well as fishery products coming all the way from General Santos and Davao. Mineral products such as nickel, chromite, silica and limestones are shipped out from Surigao. For some routes in the Central Nautical Highway as well as east-west lateral connections (e.g., Cebu-Tubigon, San Carlos-Toledo), palay, rice, copra, live animals, fishery products, fruits and vegetables top the list of major agricultural commodities that are transported by RO-RO. RO-RO likewise facilitates the movement of agri-fisheries products (largely marine, seaweeds and livestock) in the Southwestern Mindanao network. Tourism, particularly in Cebu, Boracay, Dapitan and Bohol benefitted much from RO-RO operations. Given the domestic success of RO-RO in the Philippines, there are proponents who are pushing for the expansion of the concept to cover the South Asian region. The Asian Development Bank is organizing a 2nd Regional Connectivity Conference in October 2009 to discuss further this initiative. At the recent APEC Transport Ministers Meeting in Manila, a similar initiative was presented and was approved at the plenary for inclusion in the July meeting in Singapore as part of its efforts to facilitate trade and investment in the Asia-Pacific Region by accelerating economic integration through the enhancement of regional physical connectivity “across the border”. This requires the improvement of logistics and transport network/systems
Dumangas, Iloilo
Cebu
Bohol
Punta Enganio,
Jetafe, Bohol
Toledo, Cebu
San Carlos, Negros
Bacolod
Ubay, Bohol
To Caticlan To Masbate To Samar
To CamiguinTo Zamobanga
CENTER FOR RESEARCH CENTER FOR RESEARCH AND COMMUNICATIONAND COMMUNICATION
Dumangas, Iloilo
Cebu
Bohol
Punta Enganio,
Jetafe, Bohol
Toledo, Cebu
San Carlos, Negros
Bacolod
Ubay, Bohol
To Caticlan To Masbate To Samar
To CamiguinTo Zamobanga
CENTER FOR RESEARCH CENTER FOR RESEARCH AND COMMUNICATIONAND COMMUNICATIONCENTER FOR RESEARCH CENTER FOR RESEARCH AND COMMUNICATIONAND COMMUNICATIONCENTER FOR RESEARCH CENTER FOR RESEARCH AND COMMUNICATIONAND COMMUNICATION

CRC Foundation Inc. - - The Global Recession and the Philippine Economy
190
for lower cost and more efficiency in the transportation of goods, services, and people78. Strategically located at the heart of Southeast Asia, the Philippines needs to maximize its potential as a competitive logistics hub to enhance trade and further integrate itself with the region. While trade within the Asia-Pacific region has been affected, there are bright prospects for the Philippines. Crises are good opportunities for critical strategies to be made that would be useful in the future. Intra-Asia trade continues to be robust.
Although the Philippines’ major trading partner countries (Japan and US) remain to be important markets, increasing trade is happening between the Philippines and its Asian neighbors. To begin with, the share Asia’s merchandise trade vis-à-vis total world trade has grown quite substantially (25%) in recent years.
Figure 8.4 Intra-Asia Trade
78 Other important measures to be adopted by APEC countries in pursuit of economic integration also include: (1) liberalizing trade and investment flows “at the border” by making the rules of origin of existing free trade agreements (FTAs) more business-friendly, identifying possible vehicles for a future FTA of the Asia-Pacific (FTAAP), and deepening the analysis of an FTAAP; and (2) improving the business environment “behind the border” through the simplification of business regulations and lowering the cost of doing business.
Intra-Asia Trade (Growth Trend)
MANILA, THE PHILIPPINES 2009
6th APEC Transportation Ministerial Meeting
27-30 April 2009
-5%
0%
5%
10%
15%
20%
25%
30%
2002 2003 2004 2005 2006 2007
Growth Rate
Intra-Asia Intra-Pacific
SOURCE: IMF

CRC Foundation Inc. - - The Global Recession and the Philippine Economy
191
Table 8.6 Trends in World Merchandise Imports
Responding to this development, the Philippines started changing gradually its trade patterns; expanding its exports toward Asian markets (China, South Korea, Hong Kong, and Taiwan. From 12% in 1997, Philippine exports to these economies have grown to 30% by 2007.
Figure 8.5 Merchandise Exports: Philippines
With the necessary infrastructures in place, the key to transforming the Philippines into a regional transshipment hub is the introduction of a “regional RO-RO system (Roll-on/Roll-off shipping) in Southeast Asia – one the will connect it with a network of key gateways. Mr. Paul Apthorp of TNT Logistics, speaking at an ADB Conference in November last year, introduced this concept and recommended that RO-RO should also be used for Southeast maritime transshipment. The economic impact / benefits of RORO system has already been realized and extensively used in Europe (North Sea, Mediterranean) for a mode of sea transport. RO-RO shipping is
C E N T E R F O R R E S E A R C H A N D C O M M U N I C A T I O N
– Th The economic “action” is happening in Asia; we don’t have to look far
Year 1948 1953 1963 1973 1983 1993 2003 2007
Value
World .62 85 164 595 1882 3787 7691 13968
Share
World 100.0 100.0 100.0 100.0 100.0 100.0 100.0 100.0
North America 18.5 20.5 16.1 17.2 18.5 21.4 22.5 19.4
South and Central America 10.4 8.3 6.0 4.4 3.8 3.3 2.5 3.3
Europe 45.3 43.7 52.0 53.3 44.2 44.6 45.0 43.4
Commonwealth of Independent States (CIS) b - - - - - 1 .2 1.7 2.7
Africa 8.1 7.0 5.2 3.9 4.6 2.6 2.1 2.6
Middle East 1.8 2.1 2.3 2.7 6.2 3.3 2.7 3.4
Asia 14 15.1 14.1 14.9 18.5 23.6 23.5 25.3
Source: WTO Statistics
World Merchandise Imports
E xp o rts o f th e P h il ipp ine s
2 0 0 7 P hilippine Me r c ha ndise Ex ports b y
Re giona l Bloc s (% S hare )
A m er ic as , 18.31
Eu ro p e, 17 .3 5
Jap an & A us tralas ia ,
16 .05
A SEA N, 15.92
Ta iwan, 3.91
Ch ina, 11.39
Ho ng Ko n g, 11.5
So u th K o re a, 3 .53
Oth er c o un tr ies, 2 .0 4
199 7 Ph i lip p in e M erch and ise Ex po rt s b y
R eg io n al B lo cs (% Sh are)
Americas, 36.75
Europe, 18.49Japan &
Aus tralasia, 17.64
China, 0.97Other countries,
1.38South Korea,
1.88
Hong Kong, 4.64
Taiwan, 4.63
ASEAN, 13.62
2 00 7
199 7
So u rce : Bur e au of E xp o rt a nd Tra de
P r om o tio ns , D T I
3 0 %
1 2 %

CRC Foundation Inc. - - The Global Recession and the Philippine Economy
192
also extensively employed as an efficient means of sea transport for bridging the various islands of the Philippine archipelago (RO-RO ships serve as “moving bridges”).
8.5 Proposed Regional RO-RO Framework for South Asia
The massive road infra development in the GMS supports the concept RORO operations in SEA
Given the extensive road infrastructure development in the Greater Mekong Sub-Region (GMS), the inter-modal transport which RO-RO offers makes the system feasible for the archipelagic SEA region. The Philippines can attract mother ships (panamax vessels) to call at the Subic or Batanagas Port if it can ensure that a regional transshipment (i.e., feedering of cargoes) can be efficiently done through the “regional RO-RO system”.
Instead of moving only the country’s 2 million import-export cargoes, the Philippines can look and take greater share of the regional transshipment traffic in the East Asian region. There are about 60 million containers annually that are being transshipped from the Pacific to Asia. In support of this initiative is the development of the Subic-Clark-Batangas Corridor. This strategy is designed not only to enhance the country’s competitiveness, but more importantly, to reduce the transport cost of Philippine exporters, decongest Metro
VTE
Singapore
Kuala Lumpur
Phnom Phen
Malaysia
Bangkok
Ho Chi Minh
Vietnam 越南越南越南越南
Laos
Myanmar
Danang
Guangzho
PXG
Cambodia
Hanoi
China
Nanning
Thailand
ZV
VT
Strong REGIONAL Nautical Highway
In the archipelagic SEA

CRC Foundation Inc. - - The Global Recession and the Philippine Economy
193
Manila, and maximize the utilization of the infrastructure built recently. It will also significantly support the development of the Philippine regions in terms of (a) providing opportunities for greater export activities, and (b) promoting value-adding activities in the Clark-Subic Freeport areas that will generate revenues and local employment. The current RO-RO system (western, central and eastern nautical highways) will serve as the domestic link. As a complementary step, the government must craft a policy that will govern the gradual transition/shift of cargoes from the Port of Manila to either Subic or Batangas as the new maritime gateways.
8.6 Subic-Clark-Batangas Corridor
The Subic-Clark-Batangas (SCB) Corridor is host to a conglomeration of variety of major industrial, commercial, and invenstment centers in the Philippines (including 24 IT parks, 39 special economic zones, and a number of BPO centers). It contributes to more than 50% of the country’s GDP. To maximize the area’s potential, the idea is to consolidate these major industries and transform it into one integrated mega region. In 2007, the President announced her vision to develop the SCB Development Corridor as a major Transshipment and Logistics Hub in the Asian region - a logistics area where value-adding services can be provided. The market, therefore, is not limited to
the Philippine economy but considers the growing economies of Asia.
Critical to the development of this corridor is investments in necessary intermodal infrastructures that promote a seamless and modern transport network along the corridor. The good news is that we have already invested in most of these necessary infrastructure facilities.
Mamburao
Calapan
MINDOROORIENTAL
MINDOROOCCIDENTAL
TARLAC
ZAMBALES
PAMPANGA
BULACAN
QUEZON
BATANGAS
CAVITELAGUNA
Lucena City
San Pablo City
Sta. Cruz
Antipolo City
Calamba
Cavite City
MANILA BAY
Tayabas Bay
Lamon BayLaguna
de
Bay
LakeTaal
Manila
Balanga City
Olongapo City
Angeles City
Tarlac City
City of San Fernando
Malolos City
San Jose del Monte City
Iba
Tagaytay City
Lipa City
Batangas City
RIZAL
CENTRAL
LUZON
CALABARZON
BATAAN
Clark and Subic as logistics center
SUBIC
CLARK
Urban industrial beltway:
Central Luzon-CALABARZON
Growth Corridor
Batangas as Int’l. Port south of Manila
Mamburao
Calapan
MINDOROORIENTAL
MINDOROOCCIDENTAL
Mamburao
Calapan
MINDOROORIENTAL
MINDOROOCCIDENTAL
TARLAC
ZAMBALES
PAMPANGA
BULACAN
QUEZON
BATANGAS
CAVITELAGUNA
Lucena City
San Pablo City
Sta. Cruz
Antipolo City
Calamba
Cavite City
MANILA BAY
Tayabas Bay
Lamon BayLaguna
de
Bay
LakeTaal
Manila
Balanga City
Olongapo City
Angeles City
Tarlac City
City of San Fernando
Malolos City
San Jose del Monte City
Iba
Tagaytay City
Lipa City
Batangas City
RIZAL
CENTRAL
LUZON
CALABARZON
BATAAN
Clark and Subic as logistics center
SUBIC
CLARK
Urban industrial beltway:
Central Luzon-CALABARZON
Growth Corridor
Batangas as Int’l. Port south of Manila

CRC Foundation Inc. - - The Global Recession and the Philippine Economy
194
Table 8.7
Cost of Completed Infra Projects in the Subic- Clark-Batangas Corridor
Over the last decade, a total of $1.5 billion worth of infrastructure has been put in place to support the development of the Subic-Clark-Batangas Corridor. Because of their strategic locations, Subic and Batangas are being developed as full-blown maritime hubs. Clark, on the other hand, was designated by the President as the international premier gateway of the country because of its great potential to be an aviation hub in Asia.
Two new container terminals in Subic were completed in 2008 to increase Subic Port’s annual capacity to 600,000 twenty-equivalent units (TEUs). In Clark, the newly expanded and upgraded passenger terminal building of Diosdado Macapagal International Airport (DMIA) basically doubles the current capacity from 1 million to 2 million passengers a year. A second terminal is being proposed for construction in DMIA with a handling capacity of 7 million passengers per annum. The Subic-Clark-Tarlac Expressway (SCTEx) will connect the major areas of Central Luzon, dramatically reducing travel time from Manila to Clark (from 3 hours to 1 ½ hours) and Manila to Tarlac (from 2-3hours to 1 ½ hours). The continuous network of highways from Clark/Subic to Metro Manila to Batangas Port is almost complete. The rehabilitation of the North Luzon Expressway (NLEX) which connects Metro Manila was completed a few years ago. Meanwhile, the ongoing expansion and rehabilitation of South Luzon Expressway (which connects Manila to the cities of Alabang, Cavite, and Laguna) is expected to be completed by December 2009. This highway is likewise being extended from Calamba, Laguna to Sto. Tomas, Batangas to interconnect it to the Southern Tagalog Arterial Road (STAR). The STAR toll road, on the other hand, was extended all the way to Batangas City, giving ease of access to the International Port of Batangas. The Circumferential Road 5 (C-5) extension project is ongoing. This is designed to provide alternate link between SLEX to NLEX.
Railroad projects are also being put into place to provide mobility to goods and people and connectivity from North and South Luzon. The ongoing Northrail project is designed to connect the existing transit system in Manila to Pampanga. Rehabilitation and upgrading of existing railway tracks along Caloocan to Calamba is likewise ongoing Down south, the Southrail project will upgrade the existing railway line from Calamba to Lucena.
C E N T E R F O R R E S E A R C H A N D C O M M U N I C A T I O N
Infrastructure Project COST
Clark International Airport Expansion &
UpgradingUS$ 37.4M
Subic Port Development Project US$ 230.0M
Subic-Clark-Tarlac Expressway Project
(SCTEx)US$ 504.3M
North Luzon Railway Phase 1 US$ 503.4 M
North Luzon Expressway Rehabilitation US$ 226.4M

CRC Foundation Inc. - - The Global Recession and the Philippine Economy
195
To address the problem of urban congestion along major thoroughfares, the government is expanding existing metro rail lines/network. The ongoing LRT Line 1 North Extension project aims to extend the existing LRT line 1 to close the EDSA loop. The MRT 7 project is designed to extend the light rail system (outside of Metro Manila) all the way to San Jose Del Monte in Bulacan. Similarly, there is a proposal to extend the LRT Line 1 south of Metro Manila (all the way to Bacoor, Cavite). Once completed, the amalgamation of these lightrail systems will improve access to/within central Manila by providing off-street public transport connections to and from the congested northern portion and the rapidly growing southern portion of Metro Manila.
In support of the investments in hard infrastructure projects, equally important is the issuance and implementation of necessary policies that promotes competition and attracts greater private sector participation in the development of the corridor. Summarized in Table 7 are some of the transport policy concerns.

CRC Foundation Inc. - - The Global Recession and the Philippine Economy
196
Table 8.8 Summary of Transport Policy Concerns
TRANSPORT POLICIES
Issues
Ports and Maritime • Designation of Subic and Batangas as principal maritime gateways for Luzon
• Phased shift of present maritime traffic from Manila ports to Subic & Batangas
• Promotion of intra-and inter-port competition. Intra-port competition among operators of NCT 1 and 2.
• Issue Chassis-RORO (Cha-RO) policy
Air • Need to issue EO 500-B to define air transport policy for DMIA
• Pursue and conclude more bilateral talks/negotiations with other countries
• Develop Masterplan for DMIA considering market size and growth, logistics requirements for people and cargoes.
Road and Rail • Provide common-user bus terminal facility outside Metro Manila connected to MRT 7 line for provincial bus operators to unclog traffic in Metro Manila
• Provide high-speed rail system from Clark to CBDs of Metro Manila
• Northrail, Southrail and Linkages to complement cargo movements along corridor.
Logistics Hub Operations
• Conduct an international market survey on the logistics requirements of the region
• Use this information � To attract locators to invest in the Subic-Clark-
Batangas corridor � To promote logistics and value-adding activities � To enhance plans for the further development of the
Corridor
8.7 Next Steps
To address the necessary infrastructure requirements - both hard (physical) and soft (policies) – critical to the development of the corridor and realization of regional connectivity, we recommend the following actionable measures:
a. The National Competitive Council (NCC) initiative to develop a masterplan for the SCB Corridor must be immediately pursued. A major step towards this end is the conduct of an international study that would spell out the requirements of the region/ international market to guide relevant authorities in crafting strategies to respond effectively to existing/ potential market opportunities.

CRC Foundation Inc. - - The Global Recession and the Philippine Economy
197
b. The policy on chassis-RORO service (EO 170-C) must be issued. Cha-Ro will expand the RORO service and becomes all the more a relevant policy reform to push, not only to reduce transport cost, but more importantly, in support of the regional RORO initiative
c. There is a current effort to craft a Philippine Merchant Shipping Law to address the flaws in existing policies and provide an environment conducive to the development and modernization of the maritime sector. The passage of this Act will hopefully improve our global competitiveness and “credibility” as a maritime centre – both in terms of administration and arbitration
d. There is a need to fast-track completion of relevant infrastructure projects along SCB Corridor – i.e., SLEX, North and South rail projects, North-South linkage project, and C-6 Expressway.
e. There is a need to promote Public-Private Partnership (PPP) projects in country through the: (1) implementation of PPP projects under the proposed Php 100 billion Infrastructure Fund, and (2) improvement / enhancement of existing infrastructure-related policies (Build-Operate-Transfer Law, Joint Venture Agreement).

CRC Foundation Inc. - - The Global Recession and the Philippine Economy
198
9. Revitalizing the Philippine Metallic Mining Industry
Winston Conrad B. Padojinog
Coleen G. Hubo The metallic minerals industry is one of government’s priority projects. The sector is envisioned to generate much-needed jobs and dollar earnings from mineral exports and investments. While the recent softening of world prices has stolen some of the glitter from our mining prospects, long term rewards from the industry remain bright. When the global economy finally recovers from the recession, the Philippine mining industry must be ready to help satisfy the world’s appetite of for metallic minerals. Stagnating for almost two decades and a half, the mining industry in the Philippines is being revived in connection with poverty alleviation and countryside development efforts. Mining activities can unlock the value of mineral reserves and can positively impact the Philippine economy in terms of: employment, foreign investments and exports, as well as fiscal stability of local communities as mining companies generate royalty and tax payments, income taxes, business licenses, fees and social and community development. The public and private sectors are looking for ways to revitalize the mining sector under a public-private partnership framework. The government needs meaningful information on the kind of assistance or support the private sector needs in terms of a fiscal stimulus package or other means. The private sector needs a to take a more comprehensive view of obstacles facing the sector’s development and how it can best use private initiatives in overcoming these.
Objectives
This paper seeks to: a. Determine the primary drivers of development in the Philippine metallic
mining industry; b. Analyze the current state of development of the metallic mineral sector and
its impact on the Philippine economy; c. Identify obstacles hindering revitalization of the metallic mineral sector; and d. Recommend concrete action programs to help overcome obstacles facing the
metallic mineral sector in the Philippines.

CRC Foundation Inc. - - The Global Recession and the Philippine Economy
199
Study Framework
The structure of the Philippine metallic mining industry is defined by external and internal drivers. To a large extent, the growth and the development of the mining industry is influenced by these drivers. Internal drivers refer to country advantages that make the Philippines an attractive site for mineral investments. External drivers refer to global forces that affect the financial and credit markets, policies governing mining development and prices as well as demand for and supply of metallic minerals. Only a brief discussion will be devoted to external factors since, being a small and young player, the Philippine mining industry has little influence on global market forces. A discussion of the structure and development of the metallic industry will cover the sector’s contribution to the economy in terms of jobs, exports and investments, the status of mining projects, and possible nodes of impact a revitalized mining sector can give to the national economy in general and regional economies in particular.
Study Framework
Given an appreciation of the state of the industry as well as its potential impact on the economy, the study will highlight obstacles to the development of the Philippine metallic industry as perceived by various stakeholders, especially local mining industry players and their investors, local governments and regulatory agencies. The views reflect those raised in three round-table discussions and a recent study of the 2009 Fraser Institute Annual Survey of Mining Companies. The study presented how executives rank the Philippines in various aspects of mining operations. We will conclude by recommending a set
Global Market for Metals
Structure of the Philippine Metallic Mining Industry • Present contribution to the economy (Investments, Exports, Jobs)
• Production Structure, Status of Projects
• Nodes of Impact on National & Regional Domestic Economies
External Obstacles
Country Advantage • Mineral Endowments
• National Regulatory Framework
Internal Obstacles
Public-Private Partnership Initiatives in Overcoming the
Hurdles

CRC Foundation Inc. - - The Global Recession and the Philippine Economy
200
of concrete action programs that may help overcome the obstacles identified. These recommendations to some extent must work within a public-private partnership framework.
9.1 Drivers of the Development In The Mining Industry
9.1.1 External Drivers of the Metallic Mining Industry
External drivers are keys to putting the Philippines on the radar of mining companies. These external drivers push developments in the local industry as investors and buyers search for prospects in the country. The huge demand for metals and soaring global prices revived interest in mining in the Philippines. Though recent softening of metallic prices have stalled growth, this is seen as mostly temporary. Sooner or later, a recovering global economy will feed a rising demand for minerals. The global movement for responsible mining will have direct implication on mining practices in the Philippines. In the past, destructive mining practices by companies had received worldwide condemnation, forcing mining companies to seriously consider not only to the economic but also environmental and social impacts of their activities. Many mining companies have responded to rapidly changing stakeholder expectations by committing themselves to higher standards than those required by their host country. For instance, the industry has recognized the need and obligation to identify and mitigate the adverse environmental consequences of its activities and have formulated CSR policies to capture its responsibilities to communities, workers and the environment.79 The World Bank further observes, “The stakes for mining companies operating in developing countries are getting higher since they risk losing their social and political “license to operate”—the unspoken agreement and understanding with civil society, both on the ground and in the realm of international politics, that a particular operation is desirable and should be supported, rather than actively opposed. Losing this license to operate can have dire financial consequences, ranging from falling share prices to loss of access to capital.”80
9.1.2 Internal Drivers of the Metallic Mining Industry
Internal drivers on the other hand refer to country factors which are within the control of the Philippines and which push development in the local metallic mining industry. Nurturing these internal drivers or factors and removing
79 Hubo, C. and Padojinog, W (2007). “Rapid Assessment of the Sustainability Agenda in the Mining Industry.: A Case for Developing a Pre-Exploration and Post-Mine Development in the Philippines.” A Publication of the University of Asia and the Pacific and funded by the Shell Exploration BV Project. 80 The World Ban (2002). An Asset Competitiveness: Sound Environmental Management in Mining Countries. Washington, D.C. p. 3.

CRC Foundation Inc. - - The Global Recession and the Philippine Economy
201
obstacles to the development of the mining industry requires strategic action on the part of private stakeholders and policy makers. What are these internal drivers? There are three: vast mineral potential, favorable national law on mining, and strong government support and promotional efforts. Philippines’ mineral potential. Strategically located along the Pacific’s rim of fire, the Philippines is endowed with rich mineral resources. In the 2008/2009 Annual Survey of Mining Companies by Fraser International, the Philippines is ranked 24th out of 71 countries in terms of policy/mineral potential, assuming industry best practices and liberal regulations are in place. Note that the country was previously ranked first out of 68 countries covered in a previous Fraser survey.
It is estimated that close to 38% of the Philippine land area of 30 million hectares have high mineral potential. This translates to a little over 11 million hectares. Only about 7% or 775,377 hectares are covered by approved mining permits.
Figure 9.1 Mineral potential across the Philippines (2008)
Mineral Land:
High Potential
35%
Mineral Land:
High Potential
With Permits
3%
Low/ Limited
Potential
62%
Source: MGB

CRC Foundation Inc. - - The Global Recession and the Philippine Economy
202
Minerals in the Philippines
The Philippine geological setting, considered young and complex, offers many potential sites for mineral resources development. Mineral discovery and production in the Philippines dates back to the pre-Spanish era and has been confirmed by many geologists not in Asia and the world. Mineral endowment
• The Philippines has established reserves of about 13 known metallic and 29 non-metallic minerals. In 1996, the Mines and Geosciences Bureau’s recorded a total of 7.1 billion metric tons of metallic and 51 billion metric tons of non-metallic reported reserves.
• Copper dominates the metallic reserves, comprising 4.8 billion metric tons or 67.5% of the total. Philippines’ mineral endowment is second in the world for gold and third for copper—truly enticing figures that largely account for increasing investment interest in the Philippines.
• Limestone accounts for 57% of total non-metallic reserves, or 29 billion metric tons, followed by marble, which accounts for 16.7%, or 8.5 billion metric tons.
• The country is an important global mineral resource due to its relatively high mineral endowment ranking compared to its small land area. Based on past production and defined resources, the
Metallic mineral resources
•••• Porphyry copper plays a major role in the country’s mineral industry. It was a major commodity mined with the introduction of bulk or large-scale methods of mining. While disseminated copper is the most popular, deposits of vein, contact metasomatic, Cyprus, Kuroko and Besshi type are also significant. In the past, 35% of the country’s metallic production value came from copper.
•••• Gold is found throughout the country in the form of lode or placer deposits. The principal gold-producing districts are Baguio, Paracale, Masbate, Surigao and Masara. Experts have observed that the largest and richest gold deposits tend to lie in the vicinity of the Philippine fault zone, but there are many exceptions. Recently, gold exploration has been directed toward epithermal deposits. Silver is a by-product of copper and gold mining.
•••• The bulk of chromite deposits in the country are found in Zambales Province and Dinagat Island (Surigao), off northeastern Mindanao. Individual chromite bodies are of various sizes—from small pods to several million tons. The chromite deposit in Coto, Zambales was believed to be the largest known deposit of refractory chromite in the whole world.
•••• The country is also greatly endowed with nickel-rich deposits of laterites, which are currently the source of its nickel export. The vast laterite deposits are known; the bulk of the country’s deposit are lateric type, formed by concentration during the processes of tropical weathering. Cobalt is an important by-product of nickel.
•••• Other metallic mineral deposits such as platinum, iron, manganese, lead, zinc, molybdenum, mercury and aluminum are dispersed throughout the geological terrain of the Philippines.
Non-metallic mineral resources
• Non-metallic deposits such as coal, fertilizer, salt, sand and gravel, marble, clay, feldspar, dolomite, magnesite, phosphate rock, guano, sulfur, industrial gemstone and decorative minerals also abound and are major sources of material for construction, agriculture and power generation.
Source: Minerals Industry Profile, Mines & Geosciences Bureau (MGB)

CRC Foundation Inc. - - The Global Recession and the Philippine Economy
203
A favorable regulatory environment. The Mining Act of 1995 and its implementing rules and regulations are the governing documents outlining the legal requirements for mine development in the country. Experts consider the act a model framework for social and environmental initiatives in sustainable development.81 It was designed to transform the “environmental and social responsibilities of mining operators as major cost centers.”82 Under the Act, mining companies are obliged to allocate:
• 10% of capital investments for environment-related structures
• 3–5% for annual environmental programs
• 1% of direct mining and milling costs for social and community development
• 1% of annual gross revenues as royalty to indigenous groups, if present in the mining area
• the cost of mine rehabilitation and decommissioning, including costs of 10 year maintenance and monitoring period
• a monitoring fund for the multi-partite monitoring committee (DENR, LGU, mining company, host community and accredited NGO)
The law also contains social and environmental safety nets far stronger than those in previous mining laws and regulations. It has:83
• Built-in protection for indigenous peoples through the prior informed consent requirement, making the Act possibly the only mining law in the world that contains such requirement. This pre-date the free and prior informed consent (FPIC) requirement of the Indigenous Peoples Rights Act of 1997;
• Equitable sharing of the benefits of mining among major stakeholders: the national and local government, communities and the mining company. Under the prescribed fiscal regime, the benefits of mining are shared approximately 50-50 between the government and the contractor. The government’s half is further divided into 50% for the national government, 10% for the provincial government and 20% each for the municipality and host barangays; and
• Environmental and social provisions that are comparable, if not better than similar provisions in mining laws of established countries. During the World Bank Mine Closure and Sustainable Development Workshop in 2000, the Philippines was among the nations considered to “have [a] comprehensive policy and legislation that provides for both comprehensive mine closure and post-mining sustainable development.” The Social Development and Management Program (SDMP) was also cited as a “tool for community participation.” The SDMP is meant for the development of the host and neighboring communities and is managed by the communities
81 Impressions of various speakers during the various mineral consultations and workshops conducted in 2002 and 2003 by the Mines and Geosciences Bureau and the World Bank. 82 Cabalda, et. al.(2002). “Sustainable Development in the Philippine Minerals Industry: A Baseline
Study.” IIED (UK), p. 6. 83 Cited from the Information, Education, and Communication materials of Mines and Geosciences Bureau.

CRC Foundation Inc. - - The Global Recession and the Philippine Economy
204
themselves together with the mining company, with guidance from the government and site-based NGOs. In addition, the national wealth sharing scheme prescribed by the Local Government Code of 1991—in 40% of mining taxes collected by the national government flows back to the local community—was cited as “one of the only few wealth-sharing schemes of such nature in the world.”
• Competitive fiscal regime. The fiscal regime is a major consideration among investors. The fiscal regime of the Philippines is considered competitive not only in Asia but throughout the world, according to an independent study done by the Institute for Global Resources Policy and Management of the Colorado School of Mines (CSM) in the United States in 2000.
The Supreme Court in July 2005 ruled with finality in favor of the constitutionality of the Mining law and affirming the prerogative of the president and Congress to enter into financial or technical assistance agreements with foreign parties to explore, develop and utilize the country’s mineral resources. This paved the way for foreigners to render 100% participation in financial or technical assistance agreements, and in exploration and mineral processing permits in mining. Now that the channel for foreign ownership has opened, foreign investors in the mining industry can benefit from incentives under the mining law. These include:
(a) Fiscal incentives like tax exemptions, tax credits on supplies and additional deductions from taxable incomes. Specifically, this can mean tax holidays during recovery of pre-operating expenses for a maximum of five years from commercial production, income tax carry forward of losses, accelerated depreciation of fixed assets and exemption from payment of real property taxes on pollution control devices;
(b) Non-fiscal incentives like employment of foreign nationals, simplified customs importation procedures and importation of consigned equipment for a period of 10 years;
(c) Investment guarantees like repatriation of capital, freedom from expropriation, remittance from earnings and interest on foreign loans, freedom from requisition of properties and confidentiality of information.
Indeed, the Mining Act has spurred a remarkable change in the way mining operations are carried out in the country. The strong environmental component of the Act, which was largely driven by lessons from the negative impact of previous mining activities, addresses many concerns of stakeholders. However, some stakeholder groups have increasingly tied environmental concerns to social justice issues such as worker rights, economic justice and gender discrimination. The shift from regulation to promotion by the national government is manifested by the passage of the National Minerals Policy and Executive Order 270.84
84 The discussion of these two policies are excerpted from “Rapid Assessment of the Sustainability Agenda in the Mining Industry: A Case for Developing a Pre-Exploration and Post-Mine Development in the Philippines” by Hubo and Padojinog (2007) published by the University of Asia & the Pacific in cooperating with the Shell Exploration BV Project.

CRC Foundation Inc. - - The Global Recession and the Philippine Economy
205
National Minerals Policy. The government’s National Minerals Policy (NMP) aims to address the interlinked issues of environmental and social impact and “promote sustainable development through responsible mining practices.”85 The policy has four major policy thrusts:
• Protection and rehabilitation of the environment
• Promotion of social and community stability
• Preservation of options for future generations
• Establishment of a competitive and prosperous minerals industry Each policy thrust consists of specific policy objectives that address specific issues relating to the Precautionary Principle; the Polluter Pays Principle; Free and Prior Informed Consents in Ancestral Domain Areas; the Role of NGOs and LGUs; Community Development; Consensus Building; and Mine Rehabilitation. The NMP also aims to address some of the barriers to the growth of mining in the country. Among them:
• High production costs associated with labor-intensive practices, rising labor costs and growing trade union militancy;
• Higher taxation levels with complex royalty, excise, realty, capital goods, income and value-added taxes;
• High interest rates with foreign financial bodies not willing to provide long term loans due to fears of policy instability;
• Complex procedures for issuance of mining contracts and permits and the lack of investment assistance centers that can provide information and advisory services to mining applicants and other prospective mining investors;
• A lengthy approval process for grant of Environmental Compliance certificates (ECC) for mining projects especially for environmentally critical projects.
The National Minerals Policy (NMP) was launched following the National Mining Conference in December 2003 where the President Gloria Arroyo signed Executive Order 270 outlining the National Policy Agenda on Revitalizing Mining in the Philippines. Executive Order 270. EO 270 put into action President Arroyo's pronouncement regarding the policy shift in mining—from one of tolerance to promotion—in recognition of the industry’s potential economic contribution. It “aims to promote responsible mineral resources exploration, development and utilization to enhance economic growth, in a manner that adheres to the principles of sustainable development and with due regard for justice and equity, sensitivity to the culture of the Filipino people and respect for Philippine sovereignty.”86 EO 270 underscored principles that will guide the revitalization based on points agreed on during the consultation process among government, industry and civil society groups as well as other stakeholders. The process culminated in a National Mining Conference in December 2003 after which EO 270 was signed
85 Director Horacio Ramos of MGB in a speech before the Philippine Minerals Exploration Association (February 2003). 86 BusinessWorld, 22 January 2004.

CRC Foundation Inc. - - The Global Recession and the Philippine Economy
206
along with the adoption of an action plan to address outstanding mining issues on:
• The critical role of investments in the mineral industry;
• Clear, stable and predictable investment and regulatory policies;
• Value-adding of minerals and mineral products;
• Promotion of the small-scale mining sector as a formal sector;
• Use of efficient technologies in extraction and utilization of minerals;
• Integration of environmental protection. mitigation and progressive rehabilitation in mining operations;
• Safeguarding the ecological integrity of areas affected by mining including biodiversity and small-island ecosystem;
• Pursuit of multiple land use and sustainable utilization of minerals;
• Remediation and rehabilitation of abandoned mines;
• Equitable sharing of economic and social benefits from mining;
• Enhancing public awareness and respect for the rights of communities;
• Institutionalizing a continuous and meaningful consultation process with industry and all other stakeholders.
The Order also directed the DENR to formulate the Minerals Action Plan (MAP) based on these principles in consultation with all stakeholders, to be submitted to the Office of the President. The top priorities for the MAP include the remediation and rehabilitation of abandoned mines and pursuing accountability for the negative impacts of mining.
9.2 Structure of the Philippine Metallic Mining Industry This section introduces the different stages that mining companies will have to go through before and after full commercial production. It will also discuss the current economic impact of mining in the Philippines, the production structure, status of mineral permits, and the different ways by which mining activities will impact the national economy and local economies.

CRC Foundation Inc. - - The Global Recession and the Philippine Economy
207
Figure 9.2 Critical Phases in minerals development
Commercial
Production
Exploration
Feasibility
1. Necessary Exploration Permit to be issued by
MGB
2. Environmental Work Program (EWP)
3. Certificate of Env’t Management & Community
Relations Record (CEMCRR)
4. Baseline Environmental and Social Data
(company option, not mandated by law but
encouraged by some Regional MGBs)
5. Community Technical Working Group (CTWG)
(not mandated by law during exploration but
encouraged by some Regional MGBs)
6. Mineral Resources Database
Environmental Impact Statement
(EIS) by Company
• Environmental Protection and
Enhancement Program (EPEP)
• Safety and Health Program
Development/
ConstructionEstablishment of
Contingent Liability
and Rehabilitation
Fund (CLRF)
Environmental Trust
Fund (ETF)
Mine Rehabilitation
Fund (MRF)
-Rehabiliation Cash
Fund (RCF)
- Monitoring Trust
Fund (MTF)
Mine Wastes and Mill
Tailings Reserve
Fund (MWTRF)
Mine Rehabilitation/
Decommissioning Site Inspection,
Monitoring & Audit
Mine Decommissioning
Plan (MDP), prepared 10
yrs before mine closure
Pre-development
Environmental Compliance
Certificate (ECC) issued by
Environmental Mgt Bureau
Establishment of
Multipartite
Monitoring Team
(MMT)
Social Development
Management
Program (SDMP)
1
2
3
4
5
Commercial
Production
Exploration
Feasibility
1. Necessary Exploration Permit to be issued by
MGB
2. Environmental Work Program (EWP)
3. Certificate of Env’t Management & Community
Relations Record (CEMCRR)
4. Baseline Environmental and Social Data
(company option, not mandated by law but
encouraged by some Regional MGBs)
5. Community Technical Working Group (CTWG)
(not mandated by law during exploration but
encouraged by some Regional MGBs)
6. Mineral Resources Database
Environmental Impact Statement
(EIS) by Company
• Environmental Protection and
Enhancement Program (EPEP)
• Safety and Health Program
Development/
ConstructionEstablishment of
Contingent Liability
and Rehabilitation
Fund (CLRF)
Environmental Trust
Fund (ETF)
Mine Rehabilitation
Fund (MRF)
-Rehabiliation Cash
Fund (RCF)
- Monitoring Trust
Fund (MTF)
Mine Wastes and Mill
Tailings Reserve
Fund (MWTRF)
Mine Rehabilitation/
Decommissioning Site Inspection,
Monitoring & Audit
Mine Decommissioning
Plan (MDP), prepared 10
yrs before mine closure
Pre-development
Environmental Compliance
Certificate (ECC) issued by
Environmental Mgt Bureau
Establishment of
Multipartite
Monitoring Team
(MMT)
Social Development
Management
Program (SDMP)
1
2
3
4
5Exploration
Feasibility
1. Necessary Exploration Permit to be issued by
MGB
2. Environmental Work Program (EWP)
3. Certificate of Env’t Management & Community
Relations Record (CEMCRR)
4. Baseline Environmental and Social Data
(company option, not mandated by law but
encouraged by some Regional MGBs)
5. Community Technical Working Group (CTWG)
(not mandated by law during exploration but
encouraged by some Regional MGBs)
6. Mineral Resources Database
Environmental Impact Statement
(EIS) by Company
• Environmental Protection and
Enhancement Program (EPEP)
• Safety and Health Program
Development/
ConstructionEstablishment of
Contingent Liability
and Rehabilitation
Fund (CLRF)
Environmental Trust
Fund (ETF)
Mine Rehabilitation
Fund (MRF)
-Rehabiliation Cash
Fund (RCF)
- Monitoring Trust
Fund (MTF)
Mine Wastes and Mill
Tailings Reserve
Fund (MWTRF)
Mine Rehabilitation/
Decommissioning Site Inspection,
Monitoring & Audit
Mine Decommissioning
Plan (MDP), prepared 10
yrs before mine closure
Pre-development
Environmental Compliance
Certificate (ECC) issued by
Environmental Mgt Bureau
Establishment of
Multipartite
Monitoring Team
(MMT)
Social Development
Management
Program (SDMP)
1
2
3
4
5
9.2.1 Permitting Process
Mineral activities can be divided into five major phases: (1) exploration; (2) feasibility study (which also includes financing); (3) development and construction; (4) commercial production; and (5) mine rehabilitation or decommissioning. The steps that large scale mining companies will have to go through at each phases are well documented and laid out in the implementing rules and regulations (IRR) of Mining Act of 1995. There are three ways by which players can be granted mining rights in the country: through an exploration permit (EP), a mineral production sharing agreement (MPSA), or a financial technical assistance agreement (FTAA). The typical processes for applicants are detailed above. As of end-2008, applications for mining rights with the Mines and Geosciences Bureau cover approximately 11.113 million hectares or 37% of the country’s total land area. But not all mining applications prosper. The grant of mining rights is conditioned on the following factors:
1. Qualified person. The Mining Act and its IRR specifically state that a mining permit or contract can only be granted to a qualified person, meaning one possessing, among others, proof of financial and technical capability as well as a satisfactory environmental management and community relations track record. Filipino corporations may apply for an MPSA, FTAA or EP as long as they meet the criteria for a Qualified Person. Foreign corporations, on the other hand, may apply for an EP,

CRC Foundation Inc. - - The Global Recession and the Philippine Economy
208
FTAA or Mineral Processing Permit. In a Mineral Agreement, foreign participation is limited to a maximum of 40% equity.
2. Land-use priorities. Areas classified as critical watersheds, protected areas and national parks are automatically excluded from mining applications.
3. Economic feasibility. A mining contractor may not proceed to development and commercial operation after it has completed exploration works. Should the mining contractor find a mineral deposit during the exploration period, the contractor must prepare and submit for approval a mining project feasibility study. The study must consider all socio-economic, market, financial and technical factors relevant to the project as well as the minimum expenditures for social and environmental commitments provided under the revised IRR.
Figure 9.3
Percentage Contribution of Mining Output to Current GDP
9.2.2 Economic Impact
During its peak in the 1980s, the mining industry contributed 2.10% to GDP, 25% to total exports, and about 13% to government taxes. It also employed an average of 134,000 workers or about half a percent of the country’s employed labor force of 32.5 million. Furthermore, the industry contributed to national development by helping host communities build roads, churches, markets, schools, housing, utilities (electricity and water) and hospitals. In fact, mining spurred significant growth and development in towns and cities like Baguio, Sipalay and Toledo
0.00
5.00
10.00
15.00
20.00
25.00
30.00
1970 1975 1980 1985 1990 1995 2000 2006
Sh
are
of
Min
era
l D
oll
ar
Exp
ort
s t
o T
ota
l
Ph
ilip
pin
e E
xp
ort
s
% Share to Total Exports

CRC Foundation Inc. - - The Global Recession and the Philippine Economy
209
(Manuzo, 2002).87 Through the years, however, the industry’s contribution to the national income has steadily decreased. This decline was due to the closure of many mines—a historical trend since the 1980s. The share of mining and quarrying employment has also been steadily decreasing since the 1990s.
Figure 9.4
Percentage Contribution of Mining Exports to Total Philippine Exports
The favorable policy environment coupled with attractive global prices and heightened promotional efforts have rekindled interest in mining activities. In 2007, mining activities accounted for 1.4% of current GDP, 5.4% of total exports, and about 153,000 (0.4%) of total employment. Mining recorded its highest employment level in 1989, with about 168,000 workers—an estimated 0.77% of the total work force. But note that these employment figures include operations from mining and quarrying activities and thus grossly overestimate the total employment contribution of large scale metallic mining companies. It is estimated that current employment generated by large scale mining companies is about 10,000 to 15,000 persons. The majority of those employed in the industry belong to small-scale mines. Mining activities contribute to government coffers in four ways: fees and royalties charged by the MGB-DENR, excise taxes, local and national taxes collected by the national and local governments. In 2006, the government collected close to P3.1 billion (B) in taxes from mining activities, up from the P1.4B collected in 2002. In 2007, the government was able to generate over
87 Manuzon, Maricar (2002). An Industry’s Crusade. Available online: http://www.philippinebusiness.com.ph last accessed February 10, 2004.
0.50
0.70
0.90
1.10
1.30
1.50
1.70
1.90
2.10
2.30
1970 1975 1980 1985 1990 1995 2000 2006
Min
ing
Ou
tpu
t as
% t
o C
urr
en
t G
DP
% Share to Total GDP

CRC Foundation Inc. - - The Global Recession and the Philippine Economy
210
P10.4B in taxes and royalties—a more than two-fold increase from the P3.5B collected in 2004.
9.2.3 Production Structure and Status of Projects
There are now 26 primary mining companies involved in metallic production (2008) (Table 1). Most of these principal or large-scale companies are engaged in mining gold and nickel. Another 2,947 pending applications are being processed, a majority of which are for MPSA (1,058) and EP (1,496) (Table 2). These applications involve potential mining activities scattered all over the archipelago (see Table 8.3). The number of approved and registered applications are as follows:
- 264 mineral production sharing agreements - 2 financial/technical assistance agreements - 39 exploration permits - 199 IP and 41 mineral processing permits
Permits under process are also numerous: - 1,058 mineral production sharing agreements - 52 financial/technical assistance agreements - 1,496 exploration permits - 291 IPs and 40 MPPs
Figure 9.5
Percentage Contribution of Mining to Total Philippine Employment
0 .2 0
0 .3 0
0 .4 0
0 .5 0
0 .6 0
0 .7 0
0 .8 0
1 9 7 0 1 9 7 5 1 9 8 0 1 9 8 5 1 9 9 0 1 9 9 5 2 0 0 0 2 0 0 6
Co
ntr
ibu
tio
n o
f M
inin
g E
mp
loy
me
nt
to T
ota
l P
hil
ipp
ine
Em
plo
ym
en
t

CRC Foundation Inc. - - The Global Recession and the Philippine Economy
211
Table 9.1 Summary of mining industry statistics
Released: January 30, 2009
2004 2005 2006 2007* Q3 2008* Gross production value in mining (MGB) (P billion)
Large scale metallic mining 8.0 13.2 27.4 48.5 23.6
Small scale gold mining 21.5 24.2 28.1 32.2 27.4
Non-metallic mining 13.9 12.8 17.0 20.9 Nya
Total P43.4B P50.2B P72.5B P101.5B P51B Gross value added in mining (NSCB)
At current prices (P billion) 41.0 46.3 59.6 90.4 71.6
Mining contribution to GDP (%) 0.9 0.9 1.0 1.4 1.3
At constant prices (P billion) 14.1 14.8 14.1 18.0 14.2
Mining contribution to GDP (%) 1.2 1.2 1.0 1.4 1.3
Total exports of minerals & mineral products (BSP) ($ million) 797 820 2,103 2,548 2,060
Mining contribution to total exports 2.0% 2.0% 4.5% 5.2% 5.4%
Total paid-up investment in mining (SEC) (P million) 282.7 5,969.9 504.8 2,645.9 Nya
Employment in mining and quarrying (DOLE) 118,000 123,000 141,000 149,000 153,000 Mining contribution to total employment (%) 0.3 0.4 0.4 0.4 0.4
Taxes, fees and royalties from mining (P million)
Fees, charges & royalties collected by DENR-MGB 120.1 210.2 192.1 774.0 414.2
Excise tax collected by BIR 232.5 251.4 489.6 942.1 Nya
Taxes collected by national gov't agencies 2,769.1 4,733.6 5,313.2 8,349.7 Nya
Taxes and fees collected by LGUs 385.5 453.5 395.0 357.9 17.6
Total P3,480.2M P5,648.7M P6,389.9M P10,423.7M P431.8M Number of operating metallic mines
Copper with gold & silver 1 1 1 1 2

CRC Foundation Inc. - - The Global Recession and the Philippine Economy
212
Table 9.1 Summary of mining industry statistics
Released: January 30, 2009
2004 2005 2006 2007* Q3 2008* Copper with gold, silver & zinc - - - 1 1
Gold with silver 7 7 7 7 8
Metallurgical chromite (ore & concentrate) 2 2 2 2 1
Refractory chromite 1 1 1 1
Chemical grade chromite 1 1 1 1 1
Nickel 4 4 5 11 12
Nickel concentrate - 1 1 1 1
Iron ore - - - - -
Total operating metallic mines 16 17 18 25 26
Number of operating non-metallic mines: Sand and gravel 1,744 2,490 1,830 1,784 -
Cement 16 16 16 16 -
Other non-metallics 533 688 519 626 -
Total operating non-metallic mines 2,293 3,194 2,365 2,426 -
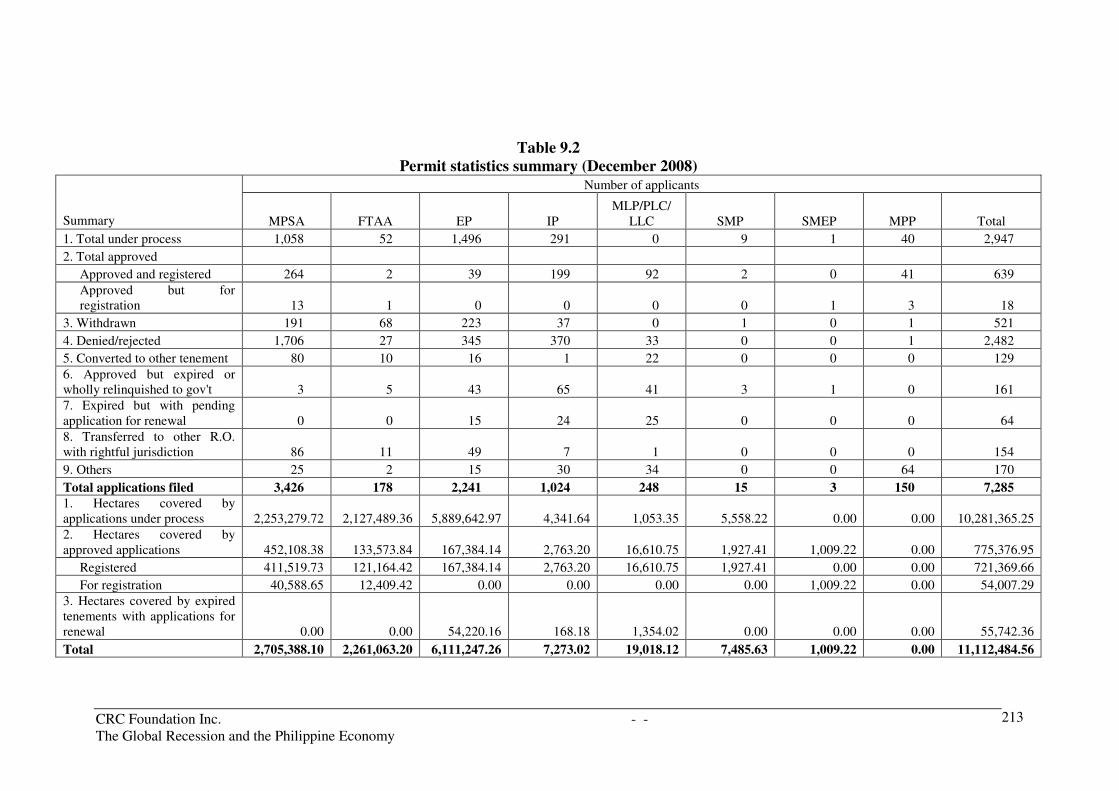
CRC Foundation Inc. - - The Global Recession and the Philippine Economy
213
Table 9.2
Permit statistics summary (December 2008) Number of applicants
Summary MPSA FTAA EP IP MLP/PLC/
LLC SMP SMEP MPP Total
1. Total under process 1,058 52 1,496 291 0 9 1 40 2,947
2. Total approved
Approved and registered 264 2 39 199 92 2 0 41 639
Approved but for registration 13 1 0 0 0 0 1 3 18
3. Withdrawn 191 68 223 37 0 1 0 1 521
4. Denied/rejected 1,706 27 345 370 33 0 0 1 2,482
5. Converted to other tenement 80 10 16 1 22 0 0 0 129
6. Approved but expired or wholly relinquished to gov't 3 5 43 65 41 3 1 0 161
7. Expired but with pending application for renewal 0 0 15 24 25 0 0 0 64
8. Transferred to other R.O. with rightful jurisdiction 86 11 49 7 1 0 0 0 154
9. Others 25 2 15 30 34 0 0 64 170
Total applications filed 3,426 178 2,241 1,024 248 15 3 150 7,285 1. Hectares covered by applications under process 2,253,279.72 2,127,489.36 5,889,642.97 4,341.64 1,053.35 5,558.22 0.00 0.00 10,281,365.25
2. Hectares covered by approved applications 452,108.38 133,573.84 167,384.14 2,763.20 16,610.75 1,927.41 1,009.22 0.00 775,376.95
Registered 411,519.73 121,164.42 167,384.14 2,763.20 16,610.75 1,927.41 0.00 0.00 721,369.66
For registration 40,588.65 12,409.42 0.00 0.00 0.00 0.00 1,009.22 0.00 54,007.29
3. Hectares covered by expired tenements with applications for renewal 0.00 0.00 54,220.16 168.18 1,354.02 0.00 0.00 0.00 55,742.36
Total 2,705,388.10 2,261,063.20 6,111,247.26 7,273.02 19,018.12 7,485.63 1,009.22 0.00 11,112,484.56

CRC Foundation Inc. - - The Global Recession and the Philippine Economy
214
Table 9.3 Mining Tenements Statistics Report
December 2008
MPSA FTAA EP IP MPP Total
Region Under
process
Approved and
registered Under
process
Approved and
registered Under
process
Approved and
registered Under
process
Approved and
registered Under
process
Approved and
registered Under
process
Approved and
registered
CAR 51 9 11 0 54 2 1 2 0 0 117 13
I 73 13 4 0 55 4 109 85 3 2 244 104
II 22 3 4 1 79 5 25 30 0 4 130 43
III 139 33 4 0 142 1 51 11 9 0 345 45
IV-A 87 32 4 0 57 3 45 4 15 8 208 47
IV-B 107 12 7 0 254 0 15 0 0 1 383 13
V 131 22 0 0 117 4 4 0 3 3 255 29
VI 30 12 7 0 84 1 0 6 5 7 126 26
VII 142 30 1 0 92 1 8 13 1 10 244 54
VIII 68 14 1 0 100 1 22 35 1 0 192 50
IX 44 11 4 0 87 1 0 9 0 0 135 21
XII 22 6 1 1 49 0 0 0 0 0 72 7
XIII 69 42 2 0 125 9 2 0 3 2 201 53
Total 1,058 264 52 2 1,496 39 291 199 40 41 2,937 545
Notes 1. Data based on Central MGB mining tenement data and the MGB Regional Offices Mining Tenements Statistics Report (MTSR) as of December 2008 except for MGB Regional Office No. XIII which was based on its MTSR as of November 2008.
2. All data in subject to validation. They should be used only for research and reference, except for litigation purposes.

CRC Foundation Inc. - - The Global Recession and the Philippine Economy
215
Table 9.4 Reported Investments from Priority Mining Projects, 2004 Onwards
(4th Quarter 2008) Reported January 23, 2009
Reported (in million US$)
Project name
2004 2005 2006 2007 2008 Total
(04-08) A. Operating/expansion stage
1. Palawan HPAL Nickel Project (Line 1) 18.18 222.94 61.27 302.39 2. Rapu-Rapu Polymetallic Project 16.40 64.71 6.45 25.11 14.00 126.67 3. Canatuan Silver-Gold Project 7.97 14.21 9.46 2.80 34.44 4. Sto. Tomas II Copper Expansion Proj. 6.05 12.44 3.81 35.09 57.39 5. Teresa Gold Project 37.14 16.83 7.65 6.85 8.06 76.53 6. Berong Nickel Project 3.00 0.40 15.50 2.00 20.90 7. Maco (Masara) Gold Project 30.30 6.28 36.58 8. SIRC (PGMC) Nickel Project 2.00 2.35 16.58 9.70 30.63 9. SIRC (CTP) Nickel Project 2.00 2.35 6.34 11.54 10. PASAR Copper Smelter Exp. Proj. 18.00 41.00 19.00 78.00 11. Philsaga Co-o Gold Project 4.00 2.20 6.20 12. Acoje PGE/Nickel Project 7.80 7.80 Sub-Totals (Operating stage) 85.74 338.13 142.04 125.92 96.39 789.08
First tier priority mineral development projects B. Construction and development stage
13. Carmen (Toledo) Copper Project 1.46 14.57 143.00 18.97 178.00 14. Palawan HPAL Nickel Project (Line 2) 230.00 57.00 287.00 15. Fiminera Masbate Gold Project 0.62 14.66 3.72 56.52 124.48 200.01 16. Canatuan Base Metal Project 11.57 11.43 23.00 17. Didipio Copper-Gold Project 42.00 33.70 4.09 31.00 110.79 18. Iligan Ferronickel Smelter Plant 11.40 1.20 12.60 19. Manticao Ferronickel Smelter Plant 0.03 22.44 1.20 23.67

CRC Foundation Inc. - - The Global Recession and the Philippine Economy
216
Table 9.4 Reported Investments from Priority Mining Projects, 2004 Onwards
(4th Quarter 2008) Reported January 23, 2009
Reported (in million US$)
Project name
2004 2005 2006 2007 2008 Total
(04-08) 20. Isabela Nickel Project Sub-Totals (Construction & dev't stage) 42.62 49.82 22.42 505.93 214.28 835.07
C. Feasibility/financing stage
21. Tampakan Copper Project 1.93 12.00 13.23 23.62 50.00 100.78 22. Surigao Sumitomo HPAL Project 25.00 25.00 23. Boyongan Copper Project 2.20 34.72 2.53 3.24 42.69 24. Itogon Gold Project 0.07 0.13 0.22 0.85 2.87 4.14 25. Nonoc Nickel Project 26. Mindoro Nickel Project 0.09 0.09 27. Akle Cement Project 14.00 0.13 14.13 28. Far Southeast Gold Project 0.22 1.04 0.10 0.00 0.00 1.36 29. King-King Copper-Gold Project 0.38 0.38 Sub-Totals (Feasibility/financing stage) 4.42 61.89 16.69 27.71 77.87 188.58
D. Advanced exploration stage
30. Colet Copper-Gold Project 2.65 2.24 0.56 5.45 31. Siana Gold Project 5.00 8.00 0.55 13.55 32. Agata Project (Copper-Gold-Nickel) 0.81 0.30 1.11 33. Balabag Project 0.00 34. Runruno Gold Project 2.42 2.42 35. Bayugo Copper-Gold Project 0.00 36. Pujada Nickel Project 0.40 2.35 2.75 37. Sta. Cruz Nickel Project - Benguet 3.00

CRC Foundation Inc. - - The Global Recession and the Philippine Economy
217
Table 9.4 Reported Investments from Priority Mining Projects, 2004 Onwards
(4th Quarter 2008) Reported January 23, 2009
Reported (in million US$)
Project name
2004 2005 2006 2007 2008 Total
(04-08) Sub-Totals (Advanced exploration stage) 5.00 11.05 5.21 1.37 2.65 28.28 Sub-Totals (First tier projects) 52.04 122.76 44.32 535.01 294.80 1,051.93
Second tier priority mineral development projects
38. Amacan Copper-Gold Project 0.00 39. Batong-Buhay Copper-Gold Project 0.00 40. Diwalwal Direct State Dev. Project 1.70 2.45 0.64 4.79 Sub-Totals (Second tier projects) 1.70 2.45 0.64 0.00 0.00 4.79
Priority exploration projects
1. Crescent Mining 2. Conner Apayao Gold Project 0.25 0.17 0.42 3. Capcapo Project 0.17 0.17 4. Macro Asia Palawan Project 5. Ipilan Nickel Project (Celestial) 0.80 0.80 6. Nalesbitan Gold Project 7. Vista Buena Mining 8. Mt. Mines Copper-Gold Project 0.69 0.69 9. Archangel Gold Project 2.88 0.16 3.04 10. Lobo Gold Project 0.02 0.01 0.03 11. Pao Copper-Gold Project 12. Gambang Copper-Gold Project 0.12 0.12 13. Colossal Offshore Magnetite Project 14. Citinickel Palawan Nickel Project

CRC Foundation Inc. - - The Global Recession and the Philippine Economy
218
Table 9.4 Reported Investments from Priority Mining Projects, 2004 Onwards
(4th Quarter 2008) Reported January 23, 2009
Reported (in million US$)
Project name
2004 2005 2006 2007 2008 Total
(04-08) 15. Barlo Copper Project 16. Panaon Gold Project 17. Century Peak nickel Project 18. Surigao Nickel Project - Oriental
Synergy 19. Hixbar Copper-Gold Project 20. Panag Gold project 21. Vista Alegre Gold Project 22. Taipan San Francisco Project Sub-Total (Exploration projects) 0.80 3.15 1.32 5.27
Grand Total 139.48 463.34 187.79 664.08 392.51 1,851.06

CRC Foundation Inc. - - The Global Recession and the Philippine Economy
219
Table 9.5 Projected investments from priority mining projects (4th Quarter 2008)
Reported January 23, 2009 Projected (U$ million)
Project name
4Q 2008 2009 2010 2011 2012 2013
Total disclosed
project cost A. Operating/expansion stage
1 Palawan HPAL Nickel Project (Line 1) 0.00 2 Rapu-Rapu Polymetallic Project 0.00 3 Canatuan Silver-Gold Project 0.00 4 Sto. Tomas II Copper Expansion Proj. 0.00 5 Teresa Gold Project 0.00 6 Berong Nickel Project 0.00 7 Maco (Masara) Gold Project 0.00 8 SIRC (PGMC) Nickel Project 0.00 9 SIRC (CTP) Nickel Project 0.00
10 PASAR Copper Smelter Exp. Proj. 0.00 11 Philsaga Co-o Gold Project 2.60 3.16 5.76 12 Acoje PGE/Nickel Project 10.00 10.00 300.00 200.00 520.00
Sub-Totals (Operating stage) 10.00 12.60 303.16 200.00 525.76 First tier priority mineral development projects B. Construction and development stage
1 Carmen (Toledo) Copper Project 0.00 2 Palawan HPAL Nickel Project (Line 2) 0.00 3 Fiminera Masbate Gold Project 0.00 4 Canatuan Base Metal Project 0.00 5 Didipio Copper-Gold Project 64.00 145.21 209.21

CRC Foundation Inc. - - The Global Recession and the Philippine Economy
220
Table 9.5 Projected investments from priority mining projects (4th Quarter 2008)
Reported January 23, 2009 Projected (U$ million)
Project name
4Q 2008 2009 2010 2011 2012 2013
Total disclosed
project cost 6 Iligan Ferronickel Smelter Plant 1.60 4.90 5.50 0.11 12.11 7 Manticao Ferronickel Smelter Plant 1.60 4.98 0.34 0.09 7.01 8 Isabela Nickel Project 13.70 13.70
Sub-Totals (Construction & dev't stage) 80.90 155.09 5.84 0.20 0.00 0.00 1,153.09 C. Feasibility/financing stage
9 Tampakan Copper Project 250.00 700.00 800.00 300.00 2,050.00 10 Surigao Sumitomo HPAL Project 25.00 250.00 800.00 600.00 1,675.00 11 Boyongan Copper Project 25.00 25.00 200.00 300.00 200.00 200.00 950.00 12 Itogon Gold Project 9.13 10.00 6.00 25.13 13 Nonoc Nickel Project 10.00 30.00 100.00 860.00 1,000.00 14 Mindoro Nickel Project 10.00 90.00 500.00 500.00 1,100.00 15 Akle Cement Project 30.00 32.00 36.00 98.00 16 Far Southeast Gold Project 40.00 60.00 300.00 100.00 500.00 17 King-King Copper-Gold Project 10.00 140.00 222.00 160.00 532.00
Sub-Totals (Feasibility/financing stage) 159.13 887.00 2,864.00 3,320.00 500.00 200.00 8,118.71 D. Advanced exploration stage 18 Colet Copper-Gold Project 134.00 134.00 268.00 19 Siana Gold Project 10.00 50.00 60.00 20 Agata Project (Copper-Gold-Nickel) 2.20 2.20 21 Balabag Project 2.00 2.00 22 Runruno Gold Project 15.00 15.00 150.00 180.00 23 Bayugo Copper-Gold Project 10.00 40.00 150.00 200.00 200.00 200.00 800.00

CRC Foundation Inc. - - The Global Recession and the Philippine Economy
221
Table 9.5 Projected investments from priority mining projects (4th Quarter 2008)
Reported January 23, 2009 Projected (U$ million)
Project name
4Q 2008 2009 2010 2011 2012 2013
Total disclosed
project cost 24 Pujada Nickel Project 14.65 25.00 25.00 20.00 500.00 500.00 1,084.65 25 Sta. Cruz Nickel Project - Benguet 5.00 5.00
Sub-Totals (Advanced exploration stage) 58.85 264.00 459.00 220.00 700.00 700.00 2,401.85 Sub-Totals (First tier projects) 298.87 1,306.09 3,328.84 3,540.20 1,200.00 900.00 11,673.65 Second tier priority mineral development projects 26 Amacan Copper-Gold Project 50.00 50.00 100.00 27 Batong-Buhay Copper-Gold Project 50.00 50.00 100.00 28 Diwalwal Direct State Dev. Project 9.00 11.00 20.00
Sub-Totals (Second tier projects) 0.00 9.00 111.00 100.00 0.00 0.00 220.00 Priority exploration projects
1 Crescent Mining 5.00 5.00 2 Conner Apayao Gold Project 2.83 2.83 3 Capcapo Project 2.23 5.60 40.00 47.83 4 Macro Asia Palawan Project 2.00 2.00 5 Ipilan Nickel Project (Celestial) 2.00 2.00 6 Nalesbitan Gold Project 2.00 2.00 7 Vista Buena Mining 2.00 2.00 8 Mt. Mines Copper-Gold Project 1.31 1.31 9 Archangel Gold Project 1.84 1.84
10 Lobo Gold Project 1.99 1.99 11 Pao Copper-Gold Project 1.00 1.00

CRC Foundation Inc. - - The Global Recession and the Philippine Economy
222
Table 9.5 Projected investments from priority mining projects (4th Quarter 2008)
Reported January 23, 2009 Projected (U$ million)
Project name
4Q 2008 2009 2010 2011 2012 2013
Total disclosed
project cost 12 Gambang Copper-Gold Project 0.88 0.88 13 Colossal Offshore Magnetite Project 1.00 1.00 14 Citinickel Palawan Nickel Project 1.00 1.00 15 Barlo Copper Project 0.60 0.60 16 Panaon Gold Project 0.50 0.50 17 Century Peak nickel Project 0.50 0.50 18 Surigao Nickel Project - Oriental Synergy 0.50 0.50 19 Hixbar Copper-Gold Project 0.10 0.10 20 Panag Gold project 0.10 0.10 21 Vista Alegre Gold Project 22 Taipan San Francisco Project 0.10 0.10
Sub-Total (Exploration projects) 29.48 5.60 40.00 75.08 Grand total 338.35 1,333.29 3,743.00 3,880.20 1,200.00 900.00 11,394.84
CRC Foundation Inc. - - The Global Recession and the Philippine Economy
223
9.3 Impact Of Mining Activities
The impact of mining activities can be felt at both local and national levels. The channels through which the impact will be felt are through investments, exports, jobs and taxes. A total of 62 mining projects at various stages of development identified as priorities by government have infused a total US$1.85B in investments in 2004 and the third quarter of 2008. The bulk of these investments went into the construction and development stage of 8 companies infusing about $835M and another 12 companies at the operating and expansion stage injecting $789M in investments. During the period 2004-2007, a total of 18,031 jobs were generated by these priority projects. In the four years between 2008 and 2011, another 29,825 jobs are expected to be created, mostly coming from new mining projects (see Table 8.5). From the last quarter of 2008 to 2013, the government projects an additional infusion of $11.4B in investments from mining projects at various stages of development. Government projections did not provide estimates of additional taxes as well as the exports these new mining projects will generate. However, if all these mining investments push through as projected especially those at the 8 mines at the development/commercialization stage and the 12 others at the expansion/operating stage, mineral export and taxes will substantially increase from mineral extraction, processing and sales. However these figures tend to underestimate the total investments and jobs being created by the sector. As observed earlier, there are over 2,900 pending applications for mining tenements with the government. Approval and commercialization of any of these projects will have a substantial impact in the long term on exports, investments, fiscal and employment sectors. As discussed earlier, only during the commercial operation of a mine will the national as well as local government and communities fully enjoy the benefits of the mining activities. At the national level, the economic benefits derived from commercial operations are as follows:
- For MPSA: Excise tax on minerals of 2% of market value; 5% if in mineral reserve
- Corporate income tax of 5% or 3% of sales - For FTAA: Net mining revenue option of 50% of gross output net of
deductible expenses or profit-based option of 25% of excess profits (net profit after tax less 40% of gross output)/(1-income tax rate)
- Environmental management fee of 1% of capex during construction - Mine wastes fee of P.05/MT and tailings fee of P.10/MT
For the LGUs that have jurisdiction over the claims, in addition to realty and business taxes and license permits, their share on the 40% excise taxes from a fully operating mine are as follows:

CRC Foundation Inc. - - The Global Recession and the Philippine Economy
224
- 20% to the province - 35% to the municipality - 45% to the barangay
Other stakeholders that can partake from the commercial operations of a mine are as follows: - Communities within and around the mining site can benefit from a social
investment requirement of 1% of direct milling cost, of which 90% must be spent on SDMP for the communities and the remaining 10% on mining and geosciences technology
- Indigenous communities (if present onsite) get a royalty fee of 1% of gross output
9.4 Obstacles to Mining Activities There are external as well as internal obstacles that hinder foreign mining companies from coming to the Philippines.
9.4.1 External Obstacles
Factors external to the Philippines that discourage investments in exploration and mine development and commercialization are the credit crisis, the softening of world prices, and the presence of international anti-mining lobby groups against any form of mining activities. These factors are well beyond the country’s control. The credit crisis and falling world prices. In a 2008/2009 annual survey conducted by the Fraser Institute of 658 exploration and mining-related companies around the world, more than 4 out of 5 believe that at least 30% of exploration companies will be forced out of business in the current economic downturn. The same survey indicated that over 90% of respondents believe exploration and development activities will be curtailed, with 57% saying activity will decline a “great deal” and 85% saying that activities of production companies will be curtailed. The implications can be adverse to the Philippine mining sector as most projects in the country are still at the exploration and feasibility/financing stages. Postponements or outright cancellations of exploration activities can eliminate the Philippines’ long term prospects in mining. The postponement of exploration and commercialization activities can lead to commodity shortages when the economy recovers. According to the same report, “the world may face a shortage of raw materials and sky rocketing commodity prices as the world economy moves past the recession and into renewed growth.”

CRC Foundation Inc. - - The Global Recession and the Philippine Economy
225
The report further states “the curtailment of development activity will hit in the short-term, likely during the opening phase of the recovery period. The gap between exploration and production typically span five years to ten years. This means that the negative impact from the lack of exploration on commodity supplies will begin to hit as the recovery matures.” While it may augur well for existing mining operations, the report observed that “these problems could weaken the recovery and spark inflation fears.” Anti-mining lobby. The spotlight focused on Philippine mining has also rekindled fierce opposition from international and local environmental groups and other non government organizations who are seriously concerned about non-economic issues like the adverse impact on the environment and violations of rights of indigenous peoples. Campaigns by the local network of environmental activists have already impeded a number of mining projects.
9.4.2 Internal Obstacles
Miscommunication between national bodies and local stakeholders. While regulatory policy and national laws favor mining companies, the lack of formal linkages between national bodies and local stakeholders has led to animosities. Local government units, community leaders and organizations, academic and religious institutions and the like are directly affected by existing or future mining activities, yet they have limited involvement in the permit approval or monitoring process as well as little access to information about the mining activities of a company locating in their community. This lack of knowledge promotes distrust and enmity between the mining companies and local parties. This is why some local government units implement mining moratoriums in their communities despite the presence of approved mining tenements and operations in the area. LGUs also complain about the lack of transparency in mining operations and delayed remittances of their rightful share in excise taxes of local mining operations. Such problems can be better managed—if not prevented—if there were formal mechanisms to facilitate more communication between national agencies, the mining companies and local stakeholders. If not addressed effectively, these difficulties may significantly hurt the Philippines’ attractiveness to mining explorations and investors.

CRC Foundation Inc. - - The Global Recession and the Philippine Economy
226
Table 9.6
Philippine Ranking in Annual Survey of Mining Companies 2008/2009 2007/2008 2006/2007 2005/2006
Mineral potential
Current policy potential index 59 60 61 60
Policy/mineral potential assuming no land use restrictions in place 24 1 35 28
Current mineral potential assuming current regulations and land use restrictions 50 52 47 40
Total number of countries covered 71 65 65 64
Source: 2008/2009 Fraser Institute Annual Survey of Mining Companies
The ranking of the Philippines in terms of policy and mineral potential, assuming no land use restrictions are in place and current best practices are in place, has deteriorated from being ranked first in 2007 to 24th place in the 2008 survey (see Table 8.6). When assuming regulations and land use restrictions, there is a rapid deterioration in the attractiveness of the Philippines as an investment site; from a rank of 40th the Philippines now ranks 50th in this category. The general ranking of the Philippines has remained almost unchanged, with the rating hovering between 59 and 60 over the last two surveys. What are the factors contributing to the lack of improvement on this ranking? The 2008/2009 Fraser Annual Survey of Mining Companies can provide insights into some contributing factors. Other Internal Factors. Despite Philippine Mining Law being adjudged by the World Bank as the best in the world, uncertainties in its administration, interpretation and enforcement make implementation difficult. Problematic issues like aboriginal land claims, areas covering wilderness areas or parks, socioeconomic and community development conditions and security concerns also complicate the overall picture (see Table 8.7).

CRC Foundation Inc. - - The Global Recession and the Philippine Economy
227
Table 9.7
Philippine Ranking In Annual Mining Company Survey: What Attracts Investments In Exploration
Philippine rank
(out of 71) "Best"
jurisdiction "Worst"
jurisdiction
Uncertainty in administration, interpretation and enforcement of existing regulations 55 Quebec Venezuela
Environmental regulation 41 Chile Washington
Regulatory duplications and inconsistencies 64 Quebec Venezuela
Taxation regimes 32 Wyoming Zimbabwe
Uncertainty concerning native/aboriginal land claims 62 Wyoming Ecuador
Uncertainty concerning which areas will be protected as wilderness areas or parks 55 Kazakhstan California
Infrastructure 53 Nevada Kyrgyzstan
Socioeconomic agreements/community development conditions 59 Nevada Ecuador
Political stability 57 Alberta Zimbabwe
Labor regulations/employment agreements 50 Wyoming Venezuela
Geological database 53 Norway DRC (Congo)
Security 68 Utah Zimbabwe
Supply of labor/skills 34 Nevada DRC (Congo)
Current policy & mineral potential 38 Quebec Guatemala
Source: 2008/2009 Fraser Institute Annual Survey of Mining Companies
Lack of knowledge by local finance institutions on mining operations. The conspicuous absence of substantial funds from local finance institutions in the mining exploration and development stage can be attributed to their lack of knowledge on and appreciation of mining activities. The Philippines continues to look to foreign capital to fund exploration, feasibility and commercial development of its mines. In addition to mobilizing excess liquidity in the financial system, active participation by local financial institutions can be an effective positive signal to foreign investors about local confidence in the country’s mining sector. Poor or limited monitoring of mining activities. National agencies lack the manpower and resources to carefully monitor each mining project that is perceived to threaten the economic and non-economic well-being of local communities and government units. Unrecorded or under-reported mineral exports, for instance, deprive the government and local communities of fair duties and fees. The bad mining practices of some mining companies can also damage the reputation of other law-abiding mining companies.

CRC Foundation Inc. - - The Global Recession and the Philippine Economy
228
9.5 Action Programs for Overcoming Obstacles In Mining To make the Philippines more attractive for mining exploration and commercialization, the following action programs are being recommended: Enrolment in Extractive Industry Transparency International. The government must enroll the Philippine mining industry in the EITI, an organization that certifies and promotes transparency best practices and standards in mining industries. To promote transparency, mining companies must be encouraged to waive the confidentiality of their tax payments to the government and to fully disclose all tax payments. Establish a formal links between national agencies, companies and local stakeholders. There is a need to formulate a locally-oriented, responsive and representative minerals protocol which can provide mechanisms for representation, dialogue, consultation, education, monitoring, conflict resolution and capacity building among key representatives of communities. Local communities must be viewed as authentic partners by mining companies and national government agencies. A communication protocol like this must ensure the following:
• Authentic human development of members of local communities
• Establishment of programs to de-couple economic activities of mining communities from mining activities over time
• Promotion and observance of transparency in operations and financial transactions of mining companies
• Establishment of a mechanism of engagement between the different stakeholders with adequate representation as early as the pre-exploration stage
• Enhancement of capability of local stakeholders to monitor and assess different stages of mining activities
• Promotion peace and order and security at the mining site, in coordination with the PNP and AFP
• Consistency in the levying of tax laws by LGUs on mining operations
• Devolve at the local level monitoring and assessing the social and economic impact of a mine operation
• Consultation and assistance in drafting exit development plans for decommissioned mine sites
Enhance the economic and non-economic impact of a mine operation. An organization must be in place, preferably devolved at the local level with adequate representation from appropriate agencies and local communities (perhaps the same organization or group being proposed in the minerals protocol above), to strictly monitor mineral production and exports, and help assist stakeholders draft programs for spending or allocation of their share in mining operations. Another way to fully optimize the impact of a mine operation is to encourage other sectors to invest in downstream operations like mineral processing plants. Timely recording and remittance of LGU’s share. To ensure their mandated share in excise taxes are remitted and collected on time, LGUs should consider the following:

CRC Foundation Inc. - - The Global Recession and the Philippine Economy
229
• A joint certification of tax collection by relevant agencies (i.e., DOF-BIR, DENR-MGB, DILG, DOE, DOF-BOC) on the total amount of taxes collected;
• Specified timelines for the reconciliation, recording and sharing of all taxes collected by relevant government agencies;
• Incorporate in the succeeding year’s expenditure budget how the LGU intends to spend their share of the excise taxes
According to the latest information provided in the last consultative workshop, the different government offices are in the process of coming up with a memorandum of agreement aimed at streamlining and enhancing the process of recording, computing and informing and disbursing the rightful shares of the LGUs on the taxes from minerals.
Tap local financial markets to fund mining projects. There is a need to educate local financial institutions about mining operations to encourage these to fund mining projects. There are on-going proposals to offer a Mining 101 course in UP to other interested parties like lawyers, accountants, government officials, etc. The participation of local financial institutions can lead to the mobilization of excess liquidity and to give a positive signal to investors about local commitment and confidence on mining prospects in the country. Lately, negotiations are on-going with the Philexim bank to extend credit guarantees on loans provided to mining projects.
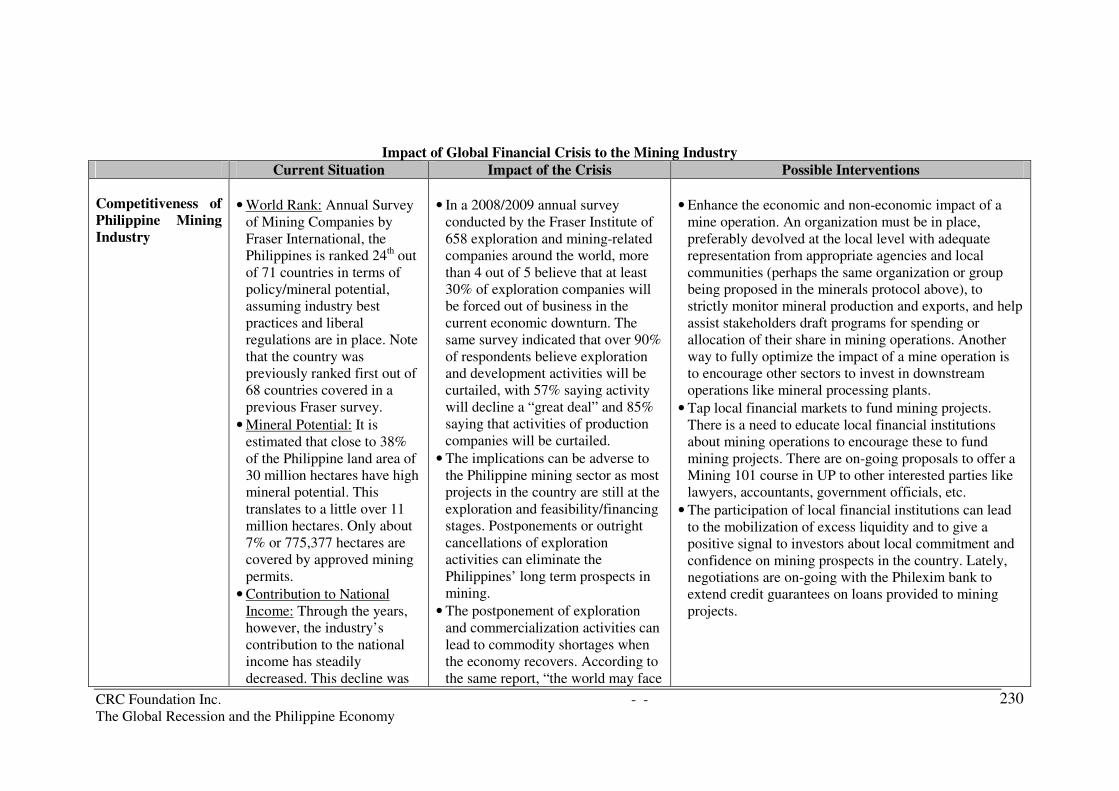
CRC Foundation Inc. - - The Global Recession and the Philippine Economy
230
Impact of Global Financial Crisis to the Mining Industry Current Situation Impact of the Crisis Possible Interventions
Competitiveness of Philippine Mining Industry
• World Rank: Annual Survey of Mining Companies by Fraser International, the Philippines is ranked 24th out of 71 countries in terms of policy/mineral potential, assuming industry best practices and liberal regulations are in place. Note that the country was previously ranked first out of 68 countries covered in a previous Fraser survey.
• Mineral Potential: It is estimated that close to 38% of the Philippine land area of 30 million hectares have high mineral potential. This translates to a little over 11 million hectares. Only about 7% or 775,377 hectares are covered by approved mining permits.
• Contribution to National Income: Through the years, however, the industry’s contribution to the national income has steadily decreased. This decline was
• In a 2008/2009 annual survey conducted by the Fraser Institute of 658 exploration and mining-related companies around the world, more than 4 out of 5 believe that at least 30% of exploration companies will be forced out of business in the current economic downturn. The same survey indicated that over 90% of respondents believe exploration and development activities will be curtailed, with 57% saying activity will decline a “great deal” and 85% saying that activities of production companies will be curtailed.
• The implications can be adverse to the Philippine mining sector as most projects in the country are still at the exploration and feasibility/financing stages. Postponements or outright cancellations of exploration activities can eliminate the Philippines’ long term prospects in mining.
• The postponement of exploration and commercialization activities can lead to commodity shortages when the economy recovers. According to the same report, “the world may face
• Enhance the economic and non-economic impact of a mine operation. An organization must be in place, preferably devolved at the local level with adequate representation from appropriate agencies and local communities (perhaps the same organization or group being proposed in the minerals protocol above), to strictly monitor mineral production and exports, and help assist stakeholders draft programs for spending or allocation of their share in mining operations. Another way to fully optimize the impact of a mine operation is to encourage other sectors to invest in downstream operations like mineral processing plants.
• Tap local financial markets to fund mining projects. There is a need to educate local financial institutions about mining operations to encourage these to fund mining projects. There are on-going proposals to offer a Mining 101 course in UP to other interested parties like lawyers, accountants, government officials, etc.
• The participation of local financial institutions can lead to the mobilization of excess liquidity and to give a positive signal to investors about local commitment and confidence on mining prospects in the country. Lately, negotiations are on-going with the Philexim bank to extend credit guarantees on loans provided to mining projects.

CRC Foundation Inc. - - The Global Recession and the Philippine Economy
231
Impact of Global Financial Crisis to the Mining Industry Current Situation Impact of the Crisis Possible Interventions
due to the closure of many mines—a historical trend since the 1980s. The share of mining and quarrying employment has also been steadily decreasing since the 1990s.
• Contribution to employment: It is estimated that current employment generated by large scale mining companies is about 10,000 to 15,000 persons. The majority of those employed in the industry belong to small-scale mines.
• Mining Companies: There are now 26 primary mining companies involved in metallic production (2008). Most of these principal or large-scale companies are engaged in mining gold and nickel. Another 2,947 pending applications are being processed, a majority of which are for MPSA (1,058) and EP (1,496). These applications involve potential mining activities
a shortage of raw materials and sky rocketing commodity prices as the world economy moves past the recession and into renewed growth.”
• The report further states “the curtailment of development activity will hit in the short-term, likely during the opening phase of the recovery period. The gap between exploration and production typically span five years to ten years. This means that the negative impact from the lack of exploration on commodity supplies will begin to hit as the recovery matures.” While it may augur well for existing mining operations, the report observed that “these problems could weaken the recovery and spark inflation fears.”

CRC Foundation Inc. - - The Global Recession and the Philippine Economy
232
Impact of Global Financial Crisis to the Mining Industry Current Situation Impact of the Crisis Possible Interventions
scattered all over the archipelago.
• Mining Projects: A total of 62 mining projects at various stages of development identified as priorities by government have infused a total US$1.85B in investments in 2004 and the third quarter of 2008. The bulk of these investments went into the construction and development stage of 8 companies infusing about $835M and another 12 companies at the operating and expansion stage injecting $789M in investments.
• Job generation: During the period 2004-2007, a total of 18,031 jobs were generated by these priority projects. In the four years between 2008 and 2011, another 29,825 jobs are expected to be created, mostly coming from new mining projects. From the last quarter of 2008 to 2013, the government projects an additional

CRC Foundation Inc. - - The Global Recession and the Philippine Economy
233
Impact of Global Financial Crisis to the Mining Industry Current Situation Impact of the Crisis Possible Interventions
infusion of $11.4B in investments from mining projects at various stages of development.

CRC Foundation Inc. - - The Global Recession and the Philippine Economy
234
References Cabalda, et. al.(2002), Sustainable Development in the Philippine Minerals Industry:
A Baseline Study. IIED-UK. Fraser Institute (2009). Annual Survey of Mining Companies 2008/2009. 1770 Burrard
St., Vancouver, BC. Hubo, C. Lewis, J. and Warner, M.(2004). Final Report of the World Bank Technical
Assistance on CSR in the Philippine Mining Industry. The World Bank. Hubo, C. and Leray, T (2005). Outcomes of the World Bank Technical Assistance on
CSR in the Philippine Mining Industry. The World Bank. Padojinog, W. and Hubo, C (2006). Prospects of Sustainable Mining in Ilocos Norte.
Center for Research and Communication Foundation. Padojinog, W. and Hubo, C (2006). Rapid assessment of the sustainability agenda in
the Philippine mining industry. SPEX-UA&P. Bangko Sentral ng Pilipinas www.bsp.gov.ph BusinessWorld, 22 January 2004. Mining Tenements Division, Mines and Geosciences Bureau. www.mgb.gov.ph Mineral production review, January-March 2007. Mines and Geosciences Bureau. Philippine metallic mineral production, May 9, 2007. Mines and Geosciences Bureau. World Bureau of Metal Statistics. http://www.world-bureau.com/
Industry workshops and consultations
1. Interview with Mr. Ernesto Villaluna, President, Philex Mining Corporation, University of Asia & the Pacific, Dining Lounge, Pasig City, 16 February 2009.
2. Consultative workshop meeting with the Management Association of the Philippines, Ayala Tower One, Makati City, 3 March 2009
3. A round-table discussion with key representatives of the Chamber of Mines led by Mr. Philip Romualdez, University of Asia & the Pacific, Pasig City, 17 March 2009.
4. Industry consultative workshops with stakeholders invited by the Department of Trade and Industry at DTI Building, Makati City, 17 March 2009.
5. Industry consultative workshops with the Chamber of Mines represented by Mrs. Nelia Halcon and organized by the Department of Trade and Industry at the DTI Building, Makati City, 17 April 2008.