the global financial crisis: 10 years on - kpmg us llp ... · the global financial crisis: 10 years...
TRANSCRIPT
The Global Financial Crisis: 10 years onKPMG Economics—
August 2017
2© 2017 KPMG, an Australian partnership and a member firm of the KPMG network of independent member firms affiliated with KPMG International Cooperative (“KPMG International”), a Swiss entity. All rights reserved. The KPMG name and logo are registered trademarks or trademarks of KPMG International. Liability limited by a scheme approved under Professional Standards Legislation.
• At an IMF seminar in Washington D.C on 7 September 2006 Professor Nouriel Roubini laid out his arguments that not only the US, but also the rest of the world, would enter a severe recession in the coming 12 months.
• The predictions put forward by Roubini were virtually all proven correct. The main forecast that was askew was the one associated with the transmission of the impending US recession into only a slowdown in the global economy.
• As it turned out, the US recession was in fact larger, deeper and substantially more pronounced than Roubini had anticipated; and its transmission to the rest of the world was faster and broader than anyone had imagined at the time.
• The former Governor of the Reserve Bank of Australia, Mr. Glenn Stevens, said in a speech at the Annual Dinner of Australian Business Economist in December 2008, “I do not know anyone who predicted this course of events. This should give us cause to reflect on how hard a job it is to make genuinely useful forecasts”.
• However, Professor Dirk Bezemer, from the University of Gronengin, in a study about the need for research into the link between accounting concepts and practices and macro economic outcomes, identified a dozen economic analysts who predicted the GFC against a set of criteria.
• Roubini also noted of the GFC “this crisis is not a black swan event -a random outcome from a random distribution. This case is a build-up of vulnerabilities over time that will increase and provoke a crisis. There were tens of different signals that would eventually lead to a tipping point”.
• Warwick McKibbin and Andrew Stoeckel completed a study into the causes and consequences of the GFC, and within this piece of work formalised three shocks that gave rise to the onset of the GFC, including:
• the bursting of the housing bubble causing a reallocation of capital and a loss of household wealth and a drop in consumption
• a sharp rise in the equity risk premium (the risk premium of equities over bonds) causing the cost of capital to rise, private investment to fall and demand for durable goods to collapse
• a reappraisal of risk by households causing them to discount their future labour income, increase savings and decrease consumption.
• KPMG Economics has repeated some elements of the analysis undertaken within the McKibbin and Stoeckel study to see whether any of the identified shocks are at, or near, levels that indicate another crisis is imminent.
Executive summaryThe Global Financial Crisis: 10 years on
3© 2017 KPMG, an Australian partnership and a member firm of the KPMG network of independent member firms affiliated with KPMG International Cooperative (“KPMG International”), a Swiss entity. All rights reserved. The KPMG name and logo are registered trademarks or trademarks of KPMG International. Liability limited by a scheme approved under Professional Standards Legislation.
• The KPMG Economics analysis found:
• the housing bubble in the US has burst and hasn’t reappeared, and with tighter lending standards, the risk of extreme levels of defaults within the residential mortgage market appears to be low
• while the Sydney and Melbourne housing markets are currently overvalued by about 14% and 8% respectively, and a period of adjustment back to ‘fair value’ is likely to occur over the next few years, prices are not expected to go into ‘free fall’
• equity risk premia in both the US and Australia have trended downwards, albeit Australia’s has been relatively more volatile than the US’s
• it appears that equity investors in Australia are applying a higher risk premium than they were prior to the GFC
• consumption activity, firstly in the US and then in Australia, reacted sharply once the breadth and depth of the crisis was beginning to be understood, although both countries have more recently seen it revert back to long run trend levels.
• Given the findings of our analysis, it seems that neither the US nor Australia are on the precipice of another major financial crisis.
• While there are numerous scenarios that warrant further analysis to see if they represent an early signal on increasing risk within the global financial system, one of the contemporary concerns relates to the elevated signs of stress in the domestic banking system in China. In our assessment of this risk, it seems:
• rapid increase in property prices, outstanding residential mortgages equaling close to nominal GDP, rising defaults, combined with the fact that residential mortgage lending in China is on a non-recourse basis, indicates the risk associated with a failure of the Chinese housing market is not immaterial
• corporate bond yields with the highest investment grade rating (AAA and AA) indicate that equity risk premia have declined from the beginning of 2009 to mid-2016; although there has been a slight upwards trend from mid-2016 onwards
• the pattern of the residual between actual and projected equilibrium consumption indicates there has not been a systemic increase in anticipatory household risk causing consumers to alter their spending behaviour.
• So despite the growing concern being expressed within the media, it would seem, based on this analysis, the risk of a new global financial crisis emanating from China in the near future is modest.
Executive Summary (cont.)The Global Financial Crisis: 10 years on
5© 2017 KPMG, an Australian partnership and a member firm of the KPMG network of independent member firms affiliated with KPMG International Cooperative (“KPMG International”), a Swiss entity. All rights reserved. The KPMG name and logo are registered trademarks or trademarks of KPMG International. Liability limited by a scheme approved under Professional Standards Legislation.
A seminar was hosted in Washington D.C on 7 September 2006 by the International Monetary Fund (IMF) on the outlook for the United States of America (US) and Global economies1. The speakers at that event were Nouriel Roubini, Professor of Economics from New York University and Anirvan Banerji, the Chief Research Officer of the Economic Cycle Research Institute.
This, now infamous seminar, is where Professor Roubini laid out his arguments that not only the US, but also the rest of the world, would enter a severe recession in the coming 12 months. His primary arguments for the upcoming recession were:
• the severe downturn in housing, the energy price shock and the increase in the Federal Funds Rate would all combine to result in ‘consumer burnout’
• flat, or falling, real wages and relatively mediocre employment growth has resulted in the US consumer achieving zero real savings and, in effect, consuming more than their incomes
• home equity withdrawals have been the method for many households to sustain this excessive spending and consumption, although with the impending housing market bust, sustaining consumption at historical levels will become problematic
• growth in durable consumption has flat lined, resulting in an increase in inventories but no slowdown in production. Once production is cut to enable inventories to be soaked up, economic growth will fall
• the improvement in the real trade balance is a signal of an impending economic slowdown, while weak government consumption is not helping prop up the economy
• the business community is unlikely to step up its investment activity and replace the anticipated fall away in investment from the residential sector
• the collapsing of the housing market will result in systematic problems in the whole US banking sector, commencing with subprime lenders, and then spreading to other banks and financial institutions
• the creation of exchange mortgage back securities (MBS) has only redirected some of the mortgage risk in the financial system to asset managers and hedge funds
• should MBS become a problem, not only will asset managers and hedge funds get into trouble, but so too will the government-sponsored enterprises of Fannie Mae and Freddie Mac, who are holding trillions of dollars of credit risk
• foreign central banks have purchased Fannie Mae and Freddie Mac bonds, so any collapse in the MBS market could be transmitted to the rest of the world
• the ability of macroeconomic policies to prevent a recession are much more limited than was the case in 2001; and
• the US recession is going to lead to a severe slowdown in the rest of the world, but it won’t be a global recession.2
The Global Financial Crisis: 10 years on“Those who cannot remember the past
are condemned to repeat it”George Santayana, The Life of Reason, 1905
6© 2017 KPMG, an Australian partnership and a member firm of the KPMG network of independent member firms affiliated with KPMG International Cooperative (“KPMG International”), a Swiss entity. All rights reserved. The KPMG name and logo are registered trademarks or trademarks of KPMG International. Liability limited by a scheme approved under Professional Standards Legislation.
Roubini acknowledged during this presentation that he was not a professional forecaster, he did not use a big global macroeconomic model, rather his model is like a ‘duck test’; meaning ‘if it looks like a recession and walks like a recession, it should be a recession’.
In his reply Banerji agreed to many of the assertions put forward by Roubini, including the position that growth was slowing. However, Banerji challenged Roubini on the basis that his analytical framework was overly subjective, and that ‘piling up’ a range of variables that enable a plausible recession scenario to be constructed may not in fact give insight into the actual likelihood of recession3.
With the benefit of hindsight, the predictions put forward in that IMF International Seminars Lecture by Roubini were virtually all were proven correct. The main forecast that was askew was the one associated with the transmission of the impending US recession into only a slowdown in the global economy.
As it turned out, the US recession was in fact larger, deeper and substantially more pronounced that Roubini had anticipated; and its transmission to the rest of the world was faster and broader than anyone had imagined at the time.
Key events in the Global Financial Crisis
There are many key dates that economic commentators could point to as being significant events in the commencement and acceleration of the Global Financial Crisis (GFC).
In fact if one looks up the ‘Subprime crisis impact timeline’ on Wikipedia there are more than one hundred dates nominated as important in explaining the GFC4.
The Guardian newspaper in the United Kingdom put forward a list of five dates that marked the commencement of new stages in the GFC5. These dates are:
• 9 August 2007
• 15 September 2008
• 2 April 2008
• 9 May 2010
• 5 August 2011
The significance of each of these dates are explained below.
9 August 2007
On the 9th of August 2007 BNP Paribas Investment Partners decided to suspend subscriptions and redemptions, and the calculation of the net asset value, for the Parvest Dynamic ABS, the BNP Paribas ABS Euribor and BNP Paribas ABS Eonia hedge funds. The reasoning for this action was ‘the complete evaporation of liquidity in certain market segments of the US securitisation market’6 which made it no longer possible to value fairly the underlying US asset backed securities in those three funds.
This announcement made it clear to the market that there were trillions of dollars of essentially worthless derivatives circulating within the global financial system.
The Global Financial Crisis: 10 years on
7© 2017 KPMG, an Australian partnership and a member firm of the KPMG network of independent member firms affiliated with KPMG International Cooperative (“KPMG International”), a Swiss entity. All rights reserved. The KPMG name and logo are registered trademarks or trademarks of KPMG International. Liability limited by a scheme approved under Professional Standards Legislation.
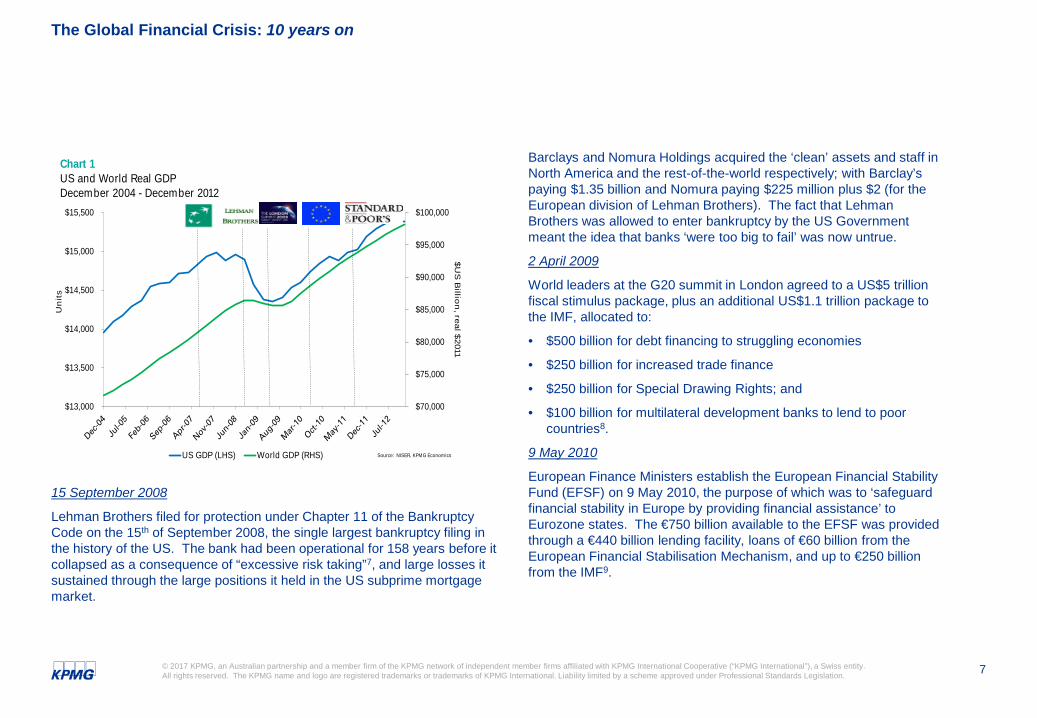
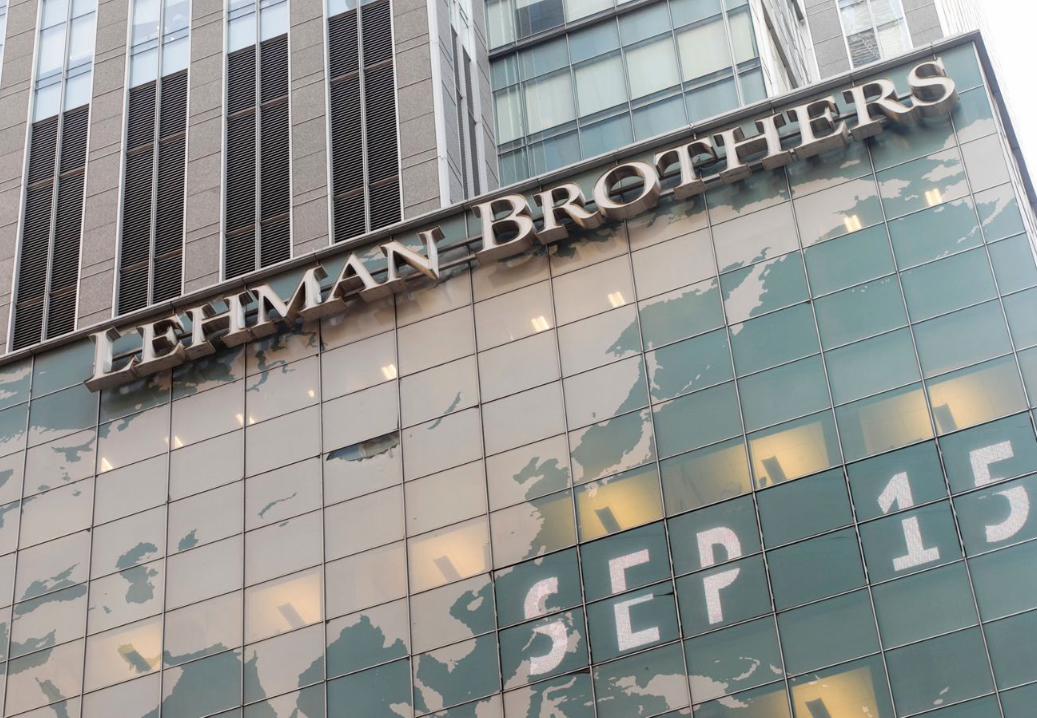
15 September 2008
Lehman Brothers filed for protection under Chapter 11 of the Bankruptcy Code on the 15th of September 2008, the single largest bankruptcy filing in the history of the US. The bank had been operational for 158 years before it collapsed as a consequence of “excessive risk taking”7, and large losses it sustained through the large positions it held in the US subprime mortgage market.
Barclays and Nomura Holdings acquired the ‘clean’ assets and staff in North America and the rest-of-the-world respectively; with Barclay’s paying $1.35 billion and Nomura paying $225 million plus $2 (for the European division of Lehman Brothers). The fact that Lehman Brothers was allowed to enter bankruptcy by the US Government meant the idea that banks ‘were too big to fail’ was now untrue.
2 April 2009
World leaders at the G20 summit in London agreed to a US$5 trillion fiscal stimulus package, plus an additional US$1.1 trillion package to the IMF, allocated to:
• $500 billion for debt financing to struggling economies
• $250 billion for increased trade finance
• $250 billion for Special Drawing Rights; and
• $100 billion for multilateral development banks to lend to poor countries8.
9 May 2010
European Finance Ministers establish the European Financial Stability Fund (EFSF) on 9 May 2010, the purpose of which was to ‘safeguard financial stability in Europe by providing financial assistance’ to Eurozone states. The €750 billion available to the EFSF was provided through a €440 billion lending facility, loans of €60 billion from the European Financial Stabilisation Mechanism, and up to €250 billion from the IMF9.
The Global Financial Crisis: 10 years on
$70,000
$75,000
$80,000
$85,000
$90,000
$95,000
$100,000
$13,000
$13,500
$14,000
$14,500
$15,000
$15,500
$U
S B
illion
, real $
2011
Un
its
Chart 1US and World Real GDPDecember 2004 - December 2012
US GDP (LHS) World GDP (RHS) Source: NISER, KPMG Economics
9© 2017 KPMG, an Australian partnership and a member firm of the KPMG network of independent member firms affiliated with KPMG International Cooperative (“KPMG International”), a Swiss entity. All rights reserved. The KPMG name and logo are registered trademarks or trademarks of KPMG International. Liability limited by a scheme approved under Professional Standards Legislation.
The establishment of the EFSF was in recognition that the risks associated with solvency of governments had materially increased, especially those in the Eurozone. Falling tax receipts, higher welfare payments, and the funding of fiscal stimulus packages had all placed significant budget pressures on various governments, resulting in the implementation of ‘austerity measures’ across many countries.
5 August 2011
At the end of the trading day on Friday, 5th August 2011, Standard and Poors(S&P) announced that America’s credit rating would be downgraded from AAA to AA+10. This downgrade occurred 3 days after the US Congress agreed to raise the debt ceiling of the federal government.
Two days later the Chinese official news agency, Xinhua, commented ”the days when the debt-ridden Uncle Sam could leisurely squander unlimited overseas borrowing appeared to be numbered” , “to cure its addiction to debts, the United States has to re-establish the common sense principle that one should live within its means”, and “China has every right now to demand the United States to address its structural debt problems and ensure the safety of China’s dollar assets”11.
While these words were not from an official statement from Beijing, it was recognized across the world that Xinhua often plays the informal mouthpiece on behalf of the Chinese Government, and therefore such comments did represent a dressing down from, at the time, the government of the second largest economy to the government of the largest economy.
Black Swan or White SwanThe former Governor of the Reserve Bank of Australia, Mr. Glenn Stevens, said in a speech at the Annual Dinner of Australian Business Economist in December 2008, “I do not know anyone who predicted this course of events. This should give us cause to reflect on how hard a job it is to make genuinely useful forecasts”12.
Coincidently, such sentiments were also espoused by Nouriel Roubini’sat the beginning of his speech at the IMF in 2006. He referred to the fact that Dr Prakash Lougani, from the IMF itself, had undertaken research that showed economic forecasters are poor at forecasting a recession, except for the fact that “the record of (economic forecasters) failure to predict a recession is virtually unblemished”13.
Those in the ‘No one saw this coming’14 camp, have suggested the GFC was a ‘black swan’ event. Nassim Taleb established the theory of black swan events to describe an event that comes as a surprise, has a major effect, and is often inappropriately rationalized after the fact with the benefit of hindsight.
Dirk Bezemer, from the University of Gronengin, in a study about the need for research into the link between accounting concepts and practices and macro economic outcomes, identified a dozen economic analysts who predicted the GFC against a set of criteria15.
The Global Financial Crisis: 10 years on
10© 2017 KPMG, an Australian partnership and a member firm of the KPMG network of independent member firms affiliated with KPMG International Cooperative (“KPMG International”), a Swiss entity. All rights reserved. The KPMG name and logo are registered trademarks or trademarks of KPMG International. Liability limited by a scheme approved under Professional Standards Legislation.
Bezemer found “there appears to be a set of interrelated elements central and common to the contrarians’ thinking. This comprises a concern with financial assets as distinct from real-sector assets, with the credit flows that finance both forms of wealth, with the debt growth accompanying growth in financial wealth, and with the accounting relation between the financial and real economy”.
Such findings reaffirm another proposition by Roubini that financial crises can be anticipated, understood, and even prevented – ‘white swans’ as opposed to unpredictable ‘black swan’ events. Of the GFC, he notes “this crisis is not a black swan event - a random outcome from a random distribution. This case is a build-up of vulnerabilities over time that will increase and provoke a crisis. There were tens of different signals that would eventually lead to a tipping point”16.
While the lead up to the GFC was a confluence of predictable events, its impact on the world economy was far more severe than anyone had thought possible. This underestimation of the contagion and systemic risk was due to the fact few understood the extent of the leverage in the system and the linkages between institutions.
Shocks that give rise to a crisis Warwick McKibbin and Andrew Stoeckel17 from Australian National University completed a study into the causes and consequences of the GFC in 2009. In this study McKibbin and Stoeckel formalised three shocks that gave rise to the onset of the GFC.
These were:
1. The bursting of the housing bubble causing a reallocation of capital and a loss of household wealth and a drop in consumption.
2. A sharp rise in the equity risk premium (the risk premium of equities over bonds) causing the cost of capital to rise, private investment to fall and demand for durable goods to collapse.
3. A reappraisal of risk by households causing them to discount their future labour income, increase savings and decrease consumption.
Key findings of the study relevant to understanding how the GFC developed include:
• when there is a global reassessment of risk, there is a large contraction in output and trade, the scale of which is determined by whether the market considers the crisis will be permanent or temporary
• a collapsing housing market has a larger impact on consumption and imports than does the reappraisal of risk
• rising risk causes the cost of capital to increase, resulting in capital stock being lower than it otherwise should be, which also contributes to a process of ‘deleveraging’ in the business sector; and
• from the household perspective, rising risk causes them to discount future labour income, increase savings, and decrease consumption, which further exacerbates the fall in business investment.
The Global Financial Crisis: 10 years on
11© 2017 KPMG, an Australian partnership and a member firm of the KPMG network of independent member firms affiliated with KPMG International Cooperative (“KPMG International”), a Swiss entity. All rights reserved. The KPMG name and logo are registered trademarks or trademarks of KPMG International. Liability limited by a scheme approved under Professional Standards Legislation.
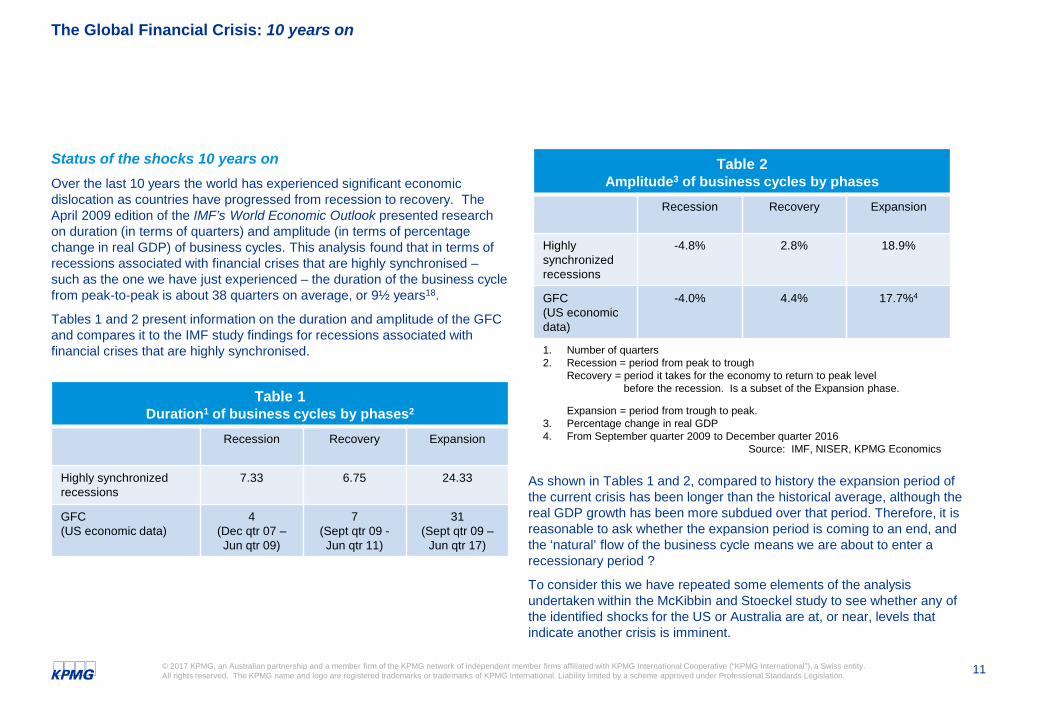
Status of the shocks 10 years onOver the last 10 years the world has experienced significant economic dislocation as countries have progressed from recession to recovery. The April 2009 edition of the IMF’s World Economic Outlook presented research on duration (in terms of quarters) and amplitude (in terms of percentage change in real GDP) of business cycles. This analysis found that in terms of recessions associated with financial crises that are highly synchronised –such as the one we have just experienced – the duration of the business cycle from peak-to-peak is about 38 quarters on average, or 9½ years18.
Tables 1 and 2 present information on the duration and amplitude of the GFC and compares it to the IMF study findings for recessions associated with financial crises that are highly synchronised.
As shown in Tables 1 and 2, compared to history the expansion period of the current crisis has been longer than the historical average, although the real GDP growth has been more subdued over that period. Therefore, it is reasonable to ask whether the expansion period is coming to an end, and the ‘natural’ flow of the business cycle means we are about to enter a recessionary period ?
To consider this we have repeated some elements of the analysis undertaken within the McKibbin and Stoeckel study to see whether any of the identified shocks for the US or Australia are at, or near, levels that indicate another crisis is imminent.
The Global Financial Crisis: 10 years on
Table 1Duration1 of business cycles by phases2
Recession Recovery Expansion
Highly synchronizedrecessions
7.33 6.75 24.33
GFC (US economic data)
4(Dec qtr 07 –Jun qtr 09)
7(Sept qtr 09 -Jun qtr 11)
31(Sept qtr 09 –
Jun qtr 17)
Table 2Amplitude3 of business cycles by phases
Recession Recovery Expansion
Highly synchronizedrecessions
-4.8% 2.8% 18.9%
GFC (US economic data)
-4.0% 4.4% 17.7%4
1. Number of quarters2. Recession = period from peak to trough
Recovery = period it takes for the economy to return to peak level before the recession. Is a subset of the Expansion phase.
Expansion = period from trough to peak.3. Percentage change in real GDP4. From September quarter 2009 to December quarter 2016
Source: IMF, NISER, KPMG Economics
12© 2017 KPMG, an Australian partnership and a member firm of the KPMG network of independent member firms affiliated with KPMG International Cooperative (“KPMG International”), a Swiss entity. All rights reserved. The KPMG name and logo are registered trademarks or trademarks of KPMG International. Liability limited by a scheme approved under Professional Standards Legislation.
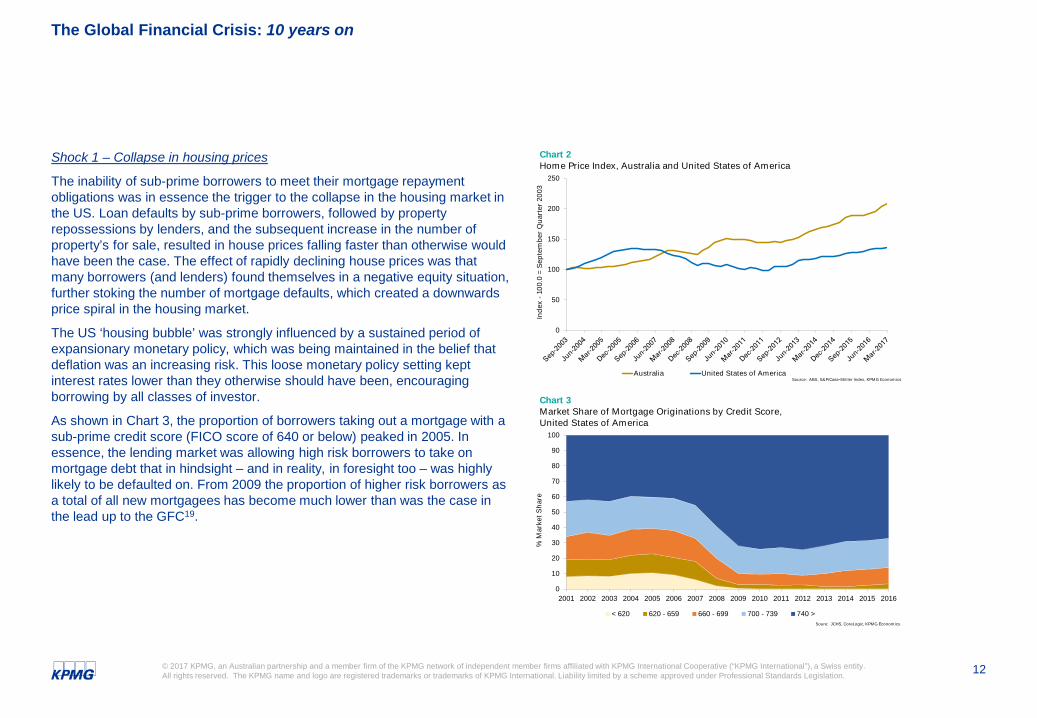
Shock 1 – Collapse in housing prices
The inability of sub-prime borrowers to meet their mortgage repayment obligations was in essence the trigger to the collapse in the housing market in the US. Loan defaults by sub-prime borrowers, followed by property repossessions by lenders, and the subsequent increase in the number of property’s for sale, resulted in house prices falling faster than otherwise would have been the case. The effect of rapidly declining house prices was that many borrowers (and lenders) found themselves in a negative equity situation, further stoking the number of mortgage defaults, which created a downwards price spiral in the housing market.
The US ‘housing bubble’ was strongly influenced by a sustained period of expansionary monetary policy, which was being maintained in the belief that deflation was an increasing risk. This loose monetary policy setting kept interest rates lower than they otherwise should have been, encouraging borrowing by all classes of investor.
As shown in Chart 3, the proportion of borrowers taking out a mortgage with a sub-prime credit score (FICO score of 640 or below) peaked in 2005. In essence, the lending market was allowing high risk borrowers to take on mortgage debt that in hindsight – and in reality, in foresight too – was highly likely to be defaulted on. From 2009 the proportion of higher risk borrowers as a total of all new mortgagees has become much lower than was the case in the lead up to the GFC19.
The Global Financial Crisis: 10 years on
0
50
100
150
200
250
Ind
ex -
100.
0 =
Sep
tem
ber
Qu
arte
r 20
03
Chart 2Home Price Index, Australia and United States of America
Australia United States of AmericaSource: ABS, S&P/Case-Shiller Index, KPMG Economics
0
10
20
30
40
50
60
70
80
90
100
2001 2002 2003 2004 2005 2006 2007 2008 2009 2010 2011 2012 2013 2014 2015 2016
% M
arke
t Sh
are
Chart 3Market Share of Mortgage Originations by Credit Score, United States of America
< 620 620 - 659 660 - 699 700 - 739 740 >Soure: JCHS, CoreLogic, KPMG Economics
13© 2017 KPMG, an Australian partnership and a member firm of the KPMG network of independent member firms affiliated with KPMG International Cooperative (“KPMG International”), a Swiss entity. All rights reserved. The KPMG name and logo are registered trademarks or trademarks of KPMG International. Liability limited by a scheme approved under Professional Standards Legislation.
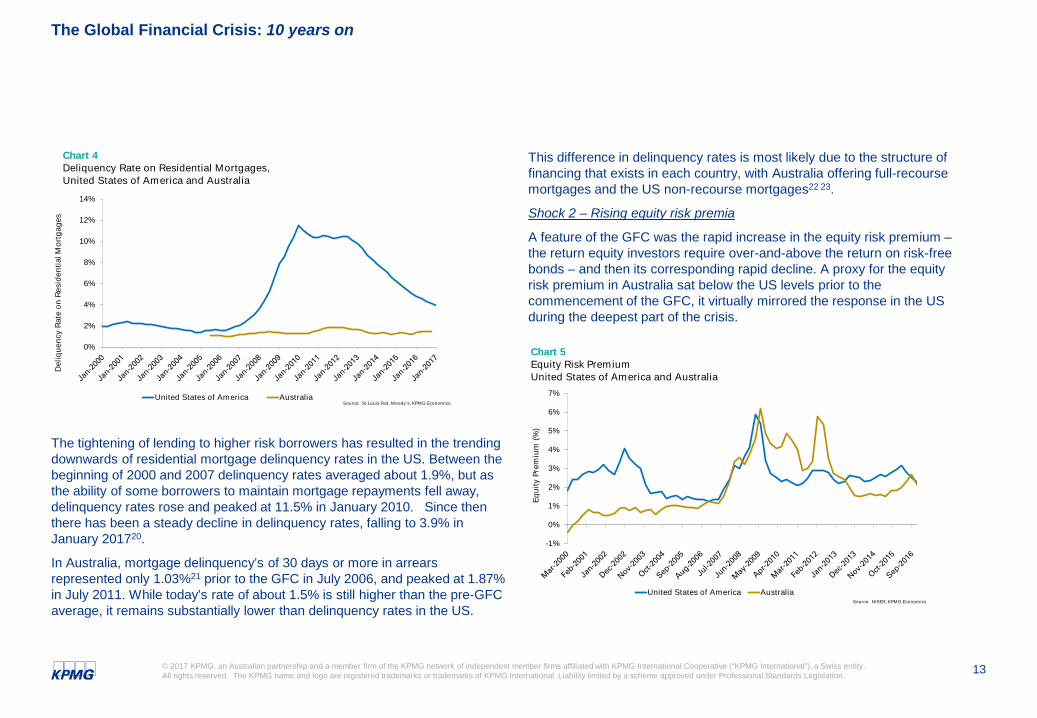
The tightening of lending to higher risk borrowers has resulted in the trending downwards of residential mortgage delinquency rates in the US. Between the beginning of 2000 and 2007 delinquency rates averaged about 1.9%, but as the ability of some borrowers to maintain mortgage repayments fell away, delinquency rates rose and peaked at 11.5% in January 2010. Since then there has been a steady decline in delinquency rates, falling to 3.9% in January 201720.
In Australia, mortgage delinquency’s of 30 days or more in arrears represented only 1.03%21 prior to the GFC in July 2006, and peaked at 1.87% in July 2011. While today’s rate of about 1.5% is still higher than the pre-GFC average, it remains substantially lower than delinquency rates in the US.
The Global Financial Crisis: 10 years on
0%
2%
4%
6%
8%
10%
12%
14%
Del
iqu
ency
Rat
e o
n R
esid
enti
al M
ort
gag
es
United States of America Australia
Chart 4Deliquency Rate on Residential Mortgages,United States of America and Australia
Source: St.Louis Fed, Moody's, KPMG Economics
This difference in delinquency rates is most likely due to the structure of financing that exists in each country, with Australia offering full-recourse mortgages and the US non-recourse mortgages22 23.
Shock 2 – Rising equity risk premia
A feature of the GFC was the rapid increase in the equity risk premium –the return equity investors require over-and-above the return on risk-free bonds – and then its corresponding rapid decline. A proxy for the equity risk premium in Australia sat below the US levels prior to the commencement of the GFC, it virtually mirrored the response in the US during the deepest part of the crisis.
-1%
0%
1%
2%
3%
4%
5%
6%
7%
Eq
uit
y Pr
emiu
m (
%)
Chart 5Equity Risk Premium United States of America and Australia
United States of America AustraliaSource: NISER, KPMG Economics
14© 2017 KPMG, an Australian partnership and a member firm of the KPMG network of independent member firms affiliated with KPMG International Cooperative (“KPMG International”), a Swiss entity. All rights reserved. The KPMG name and logo are registered trademarks or trademarks of KPMG International. Liability limited by a scheme approved under Professional Standards Legislation.
Since then Australia’s equity risk premia – proxied by the spread between the BofA Merrill Lynch BBB Australia Corporate Index and the Commonwealth Government 10-year bond rate – has been significantly more volatile than that of the US. In fact, the average of this premium since the March quarter 2010 has been 2.5% for the US and 2.8% for Australia.
The most recent data indicates that the risk premia in the US and Australia have been moving downwards. For the US it appears the current levels are within the range previously experienced prior to the GFC, however for Australia it seems the risk premium has shifted upwards.
The Global Financial Crisis: 10 years on
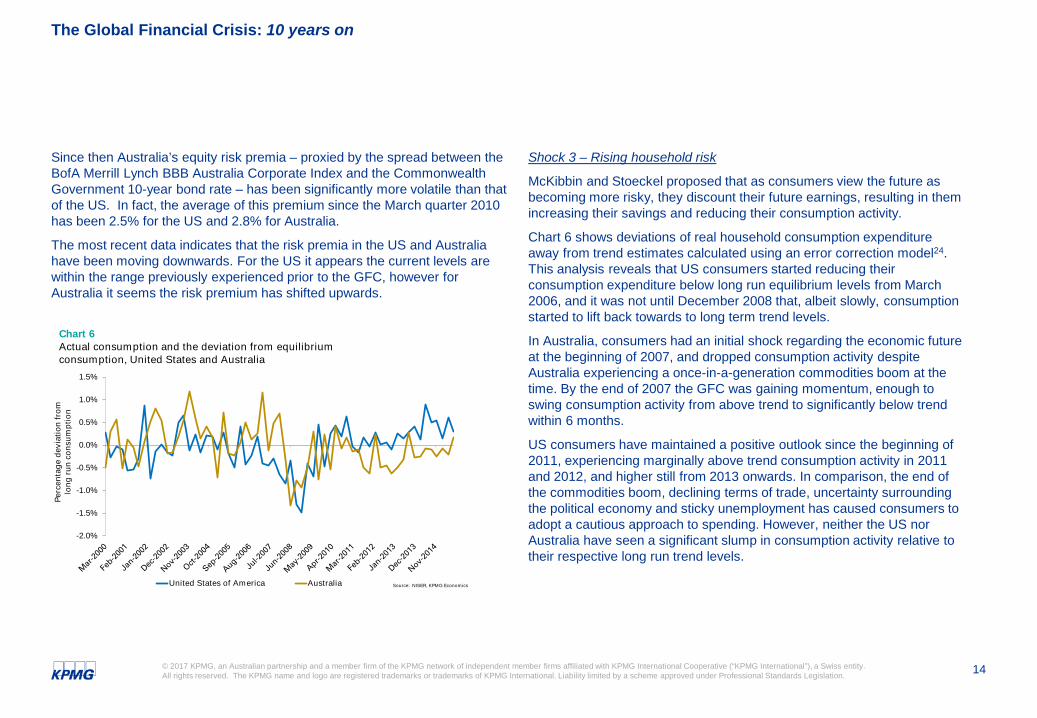
Shock 3 – Rising household risk
McKibbin and Stoeckel proposed that as consumers view the future as becoming more risky, they discount their future earnings, resulting in them increasing their savings and reducing their consumption activity.
Chart 6 shows deviations of real household consumption expenditure away from trend estimates calculated using an error correction model24. This analysis reveals that US consumers started reducing their consumption expenditure below long run equilibrium levels from March 2006, and it was not until December 2008 that, albeit slowly, consumption started to lift back towards to long term trend levels.
In Australia, consumers had an initial shock regarding the economic future at the beginning of 2007, and dropped consumption activity despite Australia experiencing a once-in-a-generation commodities boom at the time. By the end of 2007 the GFC was gaining momentum, enough to swing consumption activity from above trend to significantly below trend within 6 months.
US consumers have maintained a positive outlook since the beginning of 2011, experiencing marginally above trend consumption activity in 2011 and 2012, and higher still from 2013 onwards. In comparison, the end of the commodities boom, declining terms of trade, uncertainty surrounding the political economy and sticky unemployment has caused consumers to adopt a cautious approach to spending. However, neither the US nor Australia have seen a significant slump in consumption activity relative to their respective long run trend levels.
-2.0%
-1.5%
-1.0%
-0.5%
0.0%
0.5%
1.0%
1.5%
Perc
enta
ge
dev
iati
on
fro
m
lon
g r
un
co
nsu
mp
tio
n
Chart 6Actual consumption and the deviation from equilibrium consumption, United States and Australia
United States of America Australia Source: NISER, KPMG Economics

16© 2017 KPMG, an Australian partnership and a member firm of the KPMG network of independent member firms affiliated with KPMG International Cooperative (“KPMG International”), a Swiss entity. All rights reserved. The KPMG name and logo are registered trademarks or trademarks of KPMG International. Liability limited by a scheme approved under Professional Standards Legislation.
If not the US, will it be someone else?The previous analysis indicates that neither the US nor Australia are on the precipice of another major financial crisis. However, this unfortunately does not mean there are other forms of shocks that could combine to create a different form of credit crisis. Under this circumstance the fundamental question then becomes whether the current global financial system has evolved enough in the past decade to be able to better deal with such a situation?
Apprehensions about the status of the global economy drive us to ask questions that frame emerging or unresolved risks, such as:
• Do we really understand the economic situation in China, and could the recent build up of debt – which has been estimated by the Institute of International Finance at 304% in May 201725 - trigger a collapse in financial markets?
• Has the problem with the Greek economy been fixed, or has it merely just dropped off the economic radar?
• Have the financial and economic woes of Italy, Portugal and Spain been resolved properly, or has there merely been a shift in risk from the financial system to the public sector?; and
• Will the process of reversing Quantitative Easing - Quantitative Tightening – result in a catastrophic fall in domestic demand, pushing the world economy back into a downward growth spiral?
While there are numerous scenarios that warrant further analysis to see if they represent an early signal on increasing risk within the global financial system, one of the contemporary concerns noted above is often, and increasingly so, becoming a focus of attention in the world’s media
The Bank of International Settlements (BIS) March 2017 Quarterly Review26 identified elevated signs of stress in the domestic banking system for China as measured by an elevation in 3 out of 4 early warning indicators.
Given this, and the fact that China is now the largest economy in the world, KPMG have sought to apply the same analysis we have just completed for the US and Australia on China.
Is there a property bubble waiting to burst in China ?
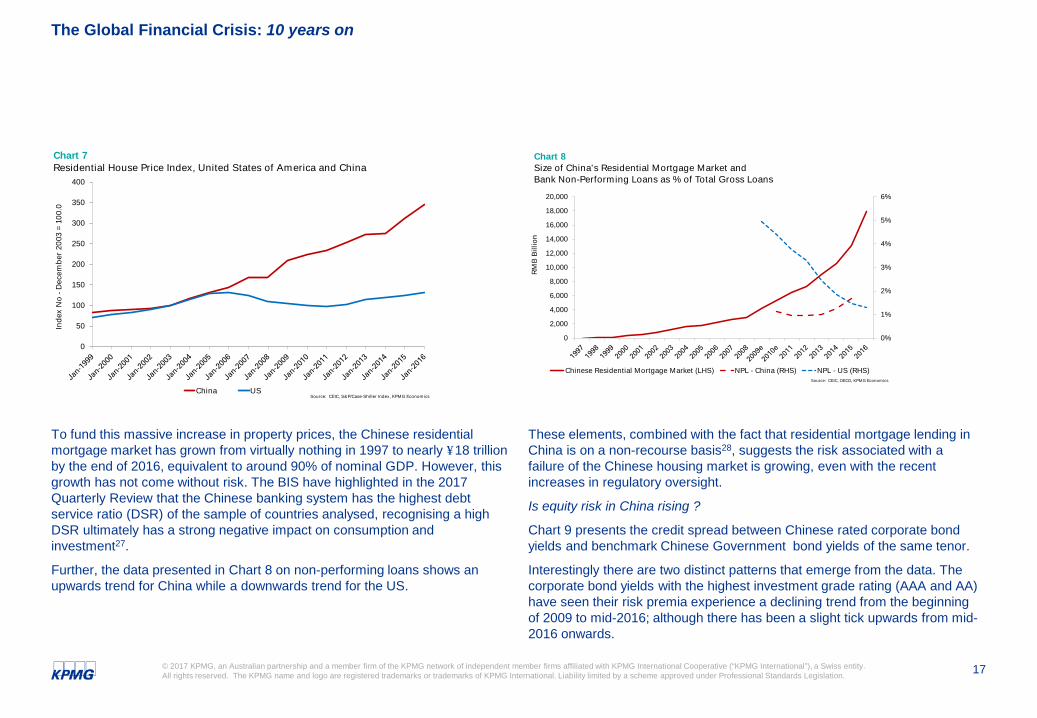
Residential property prices in China, as measured by the selling price (RMB per sq.m.) for the 35 city average, has grown at compound average annual growth of 8.7% per annum since 1999, as compared with 3.4% for the US. While average house price growth in China has been more than double that of the US, the difference in annual growth in real GDP between the two counties has been even more pronounced, at 9.4% and 1.8% per annum respectively.
The Global Financial Crisis: 10 years on
17© 2017 KPMG, an Australian partnership and a member firm of the KPMG network of independent member firms affiliated with KPMG International Cooperative (“KPMG International”), a Swiss entity. All rights reserved. The KPMG name and logo are registered trademarks or trademarks of KPMG International. Liability limited by a scheme approved under Professional Standards Legislation.
To fund this massive increase in property prices, the Chinese residential mortgage market has grown from virtually nothing in 1997 to nearly ¥18 trillion by the end of 2016, equivalent to around 90% of nominal GDP. However, this growth has not come without risk. The BIS have highlighted in the 2017 Quarterly Review that the Chinese banking system has the highest debt service ratio (DSR) of the sample of countries analysed, recognising a high DSR ultimately has a strong negative impact on consumption and investment27.
Further, the data presented in Chart 8 on non-performing loans shows an upwards trend for China while a downwards trend for the US.
The Global Financial Crisis: 10 years on
These elements, combined with the fact that residential mortgage lending in China is on a non-recourse basis28, suggests the risk associated with a failure of the Chinese housing market is growing, even with the recent increases in regulatory oversight.
Is equity risk in China rising ?
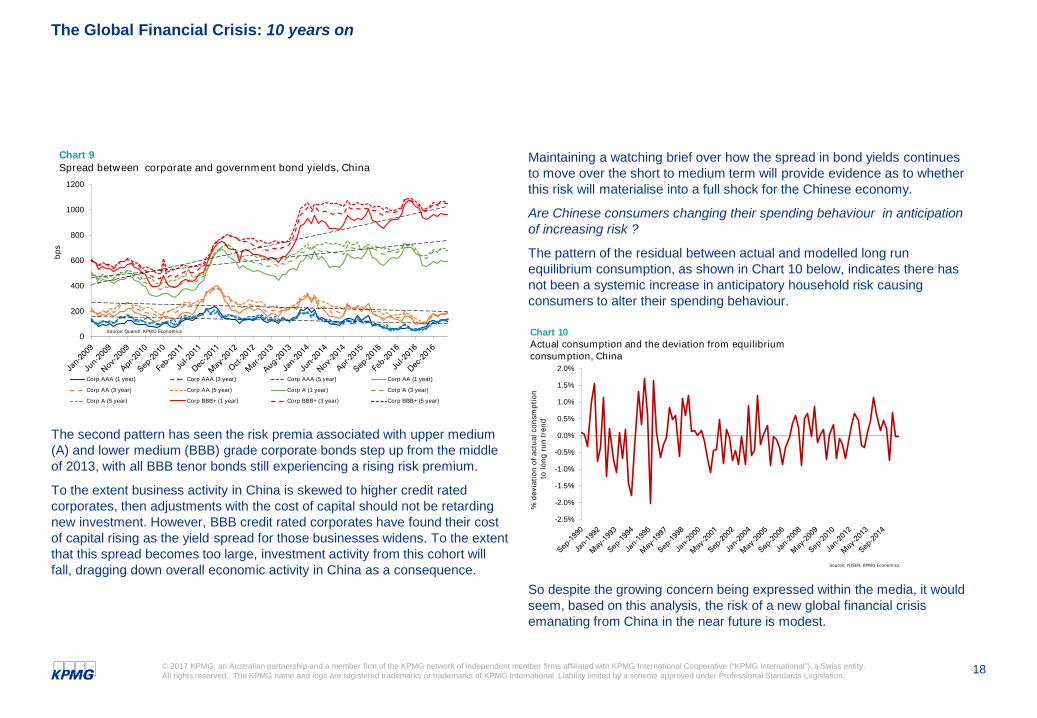
Chart 9 presents the credit spread between Chinese rated corporate bond yields and benchmark Chinese Government bond yields of the same tenor.
Interestingly there are two distinct patterns that emerge from the data. The corporate bond yields with the highest investment grade rating (AAA and AA) have seen their risk premia experience a declining trend from the beginning of 2009 to mid-2016; although there has been a slight tick upwards from mid-2016 onwards.
0
50
100
150
200
250
300
350
400
Ind
ex N
o -
Dec
emb
er 2
003
= 10
0.0
Chart 7Residential House Price Index, United States of America and China
China USSource: CEIC, S&P/Case-Shiller Index, KPMG Economics
0%
1%
2%
3%
4%
5%
6%
0
2,000
4,000
6,000
8,000
10,000
12,000
14,000
16,000
18,000
20,000
RM
B B
illio
n
Chart 8Size of China's Residential Mortgage Market and Bank Non-Performing Loans as % of Total Gross Loans
Chinese Residential Mortgage Market (LHS) NPL - China (RHS) NPL - US (RHS)Source: CEIC, OECD, KPMG Economics
18© 2017 KPMG, an Australian partnership and a member firm of the KPMG network of independent member firms affiliated with KPMG International Cooperative (“KPMG International”), a Swiss entity. All rights reserved. The KPMG name and logo are registered trademarks or trademarks of KPMG International. Liability limited by a scheme approved under Professional Standards Legislation.
The second pattern has seen the risk premia associated with upper medium (A) and lower medium (BBB) grade corporate bonds step up from the middle of 2013, with all BBB tenor bonds still experiencing a rising risk premium.
To the extent business activity in China is skewed to higher credit rated corporates, then adjustments with the cost of capital should not be retarding new investment. However, BBB credit rated corporates have found their cost of capital rising as the yield spread for those businesses widens. To the extent that this spread becomes too large, investment activity from this cohort will fall, dragging down overall economic activity in China as a consequence.
The Global Financial Crisis: 10 years on
Maintaining a watching brief over how the spread in bond yields continues to move over the short to medium term will provide evidence as to whether this risk will materialise into a full shock for the Chinese economy.
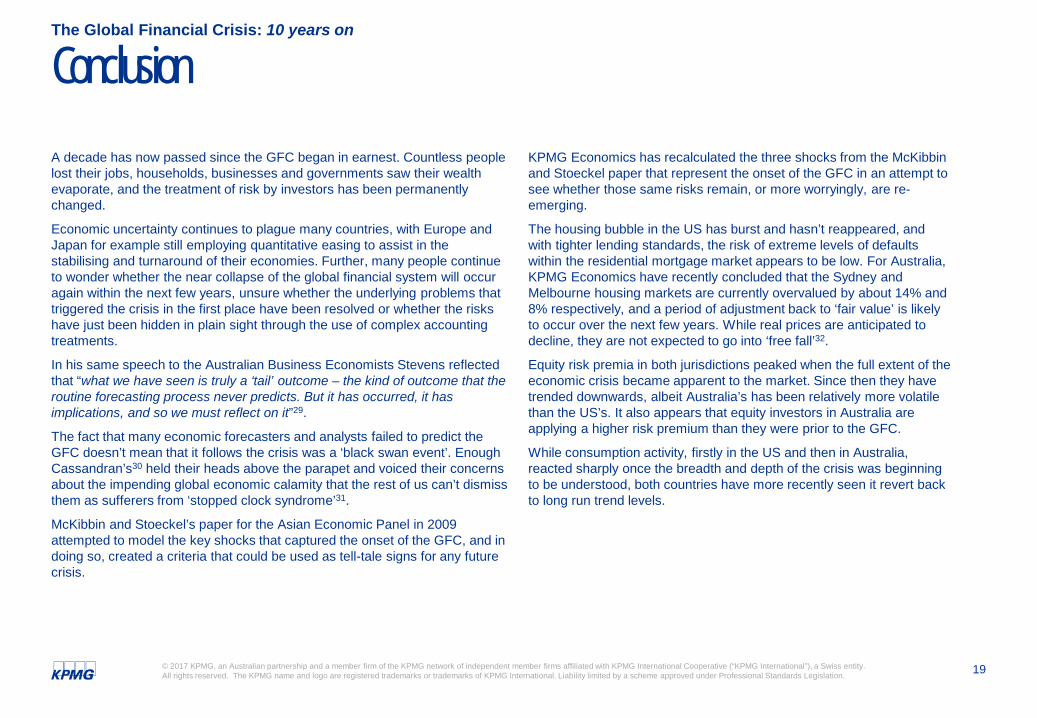
Are Chinese consumers changing their spending behaviour in anticipation of increasing risk ?
The pattern of the residual between actual and modelled long run equilibrium consumption, as shown in Chart 10 below, indicates there has not been a systemic increase in anticipatory household risk causing consumers to alter their spending behaviour.
So despite the growing concern being expressed within the media, it would seem, based on this analysis, the risk of a new global financial crisis emanating from China in the near future is modest.
-2.5%
-2.0%
-1.5%
-1.0%
-0.5%
0.0%
0.5%
1.0%
1.5%
2.0%
% d
evia
tio
n o
f ac
tual
co
nsm
pti
on
to lo
ng
ru
n t
ren
d
Chart 10Actual consumption and the deviation from equilibrium consumption, China
Source: NISER, KPMG Economics
0
200
400
600
800
1000
1200
bp
s
Chart 9Spread between corporate and government bond yields, China
Corp AAA (1 year) Corp AAA (3 year) Corp AAA (5 year) Corp AA (1 year)
Corp AA (3 year) Corp AA (5 year) Corp A (1 year) Corp A (3 year)
Corp A (5 year) Corp BBB+ (1 year) Corp BBB+ (3 year) Corp BBB+ (5 year)
Source: Quandl, KPMG Economics
19© 2017 KPMG, an Australian partnership and a member firm of the KPMG network of independent member firms affiliated with KPMG International Cooperative (“KPMG International”), a Swiss entity. All rights reserved. The KPMG name and logo are registered trademarks or trademarks of KPMG International. Liability limited by a scheme approved under Professional Standards Legislation.
A decade has now passed since the GFC began in earnest. Countless people lost their jobs, households, businesses and governments saw their wealth evaporate, and the treatment of risk by investors has been permanently changed.
Economic uncertainty continues to plague many countries, with Europe and Japan for example still employing quantitative easing to assist in the stabilising and turnaround of their economies. Further, many people continue to wonder whether the near collapse of the global financial system will occur again within the next few years, unsure whether the underlying problems that triggered the crisis in the first place have been resolved or whether the risks have just been hidden in plain sight through the use of complex accounting treatments.
In his same speech to the Australian Business Economists Stevens reflected that “what we have seen is truly a ‘tail’ outcome – the kind of outcome that the routine forecasting process never predicts. But it has occurred, it has implications, and so we must reflect on it”29.
The fact that many economic forecasters and analysts failed to predict the GFC doesn’t mean that it follows the crisis was a ‘black swan event’. Enough Cassandran’s30 held their heads above the parapet and voiced their concerns about the impending global economic calamity that the rest of us can’t dismiss them as sufferers from ‘stopped clock syndrome’31.
McKibbin and Stoeckel’s paper for the Asian Economic Panel in 2009 attempted to model the key shocks that captured the onset of the GFC, and in doing so, created a criteria that could be used as tell-tale signs for any future crisis.
KPMG Economics has recalculated the three shocks from the McKibbinand Stoeckel paper that represent the onset of the GFC in an attempt to see whether those same risks remain, or more worryingly, are re-emerging.
The housing bubble in the US has burst and hasn’t reappeared, and with tighter lending standards, the risk of extreme levels of defaults within the residential mortgage market appears to be low. For Australia, KPMG Economics have recently concluded that the Sydney and Melbourne housing markets are currently overvalued by about 14% and 8% respectively, and a period of adjustment back to ‘fair value’ is likely to occur over the next few years. While real prices are anticipated to decline, they are not expected to go into ‘free fall’32.
Equity risk premia in both jurisdictions peaked when the full extent of the economic crisis became apparent to the market. Since then they have trended downwards, albeit Australia’s has been relatively more volatile than the US’s. It also appears that equity investors in Australia are applying a higher risk premium than they were prior to the GFC.
While consumption activity, firstly in the US and then in Australia, reacted sharply once the breadth and depth of the crisis was beginning to be understood, both countries have more recently seen it revert back to long run trend levels.
ConclusionThe Global Financial Crisis: 10 years on
20© 2017 KPMG, an Australian partnership and a member firm of the KPMG network of independent member firms affiliated with KPMG International Cooperative (“KPMG International”), a Swiss entity. All rights reserved. The KPMG name and logo are registered trademarks or trademarks of KPMG International. Liability limited by a scheme approved under Professional Standards Legislation.
While economists are often castigated as being overly optimistic, it would seem our analysis of the McKibbin and Stoeckel tell-tale shocks suggests another GFC emanating from the US or Australia is unlikely in the immediate future.
But the prospect of another collapse of the global financial system, contagion and the re-emergence of systemic risks in markets cannot just be centred on western economies. China, which is now the largest economy on a GDP basis, has been targeted by the world media and economic analysts as suffering from imbalances that give rise to concerns of increasing risks.
Issues such as extreme debt-to-GDP levels, accelerating house prices (despite the introduction of various regulatory controls), consumer biased recourse residential mortgage financing, and rising cost of capital suggest the risk profile of China is increasing.
While Dickens told us nearly 200 years ago to ‘never say never’33, an assessment of the tell-tale signs suggests that two out of three shocks are showing signs of emerging, but they are not at a point where it would seem an economic catastrophe is imminent.
The 9th of August 2007 saw an event occur that could be argued was the start of the GFC. The last decade has seen a significant amount of economic dislocation, and if we don’t continue to remember this and reflect on it, how can we ensure the global financial system becomes stronger from these hard lessons learnt from the crisis.
ConclusionThe Global Financial Crisis: 10 years on
21© 2017 KPMG, an Australian partnership and a member firm of the KPMG network of independent member firms affiliated with KPMG International Cooperative (“KPMG International”), a Swiss entity. All rights reserved. The KPMG name and logo are registered trademarks or trademarks of KPMG International. Liability limited by a scheme approved under Professional Standards Legislation.
1. www.economonitor.com/nouriel/2010/09/02/economonitor-flashback-roubinis-imf-speech-september-7-2006/
2. Ibid
3. Ibid
4. en.wikipedia.org/wiki/Subprime_crisis_impact_timeline
5. The Guardian, Global financial crisis: five key stages 2007-2011,8 August 2011
6. BNP Paribas, Media Release “BNP Paribas Investment Partners temporaly suspends the calculation of the Net Asset Value of the following funds : Parvest Dynamic ABS, BNP Paribas ABS EURIBOR and BNP Paribas ABS EONIA”, Paris, 9th Aug. 2007
7. Barlow, R., “Learning from Lehman Brothers”, BU Today,17/6/2010
8. IMF, London Summit – Leaders’ Statement, 2 April 2009
9. Council of the European Union, 9596/10 (Presse 108), Press Release, Extraordinary Council Meeting, Economic and Financial Affairs, Brussels, 9/10 may 2010
10. Standard and Poors, Press Release, “United States of America Long-Term Rating Lowered To 'AA+' Due To Political Risks, Rising Debt Burden; Outlook Negative”, 5 August 2011
11. Financial Times, “China urges US to ‘live within its means’”, 7 August 2011
12. RBA, Speech, “Interesting times”, Address to the Australian Business Economists Annual Dinner Sydney, 9 December 2008
13. www.economonitor.com/nouriel/2010/09/02/economonitor-flashback-roubinis-imf-speech-september-7-2006/
14. Bezemer, D. J., “No One Saw This Coming”, Understanding Financial Crisis Through Accounting Models, University of Groningen, 2009
15. Ibid
16. The Guardian, “He told us so”, 24 January 2009
17. McKibbin, W.J., Stoeckel, A., The Global Financial Crisis: Causes and Consequences, ANU, September 2009
18. IMF, World Economic Outlook, Chapter 3 From Recession to Recovery: How soon and how strong?, April 2009
19. Joint Centre for Housing Studies of Harvard University, The State of the Nation’s Housing, 2017 Edition
20. Federal Reserve Bank of St.Louis, FRED Graph Obeservations, Delinquency Rate on Single-Family Residential Mortgages, Booked in Domestic Offices, All Commercial Banks, Percent, Quarterly, Seasonally Adjusted, DRSFRMACBS
21. Current balance of loans greater than 30 days in arrears divided by total current balance
22. Ghent, A. C.and Kudlyak, M, ‘Recourse and Residential Mortgage Default: Theory and Evidence from U.S. States’, Federal Reserve Bank of Richmond Working Paper No 09-10R, 2010
End notesThe Global Financial Crisis: 10 years on
22© 2017 KPMG, an Australian partnership and a member firm of the KPMG network of independent member firms affiliated with KPMG International Cooperative (“KPMG International”), a Swiss entity. All rights reserved. The KPMG name and logo are registered trademarks or trademarks of KPMG International. Liability limited by a scheme approved under Professional Standards Legislation.
23. Defined in Harris, R.. Meir, A., Recourse Structure of Mortgages:A Comparison between the US and Europe, CESifo DICE Report, 4/2015, December, as “In a recourse mortgage the lender can foreclose the secured asset and also has recourse to the borrower himself, which means that the lender can also collect the debt from the borrower’s unsecured personal assets and from his future income. In a non-recourse mortgage the lender is confined to the secured asset. He can foreclose, repossess the house, sell and collect the proceeds, but have no recourse, due to legal limitations that will be discussed below, to the personal assets of the borrower, or to the borrower’s future income”.
24. An error correction model can be conceptualized in two parts.The first is a long-run equilibrium relationship, such as :
𝐿𝐿𝐿𝐿𝐿𝐿 = 𝐴𝐴 + 𝐵𝐵 𝐿𝐿𝐿𝐿𝐿𝐿 + 𝜇𝜇
Where X is a vector of independent, contemporaneous variables. Broadly, the ECM framework recognises that Y can deviate from its long run equilibrium level in the short run but that if the long run relationship is robust then there will be a tendency for Y to revert to the equilibrium level over time. This is captured by embedding the long run relationship within a dynamic model as follows:
∆𝑙𝑙𝐿𝐿𝐿𝐿𝑡𝑡 = 𝛼𝛼 + ∑𝑠𝑠=1𝑆𝑆 𝜃𝜃𝑠𝑠 × ∆𝑙𝑙𝐿𝐿𝐿𝐿𝑡𝑡−𝑠𝑠 + ∑𝑠𝑠=1𝑆𝑆 𝜹𝜹𝑠𝑠 × ∆𝑙𝑙𝐿𝐿𝑿𝑿𝑡𝑡−𝑠𝑠 + ∑𝑠𝑠=0𝑆𝑆 𝜷𝜷𝑠𝑠 × ∆𝑙𝑙𝐿𝐿𝒁𝒁𝑡𝑡−𝑠𝑠− 𝛾𝛾 𝑙𝑙𝐿𝐿𝐿𝐿 − 𝐴𝐴 − 𝑩𝑩 × 𝑙𝑙𝐿𝐿𝑿𝑿 + 𝜀𝜀𝑡𝑡In simple terms, when long run equilibrium is reached all first difference variables (ie: those represented with a ∆ prefix) converge to a value of 0, leaving the long run relationship to determine the value of Y.
25. Institute of International Finance, Global Debt Monitor, June 2017
26. Bank for International Settlements, BIS Quarterly Review, March 2017
27. Ibid
28. IMF Staff Discussion Note, Housing Finance and Real-Estate Booms: A Cross-Country Perspective level over time, SDN 15/12, 2015
29. RBA, Speech, “Interesting times”, Address to the Australian Business Economists Annual Dinner Sydney, 9 December 2008
30. Defined in the English Oxford Living dictionaries as originating from Greek mythology, and describing someone as “a prophet of disaster, especially one who is disregarded.”
31. As described in Bezemer (2009), “A stopped clock is correct twice a day, and the mere existence of predictions is not informative on the theoretical validity of such predictions since, in financial market parlance, ‘every bear has his day’.
32. KPMG Economics, “Housing affordability: What is driving housing prices in Sydney and Melbourne”, June 2017
33. Charles Dickens, The Posthumous Papers of the Pickwick Club, 1836
End notes (cont.)The Global Financial Crisis: 10 years on
KPMG.com.au
© 2017 KPMG, an Australian partnership and a member firm of the KPMG network of independent member firms affiliated with KPMG International Cooperative (“KPMG International”), a Swiss entity. All rights reserved.
The KPMG name and logo are registered trademarks or trademarks of KPMG International.
Liability limited by a scheme approved under Professional Standards Legislation.
The information contained in this document is of a general nature and is not intended to address the objectives, financial situation or needs of any particular individual or entity. It is provided for information purposes only and does not constitute, nor should it be regarded in any manner whatsoever, as advice and is not intended to influence a person in making a decision, including, if applicable, in relation to any financial product or an interest in a financial product. Although we endeavour to provide accurate and timely information, there can be no guarantee that such information is accurate as of the date it is received or that it will continue to be accurate in the future. No one should act on such information without appropriate professional advice after a thorough examination of the particular situation.
To the extent permissible by law, KPMG and its associated entities shall not be liable for any errors, omissions, defects or misrepresentations in the information or for any loss or damage suffered by persons who use or rely on such information (including for reasons of negligence, negligent misstatement or otherwise).
ContactBrendan RynnePartner, Chief [email protected]
03 9288 5780