the gigatonne gap in china’s carbon dioxide inventories · 2 1. comparison of differences in...
TRANSCRIPT
SUPPLEMENTARY INFORMATIONDOI: 10.1038/NCLIMATE1560
NATURE CLIMATE CHANGE | www.nature.com/natureclimatechange 1
1
Supporting Information
This supporting information presents the energy data (taking 2010 data as an example), calculation process and the results of CO2 emissions as provided by the national versus provincial statistical offices between 1997 – 2010.
This supporting information is organised as follows: Section 1 provides comparison of differences in the energy statistics, by primary fuel type, between provincial aggregation and national total in 2010. Section 2 lists differences of GDP, industrial products and energy supply between provincial aggregation and national total in 2010. Section 3 lists results for provincial and national CO2 emission estimation during 1997-2010. Section 4 provides China’s CO2 emissions from international statistical sources.
The gigatonne gap in China’s carbon dioxide inventories
© 2012 Macmillan Publishers Limited. All rights reserved.
2
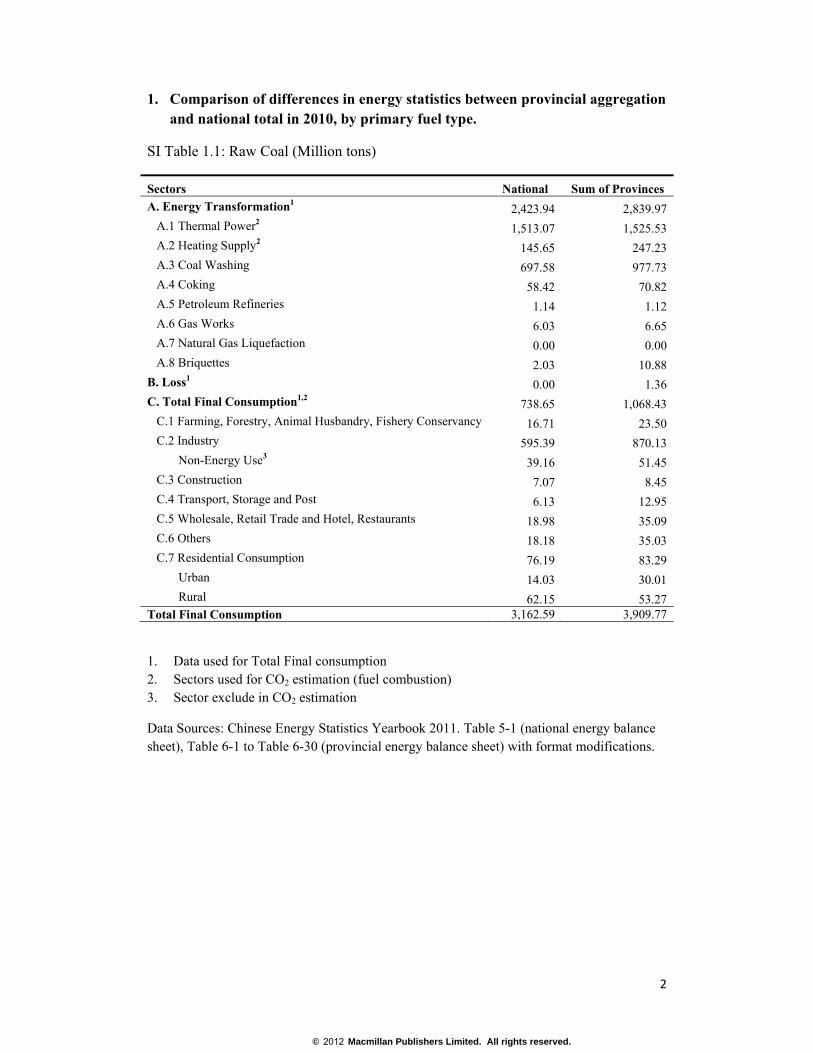
1. Comparison of differences in energy statistics between provincial aggregation and national total in 2010, by primary fuel type.
SI Table 1.1: Raw Coal (Million tons)
Sectors National Sum of Provinces
A. Energy Transformation1 2,423.94 2,839.97 A.1 Thermal Power2 1,513.07 1,525.53 A.2 Heating Supply2 145.65 247.23 A.3 Coal Washing 697.58 977.73 A.4 Coking 58.42 70.82 A.5 Petroleum Refineries 1.14 1.12 A.6 Gas Works 6.03 6.65 A.7 Natural Gas Liquefaction 0.00 0.00 A.8 Briquettes 2.03 10.88 B. Loss1 0.00 1.36 C. Total Final Consumption1,2 738.65 1,068.43 C.1 Farming, Forestry, Animal Husbandry, Fishery Conservancy 16.71 23.50 C.2 Industry 595.39 870.13 Non-Energy Use3 39.16 51.45 C.3 Construction 7.07 8.45 C.4 Transport, Storage and Post 6.13 12.95 C.5 Wholesale, Retail Trade and Hotel, Restaurants 18.98 35.09 C.6 Others 18.18 35.03 C.7 Residential Consumption 76.19 83.29 Urban 14.03 30.01 Rural 62.15 53.27 Total Final Consumption 3,162.59 3,909.77
1. Data used for Total Final consumption 2. Sectors used for CO2 estimation (fuel combustion) 3. Sector exclude in CO2 estimation
Data Sources: Chinese Energy Statistics Yearbook 2011. Table 5-1 (national energy balance sheet), Table 6-1 to Table 6-30 (provincial energy balance sheet) with format modifications.
© 2012 Macmillan Publishers Limited. All rights reserved.
3
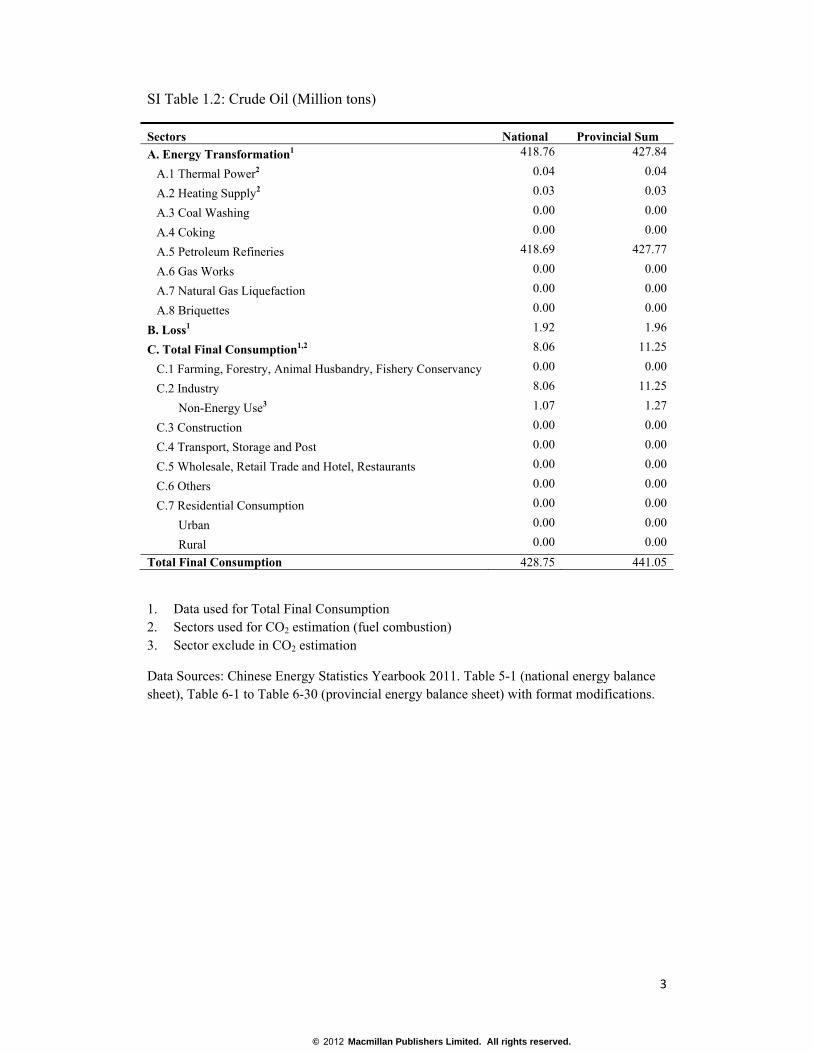
SI Table 1.2: Crude Oil (Million tons)
Sectors National Provincial Sum
A. Energy Transformation1 418.76 427.84
A.1 Thermal Power2 0.04 0.04
A.2 Heating Supply2 0.03 0.03
A.3 Coal Washing 0.00 0.00
A.4 Coking 0.00 0.00
A.5 Petroleum Refineries 418.69 427.77
A.6 Gas Works 0.00 0.00
A.7 Natural Gas Liquefaction 0.00 0.00
A.8 Briquettes 0.00 0.00
B. Loss1 1.92 1.96
C. Total Final Consumption1,2 8.06 11.25
C.1 Farming, Forestry, Animal Husbandry, Fishery Conservancy 0.00 0.00
C.2 Industry 8.06 11.25
Non-Energy Use3 1.07 1.27
C.3 Construction 0.00 0.00
C.4 Transport, Storage and Post 0.00 0.00
C.5 Wholesale, Retail Trade and Hotel, Restaurants 0.00 0.00
C.6 Others 0.00 0.00
C.7 Residential Consumption 0.00 0.00
Urban 0.00 0.00
Rural 0.00 0.00
Total Final Consumption 428.75 441.05
1. Data used for Total Final Consumption 2. Sectors used for CO2 estimation (fuel combustion) 3. Sector exclude in CO2 estimation
Data Sources: Chinese Energy Statistics Yearbook 2011. Table 5-1 (national energy balance sheet), Table 6-1 to Table 6-30 (provincial energy balance sheet) with format modifications.
© 2012 Macmillan Publishers Limited. All rights reserved.

4
SI Table 1.3: Natural Gas (Billion cubic meters)
Sectors National Provincial Sum
A. Energy Transformation1 20.10 21.45
A.1 Thermal Power2 16.18 17.56
A.2 Heating Supply2 2.80 2.80
A.3 Coal Washing 0.00 0.00
A.4 Coking 0.00 0.00
A.5 Petroleum Refineries 0.00 0.00
A.6 Gas Works 0.39 0.35
A.7 Natural Gas Liquefaction 0.73 0.73
A.8 Briquettes 0.00 0.00
B. Loss1 1.71 1.71
C. Total Final Consumption1,2 72.36 88.45
C.1 Farming, Forestry, Animal Husbandry, Fishery Conservancy 0.05 0.08
C.2 Industry 36.21 57.03
Non-Energy Use3 9.05 11.10
C.3 Construction 0.12 0.66
C.4 Transport, Storage and Post 7.97 4.95
C.5 Wholesale, Retail Trade and Hotel, Restaurants 2.72 5.25
C.6 Others 2.60 3.26
C.7 Residential Consumption 22.69 17.22
Urban 22.62 16.92
Rural 0.07 0.29
Total Final Consumption 94.17 111.61
1. Data used for Total Final Consumption 2. Sectors used for CO2 estimation (fuel combustion) 3. Sector exclude in CO2 estimation
Data Sources: Chinese Energy Statistics Yearbook 2011. Table 5-1 (national energy balance
sheet), Table 6-1 to Table 6-30 (provincial energy balance sheet) with format modifications.
© 2012 Macmillan Publishers Limited. All rights reserved.
5
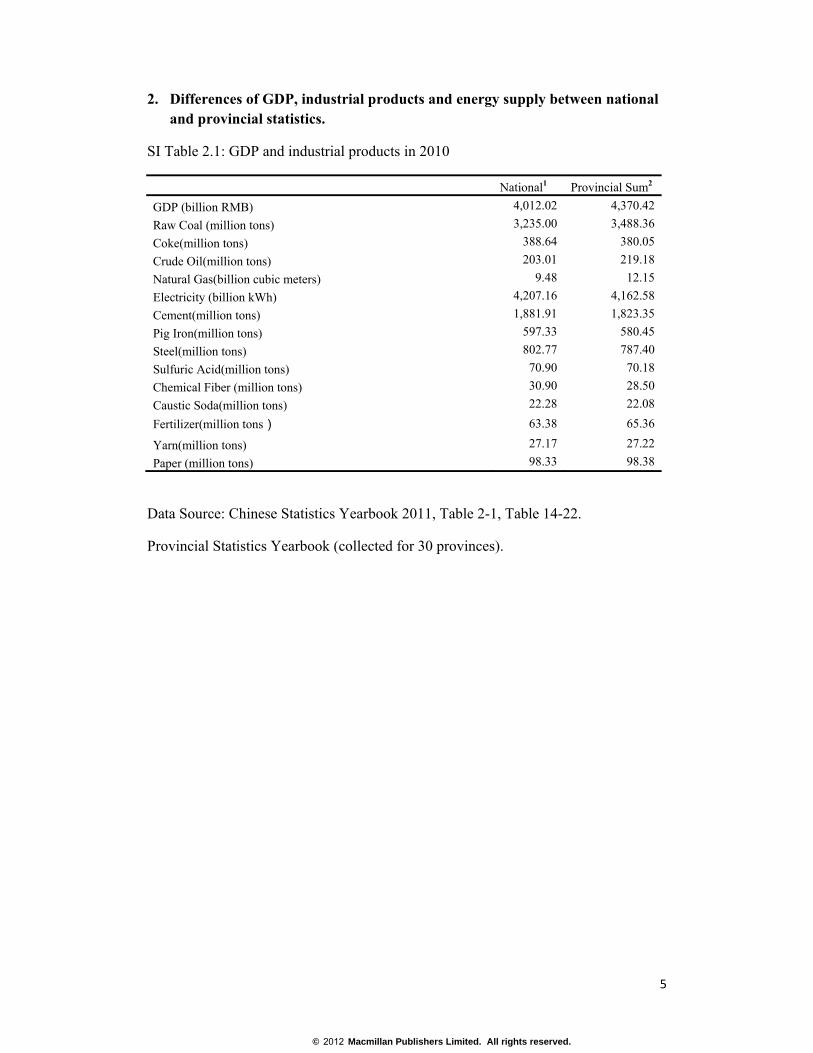
2. Differences of GDP, industrial products and energy supply between national and provincial statistics.
SI Table 2.1: GDP and industrial products in 2010
National1 Provincial Sum2
GDP (billion RMB) 4,012.02 4,370.42
Raw Coal (million tons) 3,235.00 3,488.36
Coke(million tons) 388.64 380.05
Crude Oil(million tons) 203.01 219.18
Natural Gas(billion cubic meters) 9.48 12.15
Electricity (billion kWh) 4,207.16 4,162.58
Cement(million tons) 1,881.91 1,823.35
Pig Iron(million tons) 597.33 580.45
Steel(million tons) 802.77 787.40
Sulfuric Acid(million tons) 70.90 70.18
Chemical Fiber (million tons) 30.90 28.50
Caustic Soda(million tons) 22.28 22.08
Fertilizer(million tons) 63.38 65.36
Yarn(million tons) 27.17 27.22
Paper (million tons) 98.33 98.38
Data Source: Chinese Statistics Yearbook 2011, Table 2-1, Table 14-22.
Provincial Statistics Yearbook (collected for 30 provinces).
© 2012 Macmillan Publishers Limited. All rights reserved.
6
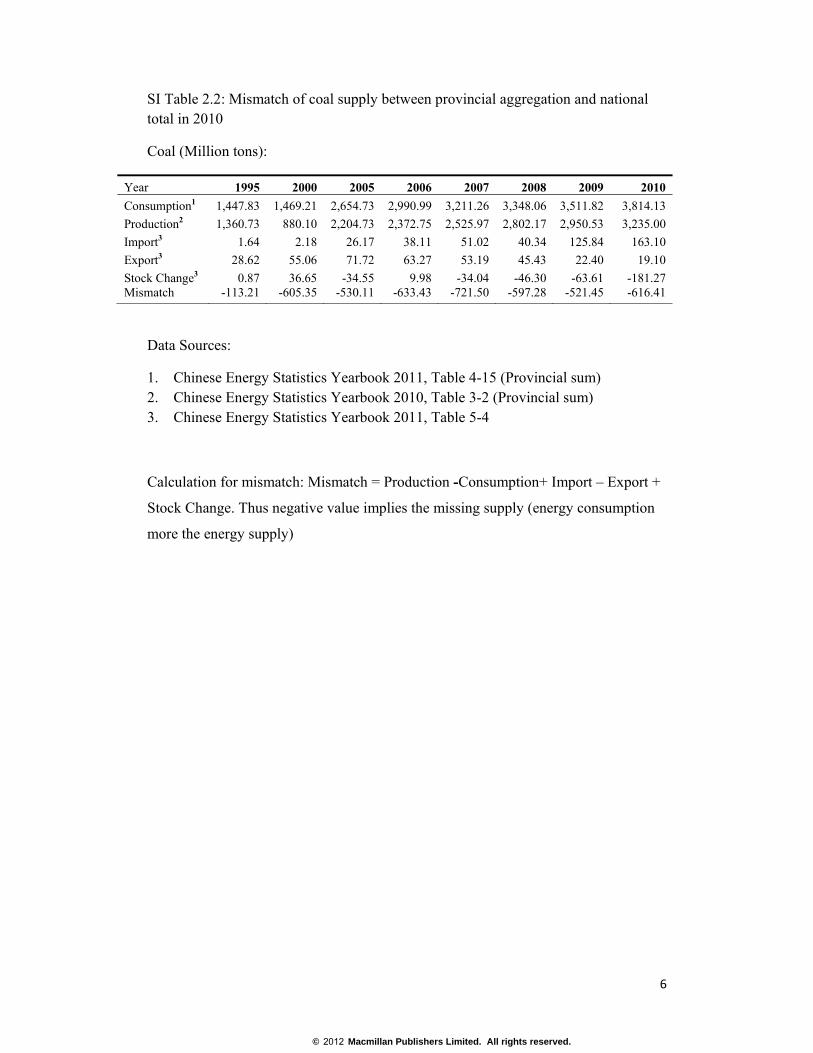
SI Table 2.2: Mismatch of coal supply between provincial aggregation and national total in 2010
Coal (Million tons):
Year 1995 2000 2005 2006 2007 2008 2009 2010
Consumption1 1,447.83 1,469.21 2,654.73 2,990.99 3,211.26 3,348.06 3,511.82 3,814.13
Production2 1,360.73 880.10 2,204.73 2,372.75 2,525.97 2,802.17 2,950.53 3,235.00
Import3 1.64 2.18 26.17 38.11 51.02 40.34 125.84 163.10
Export3 28.62 55.06 71.72 63.27 53.19 45.43 22.40 19.10
Stock Change3 0.87 36.65 -34.55 9.98 -34.04 -46.30 -63.61 -181.27 Mismatch -113.21 -605.35 -530.11 -633.43 -721.50 -597.28 -521.45 -616.41
Data Sources:
1. Chinese Energy Statistics Yearbook 2011, Table 4-15 (Provincial sum) 2. Chinese Energy Statistics Yearbook 2010, Table 3-2 (Provincial sum) 3. Chinese Energy Statistics Yearbook 2011, Table 5-4
Calculation for mismatch: Mismatch = Production -Consumption+ Import – Export +
Stock Change. Thus negative value implies the missing supply (energy consumption
more the energy supply)
© 2012 Macmillan Publishers Limited. All rights reserved.
7
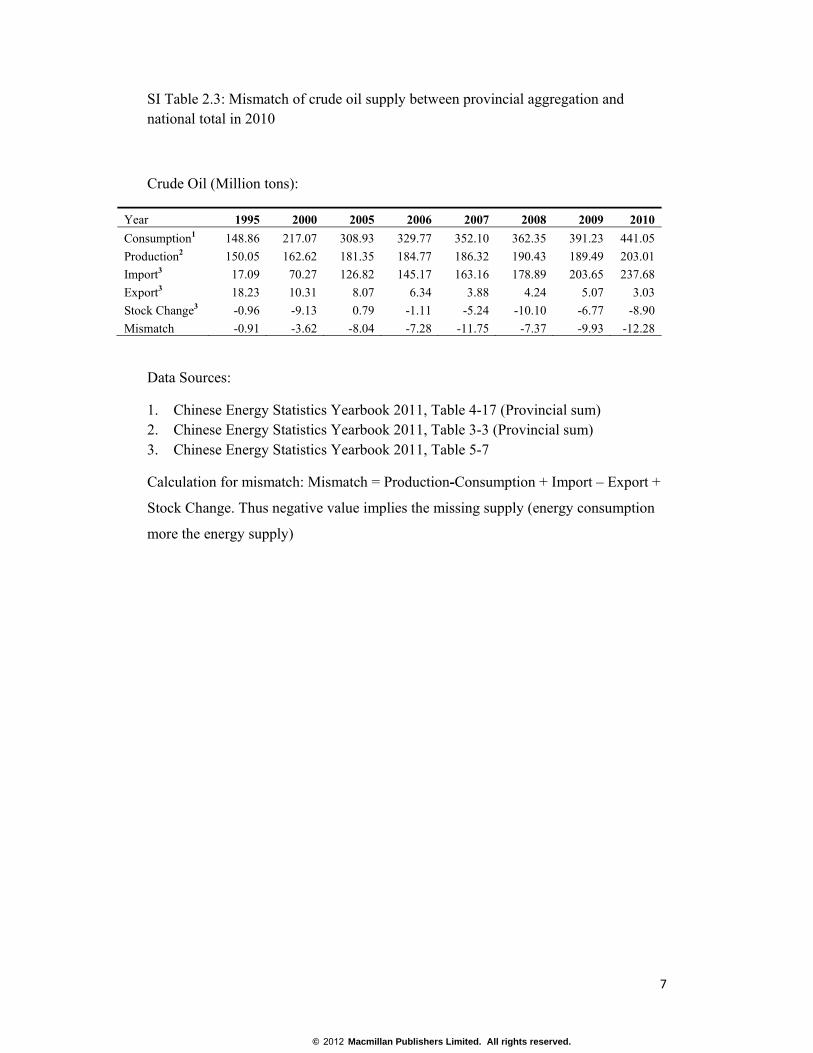
SI Table 2.3: Mismatch of crude oil supply between provincial aggregation and national total in 2010
Crude Oil (Million tons):
Year 1995 2000 2005 2006 2007 2008 2009 2010
Consumption1 148.86 217.07 308.93 329.77 352.10 362.35 391.23 441.05
Production2 150.05 162.62 181.35 184.77 186.32 190.43 189.49 203.01
Import3 17.09 70.27 126.82 145.17 163.16 178.89 203.65 237.68
Export3 18.23 10.31 8.07 6.34 3.88 4.24 5.07 3.03
Stock Change3 -0.96 -9.13 0.79 -1.11 -5.24 -10.10 -6.77 -8.90
Mismatch -0.91 -3.62 -8.04 -7.28 -11.75 -7.37 -9.93 -12.28
Data Sources:
1. Chinese Energy Statistics Yearbook 2011, Table 4-17 (Provincial sum) 2. Chinese Energy Statistics Yearbook 2011, Table 3-3 (Provincial sum) 3. Chinese Energy Statistics Yearbook 2011, Table 5-7
Calculation for mismatch: Mismatch = Production-Consumption + Import – Export +
Stock Change. Thus negative value implies the missing supply (energy consumption
more the energy supply)
© 2012 Macmillan Publishers Limited. All rights reserved.
8
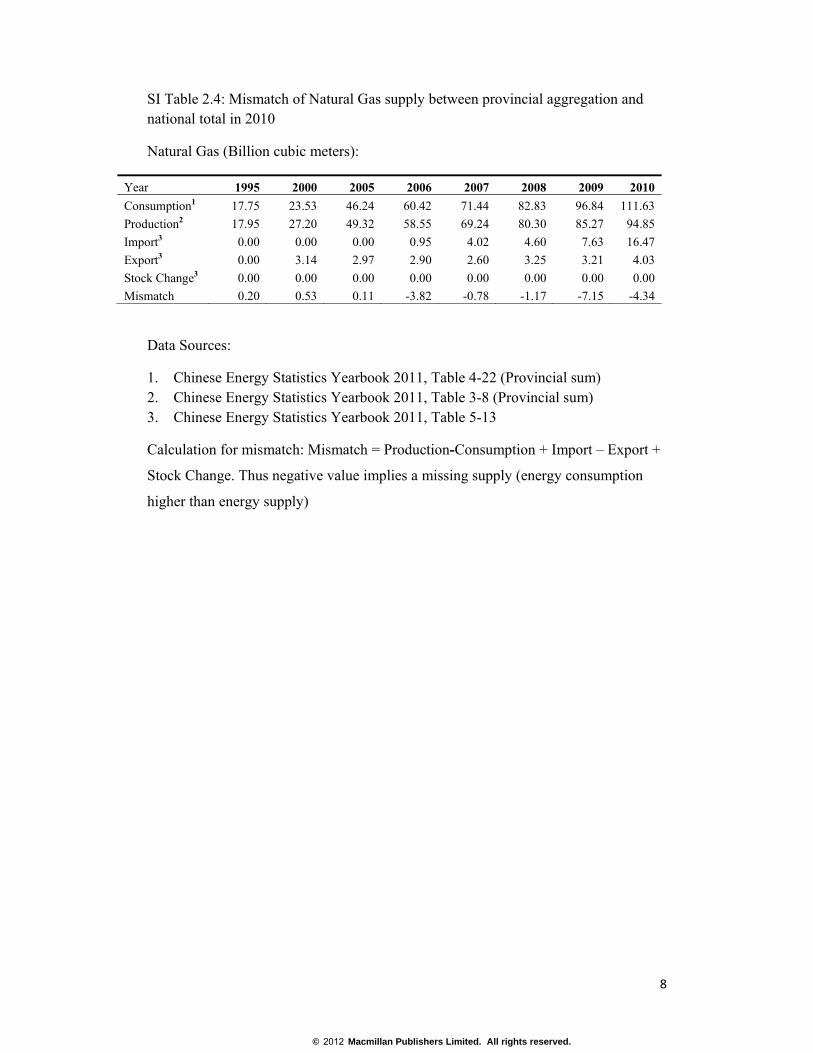
SI Table 2.4: Mismatch of Natural Gas supply between provincial aggregation and national total in 2010
Natural Gas (Billion cubic meters):
Year 1995 2000 2005 2006 2007 2008 2009 2010
Consumption1 17.75 23.53 46.24 60.42 71.44 82.83 96.84 111.63
Production2 17.95 27.20 49.32 58.55 69.24 80.30 85.27 94.85
Import3 0.00 0.00 0.00 0.95 4.02 4.60 7.63 16.47
Export3 0.00 3.14 2.97 2.90 2.60 3.25 3.21 4.03
Stock Change3 0.00 0.00 0.00 0.00 0.00 0.00 0.00 0.00
Mismatch 0.20 0.53 0.11 -3.82 -0.78 -1.17 -7.15 -4.34
Data Sources:
1. Chinese Energy Statistics Yearbook 2011, Table 4-22 (Provincial sum) 2. Chinese Energy Statistics Yearbook 2011, Table 3-8 (Provincial sum) 3. Chinese Energy Statistics Yearbook 2011, Table 5-13
Calculation for mismatch: Mismatch = Production-Consumption + Import – Export +
Stock Change. Thus negative value implies a missing supply (energy consumption
higher than energy supply)
© 2012 Macmillan Publishers Limited. All rights reserved.
9
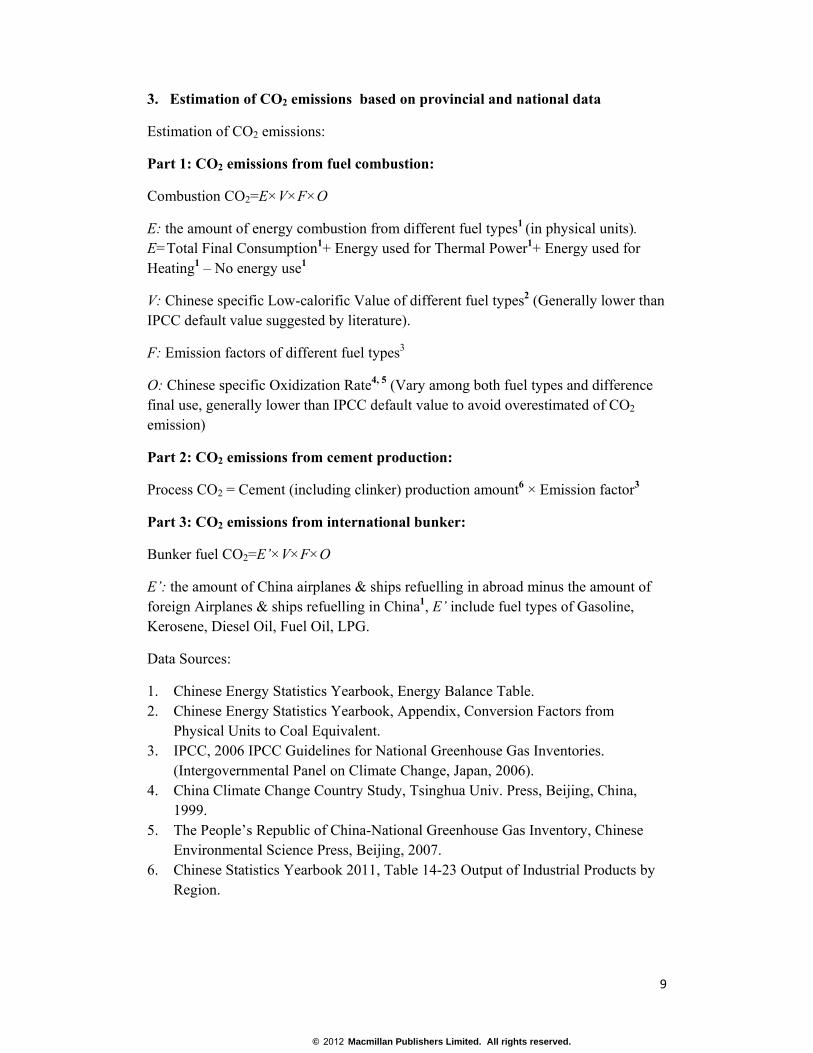
3. Estimation of CO2 emissions based on provincial and national data
Estimation of CO2 emissions:
Part 1: CO2 emissions from fuel combustion:
Combustion CO2=E×V×F×O
E: the amount of energy combustion from different fuel types1 (in physical units). E=Total Final Consumption1+ Energy used for Thermal Power1+ Energy used for Heating1 – No energy use1
V: Chinese specific Low-calorific Value of different fuel types2 (Generally lower than IPCC default value suggested by literature).
F: Emission factors of different fuel types3
O: Chinese specific Oxidization Rate4, 5 (Vary among both fuel types and difference final use, generally lower than IPCC default value to avoid overestimated of CO2 emission)
Part 2: CO2 emissions from cement production:
Process CO2 = Cement (including clinker) production amount6 × Emission factor3
Part 3: CO2 emissions from international bunker:
Bunker fuel CO2=E’×V×F×O
E’: the amount of China airplanes & ships refuelling in abroad minus the amount of foreign Airplanes & ships refuelling in China1, E’ include fuel types of Gasoline, Kerosene, Diesel Oil, Fuel Oil, LPG.
Data Sources:
1. Chinese Energy Statistics Yearbook, Energy Balance Table. 2. Chinese Energy Statistics Yearbook, Appendix, Conversion Factors from
Physical Units to Coal Equivalent. 3. IPCC, 2006 IPCC Guidelines for National Greenhouse Gas Inventories.
(Intergovernmental Panel on Climate Change, Japan, 2006). 4. China Climate Change Country Study, Tsinghua Univ. Press, Beijing, China,
1999. 5. The People’s Republic of China-National Greenhouse Gas Inventory, Chinese
Environmental Science Press, Beijing, 2007. 6. Chinese Statistics Yearbook 2011, Table 14-23 Output of Industrial Products by
Region.
© 2012 Macmillan Publishers Limited. All rights reserved.
10
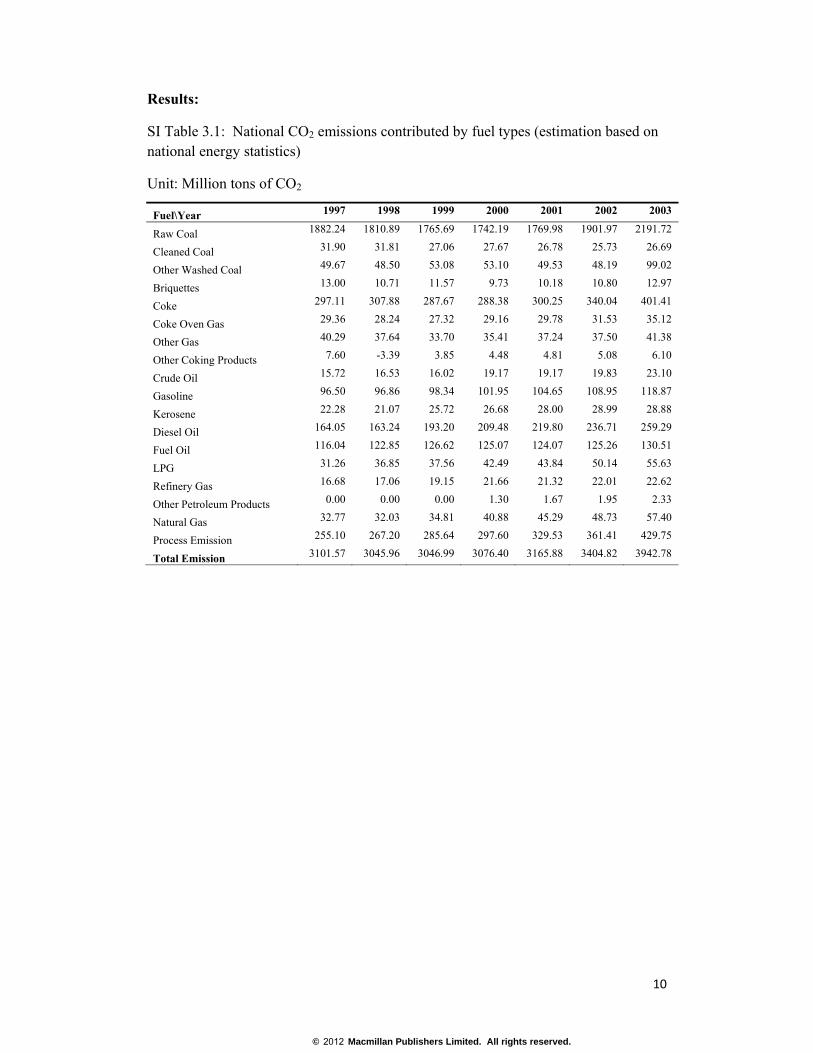
Results:
SI Table 3.1: National CO2 emissions contributed by fuel types (estimation based on national energy statistics)
Unit: Million tons of CO2
Fuel\Year 1997 1998 1999 2000 2001 2002 2003
Raw Coal 1882.24 1810.89 1765.69 1742.19 1769.98 1901.97 2191.72
Cleaned Coal 31.90 31.81 27.06 27.67 26.78 25.73 26.69
Other Washed Coal 49.67 48.50 53.08 53.10 49.53 48.19 99.02
Briquettes 13.00 10.71 11.57 9.73 10.18 10.80 12.97
Coke 297.11 307.88 287.67 288.38 300.25 340.04 401.41
Coke Oven Gas 29.36 28.24 27.32 29.16 29.78 31.53 35.12
Other Gas 40.29 37.64 33.70 35.41 37.24 37.50 41.38
Other Coking Products 7.60 -3.39 3.85 4.48 4.81 5.08 6.10
Crude Oil 15.72 16.53 16.02 19.17 19.17 19.83 23.10
Gasoline 96.50 96.86 98.34 101.95 104.65 108.95 118.87
Kerosene 22.28 21.07 25.72 26.68 28.00 28.99 28.88
Diesel Oil 164.05 163.24 193.20 209.48 219.80 236.71 259.29
Fuel Oil 116.04 122.85 126.62 125.07 124.07 125.26 130.51
LPG 31.26 36.85 37.56 42.49 43.84 50.14 55.63
Refinery Gas 16.68 17.06 19.15 21.66 21.32 22.01 22.62
Other Petroleum Products 0.00 0.00 0.00 1.30 1.67 1.95 2.33
Natural Gas 32.77 32.03 34.81 40.88 45.29 48.73 57.40
Process Emission 255.10 267.20 285.64 297.60 329.53 361.41 429.75
Total Emission 3101.57 3045.96 3046.99 3076.40 3165.88 3404.82 3942.78
© 2012 Macmillan Publishers Limited. All rights reserved.
11
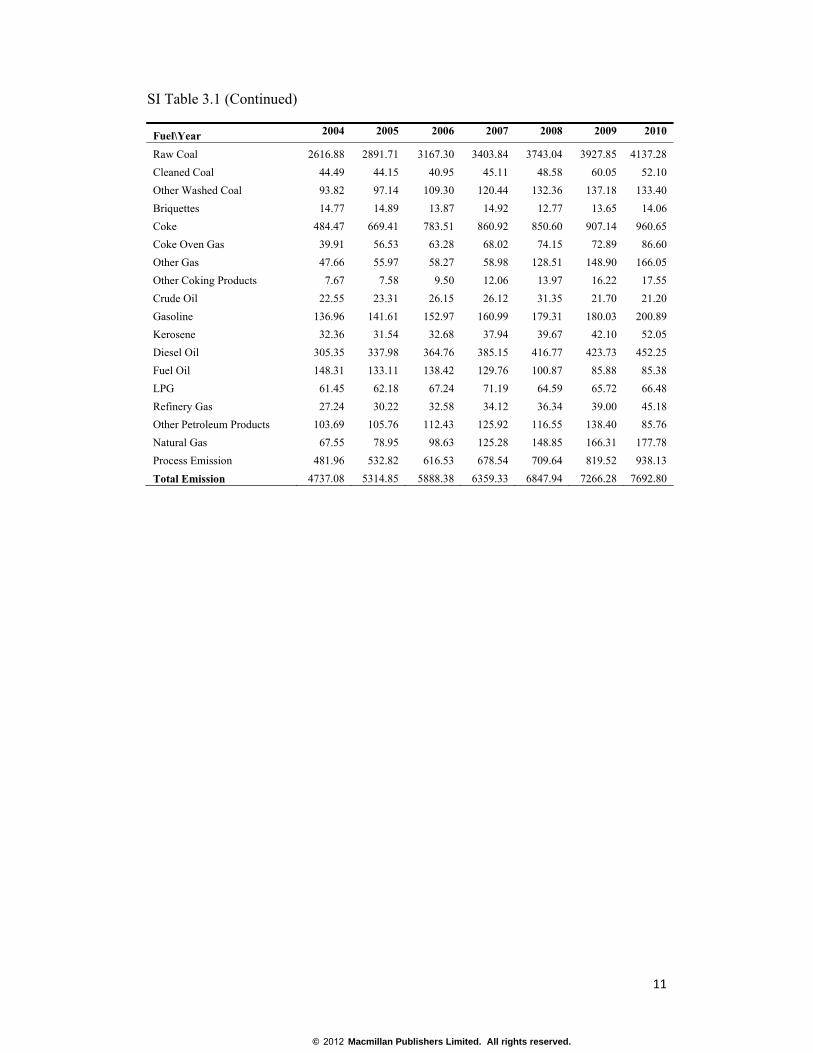
SI Table 3.1 (Continued)
Fuel\Year 2004 2005 2006 2007 2008 2009 2010
Raw Coal 2616.88 2891.71 3167.30 3403.84 3743.04 3927.85 4137.28
Cleaned Coal 44.49 44.15 40.95 45.11 48.58 60.05 52.10
Other Washed Coal 93.82 97.14 109.30 120.44 132.36 137.18 133.40
Briquettes 14.77 14.89 13.87 14.92 12.77 13.65 14.06
Coke 484.47 669.41 783.51 860.92 850.60 907.14 960.65
Coke Oven Gas 39.91 56.53 63.28 68.02 74.15 72.89 86.60
Other Gas 47.66 55.97 58.27 58.98 128.51 148.90 166.05
Other Coking Products 7.67 7.58 9.50 12.06 13.97 16.22 17.55
Crude Oil 22.55 23.31 26.15 26.12 31.35 21.70 21.20
Gasoline 136.96 141.61 152.97 160.99 179.31 180.03 200.89
Kerosene 32.36 31.54 32.68 37.94 39.67 42.10 52.05
Diesel Oil 305.35 337.98 364.76 385.15 416.77 423.73 452.25
Fuel Oil 148.31 133.11 138.42 129.76 100.87 85.88 85.38
LPG 61.45 62.18 67.24 71.19 64.59 65.72 66.48
Refinery Gas 27.24 30.22 32.58 34.12 36.34 39.00 45.18
Other Petroleum Products 103.69 105.76 112.43 125.92 116.55 138.40 85.76
Natural Gas 67.55 78.95 98.63 125.28 148.85 166.31 177.78
Process Emission 481.96 532.82 616.53 678.54 709.64 819.52 938.13
Total Emission 4737.08 5314.85 5888.38 6359.33 6847.94 7266.28 7692.80
© 2012 Macmillan Publishers Limited. All rights reserved.
12
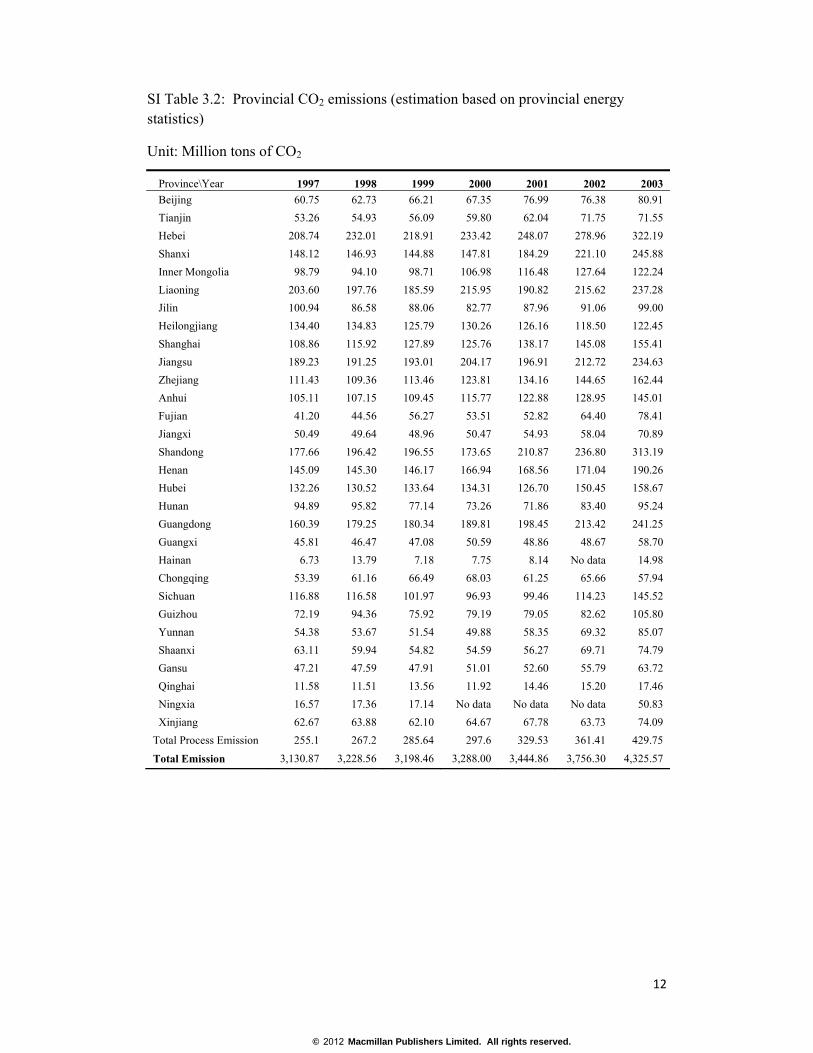
SI Table 3.2: Provincial CO2 emissions (estimation based on provincial energy statistics)
Unit: Million tons of CO2
Province\Year 1997 1998 1999 2000 2001 2002 2003
Beijing 60.75 62.73 66.21 67.35 76.99 76.38 80.91
Tianjin 53.26 54.93 56.09 59.80 62.04 71.75 71.55
Hebei 208.74 232.01 218.91 233.42 248.07 278.96 322.19
Shanxi 148.12 146.93 144.88 147.81 184.29 221.10 245.88
Inner Mongolia 98.79 94.10 98.71 106.98 116.48 127.64 122.24
Liaoning 203.60 197.76 185.59 215.95 190.82 215.62 237.28
Jilin 100.94 86.58 88.06 82.77 87.96 91.06 99.00
Heilongjiang 134.40 134.83 125.79 130.26 126.16 118.50 122.45
Shanghai 108.86 115.92 127.89 125.76 138.17 145.08 155.41
Jiangsu 189.23 191.25 193.01 204.17 196.91 212.72 234.63
Zhejiang 111.43 109.36 113.46 123.81 134.16 144.65 162.44
Anhui 105.11 107.15 109.45 115.77 122.88 128.95 145.01
Fujian 41.20 44.56 56.27 53.51 52.82 64.40 78.41
Jiangxi 50.49 49.64 48.96 50.47 54.93 58.04 70.89
Shandong 177.66 196.42 196.55 173.65 210.87 236.80 313.19
Henan 145.09 145.30 146.17 166.94 168.56 171.04 190.26
Hubei 132.26 130.52 133.64 134.31 126.70 150.45 158.67
Hunan 94.89 95.82 77.14 73.26 71.86 83.40 95.24
Guangdong 160.39 179.25 180.34 189.81 198.45 213.42 241.25
Guangxi 45.81 46.47 47.08 50.59 48.86 48.67 58.70
Hainan 6.73 13.79 7.18 7.75 8.14 No data 14.98
Chongqing 53.39 61.16 66.49 68.03 61.25 65.66 57.94
Sichuan 116.88 116.58 101.97 96.93 99.46 114.23 145.52
Guizhou 72.19 94.36 75.92 79.19 79.05 82.62 105.80
Yunnan 54.38 53.67 51.54 49.88 58.35 69.32 85.07
Shaanxi 63.11 59.94 54.82 54.59 56.27 69.71 74.79
Gansu 47.21 47.59 47.91 51.01 52.60 55.79 63.72
Qinghai 11.58 11.51 13.56 11.92 14.46 15.20 17.46
Ningxia 16.57 17.36 17.14 No data No data No data 50.83
Xinjiang 62.67 63.88 62.10 64.67 67.78 63.73 74.09
Total Process Emission 255.1 267.2 285.64 297.6 329.53 361.41 429.75
Total Emission 3,130.87 3,228.56 3,198.46 3,288.00 3,444.86 3,756.30 4,325.57
© 2012 Macmillan Publishers Limited. All rights reserved.
13
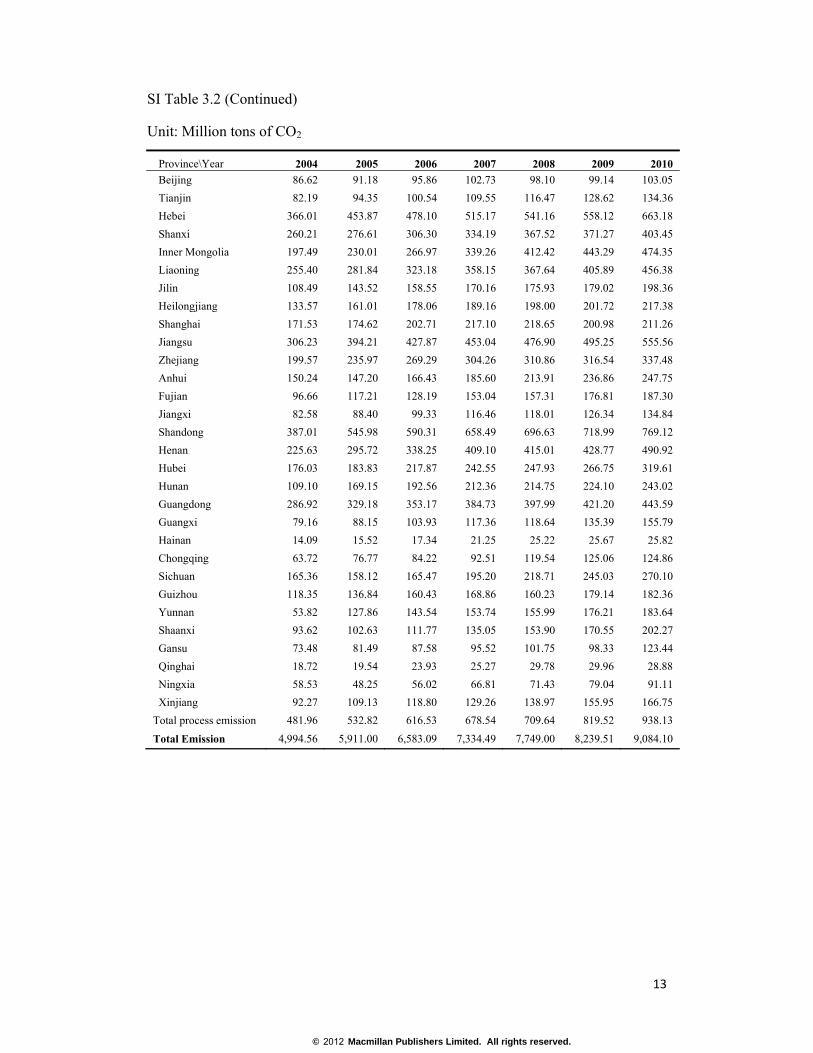
SI Table 3.2 (Continued)
Unit: Million tons of CO2
Province\Year 2004 2005 2006 2007 2008 2009 2010
Beijing 86.62 91.18 95.86 102.73 98.10 99.14 103.05
Tianjin 82.19 94.35 100.54 109.55 116.47 128.62 134.36
Hebei 366.01 453.87 478.10 515.17 541.16 558.12 663.18
Shanxi 260.21 276.61 306.30 334.19 367.52 371.27 403.45
Inner Mongolia 197.49 230.01 266.97 339.26 412.42 443.29 474.35
Liaoning 255.40 281.84 323.18 358.15 367.64 405.89 456.38
Jilin 108.49 143.52 158.55 170.16 175.93 179.02 198.36
Heilongjiang 133.57 161.01 178.06 189.16 198.00 201.72 217.38
Shanghai 171.53 174.62 202.71 217.10 218.65 200.98 211.26
Jiangsu 306.23 394.21 427.87 453.04 476.90 495.25 555.56
Zhejiang 199.57 235.97 269.29 304.26 310.86 316.54 337.48
Anhui 150.24 147.20 166.43 185.60 213.91 236.86 247.75
Fujian 96.66 117.21 128.19 153.04 157.31 176.81 187.30
Jiangxi 82.58 88.40 99.33 116.46 118.01 126.34 134.84
Shandong 387.01 545.98 590.31 658.49 696.63 718.99 769.12
Henan 225.63 295.72 338.25 409.10 415.01 428.77 490.92
Hubei 176.03 183.83 217.87 242.55 247.93 266.75 319.61
Hunan 109.10 169.15 192.56 212.36 214.75 224.10 243.02
Guangdong 286.92 329.18 353.17 384.73 397.99 421.20 443.59
Guangxi 79.16 88.15 103.93 117.36 118.64 135.39 155.79
Hainan 14.09 15.52 17.34 21.25 25.22 25.67 25.82
Chongqing 63.72 76.77 84.22 92.51 119.54 125.06 124.86
Sichuan 165.36 158.12 165.47 195.20 218.71 245.03 270.10
Guizhou 118.35 136.84 160.43 168.86 160.23 179.14 182.36
Yunnan 53.82 127.86 143.54 153.74 155.99 176.21 183.64
Shaanxi 93.62 102.63 111.77 135.05 153.90 170.55 202.27
Gansu 73.48 81.49 87.58 95.52 101.75 98.33 123.44
Qinghai 18.72 19.54 23.93 25.27 29.78 29.96 28.88
Ningxia 58.53 48.25 56.02 66.81 71.43 79.04 91.11
Xinjiang 92.27 109.13 118.80 129.26 138.97 155.95 166.75
Total process emission 481.96 532.82 616.53 678.54 709.64 819.52 938.13
Total Emission 4,994.56 5,911.00 6,583.09 7,334.49 7,749.00 8,239.51 9,084.10
© 2012 Macmillan Publishers Limited. All rights reserved.
14
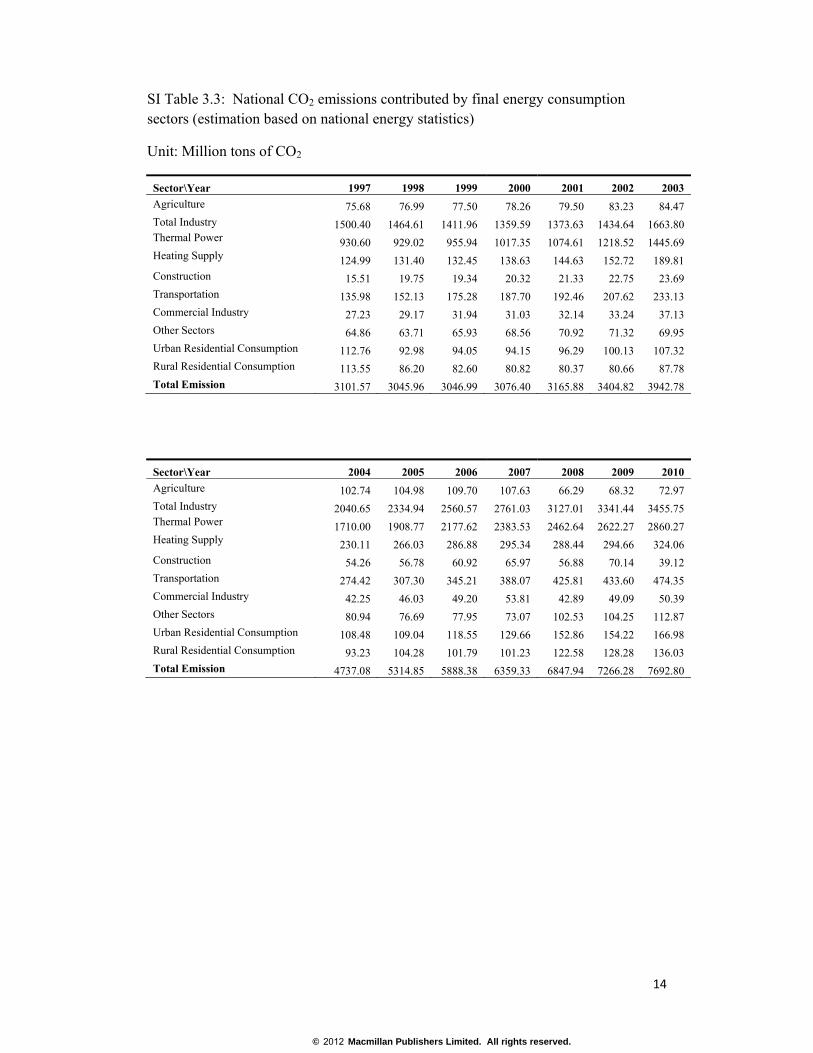
SI Table 3.3: National CO2 emissions contributed by final energy consumption sectors (estimation based on national energy statistics)
Unit: Million tons of CO2
Sector\Year 1997 1998 1999 2000 2001 2002 2003
Agriculture 75.68 76.99 77.50 78.26 79.50 83.23 84.47 Total Industry 1500.40 1464.61 1411.96 1359.59 1373.63 1434.64 1663.80 Thermal Power 930.60 929.02 955.94 1017.35 1074.61 1218.52 1445.69 Heating Supply 124.99 131.40 132.45 138.63 144.63 152.72 189.81Construction 15.51 19.75 19.34 20.32 21.33 22.75 23.69 Transportation 135.98 152.13 175.28 187.70 192.46 207.62 233.13 Commercial Industry 27.23 29.17 31.94 31.03 32.14 33.24 37.13 Other Sectors 64.86 63.71 65.93 68.56 70.92 71.32 69.95 Urban Residential Consumption 112.76 92.98 94.05 94.15 96.29 100.13 107.32Rural Residential Consumption 113.55 86.20 82.60 80.82 80.37 80.66 87.78
Total Emission 3101.57 3045.96 3046.99 3076.40 3165.88 3404.82 3942.78
Sector\Year 2004 2005 2006 2007 2008 2009 2010
Agriculture 102.74 104.98 109.70 107.63 66.29 68.32 72.97 Total Industry 2040.65 2334.94 2560.57 2761.03 3127.01 3341.44 3455.75 Thermal Power 1710.00 1908.77 2177.62 2383.53 2462.64 2622.27 2860.27 Heating Supply 230.11 266.03 286.88 295.34 288.44 294.66 324.06Construction 54.26 56.78 60.92 65.97 56.88 70.14 39.12 Transportation 274.42 307.30 345.21 388.07 425.81 433.60 474.35 Commercial Industry 42.25 46.03 49.20 53.81 42.89 49.09 50.39 Other Sectors 80.94 76.69 77.95 73.07 102.53 104.25 112.87 Urban Residential Consumption 108.48 109.04 118.55 129.66 152.86 154.22 166.98Rural Residential Consumption 93.23 104.28 101.79 101.23 122.58 128.28 136.03
Total Emission 4737.08 5314.85 5888.38 6359.33 6847.94 7266.28 7692.80
© 2012 Macmillan Publishers Limited. All rights reserved.
15
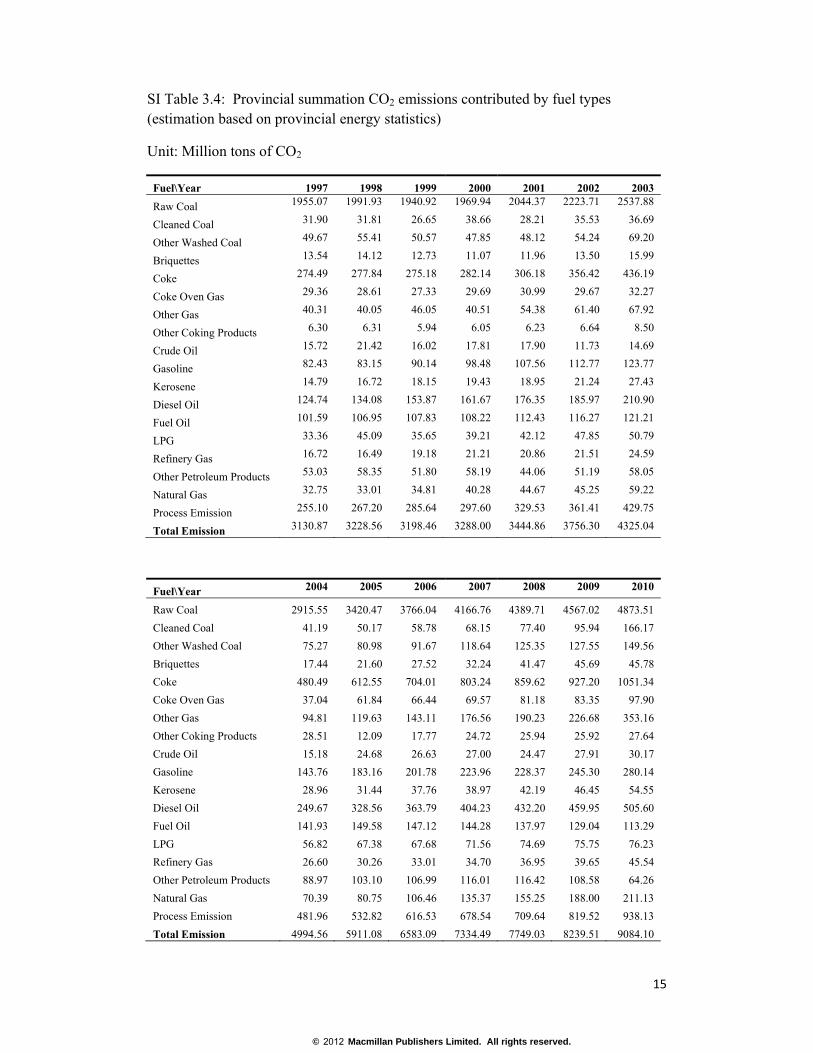
SI Table 3.4: Provincial summation CO2 emissions contributed by fuel types (estimation based on provincial energy statistics)
Unit: Million tons of CO2
Fuel\Year 1997 1998 1999 2000 2001 2002 2003
Raw Coal 1955.07 1991.93 1940.92 1969.94 2044.37 2223.71 2537.88
Cleaned Coal 31.90 31.81 26.65 38.66 28.21 35.53 36.69
Other Washed Coal 49.67 55.41 50.57 47.85 48.12 54.24 69.20
Briquettes 13.54 14.12 12.73 11.07 11.96 13.50 15.99
Coke 274.49 277.84 275.18 282.14 306.18 356.42 436.19
Coke Oven Gas 29.36 28.61 27.33 29.69 30.99 29.67 32.27
Other Gas 40.31 40.05 46.05 40.51 54.38 61.40 67.92
Other Coking Products 6.30 6.31 5.94 6.05 6.23 6.64 8.50
Crude Oil 15.72 21.42 16.02 17.81 17.90 11.73 14.69
Gasoline 82.43 83.15 90.14 98.48 107.56 112.77 123.77
Kerosene 14.79 16.72 18.15 19.43 18.95 21.24 27.43
Diesel Oil 124.74 134.08 153.87 161.67 176.35 185.97 210.90
Fuel Oil 101.59 106.95 107.83 108.22 112.43 116.27 121.21
LPG 33.36 45.09 35.65 39.21 42.12 47.85 50.79
Refinery Gas 16.72 16.49 19.18 21.21 20.86 21.51 24.59
Other Petroleum Products 53.03 58.35 51.80 58.19 44.06 51.19 58.05
Natural Gas 32.75 33.01 34.81 40.28 44.67 45.25 59.22
Process Emission 255.10 267.20 285.64 297.60 329.53 361.41 429.75
Total Emission 3130.87 3228.56 3198.46 3288.00 3444.86 3756.30 4325.04
Fuel\Year 2004 2005 2006 2007 2008 2009 2010
Raw Coal 2915.55 3420.47 3766.04 4166.76 4389.71 4567.02 4873.51
Cleaned Coal 41.19 50.17 58.78 68.15 77.40 95.94 166.17
Other Washed Coal 75.27 80.98 91.67 118.64 125.35 127.55 149.56
Briquettes 17.44 21.60 27.52 32.24 41.47 45.69 45.78
Coke 480.49 612.55 704.01 803.24 859.62 927.20 1051.34
Coke Oven Gas 37.04 61.84 66.44 69.57 81.18 83.35 97.90
Other Gas 94.81 119.63 143.11 176.56 190.23 226.68 353.16
Other Coking Products 28.51 12.09 17.77 24.72 25.94 25.92 27.64
Crude Oil 15.18 24.68 26.63 27.00 24.47 27.91 30.17
Gasoline 143.76 183.16 201.78 223.96 228.37 245.30 280.14
Kerosene 28.96 31.44 37.76 38.97 42.19 46.45 54.55
Diesel Oil 249.67 328.56 363.79 404.23 432.20 459.95 505.60
Fuel Oil 141.93 149.58 147.12 144.28 137.97 129.04 113.29
LPG 56.82 67.38 67.68 71.56 74.69 75.75 76.23
Refinery Gas 26.60 30.26 33.01 34.70 36.95 39.65 45.54
Other Petroleum Products 88.97 103.10 106.99 116.01 116.42 108.58 64.26
Natural Gas 70.39 80.75 106.46 135.37 155.25 188.00 211.13
Process Emission 481.96 532.82 616.53 678.54 709.64 819.52 938.13
Total Emission 4994.56 5911.08 6583.09 7334.49 7749.03 8239.51 9084.10
© 2012 Macmillan Publishers Limited. All rights reserved.
16
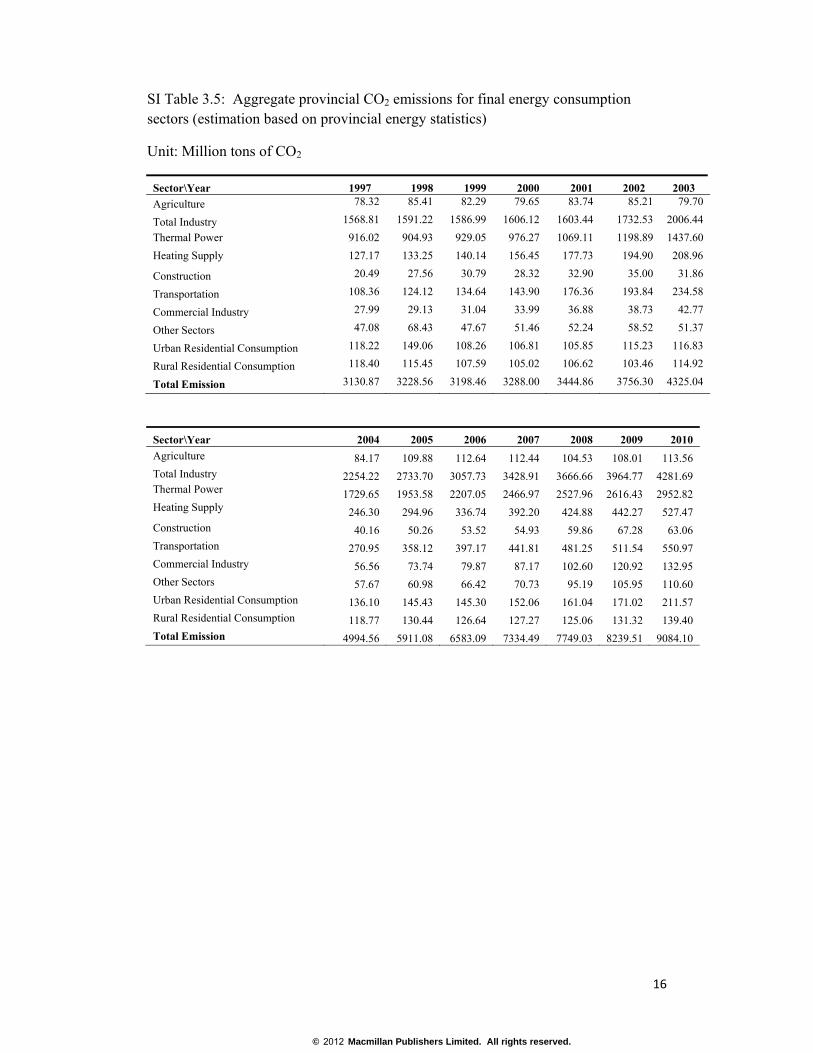
SI Table 3.5: Aggregate provincial CO2 emissions for final energy consumption sectors (estimation based on provincial energy statistics)
Unit: Million tons of CO2
Sector\Year 1997 1998 1999 2000 2001 2002 2003
Agriculture 78.32 85.41 82.29 79.65 83.74 85.21 79.70
Total Industry 1568.81 1591.22 1586.99 1606.12 1603.44 1732.53 2006.44
Thermal Power 916.02 904.93 929.05 976.27 1069.11 1198.89 1437.60
Heating Supply 127.17 133.25 140.14 156.45 177.73 194.90 208.96
Construction 20.49 27.56 30.79 28.32 32.90 35.00 31.86
Transportation 108.36 124.12 134.64 143.90 176.36 193.84 234.58
Commercial Industry 27.99 29.13 31.04 33.99 36.88 38.73 42.77
Other Sectors 47.08 68.43 47.67 51.46 52.24 58.52 51.37
Urban Residential Consumption 118.22 149.06 108.26 106.81 105.85 115.23 116.83
Rural Residential Consumption 118.40 115.45 107.59 105.02 106.62 103.46 114.92
Total Emission 3130.87 3228.56 3198.46 3288.00 3444.86 3756.30 4325.04
Sector\Year 2004 2005 2006 2007 2008 2009 2010
Agriculture 84.17 109.88 112.64 112.44 104.53 108.01 113.56 Total Industry 2254.22 2733.70 3057.73 3428.91 3666.66 3964.77 4281.69 Thermal Power 1729.65 1953.58 2207.05 2466.97 2527.96 2616.43 2952.82 Heating Supply 246.30 294.96 336.74 392.20 424.88 442.27 527.47 Construction 40.16 50.26 53.52 54.93 59.86 67.28 63.06 Transportation 270.95 358.12 397.17 441.81 481.25 511.54 550.97 Commercial Industry 56.56 73.74 79.87 87.17 102.60 120.92 132.95 Other Sectors 57.67 60.98 66.42 70.73 95.19 105.95 110.60 Urban Residential Consumption 136.10 145.43 145.30 152.06 161.04 171.02 211.57 Rural Residential Consumption 118.77 130.44 126.64 127.27 125.06 131.32 139.40
Total Emission 4994.56 5911.08 6583.09 7334.49 7749.03 8239.51 9084.10
© 2012 Macmillan Publishers Limited. All rights reserved.
17
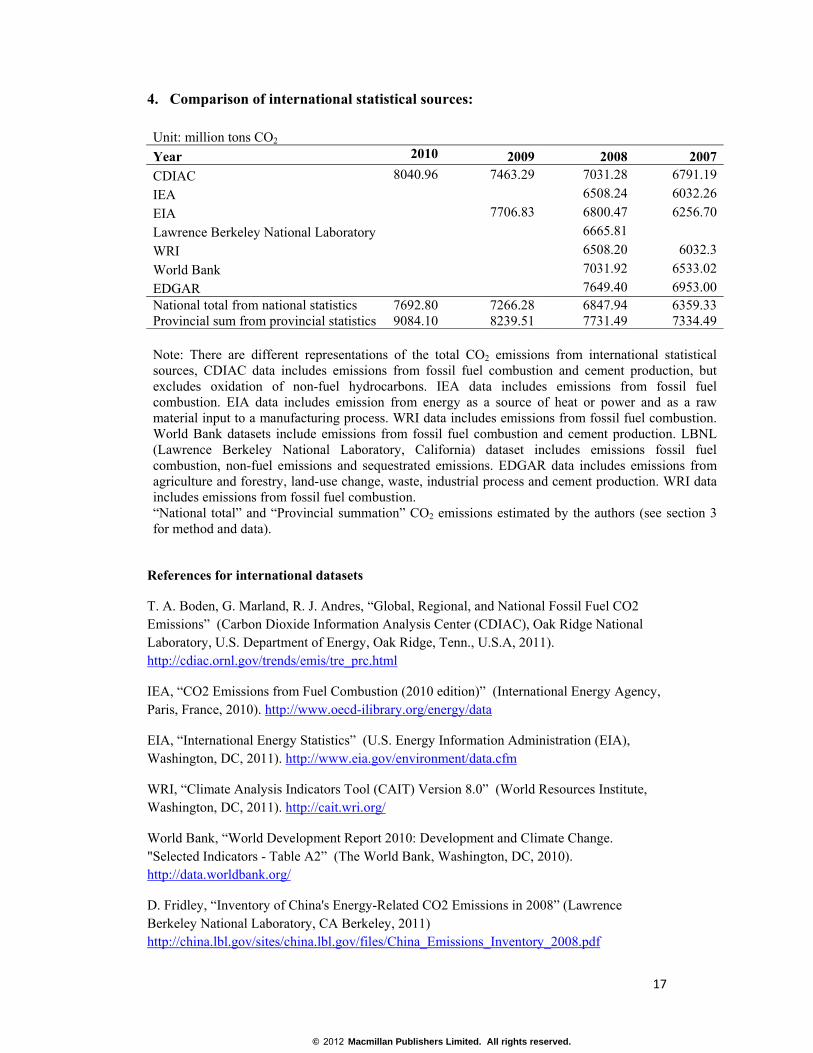
4. Comparison of international statistical sources:
Unit: million tons CO2
Year 2010 2009 2008 2007
CDIAC 8040.96 7463.29 7031.28 6791.19
IEA 6508.24 6032.26
EIA 7706.83 6800.47 6256.70
Lawrence Berkeley National Laboratory 6665.81
WRI 6508.20 6032.3
World Bank 7031.92 6533.02
EDGAR 7649.40 6953.00National total from national statistics Provincial sum from provincial statistics
7692.80 9084.10
7266.28 8239.51
6847.94 7731.49
6359.33 7334.49
Note: There are different representations of the total CO2 emissions from international statistical sources, CDIAC data includes emissions from fossil fuel combustion and cement production, but excludes oxidation of non-fuel hydrocarbons. IEA data includes emissions from fossil fuel combustion. EIA data includes emission from energy as a source of heat or power and as a raw material input to a manufacturing process. WRI data includes emissions from fossil fuel combustion. World Bank datasets include emissions from fossil fuel combustion and cement production. LBNL (Lawrence Berkeley National Laboratory, California) dataset includes emissions fossil fuel combustion, non-fuel emissions and sequestrated emissions. EDGAR data includes emissions from agriculture and forestry, land-use change, waste, industrial process and cement production. WRI data includes emissions from fossil fuel combustion. “National total” and “Provincial summation” CO2 emissions estimated by the authors (see section 3 for method and data).
References for international datasets
T. A. Boden, G. Marland, R. J. Andres, “Global, Regional, and National Fossil Fuel CO2 Emissions” (Carbon Dioxide Information Analysis Center (CDIAC), Oak Ridge National Laboratory, U.S. Department of Energy, Oak Ridge, Tenn., U.S.A, 2011). http://cdiac.ornl.gov/trends/emis/tre_prc.html
IEA, “CO2 Emissions from Fuel Combustion (2010 edition)” (International Energy Agency, Paris, France, 2010). http://www.oecd-ilibrary.org/energy/data
EIA, “International Energy Statistics” (U.S. Energy Information Administration (EIA), Washington, DC, 2011). http://www.eia.gov/environment/data.cfm
WRI, “Climate Analysis Indicators Tool (CAIT) Version 8.0” (World Resources Institute, Washington, DC, 2011). http://cait.wri.org/
World Bank, “World Development Report 2010: Development and Climate Change. "Selected Indicators - Table A2” (The World Bank, Washington, DC, 2010). http://data.worldbank.org/
D. Fridley, “Inventory of China's Energy-Related CO2 Emissions in 2008” (Lawrence Berkeley National Laboratory, CA Berkeley, 2011) http://china.lbl.gov/sites/china.lbl.gov/files/China_Emissions_Inventory_2008.pdf
© 2012 Macmillan Publishers Limited. All rights reserved.

18
EDGAR, “Emission Database for Global Atmospheric Research, release version 4.2” (European Commission: Joint Research Centre / Netherlands Environmental Assessment Agency, 2010). http://edgar.jrc.ec.europe.eu
© 2012 Macmillan Publishers Limited. All rights reserved.