the geography of the scottish knowledge economy€¦ · the local futures group 3 queen square...
TRANSCRIPT

the local futures group 3 Queen Square London WC1N 3AU
T +44 020 75208120 F +44 020 7520 8150
The Geography of the Scottish Knowledge Economy
A report prepared for Scottish Enterprise
August 2004
Mark Hepworth
Lee Pickavance

Contents
the local futures group
Contents
Contents....................................................................................................................................................................... i Acknowledgements...................................................................................................................................................... I Executive Summary.................................................................................................................................................... II
Aims ........................................................................................................................................................................ II Research and Policy Contexts ............................................................................................................................... II The Analysis .......................................................................................................................................................... III Stakeholder Views..................................................................................................................................................V A Spatial Framework for Scotland’s Knowledge Economy...................................................................................VI
1 Introduction ......................................................................................................................................................... 7 1.1 Background to the Study............................................................................................................................ 7 1.2 This Report ................................................................................................................................................. 8
2 The Knowledge Economy: Research and Policy Contexts ............................................................................... 9 2.1 Introduction................................................................................................................................................. 9 2.2 Research Background................................................................................................................................ 9 2.3 Spatial Perspectives – Globalisation and City-Regions...........................................................................13 2.4 UK and EU Policy Background ................................................................................................................17 2.5 The Scotland Context...............................................................................................................................20 2.6 Conclusion................................................................................................................................................23
3 Benchmarking the Knowledge Economy – the Local Futures Approach ........................................................24 3.1 Introduction...............................................................................................................................................24 3.2 The Economic Architecture Analysis .......................................................................................................25 3.3 The Competitiveness Analysis .................................................................................................................28
4 The Geography of the Knowledge Economy in Scotland ................................................................................33 4.1 Introduction...............................................................................................................................................33 4.2 The Architecture Analysis ........................................................................................................................33 4.3 The Competitiveness Analysis .................................................................................................................41 4.4 The Relative Competitiveness of Scotland’s Urban and Rural Knowledge Economies .........................49 4.5 Scottish Cities as Drivers of Regional Growth in the Knowledge Economy............................................52 4.6 Conclusion................................................................................................................................................60
5 Stakeholder Views on Scotland’s Knowledge Economy .................................................................................61 5.1 Introduction...............................................................................................................................................61 5.2 Understanding of the Knowledge Economy Agenda ...............................................................................61 5.3 Geography................................................................................................................................................63 5.4 Policy Priorities .........................................................................................................................................64 5.5 Conclusion................................................................................................................................................65
6 A Spatial Framework for the Knowledge Economy in Scotland ......................................................................66 6.1 Task Force Number 3...............................................................................................................................66 6.2 Vision: The “Nation-Region” Knowledge Economy .................................................................................66 6.3 Scenarios Development ...........................................................................................................................67 6.4 A ‘Distributed Policy’ Model for the Knowledge Economy.......................................................................72 6.5 ‘Knowledge Economy Observatory’ for Scotland.....................................................................................73 6.6 A Publicity and Awareness Campaign for the Knowledge Economy ......................................................73
Annex........................................................................................................................................................................75 References................................................................................................................................................................87

Acknowledgements
the local futures group
I
Acknowledgements
We are extremely grateful to all of the individuals and organisations that contributed their time and expertise to this study. Special thanks to the Scottish Enterprise Steering Group for this project: Kenny Richmond, Kevin Kane, Veronica Noone, Jamie Bell and David Lippiatt.
Steve Inch Glasgow City Council Stephanie Young Scottish Enterprise Glasgow Caroline Sincock Targeting Innovation - Intellectual Assets, Scottish Enterprise Glasgow Prof. Andrew Hamnett University of Strathclyde Jim McIntyre Competitive Place Scottish Enterprise Gordon Kennedy Scottish Enterprise Glasgow Kevin Kane Scottish Enterprise Glasgow Prof Neil Hood Deputy Chairman of Scottish Enterprise and Strathclyde University George Boag Targeting Innovation, Scottish Enterprise Glasgow Paul Lewis Scottish Enterprise Edinburgh & Lothian Neil Francis Scottish Enterprise Edinburgh & Lothian Veronica Noone Scottish Enterprise Edinburgh & Lothian Robin Benn Scottish Executive Alistair Shaw West Lothian Economic Development Prof. Archer Heriot Watt University Andrew Holmes City Development, Edinburgh Shonagh McPherson McGrigor Donald & Scottish Enterprise and Edinburgh & Lothian Board Member Ashok Khindria CES Services & Scottish Enterprise and Edinburgh & Lothian Board Member Neil Gordon AVC Media Enterprises Tony Aldhous Competitive Business, Scottish Enterprise Grampian Jennifer Craw Scottish Enterprise Grampian Ian Heywood Skills & Learning, Scottish Enterprise Grampian Ian Gabriel Transportation and Infrastructure, Aberdeenshire Council Colin Turnbull AXEON Ltd. Aberdeen Bob Sinclair Banff and Buchan College of Further Education Allan Macaskill Talisman Energy, Aberdeen Shona Cormack Scottish Enterprise Tayside Ken Macdonald Economic Development, Perth & Kinross Prof. Nicholas Terry Dundee Business School University of Abertay Dundee David Valentine Economic Development, Angus Council Doug Grimmond Economic Development, Dundee City Council Jamie Bell Scottish Enterprise Grampian David Lippiat Scottish Enterprise Tayside Brendan Dick British Telecommunications Scotland Graeme Purves National Planning Framework, Scottish Executive Alan Denham National Planning Framework, Scottish Executive David Glass Scottish Enterprise Borders Joe Noble Scottish Enterprise Fife Allan Watt Scottish Enterprise Fife Alan Sinclair Skills and Learning, Scottish Enterprise Stephen Boyle Futureskills Scotland, Scottish Enterprise Charlie Woods Knowledge Management, Scottish Enterprise

Executive Summary
the local futures group
II
Executive Summary
Aims
In August 2003, Scottish Enterprise commissioned the Local Futures Group to carry out a geographical analysis of the knowledge economy in Scotland. This study supports the work of Scottish Enterprise and its network of Local Enterprise Companies in building a Scottish knowledge economy that delivers national prosperity and cohesion. The main aims of the research were:
To create a baseline picture of the geography of the knowledge economy in Scotland
To evaluate the case for a unified economic development and planning framework to enhance the performance of Scotland’s knowledge economy
To recommend ways forward on developing this strategic framework
Research and Policy Contexts
Research on the ‘knowledge economy’ dates back to the seminal work of Professors Fritz Machlup and Peter Drucker in the early 1960s. OECD studies of the knowledge economy in the 1990s advanced the ‘knowledge economy’ as a paradigm for policy making. Policy interest in the UK and the EU has intensified owing to the competitive pressures of the 21st
century global economy. Geographers believe that cities and city-regions will be the main players in the global knowledge economy.
The UK Government has made the knowledge economy its vision of Britain’s future. It is also committed, with other European governments, to delivering the Lisbon Summit (2000) goal of a successful knowledge economy across the EU by 2010. European regions are planned to help deliver this goal, and the knowledge economy is written into the future Structural Funds.
Clearly, Scotland will be influenced by UK Government knowledge economy policies, as set out most recently in the Innovation Report (2003). Of particular relevance to this study are two emerging dimensions in the Government’s approach to the knowledge economy:
The ‘horizontal’ dimension – across policy domains: enterprise and investment, competition, learning and skills and infrastructure for business, including planning (and housing), transport and broadband networks
The ‘vertical’ dimension – across geographies: national, regional, sub-regional and local layers of economic development policy and delivery
Strengthening these dimensions of knowledge economy policy involve partnerships and ‘joined up’ strategy – connecting policy domains and services, and connecting national, regional and local tiers of decision-making and delivery. What emerges in

Executive Summary
the local futures group
III
making both sets of connections is a “distributed model of knowledge economy policy”. At the same time, the ODPM-backed Core Cities Network is seeking to promote regional capitals in England as world-class knowledge economies.
The knowledge economy agenda in Scotland has evolved alongside that of the UK Government’s policy approach. In January 1999, the first knowledge economy task force focused on the commercialisation of university research, clusters and business innovation. A year later, the second knowledge economy task force focused on creating a more ‘joined up’ strategy.
Presently, Scotland’s national economic development strategy – and knowledge economy policies – is set out in the Framework for Economic Development in Scotland and Smart, Successful Scotland reports. Policy now favours a knowledge economy driven by ‘endogenous growth’ and aims to boost innovation, skills, and entrepreneurship in all sectors of the economy and in all regions of Scotland.
There is now policy interest in the role of cities and regions in Scotland’s economic development. This is being addressed through The Review of Scotland’s Cities and the National Planning Framework, the latter being directly citied in the UK Innovation Report as a potential building block for knowledge economy strategy.
The obvious question is: does Scotland need a third knowledge economy task force that explicitly introduces geography as the unifying framework for the knowledge economy?
The Analysis
For this study, we have carried out three types of analysis on Scotland’s knowledge economy:
Economic Architecture Analysis, based on skills and employment, provides an overview of the Scottish knowledge economy
Competitiveness Analysis – provides a benchmarking assessment of the knowledge economy at the sub-regional and local levels
A Stakeholder Analysis examines the evidence on some key issues raised by the local stakeholders
Results of the Architecture Analysis
For the regional level:
Scotland, along with the North and Midlands of England, lags behind Greater London and the South East and East of England on average earnings
Scotland’s employment rate is also disappointing by national standards – it is below the national average and very much lower than southern England
Scotland compares extremely favourably with the powerful South East on high knowledge-intensive sectors, depending more on the public sector; Scotland is far more competitive than the North and Midlands regions.
Less favourably, one in two private sector jobs in Scotland are concentrated in the relatively low

Executive Summary
the local futures group
IV
knowledge intensity K3 sector (where graduates account for between 15 and 25% of the workforce) – compared to a one in four figure for the North West, or one in seven figure for the South East. The bulk of Scotland’s K3 jobs are concentrated in retail and hotels and restaurant services, which are closely linked to tourism, and the construction industry.
Scotland’s skills profile resembles that of the South East and is far more favourable than the North West – it has a relatively large graduate labour pool and less serious ‘skills poverty’ problem
Thus, Scotland’s policy makers have to critically examine the nation-region’s business base in building a successful knowledge economy. Presently, Scotland’s problems appear not to lie with average skills or the public sector, but with its apparent dependence and growth bias towards consumer and tourism related services. This low value services bias combined with a large public services sector is not likely to produce a globally competitive knowledge economy in Scotland.
At the sub-regional and local levels:
South Western Scotland struggles with low employment rates and a large unskilled workforce
Highlands and Islands is marked by very low earnings levels and is dependency on ‘K3’ sectors
North Eastern Scotland has a very strong business knowledge economy
Eastern and South Western Scotland are highly dependent on the public knowledge economy for job generation
Edinburgh and Aberdeen are success stories and are highly competitive by national standards.
Glasgow also has a powerful base of knowledge-driven industries and public services, but is also characterised by a high level of ‘skills poverty’ and social polarisation.
The City of Dundee has a very high dependence on the public sector as a knowledge economy, the remaining jobs being generated by consumer services.
All English regions show a similar pattern of ‘metropolitan dominance’ in the knowledge economy. However, in the south of England, the knowledge economy is dynamic in accessible rural areas.
Results of the Competitiveness Analysis
We examine 5 dimensions of competitiveness: knowledge-intensive industries, skills & learning, enterprise, Infrastructure and Cultural Amenities.
With respect to knowledge-intensive industries:
In terms of city knowledge economies, Edinburgh and Glasgow outpaced Aberdeen and Dundee. There is a disappointing picture of economic change south of the ‘Central Belt’.

Executive Summary
the local futures group
V
In most parts of Scotland the public sector generates at least 40% of employment in knowledge-intensive sectors.
With respect to skills and learning:
Only Edinburgh appears to be a strong ‘magnet’ for migrants and the skills they potentially bring.
Both Edinburgh and Glasgow are in the top 10 local authorities in Great Britain when it comes to the retention of graduates in the local economy.
Areas in and around Glasgow and Edinburgh suffer skills poverty equal or greater than that seen in remote rural areas.
With respect to enterprise:
While recent start-up rates are comparable to the British average, the business dynamic of Scotland’s knowledge economy needs to be stronger – the glaring exception to this is Edinburgh’s phenomenal success on enterprise.
Edinburgh, followed by Aberdeen, performs well with greater access to knowledge creators and communications and business services firms. Glasgow trails behind on these measures.
With respect to infrastructure and cultural Amenities:
Scotland – with the exception of Glasgow – could benefit from higher levels of connectivity to international transport gateways within the UK and to London as
Britain’s global knowledge economy ‘hub’
Glasgow and Dundee score highly on ‘cultural amenities’ – although Edinburgh is also an international cultural destination.
More detailed analysis of how Scotland’s urban and rural areas performed produced the following results:
With respect to average earnings, Edinburgh and Aberdeen, Scotland’s most knowledge-intensive cities compare very favourably with their English competitors.
Rural Scotland lags behind England on knowledge-driven business employment change – Scotland’s rural knowledge economy is more public sector-dependent.
We can infer three regional knowledge economy centres in Scotland based on travel-to-work-areas: Glasgow and Motherwell and Lanark, Aberdeen City and the areas of Aberdeenshire, and Edinburgh City, West Lothian, Falkirk and Fife.
Stakeholder Views
Our interviews and workshops with local stakeholders confirmed the need for:
A local-regional approach that uses geography to reinforce strategies for the knowledge economy and regional cooperation
Recasting the competitive cities agenda to ensure that growth and

Executive Summary
the local futures group
VI
prosperity is inclusive of rural Scotland
A strategic framework that brings together spatial and economic levers along with a set of strategic priorities and actionable next steps
A Spatial Framework for Scotland’s Knowledge Economy
We conclude by recommending the following agenda-setting framework for Scottish Enterprise and its partners.
It would be worthwhile for the Scottish Executive and Scottish Enterprise to thoroughly explore options for strengthening the regional and local dimensions to the country’s knowledge economy policies.
We recommend a 3rd Task Force on Scotland’s Knowledge Economy that introduces geography as the unifying framework for the knowledge economy.
Vision: The “Nation-Region” Knowledge Economy
Scotland’s vision of its future as a knowledge economy has to fully reflect the country’s status as a ‘nation region’. Because Scotland’s economic governance status is ‘new’ (though Scotland’s nationhood status is old), Scottish policy makers have to embark on a ‘nation-building’ exercise if its knowledge economy policies are to work.
Scenarios Development
As a further, reinforcing policy step, Scottish Enterprise needs to develop future scenarios for the knowledge economy that can be used to support not only its visioning work, but also to
help begin the process of benchmarking progress at all levels.
A ‘Distributed Policy’ Model for the Knowledge Economy
We recommend the use of a distributed policy model for the Scotland knowledge economy. This model should be used as an organising framework for developing ‘joined up’ strategy and weighing up options for greater regionalism and localism in knowledge economy policy – including the case for planning ‘city-regions’ and developing a rural knowledge economy strategy.
A ‘Knowledge Economy Observatory’
Scottish Enterprise needs to create a ‘knowledge infrastructure’ to support and guide knowledge economy policy-making across sectors and geographies. The ‘hub’ of this nationwide ‘joined up’ infrastructure should be a ‘smart observatory’ – an interactive, web-enabled database-driven knowledge management system. This should be a ‘zero option’ for Scotland’s knowledge economy community of policy makers.
A Publicity and Awareness Campaign
Scottish Enterprise should work with the LECs to develop a unified message for local economic partnerships, local and regional authorities, industry associations and business networks, the HE and FE sectors, skills and training providers and other stakeholder groups. Local Economic Forums should provide an initial platform to deliver this message.
Introduction
the local futures group
7
1 Introduction
1.1 Background to the Study
In August 2003, Scottish Enterprise commissioned the Local Futures Group to carry out a geographical analysis of the knowledge economy in Scotland and to suggest its broad implications for economic development policies. This research supports the work of Scottish Enterprise and its network of Local Enterprise Companies in building a Scottish knowledge economy that delivers national prosperity and cohesion.
This interest in the geography of Scotland’s knowledge economy is mirrored by parallel developments ‘south of the border’. The UK Government is steadily growing the local and regional dimensions of its economic policy-making, and its latest statement on the knowledge economy – the Innovation Report (DTI, 2003) – recognises that regional development agencies, sub-regional learning councils and local authorities have to partner up successfully in the interests of national prosperity. Interestingly, whereas previous Competitiveness White Papers on the knowledge economy covered innovation, enterprise and skills, the Innovation Report adds two more great building blocks – infrastructure and planning – that require a more decentralised and geography-based approach towards the knowledge economy.
Through this study, then, Scottish Enterprise wishes to explore the rationale for making geography and planning and infrastructure an integral part of its strategies to deliver a competitive and inclusive knowledge economy. In turn, how can the knowledge economy agenda be embedded in national planning and infrastructure policies? Of particular interest is the role of Scottish cities as engines of the knowledge economy – geographers, including Local Futures Academic Panel – believe that city regions (but not any city region) should be seen as national ‘flagships’ in the global economy. Will rural Scotland be left behind as backwaters of the knowledge economy – Local Futures is currently working with DEFRA and EMDA on this very issue and the policy responses needed to grow the knowledge economy in rural England.
This study builds upon the geographical analysis contained in Local Futures previous report on the knowledge economy in Scotland, under the ERKE research programme 2002-03. In that report, we raised a number of issues based on applying our Regional Economic Architecture model of the knowledge economy to Scotland and its sub-regions:
The weakness of the business drivers of the knowledge economy
The importance of the public sector as a major player in the knowledge economy
The metropolitan bias of the knowledge economy and regional and local disparities

Introduction
the local futures group
8
1.2 This Report
Basically, this report extends and refines the previous analysis of the geography of the knowledge economy. The main aims of the research were as follows:
To create a baseline picture of the geography of the knowledge economy in Scotland
To evaluate the case for a unified economic development and planning framework to enhance the performance of Scotland’s knowledge economy
To recommend ways forward on developing this strategic framework
The study involved a mapping and measuring analysis of the knowledge economy in Scotland, using Local Futures original models and benchmark indicators. In addition, we carried out a range of stakeholder interviews to develop a critical view of the policy environment – this included the Scottish Executive, Scottish Enterprise, the Local Enterprise Companies and local authorities – and a range of university representatives and private sector organisations.
The report is organised as follows:
Chapter 2 provides a selective review of the research literature on the knowledge economy, and then goes on to discuss the policy agenda that has evolved in the UK and Scotland
Chapter 3 explains the Local Futures methodology for benchmarking the knowledge economy using an original set of indicators derived from our ‘architecture’ and ‘competitiveness’ analysis
Chapter 4 presents the results of our geographical analysis of Scotland’s knowledge economy, with special attention being given to its ‘city-region’ and urban-rural structural characteristics
Chapter 5 reflects on the results from our stakeholder interviews and the degree to which the results of our data analysis are consistent with perceptions of major issues on Scotland’s knowledge economy
Chapter 6 presents our ideas on a geography-based knowledge economy agenda for Scotland

The Knowledge Economy: Research and Policy Contexts
the local futures group
9
2 The Knowledge Economy: Research and Policy Contexts
2.1 Introduction
The knowledge economy concept surfaced in the Government’s Competitiveness White Papers during the 1990s as a scenario or imperative for UK Plc – around the same time as the publication of the OECD Knowledge-Based Economy report (1996). In March 2000, the Lisbon European Council agreed on making Europe “the most competitive and dynamic knowledge-based economy in the world’ by 2010. Scotland, reflecting these wider policy directions, has been relatively advanced in its policy thinking on the knowledge economy as the route to sustainable economic growth.
In this chapter, we have drawn together a number of strands of Local Futures’ analysis of the knowledge economy research and policy literature, as circulated to sponsors of the ERKE programme – [see, for example: Understanding the Knowledge Economy (Local Futures, 2004), A Regional Perspective on the Knowledge Economy in Great Britain (DTI, 2003), and The Geography of the Knowledge Economy: Academic Panel Survey (Local Futures, 2003)]. In this literature review, we have highlighted research and policy that relates to urban and regional development in the knowledge economy.
The last part of the chapter discusses current directions in Scotland’s economic and spatial policies. The UK Government’s drive towards regionalism and now localism in economic policy (see HM Treasury reports: Productivity – The Regional/The Local Dimension, 2001 and 2003) is already leading to a geography-based approach to the knowledge economy. Is Scotland going down this same policy path?
2.2 Research Background
The ‘knowledge economy’ as a new perspective on capitalist economic development surfaced more than 40 years ago – as such it does not refer to a ‘new economy’ built around the notion of the Information Society (the ICT industries were embryonic at the start of the 1960s). Unfortunately, and to plagiarise George Stigler’s view on the status of information in economic theory, the knowledge economy has tended to ‘occupy a slum dwelling in the town’ of economic development strategy – it appears under an ICT or High Technology sub-heading in policy documents. To fully grasp the knowledge economy as a paradigm for contemporary policy and research, we have to go ‘back to the future’ and revisit the work of the great Princeton economist, Fritz Machlup.
The Knowledge Economy: Research and Policy Contexts
the local futures group
10
In his seminal work, The Production and Distribution of Knowledge in the United States (1962), Machlup examined long-term changes in the industrial and occupational structures of the US economy (1900 –1960) to show that:
Services and ‘white collar’ work had overtaken manufacturing and ‘blue collar’ work in terms of their respective shares of GDP and the workforce by 1960
‘Knowledge industries’, defined by the intrinsic nature of their final outputs, dominated wealth creation – technology, publishing and communications, finance and business services, R&D and education (including libraries), cultural and creative activities
‘Knowledge workers’ – professional, managerial, scientific and technical workers scattered across all sectors of the US economy – from agriculture through manufacturing to services – formed a growing majority of the workforce and held the key to growth, competitiveness and prosperity
Machlup’s work was highly significant for two reasons. Firstly, it put services, high technology and the knowledge economy on the US Government’s economic policy agenda, domestically and internationally. Second, as Boulding (1963) observed in reviewing Machlup’s book, “the very concept of a knowledge industry contains enough dynamite to blast traditional economics into orbit”. Neo-classical economics (the ‘text book’) relied on the axiomatic assumption that producers and consumers were perfectly informed about market conditions and choices – prices, technologies, the identities of suppliers, locations, job opportunities, etc. All the smoothly drawn demand and supply curves to be found in economics textbooks are only definable if this assumption holds. But, if knowledge was really freely available and costless – a ‘public good’ that was equally accessible to all producers and consumers - why were businesses, governments and consumers devoting the lion’s share of the nation’s resources to it?
This question was simple but profound in terms of its impact on economics as a discipline and hence economic models as policy tools. It paved the way for new areas of theoretical and policy development, for example:
What role did knowledge as human capital – the skills and competences of the workforce – play in national economic competitiveness? Were countries investing enough in universities and training?
What role did knowledge as innovation play in national economic performance (productivity)? Were countries spending enough on science and technology or R&D? How advanced or backward were a nation’s businesses when benchmarked internationally?
What role did knowledge as power play in the regulation of markets and industries? How were monopolies rooted in intellectual property – brands, patents, copyright, etc? How did knowledge inequalities influence relations between businesses (large and small firms), between employers and employees, producers and consumers and so on?
The Knowledge Economy: Research and Policy Contexts
the local futures group
11
These types of questions are, of course, highly relevant to present debates on the knowledge economy and its policy framework. For example, are we under or over investing in universities? Or, why are we lagging behind in the international productivity, innovation and skills ‘stakes’? Scotland’s policy makers are locked into these types of policy debates – raised by Machlup’s brilliant analysis of the knowledge economy, 40 years ago.
From a business school background, Peter Drucker also claims to have invented the knowledge economy concept. Rather than capital, labour or natural resources, Peter Drucker sees applications of knowledge to work – the creation of value by productivity and innovation – as central to wealth creation activity in the 21st century economy. In his recent book entitled Post Capitalist Society (1993), he identifies three historical (overlapping) phases of the ‘knowledge economy’:
The Industrial Revolution (1750-1900) – knowledge as applied to tools, processes and products
The Productivity Revolution (1880-1945) – knowledge as applied to work
The Managerial Revolution (1945 – now) – knowledge as applied to knowledge
According to Drucker, the term ‘productivity’ was unknown at the time Frederick Taylor (1856-1915) published his studies of work and training-driven business and economic growth. Similarly, management – a core discipline of the modern knowledge economy – was not discovered as an economic driver until after World War II. The types of issues raised by Drucker resonate with current policy debates on the knowledge economy. He points out that the quickest way to middle class income in Britain as late as 1960 was to work in unionised mass production industries – whereas today ‘there is practically no access to middle-class income without a formal degree’. The UK Government’s goal of widening access to higher education to reach 50 per cent of young people is consistent with Drucker’s views on the route to a more open and inclusive Knowledge Society – Scotland has already reached this target.
These challenges, according to Drucker, have to be addressed through technical and social innovation – the latter referring to changes in economic institutions and cultures. Continuous innovation in firms, public bodies and non-profit organisations is central to knowledge-driven economies. The implication of this is that knowledge economies have to be decentralised:
Its organisations must be able to make fast decisions, be based on closeness to performance,
closeness to the market, closeness to technology, closeness to changes in society, environment,
demographics, knowledge, which must be seen and utilised as opportunities for innovation’ (page 54).
Drucker argues that, while the knowledge economy may be decentralised and embedded in local communities, it is also inherently global in the sense that it transcends the boundaries of communities and nation states and administrative or planning regions and city regions. As LSE economist Danny Quah (1999) observes in his analysis of the ‘weightless’ knowledge economy, the future IS global “because the supply of knowledge products is bounded neither by geographical location nor by increasing marginal cost, their natural marketplace is

The Knowledge Economy: Research and Policy Contexts
the local futures group
12
immediately global”. The knowledge economy is a global-local phenomenon and has to be approached by policy-makers as such.
Machlup and Drucker worked on a ‘big canvas’ - the macro level. Most economists have focused attention on the micro level, the main themes being the roles of knowledge, innovation, technical change and learning in firms and industries. Relevant areas of work include: information economics (see, for example: Stiglitz, 2000), national innovation systems (Freeman and Louca, 2001), the ‘networked economy’ (Castells, 1996), institutions and evolutionary economics (Loasby, 1999) and the role of human capital (Lucas, 1988), or ‘talent’ (Florida, 2002). The so-called ‘new economy’ (Leadbetter, 1997) is essentially an extension to the ‘old knowledge economy’, a necessary update of its technological, market, industrial and geographical frameworks.
Reflecting the eclectic nature of knowledge economy research, the scope of the knowledge economy agenda is extremely wide and crosses over numerous policy fields – see Chart 2.1.
Chart 2.1 – The Scope of the Knowledge Economy Agenda (Research and Policy)
OECD – Macro-level Knowledge Economy
Strategic Management – Business Process
EC Immaterial Investments as Innovation
R&D Spend Knowledge about social/economic changes, demand articulation
Knowledge and education
Know How Hard technological knowledge Distribution and logistics
Industrial patterns/design Strategic choices about core competences (contracting out, co-development)
Image, design and quality
Patents & licences Strategic positioning of products and concepts
Premium brands and market differentiation
Artistic creations/copyright Product design, user friendliness and integrated electronic software
Innovative/active marketing/advertising
Royalty payment rights Integrated values, convenience, quality of life, self affirmation, fun
Ability to produce, re-package and market content
Training and Human Resource Development
Brand names, advertising and image-building
Organisational transformation
Market share Team and network building Re-training
Product certification Process design, learning organisation and ‘soul’
Distribution channels
Customer/subscriber lists Reputation in networks New communication patterns
Product/service brands External logistics Knowledge-intensive and high value added production
Software and similar products After-sales service and customer feedback
Consumer behaviour
Source: European Commission, Panorama of EU Industry, 1997

The Knowledge Economy: Research and Policy Contexts
the local futures group
13
2.3 Spatial Perspectives – Globalisation and City-Regions
Globalisation has raised the stakes of developing a better understanding of the knowledge economy and what it means for local to regional to national economic development. Announcing the launch of a Commons Treasury Committee inquiry into Britain’s regional productivity gap, Chancellor Gordon Brown emphasised the need to “meet the challenges of China growing at 8 per cent a year and the 1m graduates coming out of universities in India” (Financial Times, 16 December 2003, p.8). The 2003 Pre-Budget Report highlights the long-term jobs threat to the regions of call centre and other e-enabled information work migrating to India. Building a globally competitive knowledge economy around a new enterprise culture, a highly skilled workforce and greater innovation capacity is now a ‘zero option’ for the regions as well as UK Plc.
In his insightful book on the nature of markets and marketplaces entitled Reinventing the Bazaar, John McMillan (2002) argues that the competitive forces unleashed by globalisation combined with the e-business explosion could produce a ‘win-win’ future for rich and poor countries – and presumably for rich and poor regions within countries. However, radical reforms of market systems and institutions are needed for the knowledge economy to bring more balanced and equitable patterns of economic development between and within countries. The fundamental source of competitive advantage in the knowledge economy - intellectual property rights defined very broadly – lies with rich countries/regions and multinational corporations.
The challenge facing many regions and countries in an ideas-based knowledge economy characterised by the unequal distribution of intellectual property (patents, copyrights, brand names, trademarks, education, health care innovation, etc) is to somehow develop their own authentic base of comparative economic advantage. As Danny Quah puts it:
(In the knowledge economy) winners are superstars – they own the entire market, and there is only one
of them. Those who come second find no economic elbowroom. Rightly they need to seek out new
knowledge-products to make their own, not attempt me-too reproductions. And if this leads to faster
technical innovation economic growth might be higher as a result.
The most promising and liberating area of the Knowledge Economy for ‘home-grown’, authentic businesses and jobs appears to be the creative and cultural industries. In his thought-provoking book on cross-cultural trade, Creative Destruction (2002), Tyler Cowen argues that globalisation is leading to the homogenisation of cultural products across countries – through trade in music, arts, media, food, fashion, etc – but at the same time, also to greater heterogeneity of cultural production and experience within countries. The end result then is not the subversion of distinct local cultures but greater cultural diversity as a new asset for global trade and regional economic growth.
More globalised and diverse economies – with city-regions acting as international and national hubs – have the crucial advantage of being ‘magnets’ to those creative, entrepreneurial and professional classes that ultimately make the ‘wheels of the knowledge economy turn’. Richard Florida’s (2002) work in the US and Canada has been particularly influential in this area of Knowledge Economy policy development. Talent flows to where
The Knowledge Economy: Research and Policy Contexts
the local futures group
14
cultural diversity thrives – quality theatre and quality restaurants, rather than the standard fare that has made so many British high streets dull, boring and ultimately commercially unviable. Globalisation will, according to Cowen, increase the quality and sophistication of modern consumer tastes: “Ignorant consumers damage quality just as well-informed customers support it”. In other words, the Knowledge Economy extends to the consumption sphere, as much as it does to the production sphere. The virtuous circle is complete where knowledgeable consumers drive knowledgeable producers in rounds of innovation – whether this consists of new types of food, new fashion designs and so on.
Consumer knowledge as a driver of business innovation – is completely neglected in economic development strategies. Yet, as a recent DTI-sponsored study (DTI, 2003) of the drivers behind skills and workforce development clearly shows, dynamic SMEs and large firms are led by changes in markets – that is consumers of their products and services. In modern service economies – that is, local and regional economies throughout Britain – it is important to understand and harness the power of consumer knowledge as exercised in markets – not just the high street impacts, but how purchases and preferences ripple through the supply chains to original producers. The consumer-driven quality and diversity ‘revolution’ needed for knowledge economies to flourish locally and globally should be a major future theme of economic development strategies.
According to the University of Toronto’s Meric Gertler (2001), cities are the principal sites of innovation and the production of knowledge-intensive good and services. His explanation underlines the sharing of tacit as well as codified knowledge between individuals and institutions (economically meaningful ideas and intelligence are exchanged ‘over lunch’ or ‘over a drink’). Underlying relations of trust and reciprocity are encouraged by the parties concerned being located in the same city or city-region.
Given the interactive and social nature of innovation, city-regions provide the ideal space in which social
learning processes can unfold. The sheer density and concentration of economic players in large cities
offer multiple opportunities for contact, interaction and information circulation over time. Supporting this
interaction is a large concentration of specialised providers of services and goods operating within a
well-defined social division of labour in the city. Furthermore, while the simple geographical
concentration of economic players facilitates productive interaction, spatial clustering provides another
ingredient that is essential to the innovation process.
The most powerful treatment of ‘localised knowledge spillovers’ is Michael Porter’s (1990) work on clusters and competitive advantage. The knowledge economy of the Government’s Competitiveness White Papers and the Innovation Report is a cluster-based economy – from the biotechnology firms around Cambridge University to the City and London’s world-beating marketing and advertising industries concentrated around Soho. The DTI has identified ‘clusters’ in every region of Britain, as an organising framework for regional economic strategies, business support and skills training. Cluster-based economic strategies have their critics and their supporters. They are perceived to be too exclusive, favouring more knowledge and technology-based sectors over traditional manufacturing and service industries – the latter accounting for the great bulk of SMEs and start-up businesses. There is some scepticism about the genuine potential of officially designated clusters to compete globally and act as engines of local and regional growth.
The Knowledge Economy: Research and Policy Contexts
the local futures group
15
Cluster growth depends on being able to generate, attract and retain talent – the creative classes (Florida, 2002) and highly educated people (Lucas, 1988; Glaeser, 1998) who drive modern knowledge economies. These footloose ‘knowledge workers’, according to Gertler (2001) and Florida (2002), are attracted to city regions – and NOT ANY city region – that offer local social and cultural diversity (note Florida’s use of a Gay Index to reflect an environment that is open to diversity and newcomers), as well as a diversity of available opportunities for career advancement. The geography of ‘brain drains’ and ‘brain gains’ – internationally and within countries – is determined increasingly by the economic, social and cultural diversity of knowledge economies.
It is possible that globalisation could actually benefit Britain’s would-be city-regions outside London and the South East, through cross-cultural trade and linkages with other regions of Europe and the rest of the world. Building institutional links, including university alliances – together with traditional trade missions and export offensives – should be core global-local economic strategies.
To create an up-to-date picture of how academic researchers see the geography of the knowledge economy in Britain, Local Futures established an Academic Panel (LFAP) of leading UK university-based geographers and invited their views on trends and policies. There was a consensus among Panel members that London and the South East dominated the knowledge economy today, and in the absence of a radical national strategy that could produce a more balanced economic geography, these regions would continue to do so in future. Globalisation would work with a southern bias.
All of the panellists explained their responses with reference to the ‘pre-existing geography’ of economic development in Britain – London and the South had dominated historically, in different stages of capitalist development, and this had now translated into cumulative or first-mover advantages in the contemporary knowledge economy. In aggregate, the North and Midlands were effectively locked into a low-wage equilibrium trap and locked out of the business knowledge economy. This perspective can be traced back to the cumulative causation theory of regional growth first proposed by Gunnar Myrdal (1957) and then refined and applied to the UK by Nicolas Kaldor (1957, 1970). Basically, this theory challenged the neo-classical implication of equilibrating regional markets – factor price equalisation would guarantee an end to the ‘north-south divide’ in the long run. Instead, Myrdal and Kaldor identified the possibility of endogenous income divergence attributable to cumulatively reinforcing growth based on agglomeration economies and increasing returns to scale. The ‘trigger’ for cumulative growth in the UK regional context – with London and the South East benefiting – was certainly the ‘Big Bang’ in the financial markets, reinforced by and working in combination with the new economy (ICT), both inherently global in nature.
The Panel generally believed that successful re-balancing the knowledge economy in favour of the Regions, Scotland and Wales depended on the development of successful city-regions – backed by fast track rail services out of London, devolution and relocation of Whitehall offices, more R&D spending for universities other than Oxbridge/London and other radical big policy changes in economic development. Chart 2.2 highlights the Panel’s views on cities and city-regions in particular.

The Knowledge Economy: Research and Policy Contexts
the local futures group
16
Chart 2.2 Academic Viewpoints on the Geography of Britain’s Knowledge Economy
Support for City Regions
We need the pre-1986 governance structures that provided strategic metropolitan government like in London. We need this for the regional capitals and it is vital to get the knowledge economy going in the regions – the City-Region Future. This is the message from worldwide evidence and experience.
Metropolitan unitary authorities like Newcastle and Sunderland are important as drivers behind the city region scenario. Sub-regional partnerships have been set up as vehicles for devolving RDA budgets, however, their strategic roles as knowledge economy players are limited.
Big city authorities could become knowledge economy leaders. Birmingham Council, for example, provides leadership for the City, the West Midlands county and the Region, and provides a focus for visioning the future and more practically, a focus for integrated knowledge-driven economic development, including transport and planning.
Planning Ahead
A national approach to the geography of the knowledge economy should be high-tech specialisation in Manchester/Cheshire area, finance in Leeds, and medicine in Edinburgh (for example). It is utterly critical – so much policy is spatially discriminatory.
A national strategy for regional development should aim to establish a knowledge economy backbone of city regions. These city regions would need an excellent transport infrastructure, big knowledge economy projects (e.g. Nottingham’s planned Bio City), and high-level Government jobs capable of generating clusters (e.g. the NHS Executive in Leeds).
Elected regional assemblies should underpin regional knowledge economies with a massive redistribution of resources away from the South East. More autonomy for Scotland, Wales and Northern Ireland to recognise that the most successful European economies over recent decades have been small nations with genuine economic sovereignty.
RDAs have a critical role to play in the regional knowledge economy. However, in order to ‘interface’ more effectively with more global companies, the RDAs have to be backed up by national economic coordinators.
The Future
Major changes are unlikely. The trends are obdurate and will probably involve London growing even bigger, counter-urbanisation with the growth of e-work and e-business around the bigger cities, and a global shift of call centres, with the biggest impact being felt in the north.
It is possible that new technologies (for example in design) or cultures may allow some specific localities - not necessarily within the current main knowledge economy locations - to begin to bloom.
The current spatial structure will not change up to 2010. The spread effects are too weak. The more knowledge-intensive economic activities will stick to the major centres – and some accessible rural areas where there is growth are really like “halos” around these centres.
Source: Local Futures, Report of the Academic Panel Survey on the Geography of the Knowledge Economy, 2003

The Knowledge Economy: Research and Policy Contexts
the local futures group
17
2.4 UK and EU Policy Background
The Government’s approach to the knowledge economy is set out in a series of Competitiveness White Papers (1997-2001) and the Innovation Report (2003). The latter is most relevant to this study because it consolidates the Government’s policy thinking and progress on the knowledge economy. Before turning to the Innovation Report, it is worthwhile flagging up the EU policy context – vision and strategy for Europe’s knowledge economy matches closely with the UK agenda.
The ‘Lisbon Strategy’ (with extensions agreed at the Stockholm and Goteburg European Councils, 2001) mirrors the UK knowledge economy strategy (see below), with its initiatives designed to encourage competition and enterprises, innovation, employment, education and training and modernising the European Social Model. The European Council meets in March 2005 to assess progress with the delivery of the Lisbon Strategy targets – then, the Strategy will be reviewed and given fresh impetus in light of its application to the enlarged European Union.
The EU expects every nation and region to contribute towards the delivery of the Lisbon Strategy – with a successful knowledge economy at its heart. The UK Government is committed to the Strategy nationally and regionally, with the RDAs in England and the Devolved Administrations (DAs) in Scotland and Wales playing a key role in delivering a globally competitive knowledge economy across the whole of Europe. In England, the RDA Regional Economic Strategies, the Frameworks for Regional Employment and Skills Action (FRESAs, and now Regional Skills Partnerships) and Sustainable Development Frameworks together map closely into the Lisbon Strategy in terms of objectives. The Integrated Regional Strategies (IRS) of the English regions are gradually being rolled out by the Regional Assemblies and RDAs as ‘umbrella’ strategies that bring together the RES/FRESA and Regional Planning Guidance. The North West, North East and Yorkshire and Humber regions are obviously most advanced in this process of creating up regional ‘joined up’ strategies for the knowledge economy, given the impending referendums on devolution due in November 2004.
As set out in the Innovation Report, the UK is seeking to make the most of European innovation and economic initiatives – such as the knowledge economy R&D infrastructure work in Framework 6, the European Research Area for highly skilled workers and so on. Of equal relevance is the Third Cohesion Report outlining the latest proposals for 2007 to 2013, given the main three themes that will guide interventions backed by the Structural Funds: innovation and the knowledge economy, accessibility and services of general interest and environment and risk prevention. These themes, supplemented by the European Employment Strategy, will be integrated into the various EC plans and programmes, though exactly how is not clear at present. There will however be an emphasis on knowledge-driven businesses and industries, learning and skills, university and R&D drivers of regional economies and a general emphasis on knowledge economy infrastructure – such as ICT and e-government, business support and so on. Most of this coincides with the Innovation Report. There is also a strong urban-rural dimension to the European knowledge economy strategy, though beyond the accessibility and cohesion objectives it is not yet clear as to how this dimension will translate into policy and practice.
The Knowledge Economy: Research and Policy Contexts
the local futures group
18
From the Innovation Report, it is evident that the UK Government’s approach to the knowledge economy is mainly concerned with improving business innovation and the global competitiveness of UK Plc. For the ‘new economic localism’ to succeed, local authorities need to lead the creation of a local knowledge economy agenda – because the knowledge economy is the Government’s vision and main organising concept in economic policy. According to the Prime Minister in his introduction to the DTI Innovation Report (2003)
“We want the UK to be a key knowledge hub in the global economy, with a reputation not only for world
class scientific and technological discovery but also for turning that knowledge into new and profitable
products and services. This report sets out the next steps we are taking to turn that vision into a reality.”
Minister for Science and Innovation Lord Sainsbury is the main champion of the knowledge economy agenda, including its policies for developing knowledge-based ‘clusters’ in all regions of the UK. This global orientation and strong emphasis on high technology businesses, universities and ‘talent’ has led to a widespread view that the Government’s knowledge economy vision and policy agenda is not universally relevant or appropriate to all regions of the UK.
There are signs that the Government is seeking to widen out and create a more ‘joined up’ approach to the knowledge economy. The Ministerial team is one important step in this direction. Within the DTI itself, the Skills Unit works across departmental boundaries connecting policy analysts from skills, innovation, enterprise and economic development – this attempt to create a joined up approach to skills from a knowledge economy perspective is being pursued at the centre and in the regions.
There are two dimensions to the Government’s strategic approach that are particularly relevant to defining a knowledge economy agenda for local authorities:
First, the ‘horizontal’ structure of knowledge economy policy – stretching across policy domains where local authorities are already active players: enterprise and investment, competition and learning and skills; and infrastructure for business, including planning (and housing), transport and broadband networks
Second, the decentralised structure of knowledge economy policy – more policy and delivery responsibility shifting to the regional and local levels, where local authorities act in partnerships with sub-regional bodies, notably the LSC and SBS, and regional agencies, especially the RDAs
Importantly, both dimensions of knowledge economy policy necessarily involve partnerships and ‘joined up’ strategy – connecting policy domains and services, and, connecting national, regional and local tiers of decision-making and delivery. What emerges in making both sets of connections is a “distributed model of knowledge economy policy” – a matrix of partnership activity – see Chart 2.3.

The Knowledge Economy: Research and Policy Contexts
the local futures group
19
Chart 2.3 A Distributed Model of Knowledge Economy Policy
Skills Enterprise Innovation Infrastructure Competition
National
Regional
Sub-regional
Local
Between the idea and the reality of joined up knowledge economy policy we find the familiar obstacles posed by existing governance structures. Using the above matrix for our stakeholder analysis, Local Futures research at the regional, sub-regional and local levels in England has found that the main policy levers and players of the knowledge economy are not ‘joined up’ at present.
Time is bound to change this picture of regional economic governance. It is important to bear in mind that the RDAs are new and much could change should devolution in England become a reality, as it has in Scotland and Wales. The LFAP unanimously felt that without devolution and competitive city regions outside London, the knowledge economy is likely to continue to widen rather than close the productivity gap between and within regions - the Government’s central policy target and rationale for the new localism and regionalism in economic policy.
The Government’s knowledge economy agenda has reached the regional level, although as with the national level, the agenda is still fragmented rather than joined up in any real sense. The signs are, however, more encouraging and there is an observable tendency towards a distributed model of knowledge economy policy. A key aspect of this is the ODPM-backed Core Cities Working Group – a partnership between 8 UK Core Cities (Birmingham, Bristol, Leeds, Liverpool, Manchester, Newcastle, Nottingham and Sheffield), the 9 RDAs and central government departments, including the ODPM, the Treasury and the DTI, Transport and Culture, Media and Sport.
The recent Competitive European Cities report (ODPM, 2004) found that the English Core Cities lag behind the best continental cities in economic competitiveness. Only London (23rd) and Scotland’s ‘big two’, Edinburgh (25th) and Glasgow (29th), appear in the top half of the 61-city league table showing GDP per head performance in 2001. Generally UK cities score poorly on innovation and skills – the cornerstones of a modern knowledge economy. We see later in this report that our benchmarking analysis of the knowledge economy also shows Scotland’s cities as leaders outside London.
The ODPM report emphasises that urban competitiveness performance is sensitive to how city boundaries are drawn. This is one of the big missing links in the ‘core city’ analysis and also in city-region definition and measurement. In fundamental respects, city boundaries are historical constructs, and their geographical delineation reflects arguments about the efficiency of the public space economy (optimum service delivery) and its administration, as much as arguments about local democracy and community attachment (the local geography of social capital). But, and a big but, city boundaries – and rural boundaries – are certainly not designed in any genuine respect to meet the demands of city-region economies that the Government would like to act as ‘dynamos’ and global competitors’ in the contemporary or

The Knowledge Economy: Research and Policy Contexts
the local futures group
20
future global economy. In the Scottish context, interpretation of data analysis must be conscious of the local delineation of city boundaries - tight boundaries used for Glasgow and Dundee and the wider cast boundaries for Edinburgh and Aberdeen – to reflect the true characteristics on the ground. Travel to work areas are only one way of defining these new possible geographies – but they measure sprawl, rather than the market-based networks of industrial and cluster activity that a functional regional economy is based upon.
The best we can do is to adopt a pragmatic approach, using available data on the knowledge economy – the approach we use here. Importantly, in defining city-regions, one needs to have a more comprehensive geographical picture of the national or regional knowledge economy – that is what lies outside the ‘city walls’ and how urban and rural areas fit together as part of a greater economic and social formation. This is how we have approached Scotland’s knowledge economy geography.
2.5 The Scotland Context
The knowledge economy agenda in Scotland has evolved alongside that of the UK Government’s policy approach. The response to the DTI’s 1998 Competitiveness White Paper was the setting up of the first Knowledge Economy task force in January 1999, and the publication of its findings in the report Scotland: Towards the Knowledge Economy (the recommendations centred on the commercialisation of university research, clusters and business innovation). The second Knowledge Economy task force produced the report The Knowledge Economy Cross-cutting Initiative (2000), its emphasis being on creating a more joined up’ approach towards the knowledge economy:
“…We have in the Scottish Executive brought together the Digital Scotland and Knowledge Economy
agendas within the Enterprise and Lifelong Learning Department. This will I hope send a strong
message about the importance we place on these topics and on our commitment to a technologically
advanced and inclusive Scotland.” – Henry McLeish, First Minister.
Scotland’s policy thinking reflected the wider UK strategy and also the OECD work on the knowledge economy referred to earlier in the chapter. Local Futures research under ERKE and other projects also suggests that Scotland’s thinking on the knowledge economy as a Devolved Administration – with Scottish Enterprise pre-dating the English RDAs – has been well ahead of other regions in Britain, including London. In many senses, Scotland has had a head start on the knowledge economy agenda.
The DTI Innovation Report (2003) has refreshed the Government’s knowledge economy agenda – as discussed above, it is more ‘joined up’ and regional in terms of its overall policy directions. The DAs are ‘covered’ by the Report:
“The Government is committed to increasing the prosperity of all regions while narrowing inter- and
intra-regional disparities… significant aspects of the innovation policy agenda in Northern Ireland, Wales
and Scotland are the responsibility of the Devolved Administration

The Knowledge Economy: Research and Policy Contexts
the local futures group
21
Much of the thinking on innovation is consistent with Scotland’s core policy ideas – and perhaps most significantly, the Report makes special mention of Scotland’s planning system as an infrastructure building block of the knowledge economy (see page 27).
The Scottish Executive and Scottish Enterprise are the two main drivers behind economic development in Scotland. Within the Scottish Executive the Innovation Policy Unit (IPU) has broad responsibility for innovation working with a number of departments including the Development Department, Education Department and Enterprise, Transport and Lifelong Learning Department. As the lead regional economic development agency, Scottish Enterprise is charged with delivering a successful knowledge economy ‘on the ground’ through its nationwide network of Local Enterprise Companies (LECs). Scotland’s economic development policy is articulated in the report Framework for Economic Development in Scotland (FEDS), with the Smart, Successful Scotland (SSS) report setting out a national strategy for the knowledge economy.
Like the UK and EU strategies, the FEDS links the knowledge economy imperative for Scotland to the challenges of the 21st Century global economy. The central argument in the FEDS is that Scotland needs to develop a successful knowledge economy on the basis of ‘endogenous growth’, rather than relying on inward investment and the global competitiveness of a handful of sectors. The knowledge economy is seen as being universal in scope, with a ‘rising tide’ of innovation, skills and entrepreneurship evident in all sectors of the economy and in all urban and rural areas of the country.
Of paramount importance is how Scottish Enterprise realises the Executive’s vision and delivers it nationally, regionally and locally in partnership formats. Skills and learning have moved to the centre of Scotland’s economic development strategy – like in the UK and the regions. Reflecting this greater emphasis on developing the country’s human capital stock, Scottish Enterprise is pursuing a number of initiatives such as:
Demand-led learning support as part of the Scottish Executive’s strategy for lifelong learning
Developing Careers Scotland as an all-age career management service that responds to local economic development needs
“Futureskills Scotland” as a research and intelligence base for labour market policy and reform
Merger of the skills advisory services for businesses with Business Gateway to support investment in demand-led training
In addition to learning and skills, Scottish Enterprise has prioritised business and enterprise growth and global connections as organising themes of its knowledge-driven economic development strategy and its implementation through the LEC network – see the box below. The ‘Global Connections’ policy strand is concerned with improving digital connectivity and making Scotland a ‘hub’ of the global knowledge economy.

The Knowledge Economy: Research and Policy Contexts
the local futures group
22
Organising themes for the Local Enterprise Companies
As outlined by A Smart, Successful Scotland, 2001 Growing Businesses – productivity, skills, higher wages, employment growth, and higher growth rate
• Greater entrepreneurial dynamism and creativity • More e-business • Increased commercialisation of research and innovation • Global successes in key sectors
Global Connections – increase flow of products, technologies and ideas in and out of Scotland
• Digital connectivity • Increased involvement in global markets / export market, etc. • Scotland to be a globally attractive location – importance of place • More people choosing to live and work in Scotland (attraction and retention of talent)
Learning and Skills – high skill, high wage economy with high employment rate
• Improving the operation of the Scottish Labour market • The best start for all your young people • Narrowing the gap in unemployment • Improved demand for high quality in-work training
Like the UK and the English regions, Scotland is pursuing the ‘holy grail’ of joined up economic policy, based on the distributed policy model of the knowledge economy we outlined earlier. The SSS strategy demands higher levels of policy coordination between national and sub-national players - the Executive, Scottish Enterprise, the LECs, the HE and FE sectors, sub-regional economic partnerships and local authorities – as well as a strong global dimension to economic development strategy – such as Scottish Development International, Visit Scotland, British Trade International, Invest UK, etc. In our earlier literature review, we emphasised the need for a global-local approach to the knowledge economy agenda.
Like the rest of the UK and the English regions, Scotland has to give serious consideration to the issue of decentralisation in knowledge economy policy-making and delivery. Presently, and like the RDAs, Scottish Enterprise uses the LEC network to deliver national policies, however it lacks a strategic engagement with local and sub-regional economic partnerships that are proactively shaping the knowledge economy across the country – but ‘off the radar screen of top-down national policies’. Embedding geography into Scottish Enterprise strategy is becoming all the more necessary with the modernisation of Scotland’s national planning system – earlier we mentioned its citation in the UK Innovation Report as a building block of the knowledge economy in Scotland.
The Review of Scotland’s Cities and the National Planning Framework for Scotland have largely been responsible for addressing spatial planning. Sharing the basic thrust of the ODPM-backed ‘Core Cities’ network of English metropolitan centres (see above), the ‘Review’ examines the roles of Scotland’s six cities (Stirling has since gained city status) and their immediate hinterland. While cities are recognised as drivers of the knowledge economy the big strategic question for planning and economic development relates to the definition of geographical boundaries – the spatial parameters of the wider ‘city-region’ or inter-regional relationships. A recent paper by Begg and Docherty (2003) argues the case for city-regions as the preferred framework for planning and developing Scotland’s knowledge economy – we return to this issue in our mapping and measuring analysis.

The Knowledge Economy: Research and Policy Contexts
the local futures group
23
The patchwork of formal and informal arrangements since Local Government re-organisation in 1996
confirms the need for city-region governance arrangements.
Building Better Cities
The recently published National Planning Framework provides a broad overview for spatial development. It identifies the linkages between economic growth and spatial development (infrastructure planning, regeneration, core cities, etc.) and focuses attention on economic development zones as strategic areas for co-ordinated action - for example, the Edinburgh-Glasgow axis and West Edinburgh and the Clyde Corridor. The 21st Century modernisation of Scotland’s planning system does present opportunities for pursuing a geography-based approach to the knowledge economy. The emerging policy framework sets out urban development objectives that reflect local variations and priorities in the case of each city. Reinforcing this are strategic city-region agreements, which are basically regional planning frameworks for prioritising the allocation of City Growth Funds money.
2.6 Conclusion
The knowledge economy policy agenda is still evolving in Scotland, the UK and Europe. There are two clear trends that Scottish policy makers have to address: first, the need for a ‘joined up’ strategy and second, the need for a decentralised approach to the knowledge economy agenda. The former strategic imperative is, of course, the ‘holy grail’ of modern economic development policy, given the governance and political barriers to its implementation. The second imperative is about greater regionalism and localism in economic development.
Scotland is a ‘nation region’ in the same way that London is a ‘city region’. As such, while its strategic approach to building a successful knowledge economy is still influenced by UK and EU policies, Scotland has much greater scope – compared to the English regions – in setting its own priorities in making and delivering policies. A spatial planning framework for the knowledge economy in Scotland would help to create a ‘joined up’, centralised strategy, one that keeps pace with governance trends in the UK and the EU. Further, the Scottish economy is relatively small and largely concentrated in the ‘central belt’ - this could be one of Scotland’s biggest advantages if it can succeed in building synergies nationally, regionally and locally.
In the next chapter, we take the first step towards creating a spatial framework for Scotland’s knowledge economy – a baseline analysis of the geography of the knowledge economy. Our methodology and indicators for this analysis have been developed in the context of three years of research for Scottish Enterprise and other partners in Scotland (the previous ERKE project), and for the English regions and the DTI.

Benchmarking the Knowledge Economy – the Local futures Approach
the local futures group
24
3 Benchmarking the Knowledge Economy – the Local Futures Approach
3.1 Introduction
The knowledge economy is here, but the analytical tools and indicators for measuring its performance are missing. The OECD (1996) concluded in its major programme of work on The Knowledge-Based Economy that:
“At the heart of the knowledge-based economy, knowledge itself is particularly hard to quantify and also
to price. We have today only very indirect and partial indicators of growth in the knowledge base itself.
An unknown proportion of knowledge is implicit, uncodified and stored only in the minds of individuals.
Terrain such as knowledge stocks and flows, knowledge distribution and the relation between creation
and economic performance is still virtually mapped”.
A definitive list of indicators for mapping and measuring the knowledge economy does not yet exist. The OECD has tended to lean towards ‘harder’ technology, innovation and intellectual property; strategic management experts have tended to focus on various aspects of the business process (this is where the knowledge economy literature is mostly to be found in major bookshops).
This chapter explains our methodology for benchmarking national, regional and local economic development in Scotland from a knowledge economy perspective. Local Futures has developed this methodology – including an original set of benchmark indicators for mapping and measuring the knowledge economy – in the course of the ERKE research programme and consultancy projects. We have included a metadata supplement in the Annex (see Annex - A.5) given the strong interest Scottish Enterprise has in this project’s delivery of a knowledge economy methodology and indicator base.
The foundations of this benchmarking analysis were built in the context of a research collaboration with all of the English Regional Development Agencies, where Local Futures developed a regional model of the knowledge economy called “regional economic architecture”. We subsequently carried out this analysis for Scotland under year one of the ERKE programme. The results of this work were published by the DTI in a report entitled “A Regional Perspective on the Knowledge Economy in Britain”. The report influenced the Innovation Report (2003) and the 21st Century Skills White Paper.
The DTI has commissioned Local Futures to up-date and extend its analysis as part of a major project on skills, economic development and the knowledge economy. It is particularly interested in a benchmarking methodology that covers the planning, infrastructure, enterprise

Benchmarking the Knowledge Economy – the Local futures Approach
the local futures group
25
‘building blocks’ identified in the Innovation Report as key to a successful knowledge economy, as well as a local and sub-regional breakdown of the regional knowledge economy. This project is currently underway and is due to report in September 2004.
Under what we call the Knowledge Economy Audit, the Local Futures benchmarking approach consists of the following analyses
Economic architecture analysis – applying the REA model (see below) at different levels to obtain a geographical overview of the knowledge economy in Scotland
Competitiveness analysis – assessment of knowledge-intensive industries, skills and education, enterprise, connectivity and quality of life, again at different levels.
The ‘architecture’ and competitiveness analysis generate discrete sets of ‘knowledge economy’ benchmark indicators that we use to measure the relative performance of all sub-regions and districts within Scotland and nationally. The analysis enables us to examine the geography of competitiveness and inclusion at different levels. For purposes of clarity, the analysis in this report has used a sub-set of the indicators available through the ‘architecture’ and competitiveness analysis. We have selected only the most important indicators to clearly and concisely illustrate the key issues for the geography of the Scottish knowledge economy.
The Audit also includes an Issue Analysis depending on the needs of individual Local Futures clients. We include this analysis as part of Chapter 4 and link the issues to the results of the stakeholder research in Chapter 5.
3.2 The Economic Architecture Analysis
The ‘economic architecture’ (EA) is a descriptive and static model of the knowledge economy using employment and skills building blocks. Chart 3.1 shows the results of applying a reduced form of the economic architecture (the level of analysis used here) for Scotland, by way of illustration.
Chart 3.1 - Economic Architecture for Scotland, 2001
The ‘architecture’ is basically a theorised layout of three sets of benchmark indicators covering the overall economic performance of the region, the knowledge-intensity of its industries and the skills or qualifications profile of its workforce. How well the region performs is assessed against the national average: a blue box indicates that the region’s score for that particular indicator falls within 10% of the national average, while the green and red boxes indicate that the region is performing 10% above and 10% below the average. The ideal way

Benchmarking the Knowledge Economy – the Local futures Approach
the local futures group
26
to read the EA model is to look at the overall colour pattern and compare and contrast the employment and skills profiles (left versus right hand side) of the knowledge economy.
The twin aims of regional economic strategy are assumed to be a high level of average earnings and a high employment rate – how Scotland performs on these headline indicators is shown in the top two boxes of the EA
The knowledge intensity of economic activity in Scotland is indicated by the proportion of graduates in the workforce as a proxy indicator – the boxes show the proportion of total employment in high knowledge-intensity sectors (K1 industries) to low knowledge-intensity sectors (K4 industries), the second row focusing on the private sector or business knowledge economy - please see Chart 3.2 below for the Scotland classification of K industries.
The skills profile of the working age population in Scotland is represented by the four boxes on the right hand side of the EA, the boxes respectively showing the proportion of this population that possesses NVQ/SVQ 4/5 to NVQ/SVQ1/0 qualifications – please see Chart 3.3 for a detailed breakdown of qualifications and the broad types of occupations that correspond to these qualifications levels. The NVQ and SVQ designations are based on the same standards and represent equivalent qualifications in Scotland, England, Wales and Northern Ireland. The main differences between SVQs and NVQs is that SVQs take account of Scotland’s distinct legal, education and enterprise systems (SVQs – a User’s Guide, Scottish Qualifications Authority, 2002).
The results of the EA are presented for the sub-regions of Scotland and Britain as a whole. By applying the EA at the district level, we look at the local geography of the knowledge economy, differentiating between rural and urban districts. For benchmarking purposes, we use the EA indicators in three ways:
Firstly, we keep the EA intact in order to provide an overview of the structural characteristics of the knowledge economy
Secondly, we use the proportion of VAT registered businesses and employment accounted for by higher knowledge intensity K1 and K2 sectors jointly as one of our main indicators of economic competitiveness
Thirdly, we create a Human Capital Index for economies by using a weighted average of the NVQ/SVQ qualifications possessed by the resident working age population
Chart 3.2 Higher Education ‘K’ Classification of the Knowledge Economy in the Economic Architecture for SCOTLAND, 2001
The EA uses the ‘high education sector’ system of classifying industries and employment, as a basis for analysing the development of the knowledge economy – see EC publication Employment in Europe 2000. The main benchmark indicator is the proportion of graduates in the workforce as a proxy measure of the knowledge intensity of sectors and economies. In applying the EA analysis to the UK regions, we used regional ‘K classifications’ and changed the thresholds to allow for differences in economic specialisation. Thus the K classification varies for each of the 11 British regions.
Scotland’s groupings of K1 to K4 sectors (SIC 1992 classification)
• K1 sectors, where at least 40% of the workforce has a degree or equivalent: oil, gas and extraction; air transport;
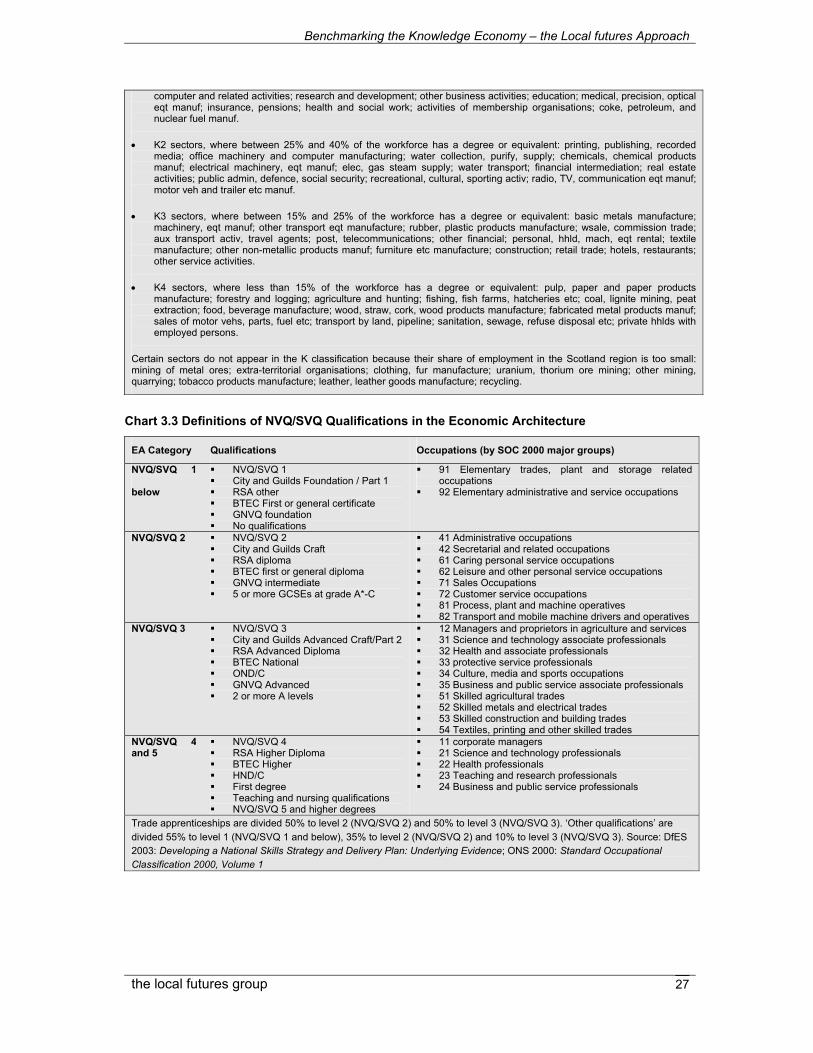
Benchmarking the Knowledge Economy – the Local futures Approach
the local futures group
27
computer and related activities; research and development; other business activities; education; medical, precision, optical eqt manuf; insurance, pensions; health and social work; activities of membership organisations; coke, petroleum, and nuclear fuel manuf.
• K2 sectors, where between 25% and 40% of the workforce has a degree or equivalent: printing, publishing, recorded media; office machinery and computer manufacturing; water collection, purify, supply; chemicals, chemical products manuf; electrical machinery, eqt manuf; elec, gas steam supply; water transport; financial intermediation; real estate activities; public admin, defence, social security; recreational, cultural, sporting activ; radio, TV, communication eqt manuf; motor veh and trailer etc manuf.
• K3 sectors, where between 15% and 25% of the workforce has a degree or equivalent: basic metals manufacture; machinery, eqt manuf; other transport eqt manufacture; rubber, plastic products manufacture; wsale, commission trade; aux transport activ, travel agents; post, telecommunications; other financial; personal, hhld, mach, eqt rental; textile manufacture; other non-metallic products manuf; furniture etc manufacture; construction; retail trade; hotels, restaurants; other service activities.
• K4 sectors, where less than 15% of the workforce has a degree or equivalent: pulp, paper and paper products manufacture; forestry and logging; agriculture and hunting; fishing, fish farms, hatcheries etc; coal, lignite mining, peat extraction; food, beverage manufacture; wood, straw, cork, wood products manufacture; fabricated metal products manuf; sales of motor vehs, parts, fuel etc; transport by land, pipeline; sanitation, sewage, refuse disposal etc; private hhlds with employed persons.
Certain sectors do not appear in the K classification because their share of employment in the Scotland region is too small: mining of metal ores; extra-territorial organisations; clothing, fur manufacture; uranium, thorium ore mining; other mining, quarrying; tobacco products manufacture; leather, leather goods manufacture; recycling.
Chart 3.3 Definitions of NVQ/SVQ Qualifications in the Economic Architecture
EA Category Qualifications Occupations (by SOC 2000 major groups)
NVQ/SVQ 1
below
NVQ/SVQ 1 City and Guilds Foundation / Part 1 RSA other BTEC First or general certificate GNVQ foundation No qualifications
91 Elementary trades, plant and storage related occupations
92 Elementary administrative and service occupations
NVQ/SVQ 2 NVQ/SVQ 2 City and Guilds Craft RSA diploma BTEC first or general diploma GNVQ intermediate 5 or more GCSEs at grade A*-C
41 Administrative occupations 42 Secretarial and related occupations 61 Caring personal service occupations 62 Leisure and other personal service occupations 71 Sales Occupations 72 Customer service occupations 81 Process, plant and machine operatives 82 Transport and mobile machine drivers and operatives
NVQ/SVQ 3 NVQ/SVQ 3 City and Guilds Advanced Craft/Part 2 RSA Advanced Diploma BTEC National OND/C GNVQ Advanced 2 or more A levels
12 Managers and proprietors in agriculture and services 31 Science and technology associate professionals 32 Health and associate professionals 33 protective service professionals 34 Culture, media and sports occupations 35 Business and public service associate professionals 51 Skilled agricultural trades 52 Skilled metals and electrical trades 53 Skilled construction and building trades 54 Textiles, printing and other skilled trades
NVQ/SVQ 4 and 5
NVQ/SVQ 4 RSA Higher Diploma BTEC Higher HND/C First degree Teaching and nursing qualifications NVQ/SVQ 5 and higher degrees
11 corporate managers 21 Science and technology professionals 22 Health professionals 23 Teaching and research professionals 24 Business and public service professionals
Trade apprenticeships are divided 50% to level 2 (NVQ/SVQ 2) and 50% to level 3 (NVQ/SVQ 3). ‘Other qualifications’ are divided 55% to level 1 (NVQ/SVQ 1 and below), 35% to level 2 (NVQ/SVQ 2) and 10% to level 3 (NVQ/SVQ 3). Source: DfES 2003: Developing a National Skills Strategy and Delivery Plan: Underlying Evidence; ONS 2000: Standard Occupational Classification 2000, Volume 1
Benchmarking the Knowledge Economy – the Local futures Approach
the local futures group
28
3.3 The Competitiveness Analysis
In Chapter 2, we outlined the scope of the knowledge economy in terms of policy domains – see the discussion on the ‘building blocks of innovation’ that define the Government’s present approach.
Basically, these policy domains are supported by theoretical and empirical research on the dynamics of the knowledge economy. What are the competitiveness factors that influence patterns of growth, specialisation and the geography of the knowledge economy – at the international level or sub-national level?
Although all of the competitiveness factors discussed in Chapter 2 impact on local and regional economies – and rural and urban districts – policy leverage and control over these factors is obviously subject to the constraints set by global market forces and centralised systems of UK and EC economic regulation. That is to say, there are clear and obvious limits as to what local and regional and even national economic development actors can realistically aim to accomplish.
Thus, across a range of knowledge economy policy fields, we tend to distinguish between policy and delivery – for example, the Government’s skills policy is mostly national (the White Paper), partly regional (the work of the Regional Skills Partnerships) and local to only a limited degree – though its delivery is mainly local and sub-regional. Competition and regulation in product and service markets – for example, broadband, intellectual property and international trade – are central government and EC policy levers. In other words, the policy levers and competitiveness factors of the knowledge economy – right across Britain, and rural and urban areas – operate at different levels. The globalisation debate centres on the economic sovereignty of nation states – and for geographers and sustainable development theorists, the countervailing scenario of city-regions and localised patterns of economic development.
Data constraints, particularly for local and sub-regional analysis, impose limits on what drivers we can look at. For example, there is a data vacuum when it comes to examining innovation trends at the sub-national level, and export-import data for local and regional economies is especially poor. Having said this, we have assembled a coherent and valuable set of indicators for benchmarking some of the main competitiveness factors of the knowledge economy at the local, sub-regional and regional levels – across rural and urban England and Scotland. Below we briefly look at each set of factors in turn.
1) Knowledge-Intensive Industries
We begin with the presence of ‘knowledge-driven industries’ in the local, sub-regional or regional economy. The OECD and EC define these sectors as being market/brand-driven and/or technology-driven – they match closely with the K1 and K2 sectors used in the REA, which rest on ‘higher education’ definitions. We also distinguish between production and services in our examination of these ‘knowledge-intensive sectors’:

Benchmarking the Knowledge Economy – the Local futures Approach
the local futures group
29
Knowledge-based production: aerospace, electrical machinery and optical equipment, printing, publishing and recorded media, chemicals and energy
Knowledge-based services: telecommunications, computer and related services, R&D, finance and business services, air transport services and recreational and cultural services
Basically, local and regional economies are interpreted as being more or less competitive according to the employment shares of these ‘knowledge-intensive sectors’, how these shares compare against regional and national averages and also how they increase or decrease over time.
Reflecting their need for high level of professional, managerial and technical expertise, a large part of public service activity is actually highly knowledge-intensive – education, health, public administration and so on employ large numbers of graduates, and appear consistently as K1 and K2 sectors in the REA schema for all regions. Importantly, in areas where business knowledge economy drivers are relatively weak, we find that the public sector is the major driver of the local knowledge economy. Therefore, we highlight the public sector separately. We also do the same for creative industries – which span production and service sectors – because of their special role in the shaping of a new economic culture which impacts on consumption patterns (more sophisticated products).
The Knowledge-Intensity of the Economy
% Share of total employment in knowledge-driven services (private sector)
% Share of total employment in knowledge-driven production (private sector)
% Share of total employment in both types of knowledge-driven sectors
% Share of total employment in the public sector
% Share of total employment in creative industries
%Change in employment in knowledge-driven sectors (private sector)
Presence of university research departments
Presence of ‘clusters’ in the economy (using DTI definitions and regional location quotients)
2) A Highly Skilled and Educated Workforce
It is widely recognised that a highly skilled and educated workforce is essential to local, regional and national competitiveness in a modern knowledge economy, particularly in the context of globalisation and the challenges presented by China and India. Thus, the quality of the education, lifelong learning and workplace-based training infrastructure is a major driver of the knowledge economy – in business and public services. Further, access to learning and training opportunities – and how well individuals perform – is a driver behind social exclusion or inclusion in a modern knowledge economy.
Thus, the Government’s skills strategy addresses wider access to HE, lifelong learning, raising schools standards and staying-on rates, etc – alongside schemes for improving basic skills in more deprived ‘learning communities’. For the Drivers Analysis, we have created a varied set of skills and learning benchmark indicators as shown in the box below:

Benchmarking the Knowledge Economy – the Local futures Approach
the local futures group
30
Skills and Learning Indicators
Human capital index for the working age population
Ability to attract the mobile and economically active (in-migration of 20-44 year olds)
GCSEs achievement
Successful applicants to universities
Quality of the local education system
Ability to attract graduates to live and work
3) A Dynamic Enterprise Culture that fosters small business to start, grow and innovate
Championed by Chancellor Gordon Brown and the Treasury, the Government has made the creation of a ‘new enterprise culture’ a cornerstone of its economic policies – and its knowledge economy agenda. Entrepreneurship in all sectors and parts of Britain is being heavily promoted, with local authorities and regional development agencies being given new incentives to drive start-ups and improve the quality and development of the local small business stock more generally.
Improving the knowledge base of enterprise – particularly in low-value services and production sectors – is now an important focus of business support services and also supply chain and cluster strategies. Building knowledge bases across the local and regional economy involves management development, marketing and logistics services and product and process innovation, including migrating small firms up the skills ladder. Promoting entrepreneurship is emerging as a major theme in schools. Thus, we include enterprise and business support infrastructure here.
The third set of knowledge economy drivers, therefore, covers business and entrepreneurship, with the following indicators being used to measure local, sub-regional and regional performance.
Enterprise
Size of the business base
Business start-up rates
Business survival rates
Presence of entrepreneurs
Share of businesses in knowledge-driven sectors
Average business size
Dynamism in the business base
Public sector support to grow and develop businesses
Presence of business services and communications firms
Employment in industries that generate knowledge

Benchmarking the Knowledge Economy – the Local futures Approach
the local futures group
31
4) Connectivity to Knowledge Economy Nodes
The knowledge economy moves on ‘wheels and wires’ – transport networks and telecommunications networks. Sub-national and local authority level data on accessibility to Britain’s telecommunications networks – for voice, data and image transmission – are simply not available. Therefore, we concentrate on the degree to which places are connected with the rest of the UK economy, and international markets.
Even in the so-called ‘weightless economy’ or ‘information age’, geography matters considerably – because knowledge is embodied in physical goods and a great deal of economically valuable knowledge is actually exchanged informally (tacit knowledge) in the context of trust and loyalty relationships. Indeed, the ‘information revolution’ has increased the premium on knowledge – who and what you know counts!
Thus, physical access to the main centres and gateways of the knowledge economy are important drivers of growth and competitiveness – for business travel, Heathrow matters more than Gatwick, for example; for marketing and advertising or major financial deals, ‘all roads lead to London’.
In this analysis, we measure several aspects of an area’s connectivity based on its location in different modes of transportation:
Travel times by road to major commercial and business centres of the knowledge economy – dominant regional cities and the City of London
Travel times to the main knowledge economy ‘gateways’ – Heathrow and other international airports, as well as the national rail network
In addition to individual measures, we create a composite Connectivity Index for the knowledge economy for local and sub-regional analysis.
Connectivity
Travel time to the nearest international airport, by road
Travel time to Heathrow Airport, by road
Travel time to nearest city as a ‘knowledge economy’ centre, by road
Travel time to the City of London, by road
Connectivity to the national rail network
Connectivity Index – composite score based on the above indicators
5) Quality of Life
A successful knowledge economy will, through its impacts on productivity and job quality, deliver a high standard of living and material prosperity. However, the geography of knowledge economy activity – employment and business centres – tends not to coincide with the geography of where its principal beneficiaries or ‘knowledge workers’ actually live. Local Futures has drawn attention to the fact that ‘knowledge workers’ make up the bulk of today’s

Benchmarking the Knowledge Economy – the Local futures Approach
the local futures group
32
commuter population. Metropolitan sprawl around the big cities, especially London, is a feature of the modern knowledge economy. (Knowledge workers refer to people working in managerial, professional and scientific and technical occupations.)
There are a number of profound implications of these patterns of ‘sprawl’ in the knowledge economy. First, accessible rural areas are developing business knowledge economies in their own right. Second, there are high levels of skills poverty – or ‘social exclusion in the knowledge economy’ – in all of Britain’s cities (as much as 40% of the urban working age population in Nottingham, Birmingham and Glasgow, for example, lacks basic qualifications). Thus, the quality of life in urban and rural areas is changing, this being reflected in house price affordability, migration, services and amenities and so on.
Research shows that ‘knowledge workers’ are attracted to the main centres of the knowledge economy because of their relative abundance of career and business opportunities and their exceptional cultural and environmental assets. Thus, cities offering global knowledge industries and a rich cultural environment – and urban and rural areas connected closely with these cities – are seen by researchers as the most competitive areas of the modern economy. They are magnets for ‘talent’ in the knowledge economy.
Quality of Life
Availability of basic services (derived from the IMD)
Housing affordability
Quality of the housing stock
Availability of child care
Quality of the physical environment
Access to cultural amenities
The results of the competitiveness analysis are presented in the form of tables and maps showing how local and sub-regional areas perform as knowledge economies measured by their relative scores on the groups of indicators we have listed above. Performance is assessed against national and regional averages.
Finally, we use ‘report cards’ to show how areas perform as knowledge economies on multiple combinations of indicators and to summarise the results in a way that shows ‘at a glance’ how areas stand nationally.

The Geography of the Knowledge Economy in Scotland
the local futures group
33
4 The Geography of the Knowledge Economy in Scotland
4.1 Introduction
This chapter presents the results of applying Local Futures methodology for benchmarking the development of the knowledge economy in Scotland, at the regional, sub-regional and local levels.
We begin with the ‘Architecture’ analysis, which gives us an overview of the main structural features of the Scottish knowledge economy as seen from an employment and skills perspective. Next, we examine some key dimensions of competitiveness in the knowledge economy, benchmarking Scotland’s local economies against British national standards. Finally, the analysis concentrates on two specific aspects of the geography of the knowledge economy as follows:
How well are urban and rural areas of Scotland performing as knowledge economies in a national context?
To what extent are Scottish cities ‘engines’ of regional growth in the knowledge economy?
4.2 The Architecture Analysis
As discussed in Chapter 2, a successful knowledge economy should deliver high earnings levels – a shift towards higher value good and services as a result of their rising knowledge-intensity – and also full employment, measured by the employment rate. Chart 4.1 shows how Scotland rated against other regions of Great Britain in 2002/03:
Scotland, along with the North and Midlands of England, lags well behind Greater London and the South East and East of England on average earnings – the Government’s PSA (Public Service Agreement) target is actually to close the growth/productivity gap between these three ‘leading regions’ and the rest of Britain
Scotland’s employment rate is also disappointing by national standards – it is below the national average and very much lower than southern England (London scores poorly on full employment)
These headline figures clearly indicate that the knowledge economy in Scotland is simply lagging behind in terms of productivity, competitiveness and employment. Let us now look at the results of the ‘Architecture’ analysis to obtain some insights into the structural causes of this modest performance as a knowledge economy.

The Geography of the Knowledge Economy in Scotland
the local futures group
34
Chart 4.1: Earnings and Employment in Great Britain, by Region
Source: The Local Futures Group, derived from ONS (earnings 2003, employment rate 2002)
Chart 4.2 shows how Scotland’s knowledge economy ‘architecture’ compares against other British regions and the national average. The main points to note are as follows:
Scotland compares extremely favourably with the powerful South East knowledge economy on K1 sector employment, depending more on the public sector; in this respect, Scotland is far more competitive than the North and Midlands regions, the latter represented here by the North West.
Less favourably, one in two private sector jobs in Scotland are concentrated in the relatively low knowledge intensity K3 sector – compared to a one in four figure for the North West, or one in seven figure for the South East. The bulk of Scotland’s K3 jobs are concentrated in retail and hotels and restaurant services, which are closely linked to tourism, and the construction industry.
Scotland’s skills profile resembles that of the South East and is far more favourable than the North West – it has a relatively large graduate labour pool and less serious ‘skills poverty’ problem
Thus, Scotland’s policy makers have to critically examine the nation-region’s business base in building a successful knowledge economy. Presently, Scotland’s problems appear not to lie with average skills or the public sector, but with its apparent dependence and growth bias towards consumer and tourism related services. This type of low value services bias combined with the domestic orientation of a large public services sector does not create
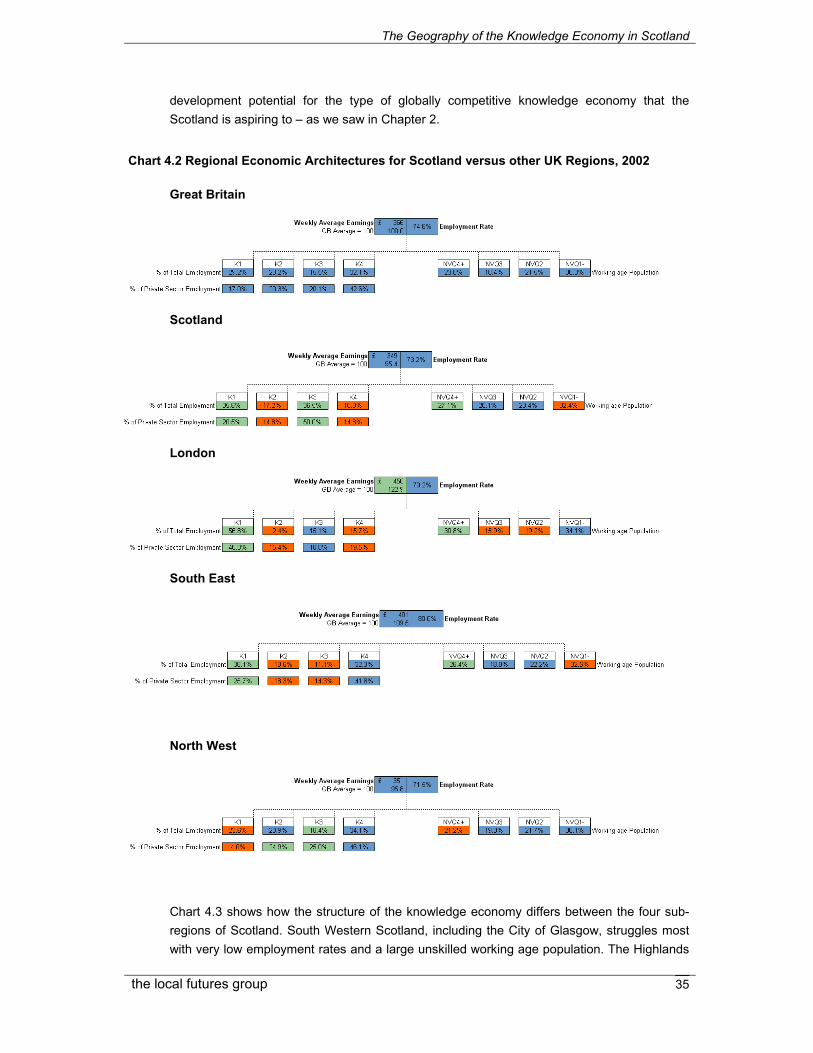
The Geography of the Knowledge Economy in Scotland
the local futures group
35
development potential for the type of globally competitive knowledge economy that the Scotland is aspiring to – as we saw in Chapter 2.
Chart 4.2 Regional Economic Architectures for Scotland versus other UK Regions, 2002
Great Britain
Scotland
London
South East
North West
Chart 4.3 shows how the structure of the knowledge economy differs between the four sub-regions of Scotland. South Western Scotland, including the City of Glasgow, struggles most with very low employment rates and a large unskilled working age population. The Highlands

The Geography of the Knowledge Economy in Scotland
the local futures group
36
and Islands, with high self-employment levels, is characterised by very low earnings levels and is more dependent on the K3 sectors than the rest of Scotland. North Eastern Scotland, dominated by Aberdeen’s resource-based knowledge economy, has a very strong business knowledge economy. The public sector drivers of the knowledge economy – in terms of job-generation – are relatively important in Eastern Scotland (including the capital, Edinburgh) and South Western Scotland (including Glasgow, where Scottish Enterprise is headquartered, for instance).
Chart 4.3 The Sub-Regional Economic Architectures, 2002
Eastern Scotland
Highlands and Islands
North Eastern Scotland
South Western Scotland
We can create a more detailed picture of the geography of Scotland’s knowledge economy – at the local authority area (Chart 4.4) and travel-to-work area (TTWA) and LEC levels (Chart 4.5). As the first of these charts show, there is a clear ‘north-south divide’ in Britain’s business knowledge economy, and a general pattern of urban and metropolitan dominance. In Scotland, we can see that Aberdeen and Edinburgh are highly competitive by national standards, with Glasgow appearing as a relatively significant knowledge economy centre.

The Geography of the Knowledge Economy in Scotland
the local futures group
37
Chart 4.4 Proportion of Business Knowledge Economy Jobs in Knowledge-Intensive Sectors (K1 + K2), by local authority area, 2001
Source: Local Futures, derived from ONS data
The maps in Chart 4.5 clearly show that the LECs are working in very different knowledge economy contexts, across urban and rural Scotland. Hence priorities and leverage are certain to vary through the LEC network, underlining the need for a geography-based approach to Scottish Enterprise’s knowledge economy strategies. The TTWA map reveals the spheres of influence around each of the main knowledge economy centres, a geographical pattern that we take up again later in this chapter’s analysis.
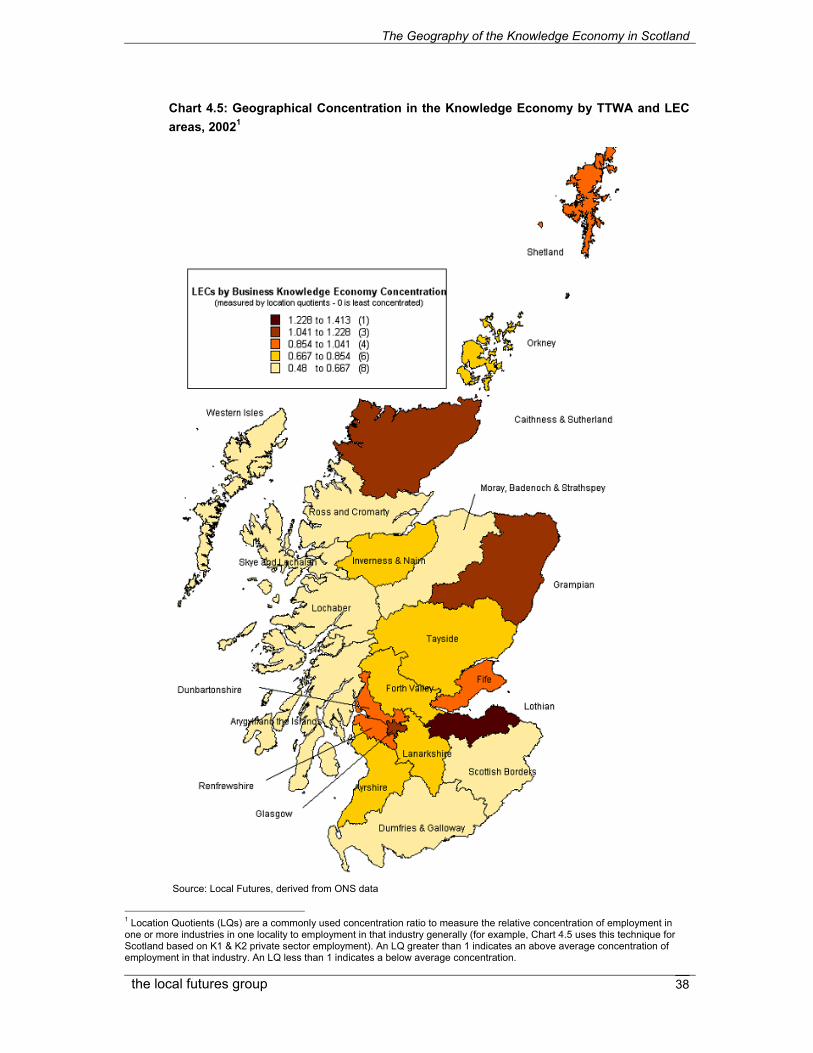
The Geography of the Knowledge Economy in Scotland
the local futures group
38
Chart 4.5: Geographical Concentration in the Knowledge Economy by TTWA and LEC areas, 20021
1 Location Quotients (LQs) are a commonly used concentration ratio to measure the relative concentration of employment in one or more industries in one locality to employment in that industry generally (for example, Chart 4.5 uses this technique for Scotland based on K1 & K2 private sector employment). An LQ greater than 1 indicates an above average concentration of employment in that industry. An LQ less than 1 indicates a below average concentration.
Source: Local Futures, derived from ONS data

The Geography of the Knowledge Economy in Scotland
the local futures group
39
Chart 4.5 continued
Source: Local Futures, derived from ONS data
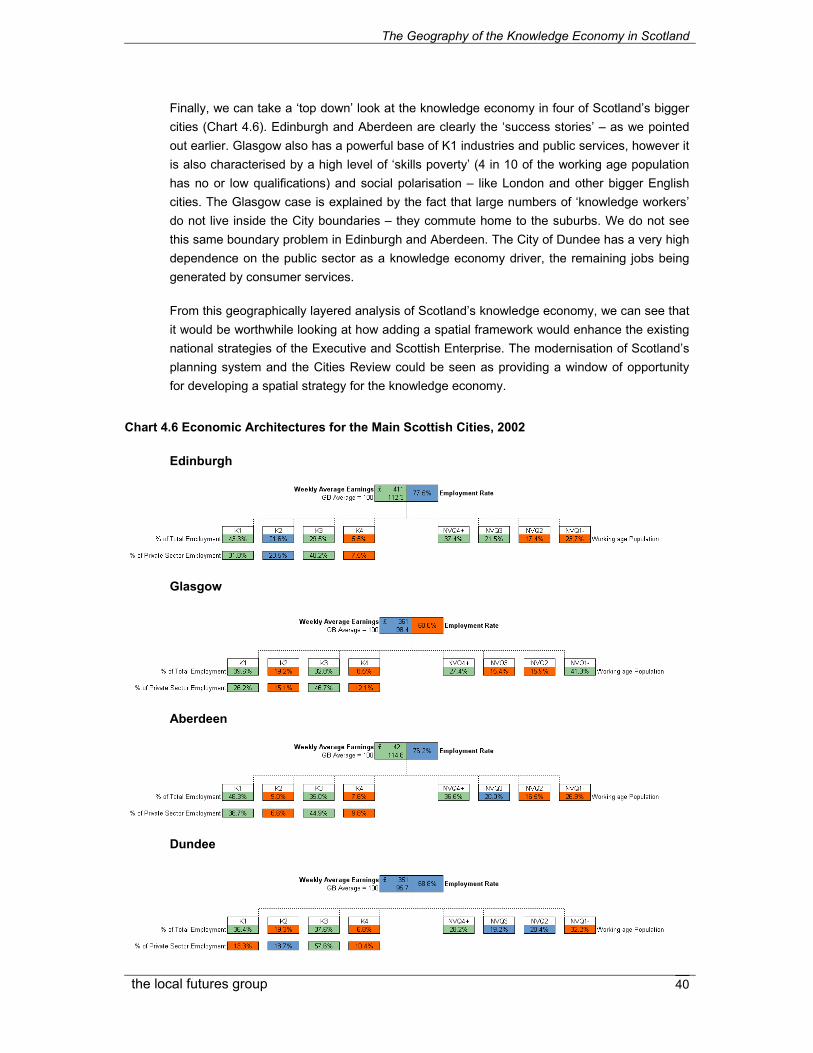
The Geography of the Knowledge Economy in Scotland
the local futures group
40
Finally, we can take a ‘top down’ look at the knowledge economy in four of Scotland’s bigger cities (Chart 4.6). Edinburgh and Aberdeen are clearly the ‘success stories’ – as we pointed out earlier. Glasgow also has a powerful base of K1 industries and public services, however it is also characterised by a high level of ‘skills poverty’ (4 in 10 of the working age population has no or low qualifications) and social polarisation – like London and other bigger English cities. The Glasgow case is explained by the fact that large numbers of ‘knowledge workers’ do not live inside the City boundaries – they commute home to the suburbs. We do not see this same boundary problem in Edinburgh and Aberdeen. The City of Dundee has a very high dependence on the public sector as a knowledge economy driver, the remaining jobs being generated by consumer services.
From this geographically layered analysis of Scotland’s knowledge economy, we can see that it would be worthwhile looking at how adding a spatial framework would enhance the existing national strategies of the Executive and Scottish Enterprise. The modernisation of Scotland’s planning system and the Cities Review could be seen as providing a window of opportunity for developing a spatial strategy for the knowledge economy.
Chart 4.6 Economic Architectures for the Main Scottish Cities, 2002
Edinburgh
Glasgow
Aberdeen
Dundee

The Geography of the Knowledge Economy in Scotland
the local futures group
41
4.3 The Competitiveness Analysis
In Chapter 3 we described our methodology for evaluating local competitiveness in the knowledge economy (see Section 3.3). The following discussion of results is selective in the interest of clarity.
4.3.1 Knowledge Intensive Sectors
From the map in Chart 4.7, we can see that most areas of Scotland are experiencing a shift towards knowledge-driven economic development, in terms of employment change between 1998 and 2002. The Highlands and Islands Enterprise will be encouraged by these recent growth trends in light of its goal of building a knowledge economy – from a low starting base. In terms of city knowledge economies, Edinburgh and Glasgow outpaced Aberdeen and Dundee. We see a more disappointing picture of economic change south of the ‘Central Belt’, where the Borders, Dumfries and Galloway and South Ayrshire have lost ground and face uncertain futures as competitive knowledge economies.
The importance of the public sector as an economic actor in its own right has been overlooked in UK and Scottish policies for the knowledge economy. Chart 4.8 clearly demonstrates why leaving the public sector ‘out of the knowledge economy equation’ leads to a false economics of Scotland. The reality is that in most parts of Scotland the public sector generates at least 40% of employment in knowledge-intensive sectors (K1 and K2), the average figure for Britain as a whole being around 50%.
Scotland’s ‘nation region’ governance status, consolidated by devolution, accounts for this strong public sector base in the knowledge economy – made up of universities and schools, hospitals and community care facilities, public administration and various parts of government and so on. With the exception of London (where the knowledge economy rests on two legs, the City and the Public Sector), no other region of England benefits from this strong, diversified, higher order base of knowledge-intensive public services. At the time of writing, all English regions are competing as locations for Government Offices being decentralised out of London, following the Lyons Review. There are, however, big economic issues surrounding the public sector of the knowledge economy – in areas where the public sector makes up 60 per cent or more (say) of higher quality job creation, the implication is that business drivers are weak and economic competitiveness is relatively low and uncertain given the external pressures of globalisation.

The Geography of the Knowledge Economy in Scotland
the local futures group
42
Chart 4.7: Change in Employment in Knowledge-Driven Sectors, 1998 - 2002
Source: The Local Futures Group, derived from ONS data

The Geography of the Knowledge Economy in Scotland
the local futures group
43
Chart 4.8 The Proportion of Knowledge-Intensive Sector (K1 and K2) Employment in the Public Sector, 2002
Source: The Local Futures Group, derived from ONS data

The Geography of the Knowledge Economy in Scotland
the local futures group
44
4.3.2 Human Capital
On average Scotland has a more highly skilled and educated workforce than the rest of Britain – see Chart 4.9. South Western Scotland, and the City of Glasgow most notably under-perform on the Human Capital Index2 – yet still keep up with the British average. The picture for schools performance is also very encouraging – Scotland clearly is superior on average to the rest of Britain, with the Cities of Glasgow and Dundee keeping up with the British average. Therefore, in general terms – and we should stress that this analysis does not reveal specific skills and occupational deficits – Scotland is competitive in terms of skills and education.
Chart 4.9 Skills, Education and Net Migration
Scotland lags behind the rest of Britain on new inward migration, especially from within the UK – only Edinburgh appears to be a strong ‘magnet’ for migrants and the skills they potentially bring with them. The obvious issue is: is there a perception among economic migrants that Scotland is only for ‘the Scottish’ and a retirement or life style destination for people with Scottish ancestry? Or, is it simply the case that Scotland’s knowledge economy is not perceived to be powerful enough as a generator of enterprise and job opportunities?
2 The Human Capital Index (HCI) is a weighted average NVQ/SVQ for an area. This indicator shows the average qualification of the working age in an area, by first calculating the proportion of people qualified at each NVQ/SVQ level, and then weighted each proportion as follows; below NVQ/SVQ2 [unweighted], NVQ/SVQ2*2, NVQ/SVQ3*3, NVQ/SVQ4*4. See Annex A.5 for further detail.
Hum
an C
apita
l Ind
ex
2001
/200
2
% o
f 15
year
old
s ac
hiev
ing
5 or
mor
e G
CSE
s G
rade
s A
*-C
, 20
02
% o
f res
iden
ts m
oved
in
to th
e ar
ea fr
om w
ithin
th
e U
K, 2
001
% o
f res
iden
ts m
oved
in
to th
e ar
ea fr
om
outs
ide
the
UK
, 200
1
Aberdeen 2.66 59.35 4.13 1.33Dundee 2.43 47.96 3.52 0.73Edinburgh 2.73 61.60 4.89 1.71Glasgow 2.29 51.25 3.42 0.86
Eastern Scotland 2.50 58.54 3.54 0.52Highlands and Islands 2.45 68.31 3.09 0.38North Eastern Scotland 2.55 65.56 3.90 0.76South Western Scotland 2.32 58.78 2.60 0.29
Scotland Average 2.42 60.08 3.15 0.43Great Britain Average 2.29 51.76 4.48 0.64Urban GB Average 2.28 49.66 4.37 0.73Source: The Local Futures Group, derived from ONS and GRO data* Note: Sub-regional figures are calculated as averages of the districts. Migration from the rest of the UK into Scottish districts includes migration from the rest of Scotland.

The Geography of the Knowledge Economy in Scotland
the local futures group
45
These are important questions that Scottish Enterprise needs to address, given that the knowledge economy is powered by human capital.
Another group that Scottish cities must attract to remain competitive is graduates. Chart 4.10 summarises data from a HESA survey on where graduates go to work upon completing their degree. Both Edinburgh and Glasgow rank in the top 10 of 141 Counties, Metropolitan Counties and Unitary Authorities across Great Britain in terms of the impact of graduates on the local economy. Dundee ranks a very respectable 17th, while Aberdeen City ranks 125th.
Chart 4.10: Attraction of Graduates to work in 141 local areas in Great Britain
Source: The Local Futures Group, Higher Education Statistics Agency
Skills poverty significantly constrains efforts to increase the knowledge-intensity of the business base. While we saw that Scotland has a very good overall human capital profile, the distribution of high skills is uneven across the country. Chart 4.11 illustrates the unevenness of skills poverty by mapping the distribution of a weighted average of NVQ/SVQ (and NVQ/SVQ equivalent) attainment (the annex contains enlarged maps for each of the 4 sub-regions). Concentrations of highly skilled people exist in Aberdeen, Stirling, Perth and Kinross and Edinburgh, as well as East Renfrewshire and West Dunbartonshire outside Glasgow. However, many areas in and around Glasgow and Edinburgh suffer skills poverty equal or greater than that seen in remote rural areas.
Graduates attracted/retained for paid employment as a % of the population, 2002
0.00%
0.10%
0.20%
0.30%
0.40%
0.50%
0.60%
0.70%
141 Counties and Metropolitan Counties
Bristol (11)
Nottingham (1)
Gt. London (19)
Cardiff (4)
Newcastle (26)
Edinburgh (8)
Glasgow (10)
Gt. Manchester (37)Gt. Merseyside (46)
West Yorkshire (32)
South Yorkshire (51)West Midlands (49)
Dundee City (17)
Aberdeen City (125)

The Geography of the Knowledge Economy in Scotland
the local futures group
46
Chart 4.11: The Geography of Skills in Scotland, 2002
Source: Local Futures, derived from ONS data
Urban ‘skills poverty’ in Scotland is especially important if the knowledge economy continues to be concentrated and centralised in the city-regions. As the business base becomes more knowledge intensive less people will have the appropriate skills and qualifications to participate – causing Scotland’s already low employment rates to plummet further. The skills agenda is therefore a vital one both to enable the development and growth of the knowledge economy as well as to ensure that development is socially inclusive.

The Geography of the Knowledge Economy in Scotland
the local futures group
47
4.3.3 Enterprise
Scotland’s policy-makers have been acutely aware of the country’s poor record on enterprise development – the rationale for launching a Business Birth Rate Strategy. The third column in Chart 4.12 underlines this real policy concern, since it relates to the businesses that have successfully crossed the VAT turnover threshold. Hence, while recent start up rates3 are comparable to the British average, the small business dynamic of Scotland’s knowledge economy is weak. The glaring exception to this is Edinburgh’s phenomenal success on enterprise, supported by its favourable private business service environment.
Chart 4.12: Enterprise and Business Services
Source: The Local Futures Group, derived from ONS, DTI and the Audit Commission * Note: The sub-regional figure is calculated as an average of the aggregated district values within the sub-region. See Annex A.5 for further detail.
Chart 4.12 also looks at the institutions that support businesses by creating and disseminating knowledge that drives a successful knowledge economy. Research departments are one source of new knowledge that can spin out into industry, and Dundee, Edinburgh and Glasgow all benefit from close proximity to a relatively large number of university departments. Research and knowledge creators in the business sector include private research labs, consultancies and market research companies. Again, in this category Edinburgh far outperforms Glasgow, and is closely followed by Aberdeen. Apart from knowledge creators, communications and business services firms (anything from couriers to IT firms to accountants) are important to support knowledge-intensive firms and encourage knowledge dissemination – and once again Edinburgh and Aberdeen lead on this driver.
3 Business Formation Rate is calculated using the percentage of businesses that have registered for VAT within the last year. This data is derived from annual workplace estimates based on the Inter Departmental Business Register (IDBR).
Bus
ines
s fo
rmat
ion
rate
s, 2
002
New
bus
ines
s su
rviv
al ra
te (3
6 m
onth
s fr
om 1
998)
Cha
nge
in to
tal V
AT
regi
ster
ed
busi
ness
sto
ck, 1
994-
2003
Prox
imity
to (n
umbe
r of)
rese
arch
dep
artm
ents
, 200
1*
% o
f em
ploy
men
t in
R&
D,
cons
ultin
g, p
ollin
g an
d m
arke
t re
sear
ch, 2
002
Con
cent
ratio
n of
Bus
ines
s an
d C
omm
unic
atio
n Se
rvic
es a
s %
of
tota
l em
ploy
men
t, 20
01
Aberdeen 10.14 68.51 2.38 50 1.53 20.80Dundee 9.96 63.58 3.36 129 0.69 8.90Edinburgh 10.44 60.53 15.48 145 1.85 20.60Glasgow 11.94 53.56 1.79 111 0.96 17.90
Eastern Scotland 9.21 62.53 6.72 126 1.36 n/aHighlands and Islands 6.51 75.94 -3.29 2 0.77 n/aNorth Eastern Scotland 7.24 69.29 -2.39 42 1.14 n/aSouth Western Scotland 10.03 60.57 1.67 88 0.77 n/a
Scotland 10.03 64.53 2.20 84 1.04 13.60Great Britain Average 9.70 65.07 8.02 41 1.39 15.20Urban GB Average 10.57 63.82 8.74 49 1.33 16.00

The Geography of the Knowledge Economy in Scotland
the local futures group
48
4.3.4 Infrastructure and Cultural Amenities
Our analysis of Scotland’s infrastructure and quality of life – as knowledge economy assets – needs to be extended and refined by further research – Scottish Enterprise already has a good evidence base on these factors. We have applied the Local Futures methodology here more to achieve a degree of completeness in the analysis.
Notwithstanding these comments, Chart 4.13 shows that Scotland – with the exception of Glasgow – could benefit from higher levels of connectivity to international transport gateways within the UK and to London as Britain’s global knowledge economy ‘hub’ (the City in particular). The interesting question for Scotland is how this geographically peripheral position will change if the north of England regions were to “take off” as knowledge economies, as a result of devolution, the emergence of successful city-regions and the ODPM plans for transforming the north’s transport corridors.
The ‘cultural amenities’ score is more meaningful in the case of cities, given the sheer scale of Scotland’s land area. Here, Glasgow and Dundee score highly – although Edinburgh, as everybody knows, is also an international cultural destination. Again Scottish Enterprise, tourism agencies and the city authorities have a superior and more reliable evidence base to evaluate the competitiveness of the cultural industries in Scotland’s knowledge economy.
Chart 4.13: Connectivity and Cultural Amenities
See Annex A5 for indicator definitions
Trav
el ti
me
to n
eare
st
inte
rnat
iona
l airp
ort,
2004
* (m
ins)
RA
NK
of R
ail
Con
nect
ivity
Sco
re,
2004
*
Cul
tura
l Am
eniti
es p
er
1000
sq
km, 2
002,
G
B=1
00
Aberdeen 0.13 246 144Dundee 1.03 132 319Edinburgh 0.09 152 153Glasgow 0.15 23 254
Eastern Scotland 46.17 40 16Highlands and Islands 336.00 53 2North Eastern Scotland 53.33 50 9South Western Scotland 28.25 15 22
Scotland Average 85.41 n/a 14Great Britain Average 58.40 n/a 100Urban GB Average 39.75 n/a 162Source: Local Futures Group, derived from The Automobile Association (the 'AA') data and Bartholomew* Note: Sub-regional figures are calculated as averages of the districts.
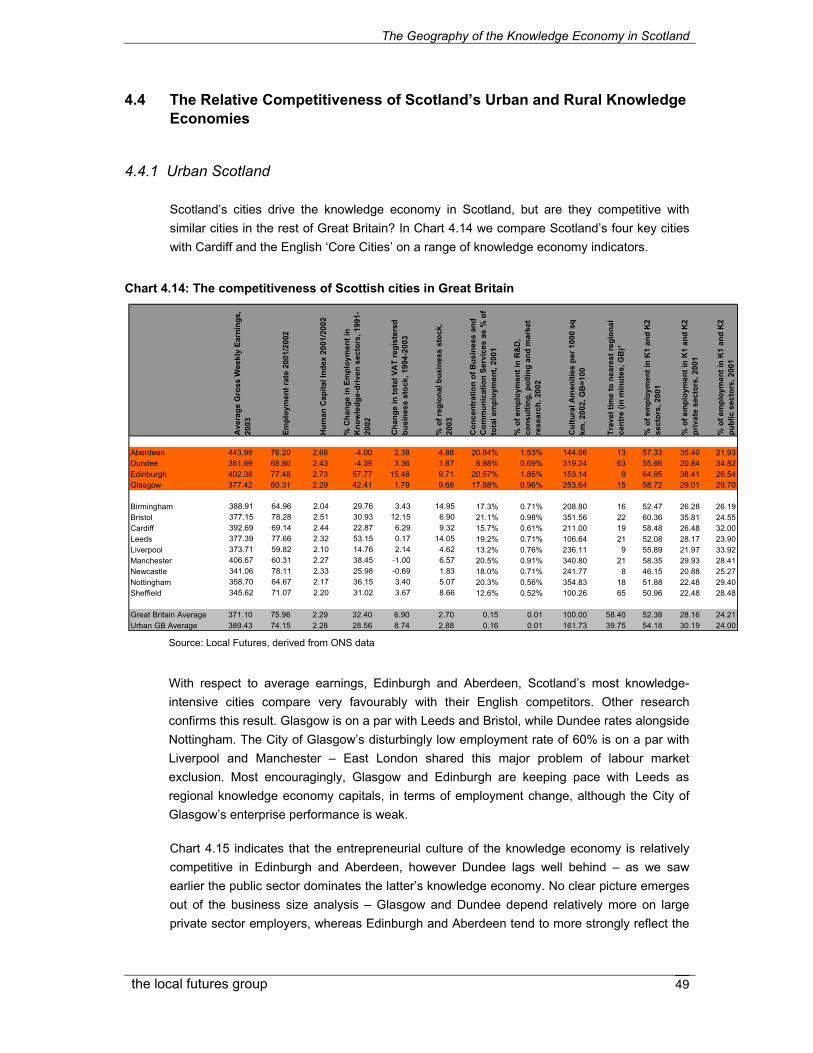
The Geography of the Knowledge Economy in Scotland
the local futures group
49
4.4 The Relative Competitiveness of Scotland’s Urban and Rural Knowledge Economies
4.4.1 Urban Scotland
Scotland’s cities drive the knowledge economy in Scotland, but are they competitive with similar cities in the rest of Great Britain? In Chart 4.14 we compare Scotland’s four key cities with Cardiff and the English ‘Core Cities’ on a range of knowledge economy indicators.
Chart 4.14: The competitiveness of Scottish cities in Great Britain
Source: Local Futures, derived from ONS data
With respect to average earnings, Edinburgh and Aberdeen, Scotland’s most knowledge-intensive cities compare very favourably with their English competitors. Other research confirms this result. Glasgow is on a par with Leeds and Bristol, while Dundee rates alongside Nottingham. The City of Glasgow’s disturbingly low employment rate of 60% is on a par with Liverpool and Manchester – East London shared this major problem of labour market exclusion. Most encouragingly, Glasgow and Edinburgh are keeping pace with Leeds as regional knowledge economy capitals, in terms of employment change, although the City of Glasgow’s enterprise performance is weak.
Chart 4.15 indicates that the entrepreneurial culture of the knowledge economy is relatively competitive in Edinburgh and Aberdeen, however Dundee lags well behind – as we saw earlier the public sector dominates the latter’s knowledge economy. No clear picture emerges out of the business size analysis – Glasgow and Dundee depend relatively more on large private sector employers, whereas Edinburgh and Aberdeen tend to more strongly reflect the
Ave
rage
Gro
ss W
eekl
y Ea
rnin
gs,
2003
Empl
oym
ent r
ate
2001
/200
2
Hum
an C
apita
l Ind
ex 2
001/
2002
% C
hang
e in
Em
ploy
men
t in
Kno
wle
dge-
driv
en s
ecto
rs, 1
991-
2002
Cha
nge
in to
tal V
AT
regi
ster
ed
busi
ness
sto
ck, 1
994-
2003
% o
f reg
iona
l bus
ines
s st
ock,
20
03
Con
cent
ratio
n of
Bus
ines
s an
d C
omm
unic
atio
n Se
rvic
es a
s %
of
tota
l em
ploy
men
t, 20
01
% o
f em
ploy
men
t in
R&
D,
cons
ultin
g, p
ollin
g an
d m
arke
t re
sear
ch, 2
002
Cul
tura
l Am
eniti
es p
er 1
000
sq
km, 2
002,
GB
=100
Trav
el ti
me
to n
eare
st re
gion
al
cent
re (i
n m
inut
es, G
B)*
% o
f em
ploy
men
t in
K1
and
K2
sect
ors,
200
1
% o
f em
ploy
men
t in
K1
and
K2
priv
ate
sect
ors,
200
1
% o
f em
ploy
men
t in
K1
and
K2
publ
ic s
ecto
rs, 2
001
Aberdeen 443.99 76.20 2.66 -4.00 2.38 4.88 20.84% 1.53% 144.06 13 57.33 35.40 21.93Dundee 361.69 68.80 2.43 -4.39 3.36 1.87 8.88% 0.69% 319.24 63 55.66 20.84 34.82Edinburgh 402.38 77.48 2.73 57.77 15.48 9.71 20.57% 1.85% 153.14 9 64.95 38.41 26.54Glasgow 377.42 60.31 2.29 42.41 1.79 9.68 17.88% 0.96% 253.64 15 58.72 29.01 29.70
Birmingham 388.91 64.96 2.04 29.76 3.43 14.95 17.3% 0.71% 208.80 16 52.47 26.28 26.19Bristol 377.15 78.28 2.51 30.93 12.15 6.90 21.1% 0.98% 351.56 22 60.36 35.81 24.55Cardiff 392.69 69.14 2.44 22.87 6.29 9.32 15.7% 0.61% 211.00 19 58.48 26.48 32.00Leeds 377.39 77.66 2.32 53.15 0.17 14.05 19.2% 0.71% 106.64 21 52.08 28.17 23.90Liverpool 373.71 59.82 2.10 14.76 2.14 4.62 13.2% 0.76% 236.11 9 55.89 21.97 33.92Manchester 406.67 60.31 2.27 38.45 -1.00 6.57 20.5% 0.91% 340.80 21 58.35 29.93 28.41Newcastle 341.06 78.11 2.33 25.98 -0.69 1.83 18.0% 0.71% 241.77 8 46.15 20.88 25.27Nottingham 358.70 64.67 2.17 36.15 3.40 5.07 20.3% 0.56% 354.83 18 51.88 22.48 29.40Sheffield 345.62 71.07 2.20 31.02 3.67 8.66 12.6% 0.52% 100.26 65 50.96 22.48 28.48
Great Britain Average 371.10 75.96 2.29 32.40 6.90 2.70 0.15 0.01 100.00 58.40 52.38 28.16 24.21Urban GB Average 389.43 74.15 2.28 28.56 8.74 2.88 0.16 0.01 161.73 39.75 54.18 30.19 24.00
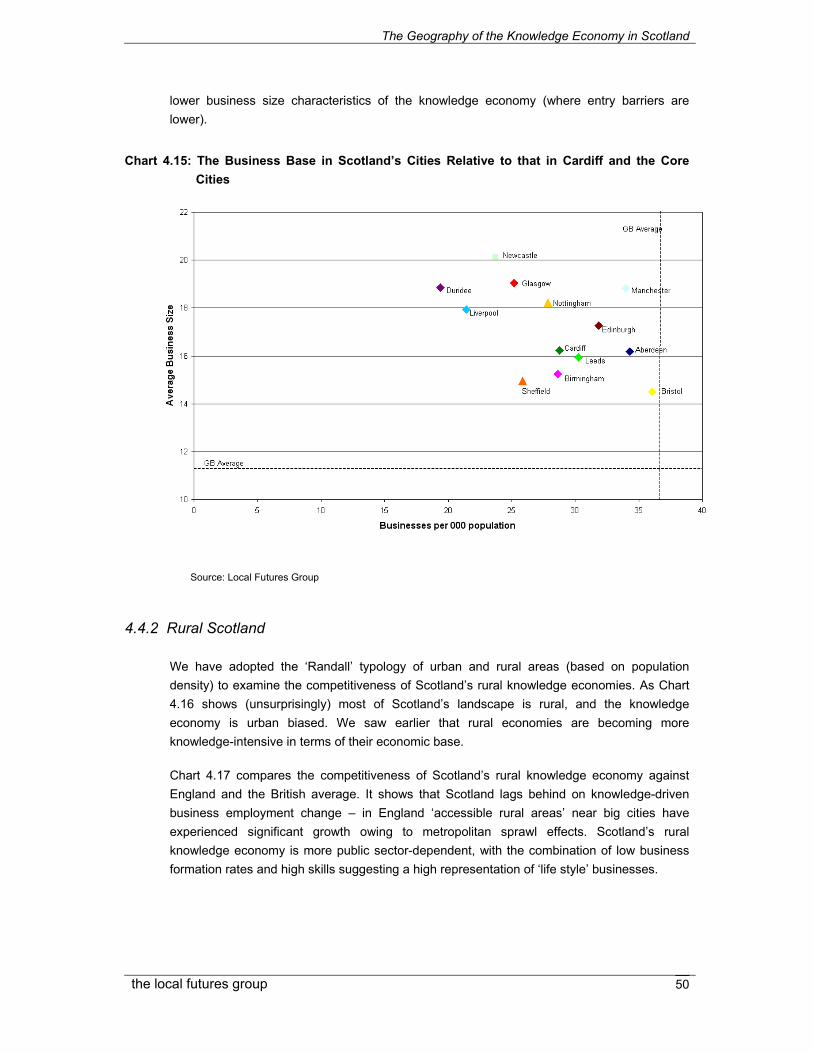
The Geography of the Knowledge Economy in Scotland
the local futures group
50
lower business size characteristics of the knowledge economy (where entry barriers are lower).
Chart 4.15: The Business Base in Scotland’s Cities Relative to that in Cardiff and the Core Cities
Source: Local Futures Group
4.4.2 Rural Scotland
We have adopted the ‘Randall’ typology of urban and rural areas (based on population density) to examine the competitiveness of Scotland’s rural knowledge economies. As Chart 4.16 shows (unsurprisingly) most of Scotland’s landscape is rural, and the knowledge economy is urban biased. We saw earlier that rural economies are becoming more knowledge-intensive in terms of their economic base.
Chart 4.17 compares the competitiveness of Scotland’s rural knowledge economy against England and the British average. It shows that Scotland lags behind on knowledge-driven business employment change – in England ‘accessible rural areas’ near big cities have experienced significant growth owing to metropolitan sprawl effects. Scotland’s rural knowledge economy is more public sector-dependent, with the combination of low business formation rates and high skills suggesting a high representation of ‘life style’ businesses.
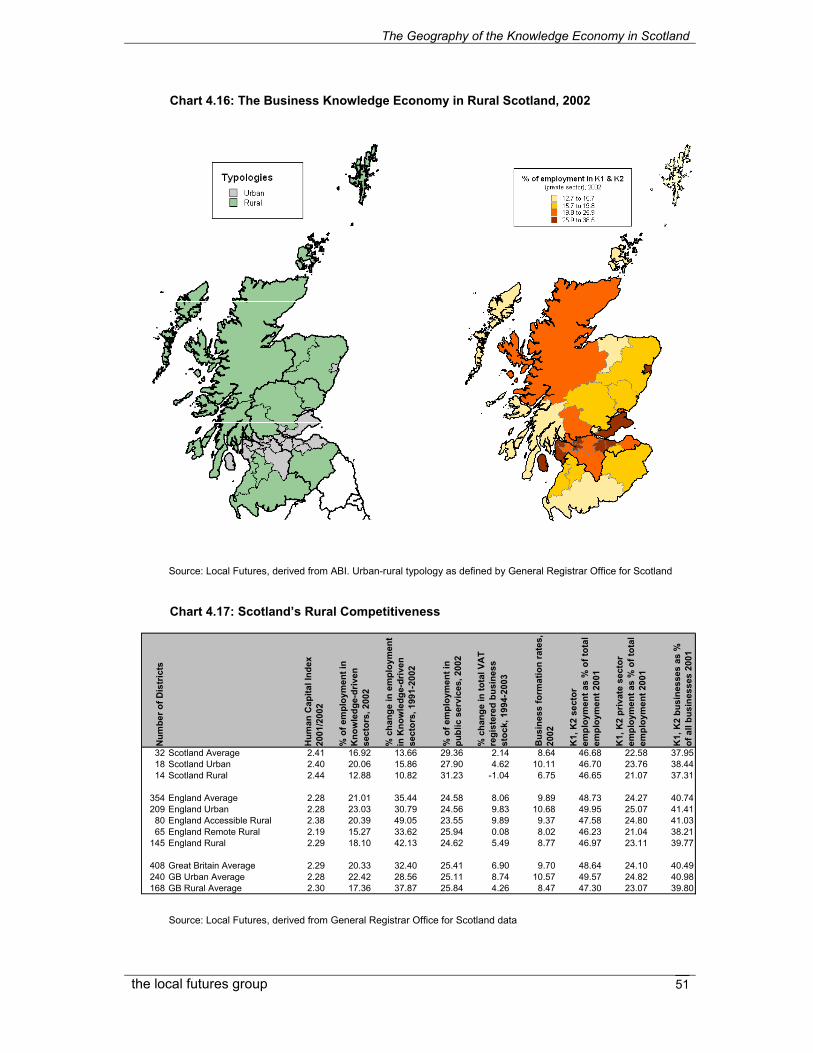
The Geography of the Knowledge Economy in Scotland
the local futures group
51
Chart 4.16: The Business Knowledge Economy in Rural Scotland, 2002
Source: Local Futures, derived from ABI. Urban-rural typology as defined by General Registrar Office for Scotland
Chart 4.17: Scotland’s Rural Competitiveness
Source: Local Futures, derived from General Registrar Office for Scotland data
Num
ber o
f Dis
tric
ts
Hum
an C
apita
l Ind
ex
2001
/200
2
% o
f em
ploy
men
t in
Kno
wle
dge-
driv
en
sect
ors,
200
2
% c
hang
e in
em
ploy
men
t in
Kno
wle
dge-
driv
en
sect
ors,
199
1-20
02
% o
f em
ploy
men
t in
publ
ic s
ervi
ces,
200
2
% c
hang
e in
tota
l VA
T re
gist
ered
bus
ines
s st
ock,
199
4-20
03
Bus
ines
s fo
rmat
ion
rate
s,
2002
K1,
K2
sect
or
empl
oym
ent a
s %
of t
otal
em
ploy
men
t 200
1
K1,
K2
priv
ate
sect
or
empl
oym
ent a
s %
of t
otal
em
ploy
men
t 200
1
K1,
K2
busi
ness
es a
s %
of
all
busi
ness
es 2
001
32 Scotland Average 2.41 16.92 13.66 29.36 2.14 8.64 46.68 22.58 37.9518 Scotland Urban 2.40 20.06 15.86 27.90 4.62 10.11 46.70 23.76 38.4414 Scotland Rural 2.44 12.88 10.82 31.23 -1.04 6.75 46.65 21.07 37.31
354 England Average 2.28 21.01 35.44 24.58 8.06 9.89 48.73 24.27 40.74209 England Urban 2.28 23.03 30.79 24.56 9.83 10.68 49.95 25.07 41.4180 England Accessible Rural 2.38 20.39 49.05 23.55 9.89 9.37 47.58 24.80 41.0365 England Remote Rural 2.19 15.27 33.62 25.94 0.08 8.02 46.23 21.04 38.21
145 England Rural 2.29 18.10 42.13 24.62 5.49 8.77 46.97 23.11 39.77
408 Great Britain Average 2.29 20.33 32.40 25.41 6.90 9.70 48.64 24.10 40.49240 GB Urban Average 2.28 22.42 28.56 25.11 8.74 10.57 49.57 24.82 40.98168 GB Rural Average 2.30 17.36 37.87 25.84 4.26 8.47 47.30 23.07 39.80

The Geography of the Knowledge Economy in Scotland
the local futures group
52
4.5 Scottish Cities as Drivers of Regional Growth in the Knowledge Economy
There is considerable academic and policy interest in the role of cities, and ‘city regions’ as drivers of economic growth. Scotland’s own ‘Cities Review’ has this focus of attention. So, let us explore the case of Scotland’s main cities. This sub-section examines the footprint of the knowledge economy in each of the four Scottish regions – South Western Scotland, Eastern Scotland, North Eastern Scotland and the Highlands and Islands. The distribution of each regional business knowledge economy (private sector employment in K1 and K2 industries) is examined at the local authority (LAD) and travel to work area (TTWA) scales. The Maps for the corresponding sub-regional analysis by LAD can be found in the Annex - A.2, however the LAD figures have been included in the text box below each map. The role of Scottish cities as drivers of the knowledge economy is also evaluated in the context of Britain’s spatial structure.
4.5.1 Scotland’s City-region Knowledge Economy
Chart 4.18 illustrates the extent to which the travel-to-work area (TTWA) around Glasgow City dominates the sub-regional knowledge economy of South West Scotland; almost 75% of the sub-region’s knowledge economy is found in this one TTWA area. Motherwell & Lanark and Glasgow TTWAs together comprise almost the entire sub-regional knowledge economy. At the district level the Glasgow city-region dominates with over 84% of the sub-regions knowledge economy with Glasgow City clearly playing the lead role.
We see the same pattern of single-centre dominance in North Eastern Scotland (Chart 4.19) with almost 90% of the sub-regional knowledge economy in the Aberdeen TTWA. This pattern is replicated at the district level with over 66% of the sub-regional business knowledge economy residing in Aberdeen City, a very (physically) small district, and nearly 90% at the city-region; demonstrating a highly concentrated knowledge economy.
Similarly, the Edinburgh area dominates Eastern Scotland’s knowledge economy, with 63% of employment in knowledge-intensive industries (Chart 4.20). However, when the Edinburgh TTWA is disaggregated to the district level, there is an obvious western bias to the knowledge economy’s footprint – 68% of the sub-regional knowledge economy is located in Edinburgh City, West Lothian, Falkirk and Fife. These four areas are, in this case, a better expression of the extent of the knowledge economy than is the TTWA boundary or the Dundee and Edinburgh city-regions.
The Highlands and Islands sub-region has no single dominant knowledge economy centre (Chart 4.21). Although there are small concentrations in Inverness and Thurso, these are not to any extent as dominant as those in other regions. At the district level, Highland, which includes Inverness and Thurso, captures just over 60% of the sub-region’s knowledge economy but this is spread over a large geographical area.

The Geography of the Knowledge Economy in Scotland
the local futures group
53
Chart 4.18 The Knowledge Economy Footprint in South Western Scotland– Distribution of Employment in Knowledge-Intensive Sectors, 2002
Distribution by TTWA Distribution by Local Districts
*Note: Glasgow City Region includes East Dunbartonshire, East Renfreshire, Glasgow City, Inverclyde, North Lanarkshire, Renfrewshire, South Lanarkshire and West Dunbartonshire
Source: Local Futures, derived from ABI data
Glasgow
Motherwell and Lanark
North Ayrshire
Greenock
East Ayrshire
Annan
Stranraer
Kirkcudbright
Ayr
DumfriesGirvan
Newton Stewart
Glasgow 73.8%Motherwell & Lanark 10.1%
North Ayrshire 4.2%Greenock 4.0%
East Ayrshire 2.5%Ayr 2.4%
Dumfries 1.6%Annan 0.5%
Stranraer 0.4%Kirkcudbright 0.3%
Girvan 0.2%Newton Stewart 0.1%
Glasgow City 44.9%North Lanarkshire 10.2%South Lanarkshire 10.0%Renfrewshire 7.4%Dumfries & Galloway 4.5%North Ayrshire 4.1%South Ayrshire 3.9%Inverclyde 3.8%West Dunbartonshire 3.7%East Ayrshire 3.4%East Dunbartonshire 2.5%East Renfrewshire 1.7%
Glasgow City Region* 84.1%

The Geography of the Knowledge Economy in Scotland
the local futures group
54
Chart 4.19 The Knowledge Economy Footprint in North Eastern Scotland – Distribution of Employment in Knowledge-Intensive Sectors, 2002
Distribution by TTWA Distribution by Unitary Authorities
*Note: Aberdeen City Region includes Aberdeen City and Aberdeenshire Source: Local Futures, derived from ABI data
Aberdeen 88.5%Elgin & Forres 4.5%
Peterhead 2.2%Fraserburgh 1.6%
Banff 1.2%Keith & Buckie 1.2%
Huntly 0.5%Dufftown 0.2%
Dufftown
Aberdeen
Peterhead Huntly
Fraserburgh
BanffElgin & Forres Keith & Buckie
(Part of Brechin & Montrose TTWA)
Aberdeen City 66.2%Aberdeenshire 23.2%Moray 10.6%
Aberdeen City Region* 89.4%

The Geography of the Knowledge Economy in Scotland
the local futures group
55
Chart 4.20 The Knowledge Economy Footprint in Eastern Scotland – Distribution of Employment in Knowledge-Intensive Sectors, 2002
Distribution by TTWA Distribution by Unitary Authority
*Note: Dundee City Region includes Angus, Dundee City, Perth & Kinross and Fife. Edinburgh City Region includes City of Edinburgh, East Lothian, Midlothian, West Lothian, Fife and Scottish Borders
Source: The Local Futures Group, derived from ABI data
Edinburgh 62.7%Dundee 7.6%
Dunfermline 6.9%Falkirk 5.3%
Kirkcaldy 4.8%Stirling 4.1%
Perth 2.8%Galashiels & Peebles 1.5%
Brechin & Montrose 1.0%St Andrews 1.0%
Forfar 0.9%Kelso & Jedburgh 0.4%
Berwickshire 0.3%Hawick 0.3%
Pitlochry 0.2%Crieff 0.2%
Kelso & Jedburgh
BerwickshireGalashiels & Peebles
Stirling
Hawick
Edinburgh
Falkirk
(part of Glasgow TTWA)
Forfar
Dundee
Brechin & Montrose
Pitlochry
St AndrewsPerth
Kirkcaldy
Crieff
Dunfermline
Edinburgh, City of 41.6%Fife 14.0%Dundee City 8.4%West Lothian 6.6%Falkirk 6.1%Perthshire & Kinross 5.3%Stirling 4.3%Scottish Borders 3.8%Angus 3.4%Midlothian 2.8%East Lothian 2.6%Clackmannanshire 1.2%
Dundee City Region* 31.1%Edinburgh City Region 71.4%

The Geography of the Knowledge Economy in Scotland
the local futures group
56
Chart 4.21 The Knowledge Economy Footprint in the Highlands and Islands– Distribution of Employment in Knowledge-Intensive Sectors, 2002
Distribution by TTWA Distribution by Unitary Authority
Source: The Local Futures Group, derived from ABI data
Inverness 29.5%Thurso 12.3%
Dumbarton 11.8%Dingwall 7.1%
Shetland Islands 6.4%Dunoon & Rothesay 5.8%
Orkney Islands 4.0%Lewis & Harris 3.6%
Lochaber 3.5%Oban 3.4%
Skye & Ullapool 2.5%Badenoch 2.4%
Wick 1.8%Sutherland 1.6%
Lochgilphead 1.4%Argyll Islands 1.2%Campbeltown 1.0%Uists & Barra 0.8%
Highland 60.2%Argyll and Bute 23.5%
Western Isles 6.8%Orkney 5.0%
Shetland 4.5%
Thurso
Dingwall
Shetland Is.
Dunbarton
Dunoon & Rothesay
Lochaber
Oban
Cambeltown
Orkney Is
Sutherland
Skye & Ullapool
Uists & Barra Inverness
Lewis & Harris
Lochgilphead
Wick
Argyll Is.

The Geography of the Knowledge Economy in Scotland
the local futures group
57
From this analysis we can infer three regional knowledge economy centres in Scotland: the travel-to-work-area around Glasgow and Motherwell and Lanark, Aberdeen City, and the area that includes Edinburgh City, West Lothian, Falkirk and Fife. However, these regions each have different local context. This is evident with, as discussed in earlier sections, the geography of skills (see section 4.3.2 and Annex A.1), which illustrates pockets of skills deprivation around Glasgow and Edinburgh and also the strong skills profile in Stirling and Perth and Kinross. Further analysis on the percentage share of total employment in knowledge-intensive sectors by Unitary Authority (see Annex A.3) reinforces the dominance of the three city-regions but also provides another topographic view of the knowledge economy which highlights the specific importance of East Dunbartonshire, Inverclyde and North Ayrshire for the Glasgow city-region and emerging role of East Lothian for the Edinburgh city-region and Stirling which sits outside of the Glasgow and Edinburgh city-region but within the Eastern Scotland sub-region.
4.5.2 Polycentric Scotland
Chart 4.22 shows the spatial distribution of the Scottish knowledge economy across travel-to-work areas (K1 and K2 private sector employment) in comparison to England and Wales. Glasgow and Edinburgh dominate the knowledge economy in Scotland, and this series of charts emphasise the importance of these two city-regions for the overall prosperity of the Scottish economy. The importance of the Glasgow-Edinburgh relationship is unique. In England and Wales, each country is dominated by a single city-region (London and Cardiff, respectively), not two, and in neither England nor Wales is that central city-region as dominant over the whole country’s knowledge economy as are Edinburgh and Glasgow. We have also examined the structure of the English regions (see Annex A.4 for charts of each English region) and again, no English region shares a similar profile with Scotland.
Chart 4.22: Spatial Distribution of the Knowledge Economy in Scotland, England and Wales, 2002
Distribution of the Business Knowledge Economy in Scotland, by TTWA
Glasgow
Edinburgh
Aberdeen
Motherw ell and Lanark
0%5%
10%15%20%25%30%35%40%45%50%
% o
f reg
iona
l KE
em
ploy
men
t

The Geography of the Knowledge Economy in Scotland
the local futures group
58
Source: The Local Futures Group, derived from ABI data
The dominance of the Glasgow and Edinburgh city-regions, with approximately 36% and 30% of Scotland’s total employment in knowledge driven sectors respectively, is being reinforced by recent growth trends – see Chart 4.23. The two city-regions are experiencing the fastest growth rates in knowledge-driven sectors, with nearly 60% growth in Glasgow and over 32% growth in Edinburgh between 1998 and 2002. The Dundee city-region has experienced almost 6% growth and Aberdeen city-region trails with only 3% growth over the same period and both are starting from a smaller share of Scotland’s knowledge economy. This concentrated growth is positioning the Glasgow-Edinburgh axis as the core of the Scottish knowledge economy.
Distribution of the Business Knowledge Economy in England, by TTWA
BirminghamManchester
London
0%5%
10%15%20%25%30%35%40%45%50%
% o
f nat
iona
l KE
em
ploy
men
t
Distribution of the Business Knowledge Economy in Wales, by TTWA
Cardiff
New portSw ansea
Pontypridd and Aberdare
Flint
0%5%
10%15%20%25%30%35%40%45%50%
% o
f reg
iona
l KE
em
ploy
men
t

The Geography of the Knowledge Economy in Scotland
the local futures group
59
Chart 4.23: Share of employment and Growth in the Knowledge Economy by city-region, 1998-2002
Note: for the purposes of Chart 4.23, Fife has been divided equally between Dundee City Region and Edinburgh City
Region. Source: Local Futures, derived from ONS data
Clearly the geographical locus of the knowledge economy is a central consideration in defining the functional boundaries of ‘city regions’. As important are the governance structures that reflect stakeholder economic, political and community interests in the areas that could potentially merge into new territorial entities. Further, the issue of marginal costs and benefits of creating ‘city regions’ through mergers, annexation and other means – the impacts on public service provision, house prices, and so on – have to be weighed up. Devolution has hastened this process of re-defining metro-regional areas – and ‘city-region economies’ – in the north of England. The Boundary Commission is currently reporting on this issue. The Glasgow-Edinburgh relationship will be of key importance for the future of Scotland’s knowledge economy.
The city region's share of Scotland's total employment in knowledge-driven sectors 2002
12.62%
7.80%
29.34%36.31%
13.93%
Aberdeen City Region Dundee City Region Edinburgh City RegionGlasgow City Region other districts
The city region's share of Scotland's employment growth in knowledge-driven sectors 1998-2002
3.14% 5.99%
32.13%57.15%
1.60%
Aberdeen City Region Dundee City Region Edinburgh City RegionGlasgow City Region other districts

The Geography of the Knowledge Economy in Scotland
the local futures group
60
4.6 Conclusion
The Local Futures methodology for benchmarking the knowledge economy is clearly based on a range of aggregate measures of competitiveness. It needs to be supplemented with more detailed data analysis on industries, skills, enterprise and so on – including qualitative evidence and indicators. Scottish Enterprise and local economic development agencies will have this type of local knowledge to hand. What we have attempted to provide is a baseline picture that maps out the geography of the knowledge economy in Scotland – an analysis that could provide a good foundation for more detailed spatial and economic analysis.
The picture that emerges is original in the sense that Scotland’s knowledge economy has not been analysed in this way before now. Further, it is a picture that can be compared and contrasted with that of all other regional knowledge economies in Britain. In the following chapter we look at how stakeholders in Scotland perceive the geography of the knowledge economy, and the issues that it raises for policy makers.

Stakeholder Views on Scotland’s Knowledge Economy
the local futures group
61
5 Stakeholder Views on Scotland’s Knowledge Economy
5.1 Introduction
This chapter provides a summary of the results of the stakeholder analysis carried out in order to illuminate some of the more fundamental issues relating to the geography of the Scottish knowledge economy. We interviewed a cross-section of about 40 stakeholders involved in national, regional and local economic development and planning, including a number of businesses, universities and colleges. These personal interviews, based on a structured questionnaire, were carried out in late 2003 and January/February 2004. The interviews provide a baseline picture of:
Understanding of the knowledge economy agenda in Scotland
Expert views on the spatial dynamics of the knowledge economy in Scotland
Perceptions of strategic issues and policy priorities
5.2 Understanding of the Knowledge Economy Agenda
The interviewees generally associated the knowledge economy with trends towards globalisation, higher technology intensity and innovation, entrepreneurship and rising skills levels. Smart, Successful Scotland is seen as a strategic framework for building a successful knowledge economy. However we found a fragmented understanding of the knowledge economy and its implications for local competitiveness and regional and local policy development.
There is a perception that the knowledge economy is narrowly concerned with ‘high-end’, technology-driven industries and skills – a small subsection of the economy. This perception is untowardly encouraged by the presentation and marketing of the knowledge economy agenda in Scotland – and in the UK more generally. It diverts attention away from the knowledge economy as a pervasive and defining characteristic of contemporary economic development - and hence the impact of knowledge-driven economic growth on social exclusion and polarisation. There is a sense that policy is too narrowly construed as specific sector strategies and that a wider definition and understanding is needed of how Scotland- wide opportunities fit into the national agenda.
“The knowledge economy is often discounted as a popular buzz word”
“The definition of the knowledge economy changes depending on your departmental perspective – there
is no shared definition”

Stakeholder Views on Scotland’s Knowledge Economy
the local futures group
62
For the interviewees, Scotland’s 21st century economy is characterised by the rise of cities and universities as centres of knowledge creation and use, and a growing recognition that ‘talent’ is essential to economic prosperity. The spatial dynamics of the knowledge economy is thus city-centred and driven by regional innovation systems made up of R&D, HE institutes and specific industrial clusters.
“The knowledge economy is city based and driven by university research departments”
“Cities are seeing a larger proportion of economic activity from knowledge, the knowledge economy is a
city-based phenomenon in Scotland”
“The knowledge economy is strongly associated with research and HE institutes and specific clusters –
biotechnology, financial services, software and electronics”
Universities are consistently identified as key knowledge economy drivers, however there is a concern among stakeholders that the greater potential of university-driven innovation is unrealised and could narrowly favour ‘elitist’ knowledge-intensive sectors within Scotland’s national and regional/local economies.
“Policy makers need to recognise that the direct play between university generated knowledge and
businesses’ use of that knowledge is very subtle… the uptake and use of knowledge by the existing
businesses requires a broader approach”
The knowledge economy in Scotland is associated with university graduates, while education and skills attainment below level 4 qualifications are regarded as a social inclusion issue. According to the interviewees, the Further Education sector, workforce development programmes and lifelong learning must act to redefine this two-tier perspective and help bridge the supply of and demand for skills in the labour market. The challenge is to build flexible and fair ‘skill ladders’ that enable all people and all businesses to shift to higher value, higher paid job and market opportunities.
“There is a lack of flexibility in the labour force, you need to be able to transfer skills and knowledge
across sectors and industries”
At the local level, national economic policy is perceived to be restricted to specific high growth sectors or specific clusters and the ‘silo’ nature of cluster policies has been exacerbated by their alignment with the university driven commercialisation agenda - “tunnel vision dominates the thinking behind clusters”. Business leaders stressed that Government policy needs to be more flexible and responsive to capture the local growth potential and should include a crosscutting approach that genuinely encourages cross fertilisation of ideas and the spread of knowledge and ‘know how’.
Business and government need to have a better, shared understanding of the microeconomic policy strands of the knowledge economy - a process perspective that would better align business support services provided by Business Gateway, LECs and programme administrators within Scottish Executive and Scottish Enterprise.

Stakeholder Views on Scotland’s Knowledge Economy
the local futures group
63
“Smart, Successful Scotland’s objectives need to be better aligned with business, it needs to be more
tangible. There is currently no ‘buy in’ from business”
“The public sector needs new ways of partnering and working with business, particularly SMEs”
The new Intellectual Asset Management team at Scottish Enterprise is positioned to address this shortfall in knowledge – stimulating innovation and growth through intellectual property, knowledge management, new market development, organisational change, R&D investment, etc. In support, policy and its delivery vehicles need to be designed to maximise the flow of knowledge and match ‘know-how’ and capital resources in a faster paced business environment.
5.3 Geography
The interviewees highlighted the emerging dominance of Scottish cities in the knowledge economy as a great threat to the future of rural economies. The knowledge economy is creating new spatial tensions across Scotland:
“Aberdeen city is pulling in all the skilled workers and businesses from across Aberdeenshire”
“Growth spreading out from Edinburgh is being pulled through West Lothian but it could also spread
through to the Borders and Fife”
The interviewees believe that there is a shared interest in strengthening local partnerships and cooperation across local authority areas to address these emerging spatial dynamics in the knowledge economy – the Local Economic Forums were frequently cited as an opportunity to champion a collaborative approach. However, several stakeholders called for a national spatial framework that could help build a competitive but inclusive knowledge economy in Scotland.
“There is no strategic framework that joins-up policy”
“There is a need for strategic policy to consolidate at the city or regional level”
A national spatial framework for the knowledge economy would address concerns that SSS excludes areas without a university or research centre or areas that are predominantly rural. The knowledge economy agenda needs to be ‘stretched’ across all regions of Scotland including urban and rural areas. In addition, the alignment of spatial and economic policy at the delivery level faces conflicting governance structures and functional boundaries that create tensions between sub-regional and local policy makers and the region. At what stage should policy be joined up – strategy development, programme level, delivery level and at what scale – national, regional or local? According to the interviewees:
“There are too many councils and authorities trying to do things, we need a joint local economic strategy
that brings together a plan for wealth creation, jobs and inclusion”
“We need more political will to see Scotland as a country, as a whole, and how the regions play into
each other”

Stakeholder Views on Scotland’s Knowledge Economy
the local futures group
64
This fractured understanding of the knowledge economy is not unique to Scotland. Local Futures research across the UK has revealed an uneven and fragmented understanding of the knowledge economy in regional and local communities of policy and practice. The knowledge economy agenda needs to cascade down and include local ‘innovation’ players – developing a clear and coherent vision of the local knowledge economy and how policy levers can deliver against this agenda.
“A Smart, Successful Scotland is a step in the right direction, but we now need the strategic priorities
and practical next steps. This would ease much of the local difficulties in translating the knowledge
economy agenda”
5.4 Policy Priorities
In relation to the stakeholder and data analysis carried out for this study, we arrived at the following set of major policy ideas and issues that could form the basis of a new geography-based knowledge economy agenda:
Our analysis pointed to the dominance of Glasgow and Edinburgh as drivers of the knowledge economy in Scotland. Each city is facing different challenges - growth management in Edinburgh and a more inclusive knowledge economy in Glasgow. If policy makers agree that the Scottish national knowledge economy model entails ‘merging’ Glasgow and Edinburgh into a ‘super city-region’, what will this mean for the rest of the country? What planning and policy tools are required to support the development of this ‘growth-axis’?
A powerful ‘growth-axis’ between Edinburgh and Glasgow will need to recognise its relationship with Scotland’s other cities. Our analysis points towards the importance of cities, clusters, and corridors. Scotland’s growth axis (Glasgow – Edinburgh) can work with a number of smaller corridors building linkages to other cities and sub-regions within the southern belt maximising accessibility for clusters in Dundee or corridor development between Edinburgh - Fife - Perth and Kinross.
The rural knowledge economy in Scotland is under-performing compared to England. At the centre of this debate is balancing city-region or urban-rural priorities for economic growth and inclusiveness. The national planning framework recognises the importance of the knowledge economy to rural Scotland. Local Futures is currently working with DEFRA on developing benchmarking systems and policies for the rural knowledge economy in the English regions – this type of research should extend to Scotland.
Scotland needs a clearly defined strategy for building the infrastructure backbone needed for a 21st Century knowledge economy. There is need for an overarching national planning concept championed by the Scottish Parliament. This strategic ‘wheels and wires’ infrastructure for the knowledge economy should encompass road, rail and air networks, telecommunications and broadband networks and housing and land use planning.

Stakeholder Views on Scotland’s Knowledge Economy
the local futures group
65
Our analysis suggests the need for local and regional dimensions in Scotland’s knowledge economy policies. What does this imply for the geography of economic governance, including Scottish Enterprise’s own organisation? How do the emerging sub-regional partnerships fit into a possible decentralised framework for the knowledge economy – for example, local authority collaboration around Glasgow, in the West of Scotland? How do city-regions also fit in?
The most pressing implication for the Scottish Enterprise is balancing a national economy increasingly dominated by the Glasgow-Edinburgh axis with a long tail of trailing areas starting with the other Scottish cities and spreading across rural Scotland. Does Scottish Enterprise need a powerful sub-regional platform? How does the Scottish Enterprise structure itself for a regional response – operationally through the LECs and supporting legislation from the Executive?
5.5 Conclusion
In conclusion, findings from the numerous stakeholder interviews and project workshop resonate with the results of the analysis. What has emerged out of this is a strong role for geography in Scotland’s knowledge economy.
First, there is a need for a local-regional approach to cut through local politics and parochial thinking – this is seen as vital to driving the knowledge economy forward on the ground. How does local and sub-regional Scotland link into SSS? A refreshed SSS should reinforce spatial strategies and regional cooperation.
Second, the competitive cities agenda needs to be recast to ensure that growth and prosperity is inclusive of rural Scotland – the default option. Understanding urban-rural dynamics will enable local stakeholders to leverage existing linkages or develop new levers to maximise a rural-urban gateway for businesses.
Third, policy needs to be ‘joined up’ – however, the national planning framework is broad brush while Scottish Enterprise works with a very refined set of targets, can the two be reconciled? A strategic framework that brings together spatial and economic levers along with a set of strategic priorities and actionable next steps will provide the direction and focus required.
In the last chapter, we build on the priorities laid out above and offer a provisional set of policy ideas that could help create a new geography-based agenda for Scotland’s knowledge economy.
A Spatial Framework for the Knowledge Economy in Scotland
the local futures group
66
6 A Spatial Framework for the Knowledge Economy in Scotland
6.1 Task Force Number 3
The UK Government has recognised the need to create a spatial framework for its knowledge economy strategy – with regions as the primary ‘building blocks’, and the RDAs and DAs as leading actors. This regional governance system for the knowledge economy is now being reinforced by the Government’s drive to a ‘new economic localism’, with local authorities expected to play a leadership role in their local and sub-regional economies – in the context of Local Strategic Partnerships and Strategic Sub-regional Partnerships. Local Futures has confirmed this picture of an emerging ‘distributed policy model’ of the knowledge economy in its new report for the Local Government Association for England and Wales (The Knowledge Economy Agenda for Local Authorities, 2004, LGA). Added to this, the OPDM has backed the Core Cities Network as a vehicle for bringing about an urban economic ‘renaissance’ in England’s regional capitals.
In this report, we have analysed the geography of the knowledge economy in Scotland and concluded that it would be worthwhile for the Scottish Executive and Scottish Enterprise to thoroughly explore options for strengthening the regional and local dimensions to the country’s knowledge economy policies.
A 3rd Task Force on Scotland’s Knowledge Economy
Scotland’s two knowledge economy task forces - first focusing on endogenous growth and second, developing a joined-up approach - now needs to be followed with a third task force that introduces geography as the unifying framework for the knowledge economy.
6.2 Vision: The “Nation-Region” Knowledge Economy
Scotland is a newly established nation and a region of the UK - and of the EU. It is a ‘nation region’ knowledge economy. As such, its knowledge economy strategy has to reflect this unique governance situation – what are the challenges and opportunities for Scotland that derive from this ‘nation-region’ status?
A ‘Nation-Region’ Knowledge Economy
Scotland’s vision of its future as a knowledge economy has to fully reflect the country’s status as a ‘nation region’. Because this economic governance status is ‘new’ (though Scotland’s nationhood status is old), Scottish policy makers have to embark on a ‘nation-building’ exercise in its knowledge economy policies work. This involves visioning the knowledge economy across Scotland, nationally, regionally and locally. All concerned need to have a

A Spatial Framework for the Knowledge Economy in Scotland
the local futures group
67
common understanding and vision of what the knowledge economy agenda entails and what it means to them.
6.3 Scenarios Development
As a further, reinforcing policy step, Scottish Enterprise needs to develop future scenarios for the knowledge economy that can be used to support not only its visioning work, but also to help begin the process of benchmarking progress at all levels. Local Futures has made a start on this type of scenario work, and it is worthwhile introducing it into this report at this stage of the discussion.
Scenario Exercises for Scotland’s Knowledge Economy
Scotland’s knowledge economy strategy should be informed by scenario planning along the lines described below, possibly using Local Futures’ methodology as a basis for starting up a more systematic exercise.
Local Futures taxonomy for classifying local knowledge economies is shown in Chart 6.1. Building on this we have developed a set of future scenarios – this was first presented in our State of the Nation 2003-2004 report.
Chart 6.1 A Classification of Local Knowledge Economies
Type of Knowledge Economy
Benchmark Indicator Scotland’s local classification
Advanced Centres Over 33% of Business Stock in Knowledge-Driven Sectors
Aberdeen City, Edinburgh City
Transforming Centres 25% – 33% of Business Stock in Knowledge-Driven Sectors
N/A
Industrial Legacy Centres Less than 25% of Business Stock in Knowledge-Driven Sectors
Glasgow City, Dundee City
Urban Knowledge Worker Communities
Over 40% of local labour force in knowledge –based occupations
East Dunbartonshire, East Renfrewshire
Urban Legacy Communities
Less than 40% of local labour force in knowledge –based occupations
North Ayrshire, Inverclyde, Renfrewshire, West Dunbartonshire, South Lanarkshire, North Lanarkshire, Falkirk, West Lothian, Clackmannanshire, Fife, Midlothian, East Lothian
Rural Transforming Communities (metropolitan sprawl)
Over 40% of local labour force in knowledge –based occupations
Stirling, Argyll and Bute, Orkney
Rural Periphery Communities
Less than 40% of local labour force in knowledge –based occupations
Highland, Moray, Aberdeenshire, Angus, Perth and Kinross, South Ayrshire, East Ayrshire, Dumfries and Galloway, Boarders, Western Isles, Shetland
Source: Local Futures Group, State of the Nation report, 2003

A Spatial Framework for the Knowledge Economy in Scotland
the local futures group
68
The map of Britain’s knowledge economy shown in Chart 6.2 is derived from our 7-way classification of local areas. From the map, we can identify a number of broad patterns of development.
• A general ‘North-South Divide’ in the knowledge economy – the ‘divide’ being an imaginary line running from the Bristol Channel to the Wash.
• The dominance of Greater London and its hinterland economies (including the Thames Valley Region).
• The growth and emergence of regional knowledge capitals elsewhere in Britain: Edinburgh and Aberdeen in Scotland, and Cardiff in Wales; Manchester, Leeds and Newcastle in the North; Nottingham and Birmingham in the Midlands, Bristol in the South West and Norwich in the East of England.
• A phenomenal degree of metropolitan sprawl characterised by decentralised employment and population growth on the ‘fringes’ of the big cities and extending into the great swathes of Britain that are traditionally classified as ‘rural’ areas. However, this pattern is not replicated in Scotland.
• The ‘blue’ areas in Chart 6.2 could be described as lying on the ‘urban periphery’ of the knowledge economy – such as the Thames Gateway in East London, the Welsh Valleys, along the central belt in Scotland and ex-coalfield areas and other older industrial communities where economic modernisation is urgently needed.
• The map also shows that the ‘other half’ of rural Britain is on the ‘rural periphery’ of the knowledge economy – included here are large bands of Scotland, coastal districts and traditional agricultural or resource-based economies.
The thinking behind the ODPM-backed ‘Core Cities’ initiative and reciprocal city-based agendas in Scotland is that the strategic development of regional knowledge capitals is good for the economy. But the challenges facing these potential ‘city regions’ are clear: will they grow big enough to generate ‘spread’ or ‘trickle down’ effects within firstly, their own areas and secondly, their surrounding ‘urban peripheries’ and rural hinterlands?
The second big sets of challenges arise from the phenomenon of metropolitan sprawl and economic and population decentralisation in England and Wales and the relative economic concentration effect and wide spread population decline in Scotland. What does this mean for rural areas and the traditional approach of having separate policies for urban and rural development? For the more accessible rural districts - which are transforming at a furious pace in England, but not in Scotland - the big and difficult challenge lies in managing the growth of the knowledge economy (or developing growth in the case of Scotland) as a cornerstone of the ‘sustainable community’. The challenge facing the remoter rural areas is not managing growth, but actually creating it at all - the economic leadership of the English Regional Development Agencies and Scottish Enterprise and Highlands and Islands Enterprise in developing infrastructure and industrial diversity is crucial here.

A Spatial Framework for the Knowledge Economy in Scotland
the local futures group
69
Chart 6.2 The Geography of the Knowledge Economy in Britain, 2001
Source: The Local Futures Group, derived from ONS data
How and why might we see a change in Scotland’s human geography over the rest of the decade and all the way through to 2020 - the milestone years that one tends to see written into local and regional strategies?
Advanced CentresTransforming CentresIndustrial Legacy Centres
Urban Knowledge Workers CommunitiesUrban Legacy CommunitiesRural Transforming CommunitiesRural Periphery Communities
Advanced CentresTransforming CentresIndustrial Legacy Centres
Urban Knowledge Workers CommunitiesUrban Legacy CommunitiesRural Transforming CommunitiesRural Periphery Communities

A Spatial Framework for the Knowledge Economy in Scotland
the local futures group
70
Here, we offer four alternative geographical scenarios of the knowledge economy that lead on from the State of the Nation analysis. These scenarios are possible ‘local futures’ that could be elaborated more fully or simply challenged as unrealistic or flawed.
In the Scottish context, it will be necessary to hold knowledge economy scenarios workshops at the national, regional and local levels. Scottish Enterprise and the LEC network are clearly perfectly positioned to organise and carry out these workshops and integrate the findings from throughout Scotland. In England, RDA-Regional Assembly collaboration is playing this type of facilitating and catalyst role in the context of developing Integrated Regional Strategies that unify regional economic strategies and regional planning guidance.
Chart 6.3 Local Futures Scenarios for the Geography of the Knowledge Economy in Britain
Scenario One: London Megalopolis (see top left map in Chart 6.4)
London strengthens its monopoly over Britain’s knowledge economy, and growth finally spreads eastwards into the Thames Gateway Sub Region. The London Plan, with its basic goal of ‘going for growth’, works perfectly and the capital develops into a powerful global ‘city state’. The North-South Divide deepens, and metropolitan sprawl blankets urban and rural southern England. The Regions have failed to develop their metropolitan ‘knowledge capitals’ and face the prospect of long-term decline.
Scenario Two: Urban Renaissance (top right map of Chart 6.4)
The Government has delivered the ‘urban renaissance’ promised in the Urban White Paper and the ODPM-backed ‘Core Cities’ network has worked successfully. Regeneration, planning and economic development policies have combined to make London and other regional capitals attractive, prosperous and sustainable places to work, conduct business and visit for leisure and recreation. The ‘brain drain’ to London stops. At last, Britain has a modern knowledge economy underpinned by a balanced and distributed city system.
Scenario Three: Urban ‘Meltdown’ (bottom left map in Chart 6.4)
The ‘urban renaissance’ has not materialised, instead the opposite has happened: Britain’s global competitiveness has worsened considerably, with adverse impacts on the knowledge economy of cities. London, in the case of the Thames Gateway Sub Region, and other metropolitan centres lack the critical economic capacity to function as city-regions, which could spread growth to deprived areas and to the surrounding hinterland areas. The knowledge economy in urban and rural Britain has ‘stalled’.
Scenario Four: ‘Super Sprawl’ (bottom right map in Chart 6.4)
Perhaps the most interesting scenario where growth and transformation unleashed by Britain’s globally competitive knowledge economy are felt across most of the country – an ‘urban and rural renaissance’? Absolutely everybody’s economic strategy has delivered! Sustainable communities may, however, have become a dream rather than a reality. Development and traffic put great pressures on the quality of life and intrinsic character of rural communities. Broadband and the e-economy will take off.
Source: Local Futures Group, State of the Nation report, 2003

A Spatial Framework for the Knowledge Economy in Scotland
the local futures group
71
Chart 6.4 Four Geographical Scenarios of the Knowledge Economy in Britain
Source: Local Futures Group, State of the Nation report, 2003
Advanced CentresTransforming CentresIndustrial Legacy Centres
Urban Knowledge Workers CommunitiesUrban Legacy CommunitiesRural Transforming CommunitiesRural Periphery Communities
Advanced CentresTransforming CentresIndustrial Legacy Centres
Urban Knowledge Workers CommunitiesUrban Legacy CommunitiesRural Transforming CommunitiesRural Periphery Communities
Urban Meltdown
Urban Renaissance
London Megalopolis
Super Sprawl

A Spatial Framework for the Knowledge Economy in Scotland
the local futures group
72
6.4 A ‘Distributed Policy’ Model for the Knowledge Economy
In Chapter 2, we introduced the chart below in the context of discussing horizontal and vertical dimensions to knowledge economy policy and delivery. These dimensions are defined in terms of policy and geographical domains, and together they constitute the governance framework of the knowledge economy.
Chart 6.5 A Distributed Model of Knowledge Economy Policy
Skills Enterprise Innovation Infrastructure Competition
National
Regional
Sub-regional
Local
Because the knowledge economy demands a joined up approach to policy, and because there is a powerful spatial logic to the knowledge economy – its relational economic geography of knowledge networks, actors and relations of trust and loyalty:
A Distributed Policy Model: The Relational Geography of the Knowledge Economy
We recommend the use of a distributed policy model for the Scotland knowledge economy. This model should be used as an organising framework for developing ‘joined up’ strategy and weighing up options for greater regionalism and localism in knowledge economy policy – including the case for planning ‘city-regions’.
We recommend a programme of research and policy analysis based on this distributed policy model, with two obvious areas of inquiry:
City Regions
There is considerable interest in this planning concept, but the analysis and evidence to support policy makers is inadequate. We have scratched the surface here. The locus of the knowledge economy – its market and non-market boundaries that define the geography of codified and tacit knowledge flows – is the appropriate basis for defining city regions properly. Therefore, Scottish Enterprise has to invest in research on the relational geography of the knowledge economy – in fact, this would also provide a badly needed evidence base on clusters (again relational geography) – before joining the ‘city region bandwagon’. These comments also apply to the fashionable idea of a ‘super city region’ in Scotland.
The National Planning Framework For Scotland implicitly recognises a bi-polar growth model including Glasgow and Edinburgh. Explicitly recognising this bi-polar approach as a ‘super-city region’ will galvanise business interest and provide the template for strategic partnership development. This will require a shared vision and perspective, and politically, a sound argument but … it most of all needs a robust analysis of costs and benefits, and an underlying model of the Scottish knowledge economy.
A Spatial Framework for the Knowledge Economy in Scotland
the local futures group
73
The Rural Knowledge Economy
Rural areas need to be recognised as an important part of the Scottish knowledge economy. The Highlands and Islands Enterprise, co-sponsors of the previous ERKE research, has a mission to develop a sustainable knowledge economy in rural Scotland. Further, the National Planning Framework For Scotland refers to the knowledge economy as a future for rural economic development and planning in Scotland.
Local Futures has recently produced regional reports on the knowledge economy for DEFRA and is working with DEFRA on the review of the Government’s national rural development strategy. A more detailed study of the rural knowledge economy was carried out for EMDA, the East Midlands Development Agency. In addition, Knowledge Economy Audits are being carried out for the rural counties of Devon, Cornwall and Somerset.
The Rural Knowledge Economy
We recommend parallel rural knowledge economy studies for Scotland – this could be done as part of ERKE 3. The advantage of this continued Local Futures partnership with Scottish Enterprise and the HIE is that it will enable Scottish policy makers to benchmark their rural knowledge economies against the rest of England and Wales.
6.5 ‘Knowledge Economy Observatory’ for Scotland
Scottish Enterprise and the LEC network would benefit from a knowledge management system for monitoring the knowledge economy across Scotland. This research for the Scottish Enterprise and LECs has generated a comprehensive set of indicators and benchmarking system. Local Futures has been refining this monitoring system through our work in the ERKE programme. Scotland could build on the existing Observatory platform used by Local Futures and other English regions by including locally held information and data sets providing a shared intelligence source for key stakeholders.
Smart Observatory for the Scotland Knowledge Economy
Scottish Enterprise needs to create a ‘knowledge infrastructure’ to support and guide knowledge economy policy-making across sectors and geographies. The ‘hub’ of this nationwide ‘joined up’ infrastructure should be a ‘smart observatory’ – an interactive, web-enabled database-driven knowledge management system. This should be a ‘zero option’ for Scotland’s knowledge economy community of policy makers.
6.6 A Publicity and Awareness Campaign for the Knowledge Economy
The Scottish Executive’s second Knowledge Economy Taskforce identified the “need to develop a shared view of what the knowledge economy means for all its citizens and business and to move forward together from this vision”. Our stakeholder interviews reveal that this shared vision still does not exist within or across the public sector and very likely across Scottish business.

A Spatial Framework for the Knowledge Economy in Scotland
the local futures group
74
Scottish Enterprise should work with the LECs to develop a unified message for local economic partnerships, local and regional authorities, industry associations and business networks, the HE and FE sectors, skills and training providers and other stakeholder groups. The Local Economic Forums should provide an initial platform to deliver this message to these policy and service communities, and also to the public – the ‘average Joe on the street’ whose job prospects or future will be shaped by Scotland’s ability to plan ahead for a successful world class knowledge economy.
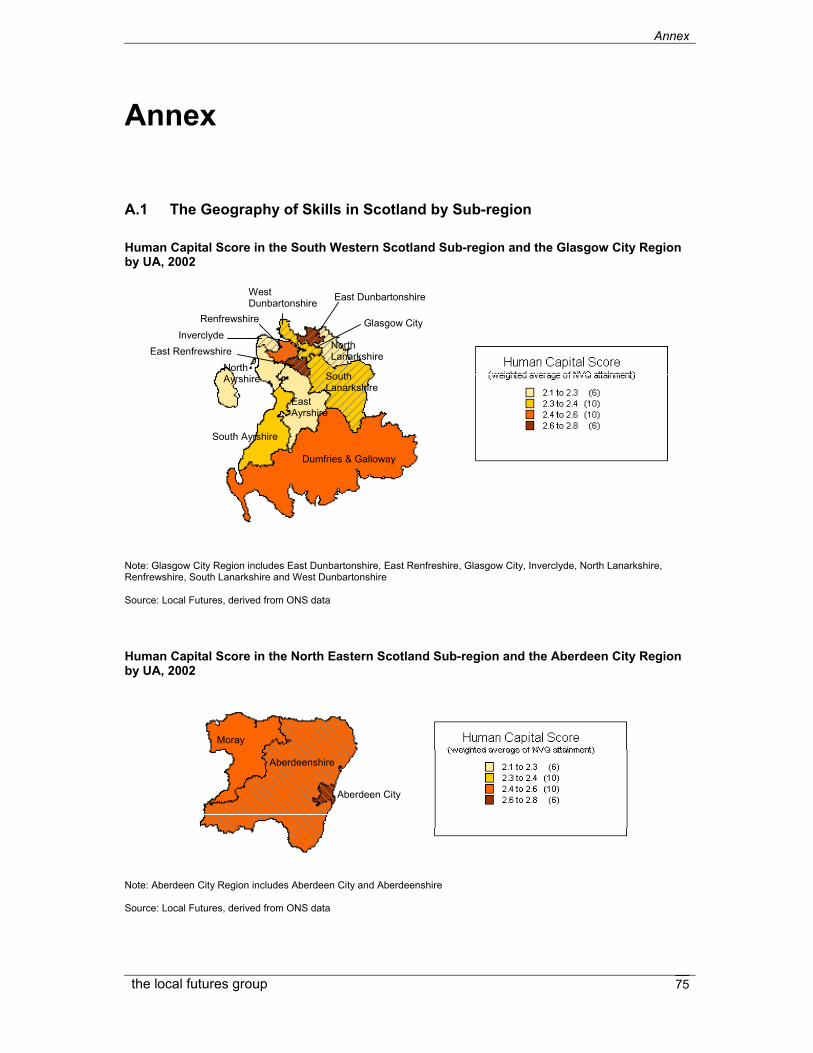
Annex
the local futures group
75
Annex
A.1 The Geography of Skills in Scotland by Sub-region Human Capital Score in the South Western Scotland Sub-region and the Glasgow City Region by UA, 2002
Note: Glasgow City Region includes East Dunbartonshire, East Renfreshire, Glasgow City, Inverclyde, North Lanarkshire, Renfrewshire, South Lanarkshire and West Dunbartonshire Source: Local Futures, derived from ONS data Human Capital Score in the North Eastern Scotland Sub-region and the Aberdeen City Region by UA, 2002 Note: Aberdeen City Region includes Aberdeen City and Aberdeenshire Source: Local Futures, derived from ONS data
Dumfries & Galloway
South Lanarkshire
South Ayrshire
East Ayrshire
North Ayrshire
North Lanarkshire
Renfrewshire
West Dunbartonshire East Dunbartonshire
Glasgow City Inverclyde
East Renfrewshire
Moray
Aberdeen City
Aberdeenshire

Annex
the local futures group
76
Human Capital Score in the Eastern Scotland Sub-region and the Dundee and Edinburgh City Regions by UA, 2002
Note: Dundee City Region includes Angus, Dundee City, Perth & Kinross and Fife. Edinburgh City Region includes City of Edinburgh, East Lothian, Midlothian, West Lothian, Fife and Scottish Borders Source: Local Futures, derived from ONS data Human Capital Score in the Highlands & Islands Sub-region by UA, 2002
Fife
Midlothian
Scottish Borders
Angus Perth & Kinross
Dundee City
Stirling
West Lothian
Falkirk East Lothian
Edinburgh City
Fife
Clackmannanshire
Eilean Siar
Highland
Orkney Shetland
Argyll and Bute
Source: Local Futures, derived from ONS data
Midlothian

Annex
the local futures group
77
A.2 Distribution of Employment in Knowledge-Intensive Sectors (K1 & K2, private sector) by UA
Distribution of Employment in Knowledge-Intensive Sectors in the South Western Scotland Sub-region and the Glasgow City Region by UA, 2002
Note: Glasgow City Region includes East Dunbartonshire, East Renfreshire, Glasgow City, Inverclyde, North Lanarkshire, Renfrewshire, South Lanarkshire and West Dunbartonshire Source: Local Futures, derived from ONS data Distribution of Employment in Knowledge-Intensive Sectors in the North Eastern Scotland Sub-region and the Aberdeen City Region by UA, 2002
Note: Aberdeen City Region includes Aberdeen City and Aberdeenshire Source: Local Futures, derived from ONS data
Aberdeenshire
Dumfries & Galloway
South Lanarkshire
South Ayrshire
East Ayrshire
North Ayrshire
North Lanarkshire
Renfrewshire
West Dunbartonshire East Dunbartonshire
Glasgow City
East Renfrewshire
Inverclyde
Moray
Aberdeen City
Aberdeenshire

Annex
the local futures group
78
Distribution of Employment in Knowledge-Intensive Sectors in the Eastern Scotland Sub-region and the Dundee and Edinburgh City Regions by UA, 2002
Note: Dundee City Region includes Angus, Dundee City, Perth & Kinross and Fife. Edinburgh City Region includes City of Edinburgh, East Lothian, Midlothian, West Lothian, Fife and Scottish Borders Source: Local Futures, derived from ONS data Distribution of Employment in Knowledge-Intensive Sectors in the Highlands & Islands Sub-region by UA, 2002
Scottish Borders
Angus Perth & Kinross
Falkirk
Source: Local Futures, derived from ONS data
Eilean Siar
Highland
Orkney Shetland
Argyll and Bute
Fife Stirling
Clackmannanshire West Lothian
East Lothian
Edinburgh City
Midlothian Scottish Borders
Dundee City
Angus Perth & Kinross
Falkirk

Annex
the local futures group
79
A.3 Percent Share of total Employment in Knowledge-Intensive Sectors (K1 & K2, private sector) by UA
% Share of Employment in Knowledge-Intensive Sectors in the South Western Scotland Sub-region and the Glasgow City Region by UA, 2002
Note: Glasgow City Region includes East Dunbartonshire, East Renfreshire, Glasgow City, Inverclyde, North Lanarkshire, Renfrewshire, South Lanarkshire and West Dunbartonshire Source: Local Futures, derived from ONS data % Share of total Employment in Knowledge-Intensive Sectors in the North Eastern Scotland Sub-region and the Aberdeen City Region by UA, 2002
Note: Aberdeen City Region includes Aberdeen City and Aberdeenshire Source: Local Futures, derived from ONS data
Dumfries & Galloway
South Lanarkshire
South Ayrshire
East Ayrshire
North Ayrshire
North Lanarkshire
Renfrewshire
West Dunbartonshire East Dunbartonshire
Glasgow City Inverclyde
East Renfrewshire
Moray
Aberdeen City
Aberdeenshire

Annex
the local futures group
80
% Share of total Employment in Knowledge-Intensive Sectors in the Eastern Scotland Sub-region and the Dundee and Edinburgh City Regions by UA, 2002
Note: Dundee City Region includes Angus, Dundee City, Perth & Kinross and Fife. Edinburgh City Region includes City of Edinburgh, East Lothian, Midlothian, West Lothian, Fife and Scottish Borders Source: Local Futures, derived from ONS data % Share of total Employment in Knowledge-Intensive Sectors in the Highlands & Islands Sub-region by UA, 2002
Scottish Borders
Angus Perth & Kinross
Dundee City
Stirling
West Lothian
Falkirk East Lothian
Edinburgh City
Midlothian
Fife
Clackmannanshire
Eilean Siar
Highland
Orkney Shetland
Argyll and Bute
Source: Local Futures, derived from ONS data Source: Local Futures, derived from ONS data

Annex
the local futures group
81
A.4 Distribution of the English Regional Knowledge Economies, 2002
East of England
East Midlands
Distribution of the Business Knowledge Economy in the EE, by TTWA
Luton
Harlow
NorwichCam
bridg
e
Stevenag
e
Southe
nd
0%5%
10%15%20%25%30%35%40%45%50%
% o
f reg
iona
l KE
em
ploy
men
t
Distribution of the Business Knowledge Economy in the EM, by TTWA
Nottingham
LeicesterDerby
Northampton
LoughboroughMansfield
0%5%
10%15%20%25%30%35%40%45%50%
% o
f reg
iona
l KE
empl
oym
ent
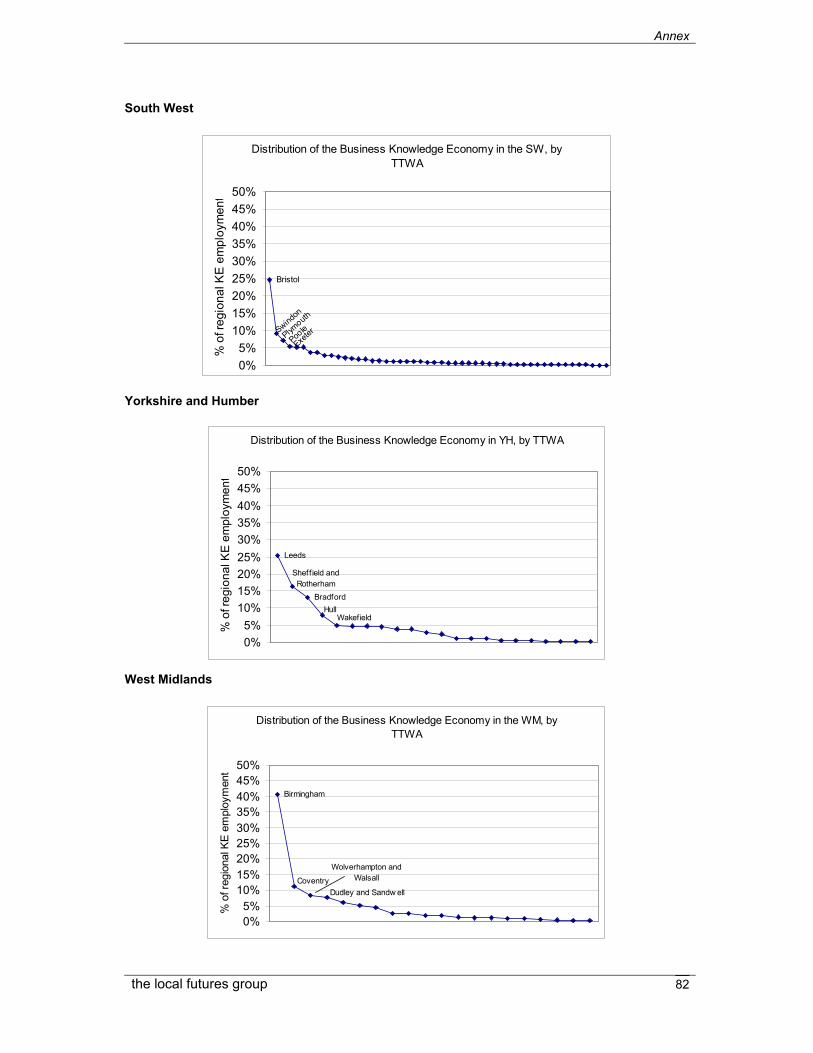
Annex
the local futures group
82
South West
Yorkshire and Humber
West Midlands
Distribution of the Business Knowledge Economy in the WM, by TTWA
Birmingham
Coventry
Wolverhampton and Walsall
Dudley and Sandw ell
0%5%
10%15%20%25%30%35%40%45%50%
% o
f reg
iona
l KE
em
ploy
men
t
Distribution of the Business Knowledge Economy in YH, by TTWA
Leeds
Bradford
WakefieldHull
Sheff ield and Rotherham
0%5%
10%15%20%25%30%35%40%45%50%
% o
f reg
iona
l KE
em
ploy
men
t
Distribution of the Business Knowledge Economy in the SW, by TTWA
ExeterPoo
leSwindon
Plymouth
Bristol
0%5%
10%15%20%25%30%35%40%45%50%
% o
f reg
iona
l KE
em
ploy
men
t

Annex
the local futures group
83
North East
North West
South East
Source: The Local Futures Group, derived from ABI data
Distribution of the Business Knowledge Economy in the NE by TTWA
Tyneside
Middlesbrough and Stockton
Sunderland and Durham
0%5%
10%15%20%25%30%35%40%45%50%
% o
f reg
iona
l KE
em
ploy
men
t
Distribution of the Business Knowledge Economy in the NW by TTWA
Manchester
BlackpoolPreston
Wirral and ChesterWarringtonLiverpool
0%5%
10%15%20%25%30%35%40%45%50%
% o
f reg
iona
l KE
empl
oym
ent
Distribution of the Business Knowledge Economy in the SE, by TTWA
Slough and Woking
Guildford and Aldershot
Craw leyReading
0%5%
10%15%20%25%30%35%40%45%50%
% o
f reg
iona
l KE
em
ploy
men
t

Annex
the local futures group
84
A.5 Definitions of Benchmark Indicators Title Description Source Publisher Year
Economic Architecture Average gross weekly earnings
The mean average amount earned weekly, gross of tax. The New Earnings Survey (NES) is an annual, workplace-based sample survey conducted by the ONS.
New earnings survey - occupation
Nomis 2003
Employment rate
The proportion of people aged 16-59/64 (men/women) in employment. This data comes from the Annual Local Labour Force Survey which is an annual residence-based sample survey.
Annual Local Area Labour Force Survey
ONS, Sub National Data Service
Mar' 01 to Feb' 02
Employment in K1 – K4 sectors
The proportion of the workforce by K1, K2, K3, K4 sectors. Please see Chapter 3 for a detailed explanation and sector composition of K1 to K4 sectors.
Annual Business Inquiry
Nomis 2001
Employment in K1 – K4 sectors, private sector
The proportion of the workforce employed in the private sector by K1, K2, K3, K4 sectors. Please see Chapter 3 for a detailed explanation and sector composition of K1 to K4 sectors. Public sector industries excluded [the public sector is defined as: public administration and defence (SIC 75), education (SIC 80), health and social work (SIC 85)].
Annual Business Inquiry
Nomis 2001
NVQ/SVQ qualifications
The proportion of the working age population qualified to level NVQ/SVQ 4+, NVQ/SVQ 3, NVQ/SVQ 2, NVQ/SVQ 1 and below
Annual Local Area Labour Force Survey
ONS, Sub National Data Service
2001
Knowledge-intensive industries Proportion of employment in Knowledge-driven sectors
The proportion of all employed persons working in the following "Knowledge-driven" sectors: Aerospace (35.3), Electric machinery and optical equipment (30, 32, 33), Printing, publishing, recorded media (22.11-22.22), Chemicals (24), Energy (11, 23, 40, 41), Telecomms, computer & related services, R&D (72, 73, 64.2, 64.12), Finance, business services (65, 67, 74 (excluding 74.7, 74.82)), Air transport services (82), & Recreational & cultural services (92). All figures in brackets are 1992 Standard Industrial Classification (SIC) codes. The ABI produces annual workplace estimates based on the Inter Departmental Business Register (IDBR). This sector definition was derived from OECD and Eurostat definitions for knowledge-driven sectors by bringing together knowledge-driven production and knowledge-driven services.
Annual Business Inquiry
Nomis 2002
Proportion of employment in public services
The proportion of all employed persons working in the following "Public services": Public admin/defence (75); Education (80); Health and social work (85). All figures in brackets are 1992 Standard Industrial Classification (SIC) codes. The ABI produces annual workplace estimates based on the Inter Departmental Business Register (IDBR).
Annual Business Inquiry
Nomis 2002
Change in employment in Knowledge-driven Sectors
Percentage change between 1993 and 2001 in the number of persons working in "Knowledge-driven" sectors as defined above. The ABI produces annual workplace estimates based on the Inter Departmental Business Register (IDBR). The ABI replaced the AES in 1998.
Annual Business Inquiry; Annual Employment Survey
Nomis 1993-2002
Proximity to research departments
This is a weighted measure of the number of research departments in a district. The number is created by counting every recognised research department in the district (weighted by 1) and every other recognised research department in the sub-region (weighted by .75).
HERO Research Assessment Exercise 2001
HERO – Higher Education and Research Opportunities
2001
Skills and Learning Human Capital Index
The Human Capital Index (HCI) is a weighted average NVQ/SVQ for an area. This indicator shows the average qualification of the working age in an area, by first calculating the proportion of people qualified at each NVQ/SVQ level, and then weighted each proportion as follows; below NVQ/SVQ2 [unweighted], NVQ/SVQ2*2, NVQ/SVQ3*3, NVQ/SVQ4*4. The
Annual Local Area Labour Force Survey
ONS, Sub National Data Service
Mar' 01 to Feb' 02

Annex
the local futures group
85
regional and national averages are calculated from the district averages (and therefore slightly differ from the REA values)
% of students gaining 5+ GCSEs (A*-C)
The percentage of 15 years olds achieving 5 or more GCSE's at grades A*-C. As results for England are only available at LEA level, district results are based on the LEA for which they belong to. Figures for Scotland include 15 years olds achieving Standard Grade at 1-3, Intermediate 2 at A-C & Intermediate 1 at A-B.
Key DfES Statistics for Local Education Authorities; GCSE/GNVQ and GCE A, AS, AVCE and Advanced GNVQ Results [Wales]; Scottish GCSE data ordered from Qualifications and School Leavers Statistics unit
DfES; Welsh Assembly; Scottish Executive
2001-2002
Graduate attraction and retention
First destination of graduates after university, workplace based. We are using two different indicators: first the % of graduates who move into the area relative to the total population in that area; secondly, the % of graduates moving into an area relative to the total number of graduates.
HESA First Destination Survey; Census 2001
HESA Academic year 2001/02; 2001 population
Enterprise Businesses per 000 population
The number of enterprises registered for VAT per 000 population. This data is derived from annual workplace estimates based on the Inter Departmental Business Register (IDBR).
Business start-ups and closures: VAT registrations and deregistrations in 2001
Small Business Services
2003
New business formation rate
The percentage of businesses that have registered for VAT within the last year. This data is derived from annual workplace estimates based on the Inter Departmental Business Register (IDBR).
Business start-ups and closures: VAT registrations and deregistrations in 2001
Small Business Services
2002
New business survival rate (36 months from 1998)
The proportion of businesses still registered for VAT 36 months after their initial registration. This is based on registrations and deregistrations of VAT-based enterprises, and is calculated from data collected from the Inter-Departmental Business Register (IDBR).
Survival rates of VAT registered businesses
Small Business Services
1998-2001
Average business size
The average number of employees per business. The ABI produces annual workplace estimates based on the Inter Departmental Business Register (IDBR).
Annual Business Inquiry
Nomis 2002
Change in total VAT registered business stock
Percentage change between 1994 and 2002, in the number of enterprises registered for VAT at the start of the year. This is an indicator of the change in the number of business start-ups. It excludes most of the very smallest one-person businesses. Thisdata is derived from annual workplace estimates based on the Inter Departmental Business Register (IDBR).
Business start-ups and closures: VAT registrations and deregistrations in 2001
Small Business Services
1994-2002
Concentration of Business and Communication services as % of total employment
% of employment in business and communication services as a proportion of total employment.
Annual Business Inquiry
Nomis 2001
% of employment in R&D, polling and market research
% of employment in R&D, polling and market research sectors as a proportion of total employment.
Annual Business Inquiry
Nomis 2002

Annex
the local futures group
86
Connectivity Travel time to nearest regional airport
This indicator provides a figure for the time taken to travel by car from the geographical centre of the local authority district to the nearest regional airport. Travel time is based on travel speed assumptions of 60 miles per hour on major roads and 30 miles per hour on minor roads.
Route Planner The AA 2004
Rail Connectivity
Rail connectivity is a measure of the number of rail stations in a district weighted by their function (mainline, hub, spoke or metro rail services) relative to the geographic area that the district covers (in square kilometres). The score is a rank out of 408 Local Authorities, Counties and Unitary Authorities.
GBPro; Network Rail
Bartholomew 2001
Cultural amenities per 1000 sq km, GB=100
Cultural amenities is a count of the number of cinema seats, theatres and libraries in a district.
BFI Film & Television Handbook 2003; UK Theatres Online; DfEE
BFI; UK Theatres Online
2002; 2003; 2001

References
the local futures group
87
References
Begg, D. and Docherty, I. (2003) Restructuring Transport Planning in Scotland, Scottish Affairs 45 (Autumn) 128-156.
Boulding, K (1963) The Knowledge Industry, Challenge, May, pp. 36-38.
Castells, M (1996) The Rise of the Networked Society, Oxford: Blackwell.
Drucker, P (1993) Post-Capitalist Society, Oxford: Butterworth-Heinemann.
Florida, R (2002) The Rise of the Creative Class, New York: Basic Books.
Gertler, M (2001) Flows of People, Capital and Ideas, ISUMA (Autumn), pp. 119-130.
Glaeser, E (1998) “Are cities dying?” Journal of Economic Perspectives, 12, pp.139-160.
Lucas, R (1988) “On the mechanics of economic development”, Journal of Monetary Economics, 22, pp1-42.
McMillan, J (2002) Reinventing the Bazaar: A Natural History of Markets, London; WW. Norton & Co.
OECD (1996) The Knowledge-based Economy, Paris: OECD.
Porter, M (1990) The Competitive Advantage of Nations, New York: Free Press.
Quah, D (1999) “The Weightless Economy in Economic Development”, Centre for Economic Performance, Discussion Paper No. 417, London School of Economics.
Stiglitz, J (2000) “The Contributions of the Economics of Information to XX Century, Quarterly Journal of Economics, November, pp. 1441-1478.