the full, final, peer-reviewed and proofed version is
TRANSCRIPT

1
PRE-SUMBISSION VERSION 1
2
This is a pre-review version of the manuscript: 3
4
Strickland, M. A., C. T. Arsene, et al. (2010). "A multi-platform comparison of 5
efficient probabilistic methods in the prediction of total knee replacement 6
mechanics." Comput Methods Biomech Biomed Engin 13(6): 701-709. 7
8
The full, final, peer-reviewed and proofed version is available from the 9
publisher: 10
11
http://dx.doi.org/10.1080/10255840903476463 12
brought to you by COREView metadata, citation and similar papers at core.ac.uk
provided by e-Prints Soton

2
13
A Multi-Platform Comparison of Efficient Probabilistic Methods in the 14
Prediction of Total Knee Replacement Mechanics 15
16
17
M. A. Strickland1, C. T.C. Arsene
1, S. Pal
2,a, P. J. Laz
2, M. Taylor
1* 18
19 1Bioengineering Science Research Group, 20
School of Engineering Sciences, 21
University of Southampton, 22
Southampton, 23
SO17 1BJ
24
UK 25
26 2Computational Biomechanics Lab, 27
Department of Engineering, 28
University of Denver, 29
2390 S. York, 30
Denver, 31
CO 80208 32
USA 33
34
35 *Corresponding Author: 36
Professor Mark Taylor 37
Bioengineering Science Research Group, 38
University of Southampton, 39
Highfield 40
Southampton 41
SO17 1BJ 42
UK 43
Tel: ++ 44 (0)2380 597660 44
Fax: ++ 44 (0)2380 593230 45
Email: [email protected] 46
47
48
Word Count: 49
Abstract: 162 50
Introduction-Discussion: 3303 51
52
53
aCurrently, Department of Bioengineering, Stanford University, Stanford, CA

3
ABSTRACT 54
Explicit finite element (FE) and multi-body dynamics (MBD) models have been developed to evaluate total 55
knee replacement (TKR) mechanics as a complement to experimental methods. In conjunction with these 56
models, probabilistic methods have been implemented to predict performance bounds and identify important 57
parameters, subject to uncertainty in component alignment and experimental conditions. Probabilistic 58
methods, like Advanced Mean Value (AMV) and Response Surface Method (RSM), provide an efficient 59
alternative to the gold standard Monte Carlo Simulation Technique (MCST). The objective of the current 60
study was to benchmark models from 3 platforms (2 FE and 1 MBD) using various probabilistic methods by 61
predicting the influence of alignment variability and experimental parameters on TKR mechanics in 62
simulated gait. Predicted kinematics envelopes were on average about 2.6 mm for anterior-posterior (AP) 63
translation, 2.9o for internal-external (IE) rotation and 1.9 MPa for peak contact pressure for the various 64
platforms and methods. Based on the good agreement with the MCST, the efficient probabilistic techniques 65
may prove useful in the fast evaluation of new implant designs, including considerations of uncertainty, e.g. 66
misalignment. 67
68
Keywords: TKR, Kinematics, Contact mechanics, Knee mechanics, Probabilistic methods, Simulation69

4
1. Introduction 70
Computational analysis has been used in orthopaedic studies since the 1980s (e.g. Huiskes and Chao, 71
1983; Prendergast, 1997). Modelling the behaviour of total knee replacements (TKR) is challenging, as the 72
stresses generated within the prosthesis and the supporting bone are a function of the kinematics, and the 73
kinematics in turn are a function of the implant design, the relative position of the components and the 74
balance of the soft tissues. Early studies used quasi-static loading conditions, effectively ignoring the 75
influence of the dynamic kinematics of the joint. Recently, various researchers have adopted implicit (Otto 76
et al., 2001) and explicit (Godest et al 2002, Halloran et al., 2005a; Halloran et al., 2005b) FE or rigid body 77
(Fregly et al., 2003) modelling techniques to simultaneously predict kinematics and stresses. 78
Clinical and experimental simulator studies have reported substantial variability in TKR kinematics 79
(DesJardins et al., 2000; Mahaluxmivala et al., 2001; Dennis et al., 2003; Zihlmann et al., 2005). 80
Computational models have shown good agreement with experimental simulator results (Godest et al., 2002, 81
Halloran et al., 2005a; 2005b), providing important model validation as well as additional insight into 82
performance metrics that are difficult to measure experimentally (like contact pressure). While models are 83
typically developed for „average‟ conditions, they are an ideal platform to explore the influence of 84
variability, as a consequence of either patient-, surgery- or component-related parameters. Parametric studies 85
have been performed to assess model sensitivity, but these studies have typically explored the influence of 86
only one or two variables at a time (e.g. Taylor and Barrett, 2003; Elias et al., 2008; Besier et al., 2008; Li et 87
al., 2001). Probabilistic evaluations assess multiple parameters simultaneously, and represent each input 88
parameter as a distribution in order to predict an envelope of performance. In addition to accounting for 89
potential interaction effects, the probabilistic approach predicts performance bounds and sensitivity factors 90
for each input. 91
Probabilistic finite element analyses have been applied to assess the structural reliability of 92
orthopaedic components (Browne et al., 1999; Nicolella et al., 2001; Dar et al., 2002). More recently, the 93
application of efficient probabilistic techniques has been used to assess the performance of TKR (Laz et al. 94
2006a; 2006b). The advanced mean value (AMV) method (corroborated with a 1000 trial Monte Carlo 95
Simulation Technique (MCST)) assessed the impact of experimental variability in a knee wear simulator on 96

5
predicted TKR mechanics by determining the performance envelopes of joint kinematics and contact 97
parameters. In the Laz et al. (2006a) study, 8 component alignment parameters and 4 experimental 98
parameters were represented as Normal (Gaussian) distributions and used with probabilistic methods to 99
assess the response of the TKR model 100
A variety of software packages exist for FE, multi-body dynamics (MBD) and probabilistic methods. 101
This study seeks to evaluate whether model predictions would differ depending on the software platform 102
used, to evaluate the robustness of the computational and probabilistic approach. The aims of this 103
benchmark study are: to perform probabilistic TKR mechanics predictions using three different platforms 104
combining FE or MBD solvers with statistical/probabilistic analysis, and so to evaluate the accuracy and 105
efficiency of various platforms and probabilistic methods. 106
107
2. Methods 108
This study will evaluate performance envelopes for tibial anterior-posterior (AP) translation, tibial internal-109
external (IE) rotation and tibial peak contact pressure during a standard gait cycle using explicit FE and 110
rigid body modelling techniques, and will compare results of the AMV and response surface methods 111
(RSM) to those from MCST. 112
2.1 Deterministic modelling of the in-vitro simulator 113
In all three analyses, an isolated tibiofemoral joint was modelled (Figure 1). The loading conditions 114
represented the force-controlled gait simulation of a knee wear simulator (Walker et al., 1997; DesJardins et 115
al., 2000; ISO Standard 14243-1, 2000). 116
Models were developed from CAD parts of a semi-constrained, fixed-bearing, cruciate-retaining TKR. The 117
distal surface of the tibial insert was supported in the inferior-superior (IS) direction, whilst loading 118
conditions applied to the insert included an anterior-posterior (AP) load and internal-external (IE) torque. 119
The axial load was applied along the inferior superior axis and the flexion angle was applied along the 120
femoral axis. Varus-valgus (VV) and tilt of the insert were both constrained, and AP, medial-lateral (ML) 121
and IE degrees of freedom (DOF) were unconstrained. The femoral component was constrained in IE, ML 122

6
and AP DOF, unconstrained in VV and IS DOF, and displacement-controlled flexion rotation was applied. 123
There is an axial compressive force and a flexion angle applied. The model included simulated soft-tissue 124
constraint present in the knee simulator consisting of four springs constraining the insert AP displacement 125
and IE rotation (Figure 1). 126
Three different analysis packages were investigated in order to build a baseline deterministic model, 127
both to benchmark the results and to provide a platform for further stochastic modelling. 128
i) Abaqus/Explicit 129
An explicit FE model of the TKR (Laz et al., 2006a) was developed in Abaqus/Explicit (Simulia, 130
Providence, RI). The tibial insert was represented with three-dimensional, 8-nodal hexahedral elements 131
(~8500), and rigid triangular surface elements (~19,000) were used for the femoral component. A 132
convergence study was implemented before the probabilistic analysis to confirm the mesh density was 133
acceptable (Halloran et al., 2005a). The femoral and tibial components were represented as rigid bodies, 134
with a nonlinear pressure-overclosure relationship (Halloran et al., 2005b). 135
136
ii) MSC ADAMS 137
The MBD model was developed in ADAMS (MSC Software Corporation, Santa Ana, CA). The 138
deterministic study principally involved modelling with the ADAMS/View module. In order to model 139
contact, ADAMS uses an „IMPACT‟ function, which relates normal reaction force to interpenetration 140
displacement and can be used for extremely high-speed single-contact „surrogate‟ models (e.g. Lin et al., 141
2009). However, if contact-pressure information is required, then a unified single-body contact force is 142
not adequate (as it does not include information about the force distribution), so instead the articulation 143
must be „discretised‟ into multiple contacts across the surface to estimate the local contact force 144
contribution at each location. Various established penalty-based algorithms exist for such a distributed 145
contact model, for example, the elastic foundation model (Fregly et al., 2003). 146
147
iii) PAM-CRASH 148

7
An explicit FE model (Godest et al, 2002) was developed in PAM-CRASH (ESI/PAM System 149
International, France). Both the femoral component and the tibial polyethylene insert were modelled as 150
rigid bodies using four-nodded shell elements. An advanced penalty-method based contact algorithm 151
(contact element 44 in PAM-CRASH) was used to model the contact between the two components. 152
This algorithm operates by penalising the geometric penetration of the slave nodes by counteracting 153
forces proportional to the penetration depth of the tibia and a user-specified penalty factor. 154
155
2.2 Probabilistic modelling 156
Probabilistic modelling techniques are utilized to account for uncertainty in multiple input 157
parameters and to predict a distribution of performance. In the present probabilistic evaluations, twelve 158
experimental parameters (Table 1) representing component alignment, loading, and experimental conditions 159
were evaluated. The experimental parameters included four translations and four rotations of the femoral 160
component and tibial insert. The rotations and translations defined the position of the femoral component 161
and tibial insert relative to the fixed rotational axes (Figure 1). In addition, experimental set-up parameters 162
(the spring stiffness constant, the ML separation of the springs, and ML load split) and friction were also 163
included. The levels of variability (Table 1) were estimated for a knee simulator with standard deviations of 164
0.5mm for translational and 1° for rotational alignment, respectively (Laz et al., 2006a). Each of the 165
parameters was assumed to be independent and normally-distributed. 166
Analyses were performed using three probabilistic methods (MCST, RSM and AMV) in three 167
probabilistic platforms: 168
i) Nessus/Abaqus: The Nessus probabilistic software (SwRI, San Antonio, TX) was integrated with the 169
FE model through custom scripting. The AMV and MCST methods were applied. 170
ii) Insight/ADAMS: The statistical analysis module ADAMS/Insight was used with the MBD solver. 171
RSM and MCST methods were applied. 172
iii) PAM-OPT/PAM-CRASH: The optimization software PAM-OPT was used in conjunction with the 173
PAM-CRASH model. A 1000-trial MCST analysis was performed. Following this, a first order RSM 174

8
implemented in MATLAB (Mathworks, Inc., Natick, MA) was implemented with a reduced set of 175
MCST points (25, 50 and 100). 176
177
A brief description of the probabilistic methods utilized is included to highlight the differences in 178
accuracy, efficiency and robustness. MCST involves repeated sampling of the input parameters according to 179
their distributions, with the accuracy of the resulting output distribution dependent on the number of trials 180
performed. The MCST is a robust method which provides accurate results with many trials, but is 181
computationally expensive. 182
For RSM (Box and Wilson, 1951), an analytic function of the input variables is fitted to approximate 183
the output parameter over the sample space based on an initial set of model evaluations. The initial set of 184
model evaluations can be performed at random, but better results are achieved by distributing the trials 185
regularly across the sample space. In the most basic case, a low order polynomial and regression techniques 186
may be used to determine the term coefficients. Subsequently, MCST is performed using this response 187
surface equation, instead of performing additional evaluations (resulting in lower computational cost). RSM 188
works best when the output response is well-represented by the analytic function, i.e. relatively linear, 189
smooth and monotonic models; highly non-linear functions are not well-represented. The higher the order of 190
the response surface equation used, the more terms are needed; hence more samples are needed to achieve a 191
good fit with the regression. Beyond second-order terms, this becomes impractical for many models. In the 192
current study, the TKR model is expected to be relatively linear within the small perturbation range being 193
studied here; accordingly, a first order (linear) response surface equation was evaluated based on initial 194
sample sizes of 25, 50 and 100 trials and subsequent MCST of 1000 evaluations of the response surface 195
equation. 196
The AMV method is an optimization-based method utilizing a mean value approximation augmented 197
with higher-order terms to determine the response at a specified probability level (Wu, et al., 1990). 198
Although an approximate technique, the AMV method has been shown to work well for well-behaved 199
monotonic systems (Easley, 2007) and has been implemented in prediction of performance envelopes for 200
TKR (Laz et al., 2006a)). The Mean Value (MV) family of methods begin with a local first order (linear) 201

9
approximation of the function about the mean value of the input function - whereas RSM builds a global 202
model. The MV model is suitable for fairly linear problems, but is not accurate for non-linear behaviour; its 203
main practical use is as the basis for the subsequent AMV. The AMV method takes the linear model derived 204
by the MV method, and attempts to include corrective terms to approximate the higher-order effects. More 205
exactly, it takes the MV prediction and using data from the calculated Most Probable Point (MPP) of 206
interest, corrects this value for a single level of desired probability (or desired output) which gives the 207
corrected AMV estimate of the output. The calculated MPP is the global maximum of the probability 208
distribution function of all the possible different points of failure along a „limit state‟ (i.e. failure) function. 209
The AMV essentially gives a more accurate representation at one localised point of the possibility space, 210
whereas RSM gives a less accurate representation, but is valid across the entire possibility space. 211
For each platform, the results of the combined probabilistic/mechanical modelling were a bounded 212
response representing the 1st and 99
th percentiles over the gait cycle for the performance metrics: AP 213
translation, IE rotation and peak CP. AP translation and IE rotation are reported relative to the „settled‟ 214
reference positions of the components. Additionally, sensitivity factors, representing the effect of varying 215
each input parameter on the output response, identify the most and least important parameters. The 216
sensitivities at each time point were calculated as the linear regression-fit of the input variables 217
(„normalised‟ based on standard deviations) to the MCST results. The absolute magnitude of the sensitivity 218
values at each time point were then averaged over the gait cycle to give a mean absolute value. To provide 219
an overall indication of importance, the reported sensitivity factors are the normalised, averaged absolute 220
values over the gait cycle. 221
222
3. Results 223
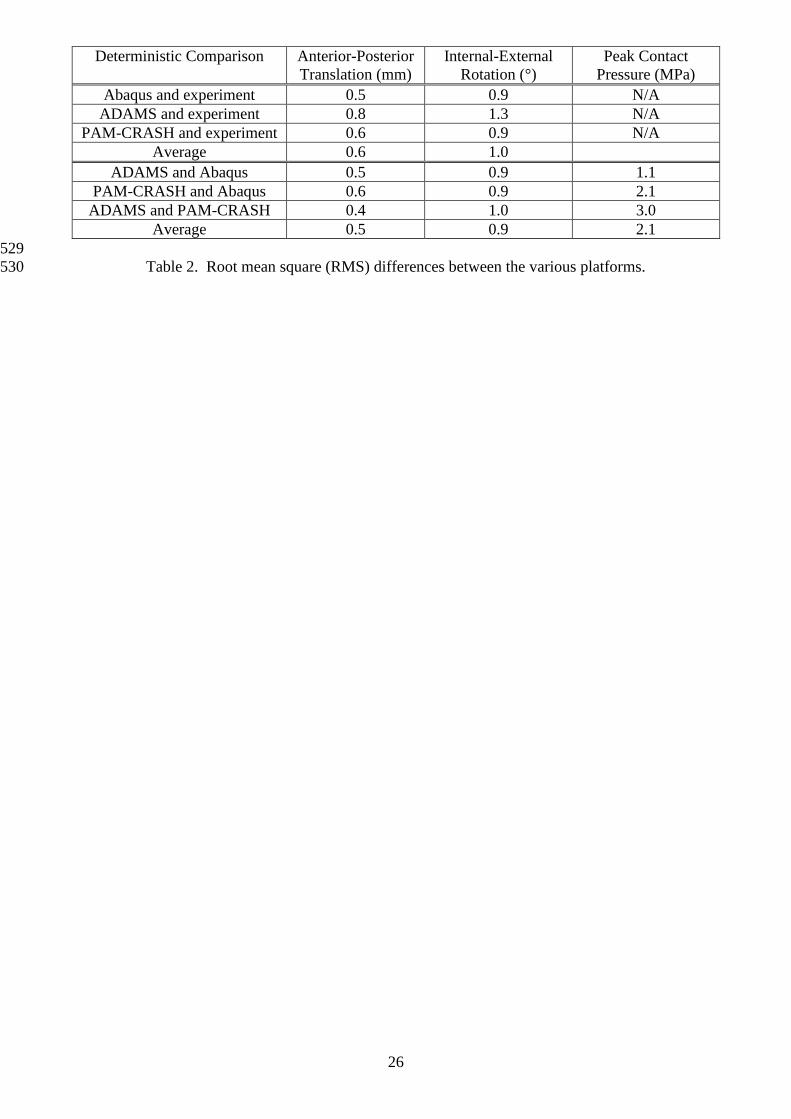
3.1 Comparison of the deterministic results 224
The deterministic results for AP translation, IE rotation and peak CP showed good agreement 225
between the Abaqus, ADAMS and PAM-CRASH platforms and with the experimental results (Figure 2). To 226
quantify the differences between the different model results and the experimental data, the Root Mean 227

10
Square (RMS) variations over the gait cycle were computed between each model and the experimental data 228
and between models (Table 2). RMS differences between model and experiment averaged 0.6 mm and 1.0o 229
for AP translation and IE rotation, respectively. RMS differences between models were of a similar 230
magnitude. While the general behaviour in predicted peak CP pressure was similar for all models, there were 231
differences in the predicted magnitude, mainly due to the difference in contact formulations between 232
platforms. 233
Computation time for an analysis was approximately 3 minutes in Abaqus/Explicit (Intel Pentium 4 234
3GHz, 2Gb RAM), 4 minutes in PAM-CRASH (Intel Pentium 4 3.20GHz, 2Gb RAM) and 6 minutes in 235
ADAMS (Intel Pentium 4 3GHz, 2Gb RAM). Notably, for all three platforms, the analysis time is 236
sufficiently low to allow larger-scale probabilistic studies. 237
238
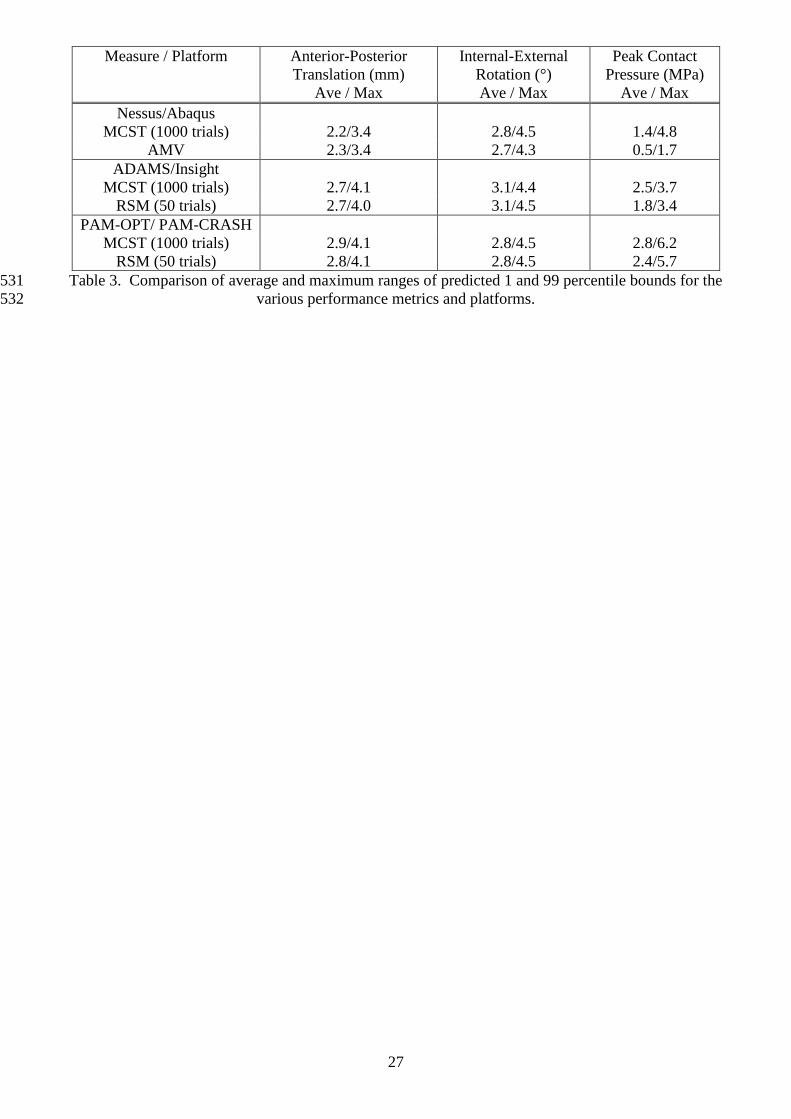
3.2 Comparison of the probabilistic results 239
Envelopes of the 1% to 99% bounds were predicted for the TKR performance measures using the three 240
platforms: Nessus/Abaqus, Insight/ADAMS, PAM-OPT/PAM-CRASH. The MCST comparisons (Figure 3) 241
showed good agreement in trend and performance envelope size for the various platforms. Similar behaviour 242
was observed for the response surface and AMV methods (Figures 4 and 5). 243
The differences between the methods (MCST versus AMV and MCST versus RSM) for the average 244
and the maximum bounds for the various platforms (Table 3) were within 5% for kinematics. On average, 245
envelope sizes were within approximately 2.6 mm for AP translation and 2.9o for IE rotation. For all 246
platforms, the kinematic envelopes were larger during stance than swing phase. While differences in the 247
magnitudes of peak CP were present from the deterministic models, the MCST probabilistic bounds were 248
similarly shaped, with differences between the smallest average and the largest average peak contact 249
pressure of 1.3 MPa: 1.4 MPa for Nessus/Abaqus, 2.5 MPa for ADAMS/Insight and 2.8 MPa for PAM-250
OPT/PAM-CRASH. 251
The RSM was evaluated to characterize the sensitivity of the response surface equation to the 252
number of initial trials, specifically 25, 50 and 100 trials using PAM-OPT/PAM-CRASH and 253
Insight/ADAMS platforms (Figure 4). The kinematic (AP and IE) results for PAM-OPT/PAM-CRASH 254

11
showed agreement between all RSM models and the MCST results, implying that an RSM based on 25 trials 255
was sufficient. However, the RSM predictions of peak CP were more sensitive to the number of trials used. 256
While good agreement could be achieved with PAM-OPT/PAM-CRASH for the maximum value of peak 257
CP over the gait cycle using the 100 trial RSM, the secondary peak at 10% gait, and the lower swing phase 258
pressures were not well captured (Figure 4c). For the Insight/ADAMS platform, similar RSM results were 259
observed where 25 trials were sufficient to model kinematics (Table 3), but 100 trials were not sufficient to 260
characterize the swing phase (Figure 4d). Similar results were observed for the AMV method (Figure 5, 261
Table 3), where maximum differences in the size of the predicted AP and IE ranges were 0.07 mm and 0.18° 262
for the AMV and MCST methods. As contact pressure during swing phase exhibits more non-linear 263
behaviour, approximate methods like RSM and AMV were less accurate (Figures 4 and 5). Regarding 264
computation time, MCST (1000 trials) ranged from 50-100 hours, AMV results for a single performance 265
measure (173 trials) required ~9 hours, RSM (25 trials) required 2 hours and RSM-100 required 8 hours. 266
The sensitivities, reported as average of the absolute values over the gait cycle (Figure 6), illustrated 267
the relative impact of the parameters on AP translation, IE rotation and peak CP. For AP translation and IE 268
rotation, good agreement in important parameters and their magnitudes was obtained with the three software 269
platforms. Insert tilt and femoral IE alignment were the most important parameters affecting AP translation 270
and IE rotation respectively. The sensitivity factors for peak CP identified four contributing parameter with 271
relatively equal contributions: initial femoral flexion-extension, femoral IE, insert tilt and VV alignment. 272
273
3. Discussion 274
In this benchmarking study, predictions of TKR performance under simulated gait conditions were 275
performed with three FE/MBD platforms using different probabilistic methods. By comparing the results 276
from the various platforms, this study evaluated whether the choice of computational platform affected the 277
predicted results, as well as the accuracy and efficiency of the MCST, RSM and AMV probabilistic 278
methods. 279
Notably, the deterministic results for AP translation, IE rotation and peak CP obtained using FE and 280
MBD software platforms showed similar patterns throughout the gait cycle and were in close agreement 281

12
with experimental kinematic data and between platforms (Figure 2). The RMS differences between the 282
models were on average of 0.5 mm in AP translation and 0.9o in IE rotation. Greater differences were 283
observed in peak CP than in the kinematic measures, with RMS difference being up to 2.1 MPa between 284
PAM-CRASH and Abaqus. The highest difference was between ADAMS and PAM-CRASH of 3.0 MPa. 285
Differences in the magnitude of CP were attributed to the different software platforms and the methods of 286
implementing contact in a rigid body simulation. Factors which are complicit in these differences include the 287
contact model parameters, the frictional parameters, and the effects of inertia within the software platforms. 288
Nonetheless, in spite of these small differences, overall the trends and magnitudes of the responses matched 289
favourably. 290
Supported by the accuracy of the deterministic results and fast computational times, probabilistic 291
analyses were performed using thee platforms: Nessus/Abaqus, Insight/ADAMS and PAM-OPT/PAM-292
CRASH. MCST was carried out for all models and predicted similarly sized performance envelopes were 293
obtained for the kinematics in all three methods. Larger differences were observed in the 1% and 99% 294
envelopes for peak CP, but these are again attributed to deterministic model differences than probabilistic 295
methods. MCST computational times were similar for the three different platforms. 296
The increased computational times associated with probabilistic FE/MBD modelling represent an 297
important barrier to incorporating such techniques in the design-phase evaluation of TKR implants. For 298
example, the 1000-trial MCST implemented in PAM-CRASH/PAM-OPT required 4 days of computational 299
time. This highlights the need to implement and validate more efficient alternatives to the „gold standard‟ of 300
MCST. Comparison of RSM envelope sizes to MCST yielded an average difference of 0.08 mm (2.9%) and 301
0.03o (1.0%) in AP translation and IE rotation, respectively (Figures 4a and 4b, Table 3) and computational 302
costs substantially reduced to 4 hours for the 50-trial RSM analysis. Similarly, comparison of AMV 303
envelopes to MCST in Nessus/Abaqus yielded an average difference of 0.08 mm (3.7%) and 0.1° (3.6%) in 304
AP translation and IE rotation, respectively (Figure 5, Table 3). The computational time required for the 305
AMV analyses were ~9 hours. It is important to note that the RSM and AMV methods are less robust for 306
highly non-linear or non-monotonic systems. This explains the greater differences in CP results during the 307

13
swing phase (Figures 4c, 4d and 5c), when minimal constraint (due to small joint loads) resulted in a more 308
non-linear system. 309
The efficient RSM and AMV methods provide distinct advantages compared to one another. The 310
AMV method provides local approximation of system behaviour at pre-defined points in the possibility 311
space, while RSM presents a global approximation across the entire possibility space. The RSM is less 312
accurate than AMV at targeted local design point(s), but is more flexible than AMV in predicting behaviour 313
across the entire possibility space. An RSM analysis requires a fixed number of trials regardless of the 314
number of desired output measures; in contrast, an AMV analysis requires an additional trial for every 315
desired output measure (e.g. AP translation, IE rotation, or CP) and probability level (e.g. 1% or 99%). 316
Independent of platform, the sensitivity factors identified the same set of important input parameters 317
(Figure 6). Specifically, insert tilt was the greatest contributor to AP translation, while femoral IE alignment 318
had the largest sensitivity factor for IE rotation. In addition to insert tilt and femoral IE alignment, two other 319
alignment parameters were important to contact pressure. These factors have been identified in clinical 320
studies [Catani et al., 2006; Anouchi et al., 1993] and underscore the importance of component alignment to 321
TKR mechanics. 322
In closing, this study performed benchmark comparisons of FE and MBD, as well as probabilistic 323
software packages and generally found good agreement in results independent of the methods. Our results 324
suggest that researchers can use both FE and MBD-based approaches and probabilistic methods besides 325
MCST, with confidence that the results will be comparable across different platforms. The accuracy of the 326
efficient probabilistic methods, e.g. RSM and AMV, can aid in the quicker design phase evaluation of the 327
robustness of TKR implants to surgical and environmental variables. 328
329
4. References 330
Anouchi YS, Whiteside LA, Kaiser AD, Milliano MT. “The effects of axial rotational alignment of the 331
femoral component on knee stability and patellar tracking in total knee arthroplasty demonstrated on 332
autopsy specimens”. Clinical Orthopaedics and Related Research. 1993;287:170–177. 333
Besier TF, Gold GE, Delp SL. “The influence of femoral internal and external rotation on cartilage stresses 334
within the patellofemoral joint”. Journal of Orthopaedic Research. 2008; Vol. 26:1627–1635. 335

14
Box GEP, Wilson KB. “On the experimental attainment of optimum conditions”. Journal Royal Statistical 336
Society Series B, 1951. 13, 1–45. 337
Browne, M., Langley, R.S., Gregson, P.J.. "Reliability theory for load bearing biomedical implants”. 338
Biomaterials. 1999. Vol. 20, 1285-1292. 339
Catani F, Fantozzi S, Ensini A, Leardini A, Moschella D. and Gianninni S. “Influence of tibial component 340
posterior slope on in vivo knee kinematics in fixed-bearing total knee arthroplasty”. Journal of 341
Orthopaedic Research. 2006; Vol. 24: 581–587. 342
Dar, F.H., Meakin, J.R., Aspden, R.M., 2002. "Statistical methods in finite element analysis." Journal of 343
Biomechanics 35(9), 1155-1161. 344
Dennis, D.A., Komistek R.D., Mahfouz, M.R. 2003. “In vivo fluoroscopic analysis of fixed-bearing total 345
knee replacements”. Clinical Orthopaedics and Related Research. 410, 114–130. 346
DesJardins, J.D., Walker, P.S., Haider, H., Perry, J., 2000. "The use of a force-controlled dynamic knee 347
simulator to quantify the mechanical performance of total knee replacement designs during 348
functional activity". Journal of Biomechanics 33, 1231-1242. 349
Dorr, L.D. and R.A. Boiardo, 1986. “Technical considerations in total knee arthroplasty”. Clinical 350
Orthopaedics and Related Research 205, 5–11. 351
Elias, J.J., Rai, S.P., Ciccone II W.J., 2008. "In vitro comparison of tension and stiffness between hamstring 352
tendon and patella tendon grafts". Journal of Orthopaedic Research 26(11), 1506-1511. 353
Fregly, B.J., Bei, Y., Sylvester, M.E., 2003. “Experimental evaluation of an elastic foundation model to 354
predict contact pressures in knee replacements”, Journal of Biomechanics 36, 1659-1668. 355
Easley, S.K., Pal, S., Tomaszewski, P.R., Petrella, A.J., Rullkoetter, P.J., Laz, P.J., 2007. Finite element-356
based probabilistic analysis tool for orthopaedic applications. Computer Methods and Programs in 357
Biomedicine 85, 32-40. 358
Fregly, B.J., Sawyer, W.G., Harman, M.K and S.A. Banks, 2005. “Computational wear prediction of a total 359
knee replacement from in vivo kinematics”, Journal of Biomechanics 38, 305-314. 360
Godest, A.C., Beaugonin, M., Haug, E., Taylor, M., Gregson, P.J., 2002. "Simulation of a knee joint 361
replacement during gait cycle using explicit finite element analysis." Journal of Biomechanics 35, 362
267-275. 363
Halloran, J.P., Petrella, A.J., Rullkoetter, P.J., 2005a. "Explicit finite element modelling of total knee 364
replacement mechanics." Journal of Biomechanics 38, 323-331. 365
Halloran, J.P., Easley, S.K., Petrella, A.J., Rullkoetter, P.J., 2005b. "Comparison of deformable and elastic 366
foundation finite element simulations for predicting knee replacement mechanics.” Journal of 367
Biomechanical Engineering 127, 813-818. 368
Huiskes, R. and Chao, E. Y. S., 1983, A survey of finite element analysis in orthopaedics biomechanics: the 369
first decade, Journal of Biomechanics 16, 385-409. 370
Li, G., Lopez, O., Rubash, H., 2001. “Variability of a three-dimensional finite element model constructed 371
using magnetic resonance images of a knee for joint contact stress analysis“. Journal of 372
Biomechanical Engineering 123, 341-346. 373
Isukapalli, S.S., Balakrishnan, S., and Georgopoulos. P., 2004. “Computationally efficient uncertainty 374
propagation and reduction using the stochastic response surface method.” 43rd IEEE Conference on 375
Decision and Control, Atlantis, Bahamas. 376
ISO Standard 14243-2, 2000. "Wear of total knee-joint prostheses, part 2: methods of measurements." 377
International Standards Organization. 378
McEwen, H.M.J., Fisher, J., Goldsmith, A.A., Auger, D.D., Hardaker C. and Stone, M.H., 2001. “Wear of 379
fixed bearing and rotating platform mobile bearing knees subjected to high levels of internal and 380
external tibial rotation“. Journal of Materials Science: Materials in Medicine 12(10-12), 1049-1052. 381
Otto, K., J.J. Callaghan and T.D. Brown, 2001. “Mobility and contact mechanics of a rotating platform total 382
knee replacement”. Clinical Orthopaedics and Related Research 392, 24–37. 383
Prendergast, P.J., 1997, Finite element models in tissue mechanics and orthopedic implant design, Clinical 384
Biomechanics 12 (6), 343-366. 385
Kawanabe, K., Clarke, I.C., Tamura, J., Akagi, M., Good, V.D., Williams, P.A., Yamamoto, K., 2001. 386
"Effects of A-P translation and rotation on the wear of UHMWPE in a total knee joint simulator." 387
Journal of Biomedical Materials Research 54, 400-406. 388

15
Kurth, R.E., Woods, K.S., 1992. "Probabilistic damage tolerant analysis for fatigue critical aircraft 389
components." ASME, Aerospace Division 28, 89-97. 390
Laz, P.J., Pal, S., Halloran, J.P., Petrella, A.J., Rullkoetter, P.J., 2006a. "Probabilistic finite element 391
prediction of knee wear simulator mechanics.” Journal of Biomechanics 39, 2303-2310. 392
Laz, P.J., Pal S., Fields, A., Petrella, A.J. and Rullkoetter, P. J., 2006b, “Effects of knee simulator loading 393
and alignment variability on predicted implant mechanics: a probabilistic study”, Journal of 394
Orthopaedic Research 24, 2212-2221. 395
Lin, Y.C., Haftka R.T., Queipo, N.V., Fregly, B.J., 2009. “Two-Dimensional Surrogate Contact Modeling 396
for Computationally Efficient Dynamic Simulation of Total Knee Replacements.” Journal of 397
Biomechanical Engineering 131, 041010-1. 398
Mahaluxmivala, J, Bankes, M.J., Nicolai, P., Aldam, C.H., Allen, P.W., 2001. “The effect of surgeon 399
experience on component positioning in 673 Press Fit Condylar posterior cruciate-sacrificing total 400
knee arthroplasties.” Journal of Arthroplasty 16 (5), 635-675. 401
McEwen, H.M., Barnett, P.I., Bell, C.J., Farrar, R., Auger, D.D., Stone, M.H., Fisher, J., 2001. “The 402
influence of design, materials and kinematics on the in vitro wear of total knee replacements.” 403
Journal of Biomechanics 38, 357-365. 404
Melis, M.E., Zaretsky, E.V., August, R., 1999. ”Probabilistic analysis of aircraft gas turbine disk life and 405
reliability.” Journal of Propulsion and Power 15(5), 658-666. 406
Nicolella, D.P., Thacker, B.H., Katoozian, H., Davy, D.T., 2001. “Probabilistic risk analysis of a cemented 407
hip implant.” ASME Bioengineering Division 50, 427-428. 408
Taylor, M. and Barrett, D.S., 2003. “Explicit finite element simulation of eccentric loading in total knee 409
replacement .“ Clinical Orthopaedic Related Research 414, 162-171. 410
Walker, P.S. and A. Garg, 1991. “Range of motion in total knee arthroplasty”. Clinical Orthopaedics and 411
Related Research 262, 227–235. 412
Walker, P.S., Blunn, G.W., Broome, D.R., Perry, J., Watkin, S.A., Sathasivam, S., Dewar, M.E., Paul, J.P., 413
1997. “A knee simulating machine for performance evaluation of total knee replacements.” Journal 414
of Biomechanics 30, 83-89. 415
Wu, Y.T., Millwater, H.R., Cruse, T.A., 1990. “Advanced Probabilistic Structural-Analysis Method for 416
Implicit Performance Functions.” AIAA Journal 28, 1663-1669. 417
Zhang, Y., Liu, Q., 2002. Reliability-based design of automobile components. Proceedings of the Institute of 418
Mechanical Engineers, Part D. Journal of Automobile Engineering 216(6), 455-471. 419
Zihlmann M.S., Stacoff A., Romero, I., Kramers-de Quervain, Stussi E., 2005. “Biomechanical background 420
and clinical observations of rotational malalignment in TKA-literature review and consequences” 421
Clinical Biomechanics. Vol. 20: 661–668. 422
423
424

16
Figure and Table Captions 425
426
427
Figure 1. Probabilistic study parameters in the FE model of TKR. (For the definition of the abbreviations 428
used, see Table 1). 429
430
431
Figure 2. Tibial kinematics and contact pressure from the three models: Abaqus/Explicit, ADAMS, and 432
PAM-CRASH. a) AP translation (+anterior/-posterior), b) IE rotation (+external/-internal), and c) peak 433
contact pressure. 434
435
436
Figure 3. Comparison of predicted envelopes (1-99%) from MCST implemented in Nessus/Abaqus, 437
ADAMS/Insight, and PAM-OPT/PAM-CRASH. a) AP translation (+anterior/-posterior), b) IE rotation 438
(+external/-internal), and c) peak contact pressure. 439
440
441
Figure 4. Comparison of predicted envelopes (1-99%) for RSM based on 25, 50, and 100 trials and MCST 442
(solid line) with 1000 trials. Results from PAM-OPT/PAM-CRASH for a) AP translation (+anterior/-443
posterior), b) IE rotation (+external/-internal), and c) peak contact pressure and from ADAMS/Insight for d) 444
peak contact pressure. 445
446
447
448
Figure 5. Comparison of predicted envelopes (1-99%) for AMV and MCST with 1000 trials using the 449
Nessus/Abaqus platform. a) AP translation (+anterior/-posterior), b) IE rotation (+external/-internal), and c) 450
peak contact pressure 451
452
453
454
Figure 6. Sensitivity results for the various platforms represented by the averaged absolute values over the 455
gait cycle for: a) AP translation (+anterior/-posterior), b) IE rotation (+external/-internal), and c) peak 456
contact pressure. 457
458
459
Table 1. Input factors for probabilistic study from (Laz et al., 2006a). 460
461
462
Table 2. Root mean square (RMS) differences between the various platforms. 463
464
465
Table 3. Comparison of average and maximum ranges of predicted 1 and 99 percentile bounds for the 466
various performance metrics and platforms. 467

17
468 469
470
Figure 1. Probabilistic study parameters and the applied forces in the FE model of a TKR. (For the definition 471
of the abbreviations used, see Table 1). 472
473

18
474 (a) 475
476 (b) 477
478 (c) 479
Figure 2. Kinematics and contact pressure from the three models: Abaqus/Explicit, ADAMS, and PAM-480
CRASH. a) AP translation (+anterior/-posterior), b) IE rotation (+external/-internal), and c) peak contact 481
pressure. 482

19
483 (a) 484
485 486
(b) 487
488 489
(c) 490
Figure 3. Comparison of predicted envelopes (1-99%) from MCST implemented in Nessus/Abaqus, 491
ADAMS/Insight, and PAM-OPT/PAM-CRASH. a) AP translation (+anterior/-posterior), b) IE rotation 492
(+external/-internal), and c) peak contact pressure. 493

20
494 (a) 495
496
(b) 497
498
(c) 499

21
500
(d) 501
Figure 4. Comparison of predicted envelopes (1-99%) for RSM based on 25, 50, and 100 trials and MCST 502
(solid line) with 1000 trials. Results from PAM-OPT/PAM-CRASH for a) AP translation (+anterior/-503
posterior), b) IE rotation (+external/-internal), and c) peak contact pressure and from Insight/Adams for d) 504
peak contact pressure. 505

22
506
507
508 Figure 5. Comparison of predicted envelopes (1-99%) for AMV and MCST with 1000 trials using the 509
Nessus/Abaqus platform. a) AP translation (+anterior/-posterior), b) IE rotation (+external/-internal), and c) 510
peak contact pressure 511
512
513
514
515
-6
-4
-2
0
2
0 20 40 60 80 100
AP
Tra
nsl
atio
n (
mm
)
% Gait Cycle
Experimental
AMV
MCST
-10
-8
-6
-4
-2
0
2
4
6
0 20 40 60 80 100
IE R
ota
tio
n (
Deg
)
% Gait Cycle
Experimental
AMV
MCST
4
8
12
16
20
0 20 40 60 80 100
Co
nta
ct P
ress
ure
(M
Pa)
% Gait Cycle
AMV
MCST

23
516
517
518
(a) 519
520
(b) 521

24
522
(c) 523
524
Figure 6. Sensitivity results for the various platforms represented by the averaged absolute values over the 525
gait cycle for: a) AP translation, b) IE rotation, and c) peak contact pressure. 526

25
Parameter Mean value Variability σ
AP position of femoral FE axis (FEax_AP) 0 mm
0.5 mm
IS position of femoral FE axis (FEax_IS) 25.4 mm
AP position of tibial IE axis (IEax_AP) 7.62 mm
ML position of tibial IE axis (IEax_ML) 0 mm
Initial femoral FE rotation (Init_Fem_FE)
0° 1°
Initial femoral IE rotation (Fem_IE)
Tilt of the tibial insert (Insert Tilt)
VV position of the tibial insert (Insert_VV)
ML position of spring fixation (ΔML) 28.7 mm 0.5 mm
Spring stiffness (K) 5.21 N/mm 0.09 N/mm
ML load split (60%-40%) (ML_Load) 60% 2.5%
Friction coefficient (µ) 0.04 0.01
527
Table 1. Input factors for probabilistic study from (Laz et al., 2006a). 528
26
Deterministic Comparison Anterior-Posterior
Translation (mm)
Internal-External
Rotation (°)
Peak Contact
Pressure (MPa)
Abaqus and experiment 0.5 0.9 N/A
ADAMS and experiment 0.8 1.3 N/A
PAM-CRASH and experiment 0.6 0.9 N/A
Average 0.6 1.0
ADAMS and Abaqus 0.5 0.9 1.1
PAM-CRASH and Abaqus 0.6 0.9 2.1
ADAMS and PAM-CRASH 0.4 1.0 3.0
Average 0.5 0.9 2.1
529
Table 2. Root mean square (RMS) differences between the various platforms. 530
27
Measure / Platform Anterior-Posterior
Translation (mm)
Ave / Max
Internal-External
Rotation (°)
Ave / Max
Peak Contact
Pressure (MPa)
Ave / Max
Nessus/Abaqus
MCST (1000 trials) 2.2/3.4 2.8/4.5 1.4/4.8
AMV 2.3/3.4 2.7/4.3 0.5/1.7
ADAMS/Insight
MCST (1000 trials) 2.7/4.1 3.1/4.4 2.5/3.7
RSM (50 trials) 2.7/4.0 3.1/4.5 1.8/3.4
PAM-OPT/ PAM-CRASH
MCST (1000 trials) 2.9/4.1 2.8/4.5 2.8/6.2
RSM (50 trials) 2.8/4.1 2.8/4.5 2.4/5.7
Table 3. Comparison of average and maximum ranges of predicted 1 and 99 percentile bounds for the 531
various performance metrics and platforms. 532