the fukushima disaster and japan’s nuclear plant ...plipscy/lipscykushidaincertiest2013.pdf ·...
TRANSCRIPT
The Fukushima Disaster and Japan’s Nuclear Plant Vulnerability inComparative PerspectivePhillip Y. Lipscy,†,* Kenji E. Kushida,‡ and Trevor Incerti§
†Department of Political Science and Shorenstein Asia-Pacific Research Center, Stanford University, Stanford, California 94305‡Walter H. Shorenstein Asia-Pacific Research Center, Stanford University, Stanford, California 94305§Walter H. Shorenstein Asia-Pacific Research Center, Stanford University, Stanford, California 94305
*S Supporting Information
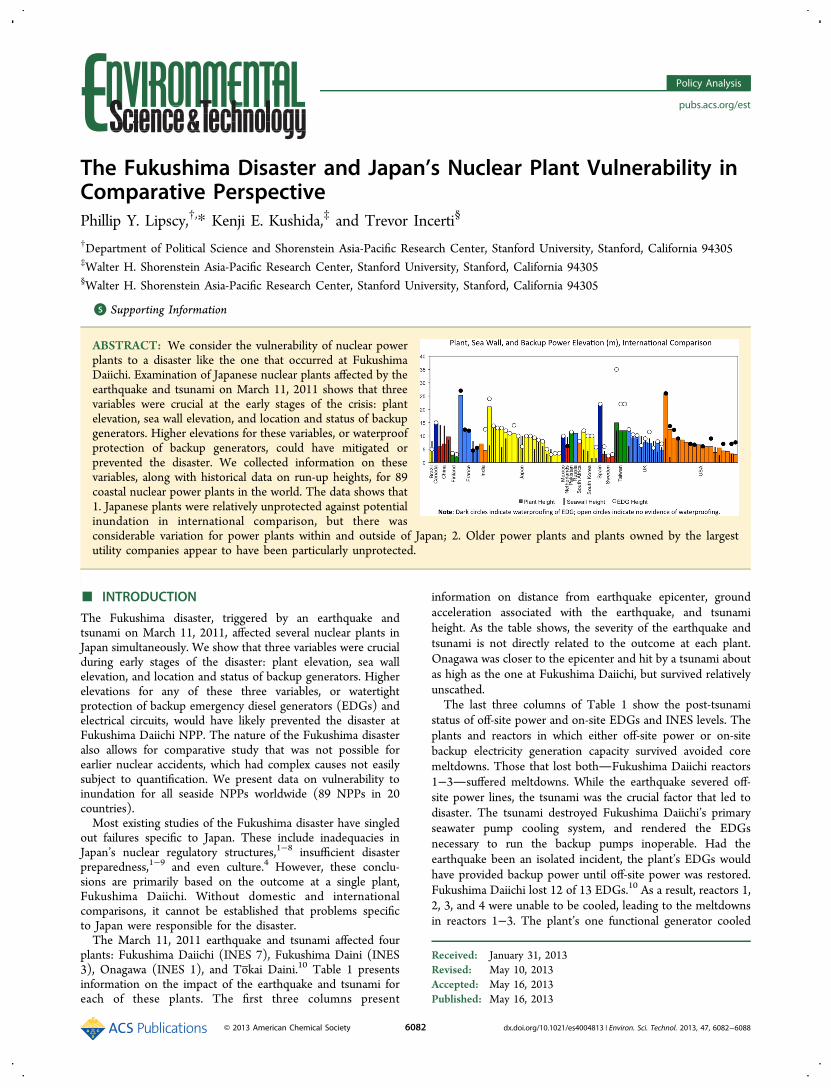
ABSTRACT: We consider the vulnerability of nuclear powerplants to a disaster like the one that occurred at FukushimaDaiichi. Examination of Japanese nuclear plants affected by theearthquake and tsunami on March 11, 2011 shows that threevariables were crucial at the early stages of the crisis: plantelevation, sea wall elevation, and location and status of backupgenerators. Higher elevations for these variables, or waterproofprotection of backup generators, could have mitigated orprevented the disaster. We collected information on thesevariables, along with historical data on run-up heights, for 89coastal nuclear power plants in the world. The data shows that1. Japanese plants were relatively unprotected against potentialinundation in international comparison, but there wasconsiderable variation for power plants within and outside of Japan; 2. Older power plants and plants owned by the largestutility companies appear to have been particularly unprotected.
■ INTRODUCTION
The Fukushima disaster, triggered by an earthquake andtsunami on March 11, 2011, affected several nuclear plants inJapan simultaneously. We show that three variables were crucialduring early stages of the disaster: plant elevation, sea wallelevation, and location and status of backup generators. Higherelevations for any of these three variables, or watertightprotection of backup emergency diesel generators (EDGs) andelectrical circuits, would have likely prevented the disaster atFukushima Daiichi NPP. The nature of the Fukushima disasteralso allows for comparative study that was not possible forearlier nuclear accidents, which had complex causes not easilysubject to quantification. We present data on vulnerability toinundation for all seaside NPPs worldwide (89 NPPs in 20countries).Most existing studies of the Fukushima disaster have singled
out failures specific to Japan. These include inadequacies inJapan’s nuclear regulatory structures,1−8 insufficient disasterpreparedness,1−9 and even culture.4 However, these conclu-sions are primarily based on the outcome at a single plant,Fukushima Daiichi. Without domestic and internationalcomparisons, it cannot be established that problems specificto Japan were responsible for the disaster.The March 11, 2011 earthquake and tsunami affected four
plants: Fukushima Daiichi (INES 7), Fukushima Daini (INES3), Onagawa (INES 1), and To̅kai Daini.10 Table 1 presentsinformation on the impact of the earthquake and tsunami foreach of these plants. The first three columns present
information on distance from earthquake epicenter, groundacceleration associated with the earthquake, and tsunamiheight. As the table shows, the severity of the earthquake andtsunami is not directly related to the outcome at each plant.Onagawa was closer to the epicenter and hit by a tsunami aboutas high as the one at Fukushima Daiichi, but survived relativelyunscathed.The last three columns of Table 1 show the post-tsunami
status of off-site power and on-site EDGs and INES levels. Theplants and reactors in which either off-site power or on-sitebackup electricity generation capacity survived avoided coremeltdowns. Those that lost bothFukushima Daiichi reactors1−3suffered meltdowns. While the earthquake severed off-site power lines, the tsunami was the crucial factor that led todisaster. The tsunami destroyed Fukushima Daiichi’s primaryseawater pump cooling system, and rendered the EDGsnecessary to run the backup pumps inoperable. Had theearthquake been an isolated incident, the plant’s EDGs wouldhave provided backup power until off-site power was restored.Fukushima Daiichi lost 12 of 13 EDGs.10 As a result, reactors 1,2, 3, and 4 were unable to be cooled, leading to the meltdownsin reactors 1−3. The plant’s one functional generator cooled
Received: January 31, 2013Revised: May 10, 2013Accepted: May 16, 2013Published: May 16, 2013
Policy Analysis
pubs.acs.org/est
© 2013 American Chemical Society 6082 dx.doi.org/10.1021/es4004813 | Environ. Sci. Technol. 2013, 47, 6082−6088
reactors 5 and 6, which were undergoing maintenance at thetime.At Fukushima Daini, 3 of 12 EDGs survived the tsunami,
enabling reactors 3 and 4 to be cooled until the surviving off-site power lines were rerouted.10 At Onagawa, 6 of 8 EDGsremained intact.10 To̅kai Daini lost all off-site power for twodays, but the survival of 2 of 3 EDGs enabled the reactor to becooled until off-site power was restored.10
Off-site power can be severed by a variety of events, such asterrorism, tornadoes, hurricanes, and other disasters. Duringsuch events, maintaining the integrity of on-site backup poweris crucial. The To̅kai Daini NPP illustrates this; the plantexperienced a complete loss of off-site power, but achieved coldshutdown because most EDGs survived the tsunami.In the Japanese NPPs, off-site power was compromised due
to the earthquake, while on-site backup power sources weredamaged by the tsunami.1,3−7,9,10 Table 1 also includesinformation on plant elevation above sea level, seawall heights,and EDG elevation above sea level. Comparing the plantsaffected by the tsunami, clear variation exists in plant height andsea wall height relative to the tsunami. The Onagawa powerplant’s 14 m sea wall was adequate for a 13 m tsunami, thesame height as the tsunami that overwhelmed the 10 m sea wallat Fukushima Daiichi. Although the height of the tsunami wasbelow plant elevation at Fukushima Daini, the plant waspartially flooded as water reached as high as 14.5 m in part ofthe plant location due to local geography.11 To̅kai Daini waspartially flooded by a 4.6 m tsunami as its 6.1 m seawall wasbeing retrofitted at the time and was not watertight.12
Higher values for plant height, seawall height, and/or EDGheight, or adequate waterproofing of EDGs, would haveprevented or substantially mitigated the disaster at FukushimaDaiichi.1−7,9 Higher plant elevation would have prevented thetsunami from damaging the plant’s critical systems, includingthe EDGs, which were located at an elevation equivalent toplant height. The tsunami would likewise not have reached theEDGs if the seawall protecting the plant was taller, or thegenerators were placed at higher elevations.9 With the seawaterpumps required for cooling destroyed by the tsunami, theavailability of backup power to start the emergency coolingsystem became critical.13 Due to low plant height, seawallheight, and EDG height, both the primary and secondarycooling systems were compromised, leading to disaster. Thisconclusion is consistent with the findings of reports by theJapanese Diet Fukushima Nuclear Accident InvestigationCommission, the International Atomic Energy Agency(IAEA), the European Nuclear Safety Regulators Group(ENSREG), the United States Nuclear Regulatory Commis-sion, and the Carnegie Endowment for InternationalPeace.1,2,7,8,10
■ MATERIALS AND METHODSBased on these observations about Fukushima Daiichi andother Japanese plants affected by the tsunami, we conducted acomparative analysis of protection against tsunami at globalcoastal NPPs (plants located either immediately adjacent to thecoast or within the mouth of a river adjacent to the coast). Wecollected data for the following variables at all global coastalNPPs: base plant elevation, seawall height, emergency powersystem elevation, waterproofing of backup power systems,construction and commission date, maximum water height,average wave height, and Soloviev−Imamura tsunami intensity.Since our goal is to compare disaster protection at the time ofthe Tohoku Earthquake, all data refers to NPP infrastructure asit existed prior to March 11, 2011.The first set of variables are plant-specific characteristics
identified in the preceding section as vital to the Fukushimadisaster. Base plant elevation is a measure of the height ofcritical components of the NPP above mean sea level. As seenin the previous section, elevation above sea level is a primarydeterminant of an NPP’s vulnerability to tsunami inundation.We typically measured elevation at the base of the reactorbuilding. However, where components deemed critical forreactor operation or safe shutdown are located at elevationslower than the reactor building, the lower elevation is recorded.Primary sources for elevation data include national nuclearregulatory agencies, the International Atomic Energy Agency(IAEA), European “stress tests” conducted in response to theFukushima disaster, and primary source information fromnuclear plant operators.Seawall height is similarly recorded as the maximum height
of a seawall, flood barrier, levy, or natural barrier (such as sanddunes or barrier islands) above mean sea level. In the event thata plant does not possess a seawall or other barrier, or the barrierin question is not designed for protection against tsunami orstorm surge, the height is recorded as zero. Sources are identicalto base plant elevation.Emergency power system elevation is a measure of the
elevation of critical backup power supply systems above meansea level. These systems include emergency diesel generators,gas turbine-driven generators, and battery systems. Datasources for emergency power system location include nationalnuclear regulatory agencies, the IAEA, European “stress tests,”and plant operators. However, in several cases, this informationwas not publically available due to national security concerns.Because the viability of emergency power systems is
determined by flood protection in addition to elevation,waterproofing of emergency power supplies is also recorded.Specifically, this is an assessment of whether emergency powersystems are located behind flood proof doors or in watertightbunkers. This is recorded as a dichotomous variable (1 for yes,0 for no). Sources are identical to base plant elevation andseawall height, with greater relative reliance on informationcollected directly from power operators and regulators.
Table 1. Damage and INES Level of Four Japanese NPPs Hit by Earthquake and Tsunami
distance fromepicenter
ground acceleration(maximum gal)
tsunamiheight
sea wallheight
plantheight
EDGhight
surviving off-sitepower lines
srvivingEDGs
INESlvel
FukushimaDaiichi
180 m 550 gal 13 m 10 m 10 m 10 m 0/6 1/13 7
FukushimaDaini
190 m 305 gal 9 m 9 m 12 m 12 m 1/4 3/12 3
Onagawa 70 m 607 gal 13 m 14 m 13.8 m 13.8 m 1/5 6/8 1To̅kai 280 m 214 gal 4.6 m 6.1 m 8 m 8 m 0/3 2/3 0
Environmental Science & Technology Policy Analysis
dx.doi.org/10.1021/es4004813 | Environ. Sci. Technol. 2013, 47, 6082−60886083
Construction and commission dates refer to the datesconstruction was initiated and the reactor became commerciallyoperational. Where reactors have been decommissioned or arecurrently undergoing decommissioning, the decommissioningdate is also noted.We also collected several variables that proxy for an NPP’s
potential exposure to high waves and inundation. Maximumwater height is a measurement of the maximum historicallyreported water or wave height recorded within a 150 km radiusof an NPP. We use the 150 km radius as recommended by theIAEA in 2002 (in 2010, this radius was expanded to 300km).14,15 It is common for PRAs conducted by plant operatorsto focus on a narrower radius in the immediate vicinity of theplant. However, this approach can lead to underestimation ofvulnerability, as historical events producing extremely largewaves are rare events, and waves actually observed in a veryspecific location may reflect idiosyncrasies specific to thoseevents; for example, the precise location of the epicenter of anearthquake or the landfall location of a hurricane. This problemis illustrated by PRAs conducted by Japanese plant operatorsprior to the 3/11/2011 Tohoku Earthquake, which under-estimated risks based on the use of narrow radii. One exampleis the risk assessment performed by Tohoku Electric for theOnagawa plant. The highest waves recorded in the immediatevicinity of the plant site, based on a study of the four largesthistorical earthquakes, were found to be 6−8 m. However,much higher waves (10−25 m) were recorded about 100 km tothe north in Iwate Prefecture; these waves were discounted asbeing irrelevant for the plant location. The implicit assumptionwas that local conditions at the plant site made the location lesssusceptible to high waves compared to the region slightly to thenorth. However, the 3/11/2011 wave height reached about 13m at the plant site, considerably higher than estimates based ona narrow radius, but consistent with records from the 150 kmradius we use for this study.The primary sources of historical tsunami data are the
National Geophysical Data Center (NGDC) Global HistoricalTsunami Database and the Russian Academy of Sciences (RAS)Novosibirsk Tsunami Laboratory Historical Tsunami Database.Where possible, relevant government and academic reportswere also consulted for confirmation.16−29 We use all historical
data available on past events. Several caveats about this datashould be recognized: Historical data is more readily availablefor certain geographical regions. Importantly, historical waveheight data for the United States is not available prior toEuropean settlement. The measure therefore likely understatesvulnerability for North and South America compared to otherregions of the world. Additionally, maximum water height is notalways associated with earthquakes. Landslides are also acommon source of large waves. In the eastern United States,waves generated by hurricane-induced storm surges typicallyreach heights greater than those caused by seismic events.We also collected information on the highest average wave
height associated with a historical event within a 150 km radiusof each NPP. Compared to maximum wave height, averagewave height is less likely to be influenced by extreme outliersinduced by local geographic conditions. For several recentepisodes, we were able to obtain data on average wave directlyfrom original sources. However, in most cases, we calculatedaverage wave height from the Soloviev−Imamura (S−I)tsunami intensity scale, which is available in the NGDC andRAS tsunami databases. The S−I scale is used to assess therelative strength of tsunamis and is calculated according to thefollowing formula:
= +I H12
log2 av
where Hav is the average wave height along the nearest coast.We calculated the Hav for each NPP based on the historicalevent associated with the highest S−I intensity within a 150 kmradius.
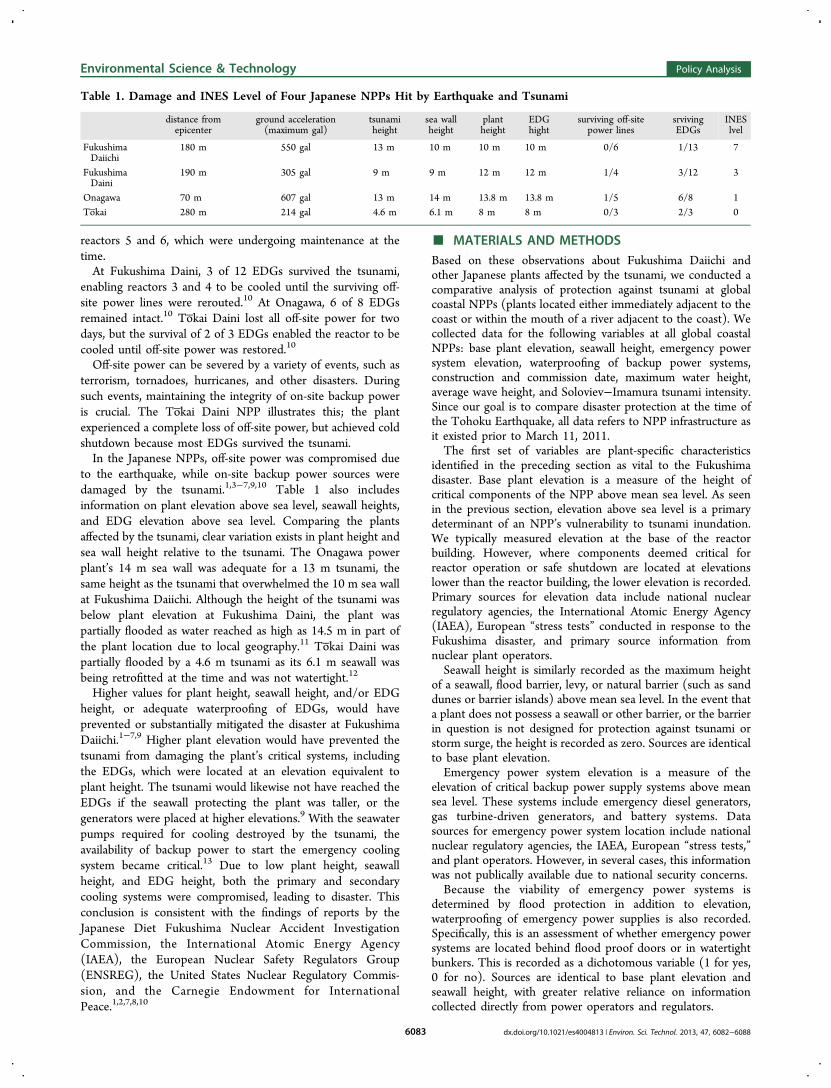
■ RESULTS AND DISCUSSIONFigure 1 plots base plant elevation, seawall height, emergencypower system elevation, and waterproofing of backup powersystems for nuclear plants according to country. Particularlylow-lying plants are located in Finland and Sweden, presumablybecause vulnerability to tsunami is considered negligible.According to this measure, Japan does not look particularlyunder-protected in international comparison. On average,Japanese plants are located about 10.1 m above sea level andprotected by sea walls averaging 4.6 m in height. International
Figure 1. Plant, sea wall, and backup power height (m), international comparison. Note: Dark circles indicate waterproofing of EDG; open circlesindicate no evidence of waterproofing. No circle indicates plant operator declined to release information on EDGs. No vertical bar indicates no seawall.
Environmental Science & Technology Policy Analysis
dx.doi.org/10.1021/es4004813 | Environ. Sci. Technol. 2013, 47, 6082−60886084
averages are 8.8 m for plant height and 3.5 m for sea wallheight. Waterproofing of EDGs was not common before March11, 2011 − this was implemented in France and the U.S. afterevents highlighted potential vulnerabilities in those countries(flooding at Blayais NPP and the September 11, 2001 attacks).1
We now consider vulnerability to inundation accounting forhistorical wave height. We consider two principal measures: thehighest recorded wave run-up and highest recorded averagerun-up within a 150 km radius14 of a NPP. Our data includesrun-ups caused by seismic activity as well as other sources, suchas hurricanes and landslides. These are blunt measures ofvulnerability to inundation, but they have several advantagesover existing assessments such as PRAs conducted by plantoperators. The measures correctly identify Fukushima Daiichias a vulnerable plant based on data prior to the 3/11earthquake. PRAs conducted by TEPCO generally concludedthat the plant was safe from inundation (TEPCO did conduct aconfidential simulation studying the possibility of a 10−15 mtsunami in 2008, but the company considered this “tentativecalculations in the research stage” and did not take anyimmediate action).5,30 As we will show, these measures alsoproduce rankings that roughly correspond to outcomes duringthe 3/11 earthquake and tsunami; Fukushima Daiichi isclassified as the most vulnerable to inundation, followed byFukushima Daini, Tokai, and Onagawa.The first measure we examine is the highest recorded wave
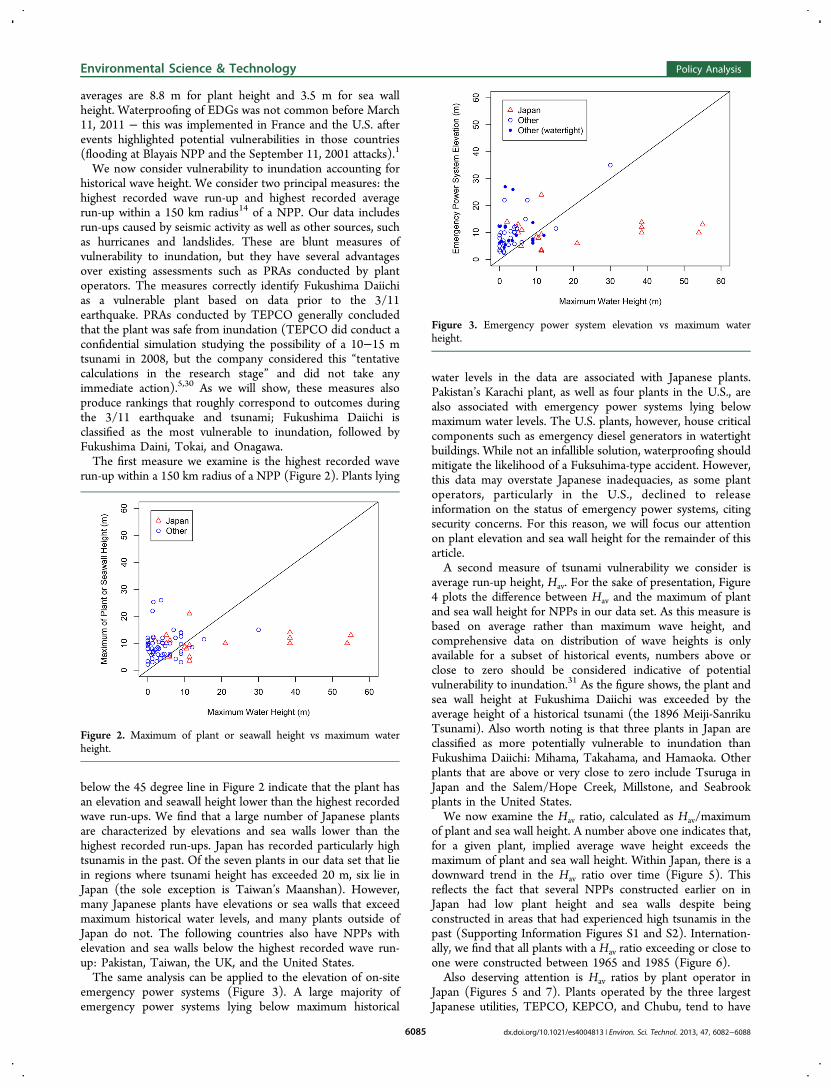
run-up within a 150 km radius of a NPP (Figure 2). Plants lying
below the 45 degree line in Figure 2 indicate that the plant hasan elevation and seawall height lower than the highest recordedwave run-ups. We find that a large number of Japanese plantsare characterized by elevations and sea walls lower than thehighest recorded run-ups. Japan has recorded particularly hightsunamis in the past. Of the seven plants in our data set that liein regions where tsunami height has exceeded 20 m, six lie inJapan (the sole exception is Taiwan’s Maanshan). However,many Japanese plants have elevations or sea walls that exceedmaximum historical water levels, and many plants outside ofJapan do not. The following countries also have NPPs withelevation and sea walls below the highest recorded wave run-up: Pakistan, Taiwan, the UK, and the United States.The same analysis can be applied to the elevation of on-site
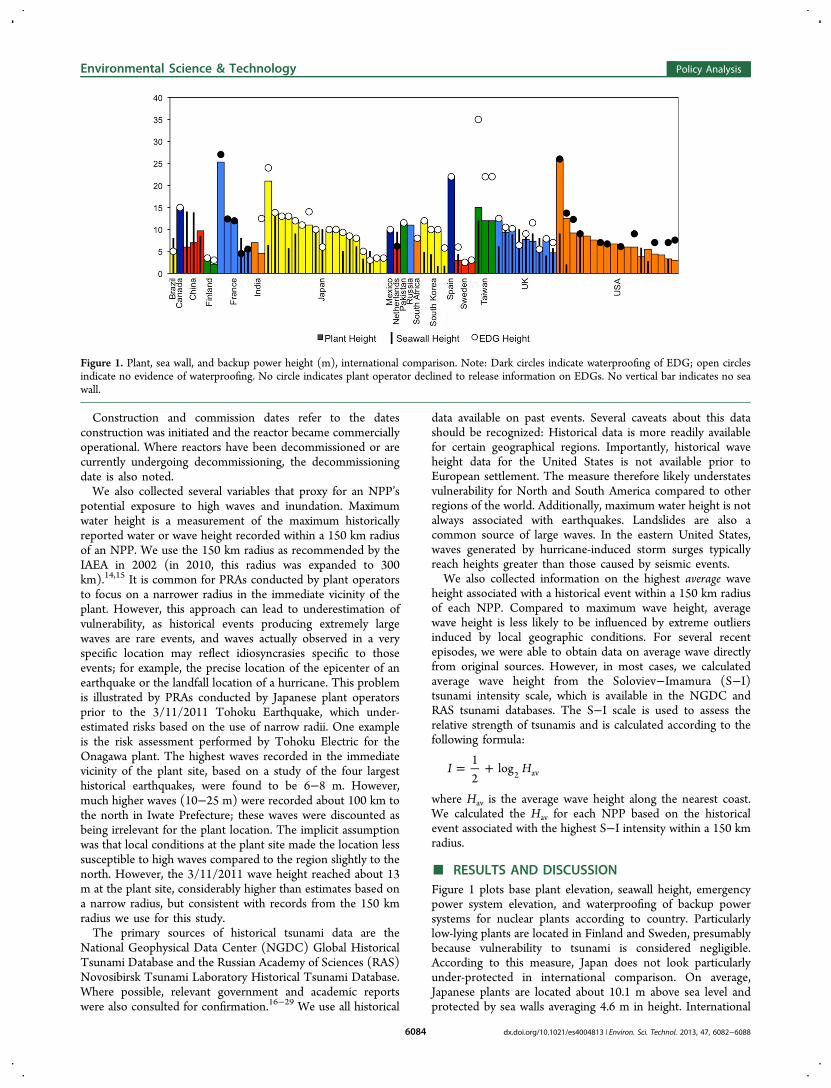
emergency power systems (Figure 3). A large majority ofemergency power systems lying below maximum historical
water levels in the data are associated with Japanese plants.Pakistan’s Karachi plant, as well as four plants in the U.S., arealso associated with emergency power systems lying belowmaximum water levels. The U.S. plants, however, house criticalcomponents such as emergency diesel generators in watertightbuildings. While not an infallible solution, waterproofing shouldmitigate the likelihood of a Fuksuhima-type accident. However,this data may overstate Japanese inadequacies, as some plantoperators, particularly in the U.S., declined to releaseinformation on the status of emergency power systems, citingsecurity concerns. For this reason, we will focus our attentionon plant elevation and sea wall height for the remainder of thisarticle.A second measure of tsunami vulnerability we consider is
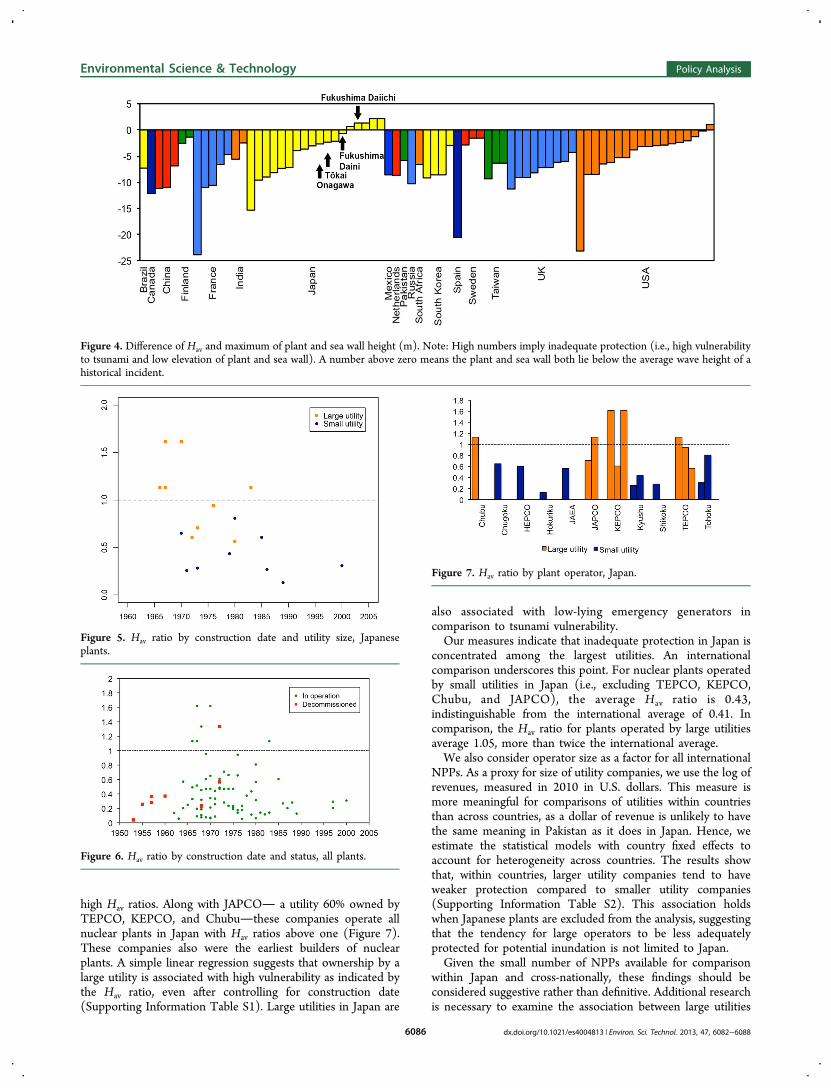
average run-up height, Hav. For the sake of presentation, Figure4 plots the difference between Hav and the maximum of plantand sea wall height for NPPs in our data set. As this measure isbased on average rather than maximum wave height, andcomprehensive data on distribution of wave heights is onlyavailable for a subset of historical events, numbers above orclose to zero should be considered indicative of potentialvulnerability to inundation.31 As the figure shows, the plant andsea wall height at Fukushima Daiichi was exceeded by theaverage height of a historical tsunami (the 1896 Meiji-SanrikuTsunami). Also worth noting is that three plants in Japan areclassified as more potentially vulnerable to inundation thanFukushima Daiichi: Mihama, Takahama, and Hamaoka. Otherplants that are above or very close to zero include Tsuruga inJapan and the Salem/Hope Creek, Millstone, and Seabrookplants in the United States.We now examine the Hav ratio, calculated as Hav/maximum
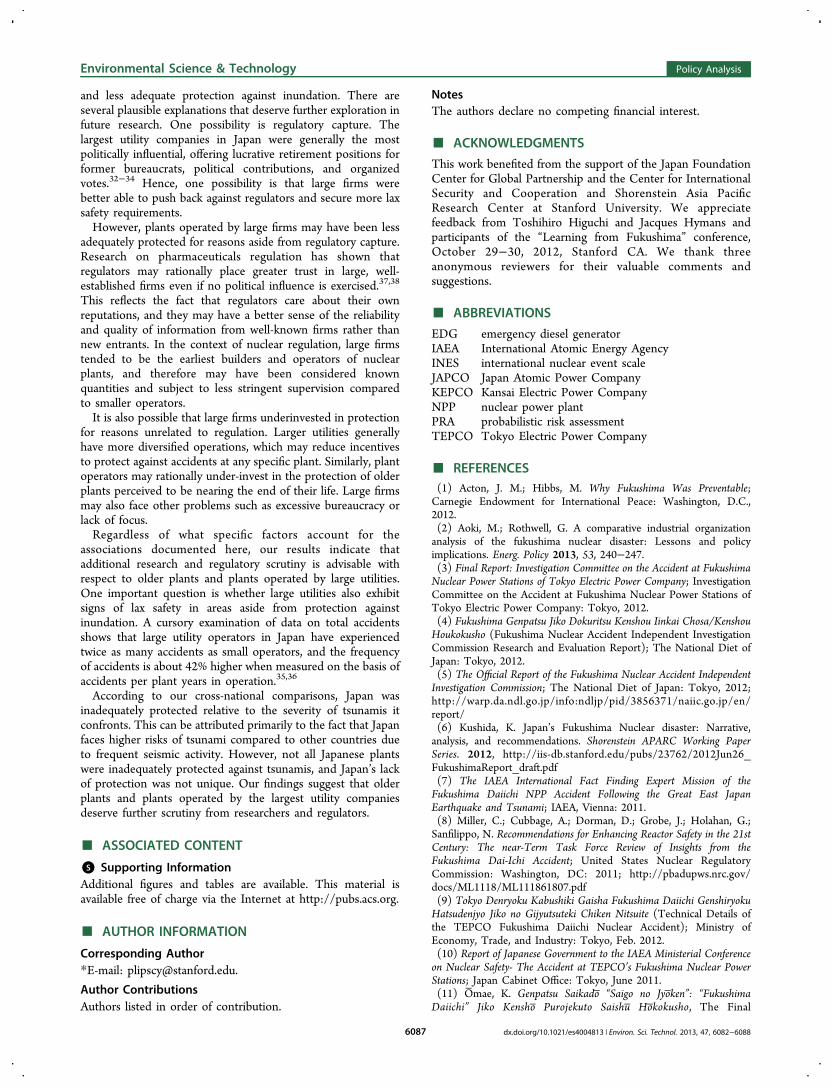
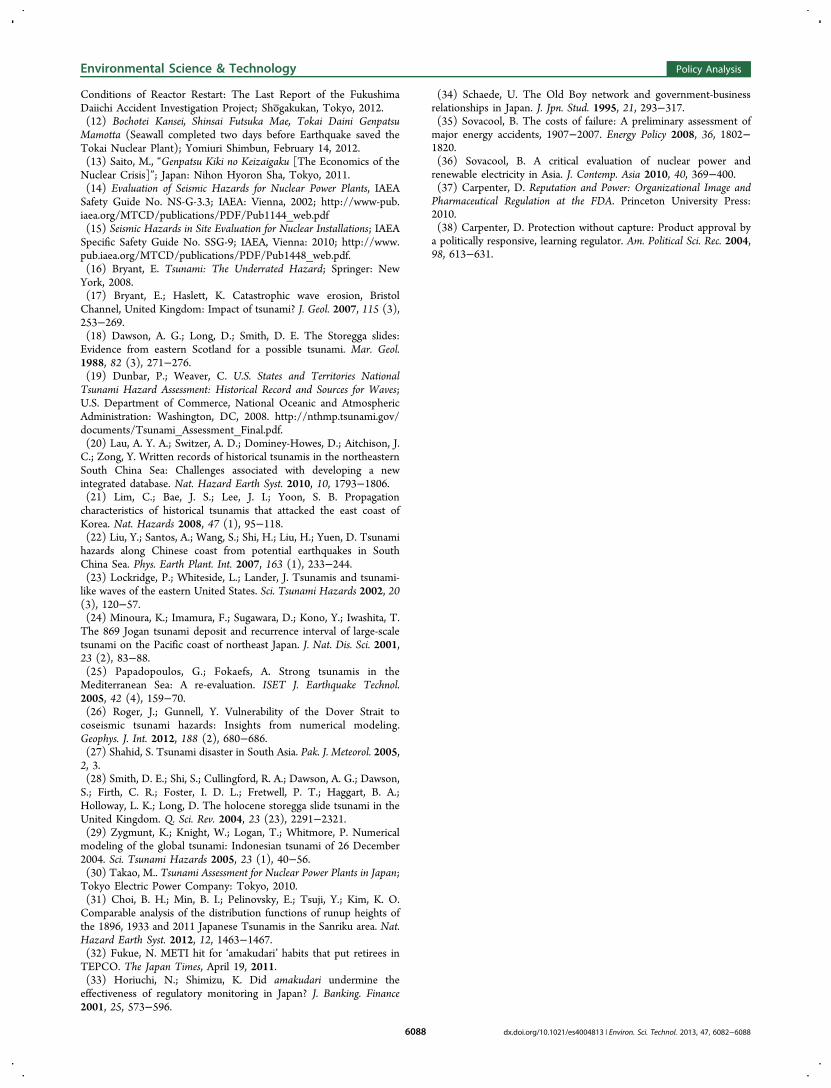
of plant and sea wall height. A number above one indicates that,for a given plant, implied average wave height exceeds themaximum of plant and sea wall height. Within Japan, there is adownward trend in the Hav ratio over time (Figure 5). Thisreflects the fact that several NPPs constructed earlier on inJapan had low plant height and sea walls despite beingconstructed in areas that had experienced high tsunamis in thepast (Supporting Information Figures S1 and S2). Internation-ally, we find that all plants with a Hav ratio exceeding or close toone were constructed between 1965 and 1985 (Figure 6).Also deserving attention is Hav ratios by plant operator in
Japan (Figures 5 and 7). Plants operated by the three largestJapanese utilities, TEPCO, KEPCO, and Chubu, tend to have
Figure 2. Maximum of plant or seawall height vs maximum waterheight.
Figure 3. Emergency power system elevation vs maximum waterheight.
Environmental Science & Technology Policy Analysis
dx.doi.org/10.1021/es4004813 | Environ. Sci. Technol. 2013, 47, 6082−60886085
high Hav ratios. Along with JAPCO a utility 60% owned byTEPCO, KEPCO, and Chubuthese companies operate allnuclear plants in Japan with Hav ratios above one (Figure 7).These companies also were the earliest builders of nuclearplants. A simple linear regression suggests that ownership by alarge utility is associated with high vulnerability as indicated bythe Hav ratio, even after controlling for construction date(Supporting Information Table S1). Large utilities in Japan are
also associated with low-lying emergency generators incomparison to tsunami vulnerability.Our measures indicate that inadequate protection in Japan is
concentrated among the largest utilities. An internationalcomparison underscores this point. For nuclear plants operatedby small utilities in Japan (i.e., excluding TEPCO, KEPCO,Chubu, and JAPCO), the average Hav ratio is 0.43,indistinguishable from the international average of 0.41. Incomparison, the Hav ratio for plants operated by large utilitiesaverage 1.05, more than twice the international average.We also consider operator size as a factor for all international
NPPs. As a proxy for size of utility companies, we use the log ofrevenues, measured in 2010 in U.S. dollars. This measure ismore meaningful for comparisons of utilities within countriesthan across countries, as a dollar of revenue is unlikely to havethe same meaning in Pakistan as it does in Japan. Hence, weestimate the statistical models with country fixed effects toaccount for heterogeneity across countries. The results showthat, within countries, larger utility companies tend to haveweaker protection compared to smaller utility companies(Supporting Information Table S2). This association holdswhen Japanese plants are excluded from the analysis, suggestingthat the tendency for large operators to be less adequatelyprotected for potential inundation is not limited to Japan.Given the small number of NPPs available for comparison
within Japan and cross-nationally, these findings should beconsidered suggestive rather than definitive. Additional researchis necessary to examine the association between large utilities
Figure 4. Difference of Hav and maximum of plant and sea wall height (m). Note: High numbers imply inadequate protection (i.e., high vulnerabilityto tsunami and low elevation of plant and sea wall). A number above zero means the plant and sea wall both lie below the average wave height of ahistorical incident.
Figure 5. Hav ratio by construction date and utility size, Japaneseplants.
Figure 6. Hav ratio by construction date and status, all plants.
Figure 7. Hav ratio by plant operator, Japan.
Environmental Science & Technology Policy Analysis
dx.doi.org/10.1021/es4004813 | Environ. Sci. Technol. 2013, 47, 6082−60886086
and less adequate protection against inundation. There areseveral plausible explanations that deserve further exploration infuture research. One possibility is regulatory capture. Thelargest utility companies in Japan were generally the mostpolitically influential, offering lucrative retirement positions forformer bureaucrats, political contributions, and organizedvotes.32−34 Hence, one possibility is that large firms werebetter able to push back against regulators and secure more laxsafety requirements.However, plants operated by large firms may have been less
adequately protected for reasons aside from regulatory capture.Research on pharmaceuticals regulation has shown thatregulators may rationally place greater trust in large, well-established firms even if no political influence is exercised.37,38
This reflects the fact that regulators care about their ownreputations, and they may have a better sense of the reliabilityand quality of information from well-known firms rather thannew entrants. In the context of nuclear regulation, large firmstended to be the earliest builders and operators of nuclearplants, and therefore may have been considered knownquantities and subject to less stringent supervision comparedto smaller operators.It is also possible that large firms underinvested in protection
for reasons unrelated to regulation. Larger utilities generallyhave more diversified operations, which may reduce incentivesto protect against accidents at any specific plant. Similarly, plantoperators may rationally under-invest in the protection of olderplants perceived to be nearing the end of their life. Large firmsmay also face other problems such as excessive bureaucracy orlack of focus.Regardless of what specific factors account for the
associations documented here, our results indicate thatadditional research and regulatory scrutiny is advisable withrespect to older plants and plants operated by large utilities.One important question is whether large utilities also exhibitsigns of lax safety in areas aside from protection againstinundation. A cursory examination of data on total accidentsshows that large utility operators in Japan have experiencedtwice as many accidents as small operators, and the frequencyof accidents is about 42% higher when measured on the basis ofaccidents per plant years in operation.35,36
According to our cross-national comparisons, Japan wasinadequately protected relative to the severity of tsunamis itconfronts. This can be attributed primarily to the fact that Japanfaces higher risks of tsunami compared to other countries dueto frequent seismic activity. However, not all Japanese plantswere inadequately protected against tsunamis, and Japan’s lackof protection was not unique. Our findings suggest that olderplants and plants operated by the largest utility companiesdeserve further scrutiny from researchers and regulators.
■ ASSOCIATED CONTENT
*S Supporting InformationAdditional figures and tables are available. This material isavailable free of charge via the Internet at http://pubs.acs.org.
■ AUTHOR INFORMATION
Corresponding Author*E-mail: [email protected].
Author ContributionsAuthors listed in order of contribution.
NotesThe authors declare no competing financial interest.
■ ACKNOWLEDGMENTS
This work benefited from the support of the Japan FoundationCenter for Global Partnership and the Center for InternationalSecurity and Cooperation and Shorenstein Asia PacificResearch Center at Stanford University. We appreciatefeedback from Toshihiro Higuchi and Jacques Hymans andparticipants of the “Learning from Fukushima” conference,October 29−30, 2012, Stanford CA. We thank threeanonymous reviewers for their valuable comments andsuggestions.
■ ABBREVIATIONS
EDG emergency diesel generatorIAEA International Atomic Energy AgencyINES international nuclear event scaleJAPCO Japan Atomic Power CompanyKEPCO Kansai Electric Power CompanyNPP nuclear power plantPRA probabilistic risk assessmentTEPCO Tokyo Electric Power Company
■ REFERENCES(1) Acton, J. M.; Hibbs, M. Why Fukushima Was Preventable;Carnegie Endowment for International Peace: Washington, D.C.,2012.(2) Aoki, M.; Rothwell, G. A comparative industrial organizationanalysis of the fukushima nuclear disaster: Lessons and policyimplications. Energ. Policy 2013, 53, 240−247.(3) Final Report: Investigation Committee on the Accident at FukushimaNuclear Power Stations of Tokyo Electric Power Company; InvestigationCommittee on the Accident at Fukushima Nuclear Power Stations ofTokyo Electric Power Company: Tokyo, 2012.(4) Fukushima Genpatsu Jiko Dokuritsu Kenshou Iinkai Chosa/KenshouHoukokusho (Fukushima Nuclear Accident Independent InvestigationCommission Research and Evaluation Report); The National Diet ofJapan: Tokyo, 2012.(5) The Official Report of the Fukushima Nuclear Accident IndependentInvestigation Commission; The National Diet of Japan: Tokyo, 2012;http://warp.da.ndl.go.jp/info:ndljp/pid/3856371/naiic.go.jp/en/report/(6) Kushida, K. Japan’s Fukushima Nuclear disaster: Narrative,analysis, and recommendations. Shorenstein APARC Working PaperSeries. 2012, http://iis-db.stanford.edu/pubs/23762/2012Jun26_FukushimaReport_draft.pdf(7) The IAEA International Fact Finding Expert Mission of theFukushima Daiichi NPP Accident Following the Great East JapanEarthquake and Tsunami; IAEA, Vienna: 2011.(8) Miller, C.; Cubbage, A.; Dorman, D.; Grobe, J.; Holahan, G.;Sanfilippo, N. Recommendations for Enhancing Reactor Safety in the 21stCentury: The near-Term Task Force Review of Insights from theFukushima Dai-Ichi Accident; United States Nuclear RegulatoryCommission: Washington, DC: 2011; http://pbadupws.nrc.gov/docs/ML1118/ML111861807.pdf(9) Tokyo Denryoku Kabushiki Gaisha Fukushima Daiichi GenshiryokuHatsudenjyo Jiko no Gijyutsuteki Chiken Nitsuite (Technical Details ofthe TEPCO Fukushima Daiichi Nuclear Accident); Ministry ofEconomy, Trade, and Industry: Tokyo, Feb. 2012.(10) Report of Japanese Government to the IAEA Ministerial Conferenceon Nuclear Safety- The Accident at TEPCO’s Fukushima Nuclear PowerStations; Japan Cabinet Office: Tokyo, June 2011.(11) O̅mae, K. Genpatsu Saikado ̅ “Saigo no Jyok̅en”: “FukushimaDaiichi” Jiko Kensho ̅ Purojekuto Saishu ̅ Ho ̅kokusho, The Final
Environmental Science & Technology Policy Analysis
dx.doi.org/10.1021/es4004813 | Environ. Sci. Technol. 2013, 47, 6082−60886087
Conditions of Reactor Restart: The Last Report of the FukushimaDaiichi Accident Investigation Project; Sho̅gakukan, Tokyo, 2012.(12) Bochotei Kansei, Shinsai Futsuka Mae, Tokai Daini GenpatsuMamotta (Seawall completed two days before Earthquake saved theTokai Nuclear Plant); Yomiuri Shimbun, February 14, 2012.(13) Saito, M., “Genpatsu Kiki no Keizaigaku [The Economics of theNuclear Crisis]”; Japan: Nihon Hyoron Sha, Tokyo, 2011.(14) Evaluation of Seismic Hazards for Nuclear Power Plants, IAEASafety Guide No. NS-G-3.3; IAEA: Vienna, 2002; http://www-pub.iaea.org/MTCD/publications/PDF/Pub1144_web.pdf(15) Seismic Hazards in Site Evaluation for Nuclear Installations; IAEASpecific Safety Guide No. SSG-9; IAEA, Vienna: 2010; http://www.pub.iaea.org/MTCD/publications/PDF/Pub1448_web.pdf.(16) Bryant, E. Tsunami: The Underrated Hazard; Springer: NewYork, 2008.(17) Bryant, E.; Haslett, K. Catastrophic wave erosion, BristolChannel, United Kingdom: Impact of tsunami? J. Geol. 2007, 115 (3),253−269.(18) Dawson, A. G.; Long, D.; Smith, D. E. The Storegga slides:Evidence from eastern Scotland for a possible tsunami. Mar. Geol.1988, 82 (3), 271−276.(19) Dunbar, P.; Weaver, C. U.S. States and Territories NationalTsunami Hazard Assessment: Historical Record and Sources for Waves;U.S. Department of Commerce, National Oceanic and AtmosphericAdministration: Washington, DC, 2008. http://nthmp.tsunami.gov/documents/Tsunami_Assessment_Final.pdf.(20) Lau, A. Y. A.; Switzer, A. D.; Dominey-Howes, D.; Aitchison, J.C.; Zong, Y. Written records of historical tsunamis in the northeasternSouth China Sea: Challenges associated with developing a newintegrated database. Nat. Hazard Earth Syst. 2010, 10, 1793−1806.(21) Lim, C.; Bae, J. S.; Lee, J. I.; Yoon, S. B. Propagationcharacteristics of historical tsunamis that attacked the east coast ofKorea. Nat. Hazards 2008, 47 (1), 95−118.(22) Liu, Y.; Santos, A.; Wang, S.; Shi, H.; Liu, H.; Yuen, D. Tsunamihazards along Chinese coast from potential earthquakes in SouthChina Sea. Phys. Earth Plant. Int. 2007, 163 (1), 233−244.(23) Lockridge, P.; Whiteside, L.; Lander, J. Tsunamis and tsunami-like waves of the eastern United States. Sci. Tsunami Hazards 2002, 20(3), 120−57.(24) Minoura, K.; Imamura, F.; Sugawara, D.; Kono, Y.; Iwashita, T.The 869 Jogan tsunami deposit and recurrence interval of large-scaletsunami on the Pacific coast of northeast Japan. J. Nat. Dis. Sci. 2001,23 (2), 83−88.(25) Papadopoulos, G.; Fokaefs, A. Strong tsunamis in theMediterranean Sea: A re-evaluation. ISET J. Earthquake Technol.2005, 42 (4), 159−70.(26) Roger, J.; Gunnell, Y. Vulnerability of the Dover Strait tocoseismic tsunami hazards: Insights from numerical modeling.Geophys. J. Int. 2012, 188 (2), 680−686.(27) Shahid, S. Tsunami disaster in South Asia. Pak. J. Meteorol. 2005,2, 3.(28) Smith, D. E.; Shi, S.; Cullingford, R. A.; Dawson, A. G.; Dawson,S.; Firth, C. R.; Foster, I. D. L.; Fretwell, P. T.; Haggart, B. A.;Holloway, L. K.; Long, D. The holocene storegga slide tsunami in theUnited Kingdom. Q. Sci. Rev. 2004, 23 (23), 2291−2321.(29) Zygmunt, K.; Knight, W.; Logan, T.; Whitmore, P. Numericalmodeling of the global tsunami: Indonesian tsunami of 26 December2004. Sci. Tsunami Hazards 2005, 23 (1), 40−56.(30) Takao, M.. Tsunami Assessment for Nuclear Power Plants in Japan;Tokyo Electric Power Company: Tokyo, 2010.(31) Choi, B. H.; Min, B. I.; Pelinovsky, E.; Tsuji, Y.; Kim, K. O.Comparable analysis of the distribution functions of runup heights ofthe 1896, 1933 and 2011 Japanese Tsunamis in the Sanriku area. Nat.Hazard Earth Syst. 2012, 12, 1463−1467.(32) Fukue, N. METI hit for ‘amakudari’ habits that put retirees inTEPCO. The Japan Times, April 19, 2011.(33) Horiuchi, N.; Shimizu, K. Did amakudari undermine theeffectiveness of regulatory monitoring in Japan? J. Banking. Finance2001, 25, 573−596.
(34) Schaede, U. The Old Boy network and government-businessrelationships in Japan. J. Jpn. Stud. 1995, 21, 293−317.(35) Sovacool, B. The costs of failure: A preliminary assessment ofmajor energy accidents, 1907−2007. Energy Policy 2008, 36, 1802−1820.(36) Sovacool, B. A critical evaluation of nuclear power andrenewable electricity in Asia. J. Contemp. Asia 2010, 40, 369−400.(37) Carpenter, D. Reputation and Power: Organizational Image andPharmaceutical Regulation at the FDA. Princeton University Press:2010.(38) Carpenter, D. Protection without capture: Product approval bya politically responsive, learning regulator. Am. Political Sci. Rec. 2004,98, 613−631.
Environmental Science & Technology Policy Analysis
dx.doi.org/10.1021/es4004813 | Environ. Sci. Technol. 2013, 47, 6082−60886088