the four capital model, matrix and accounts
TRANSCRIPT

Economic Faculty, Reasearch Center, Working Papers Series,
Institute for Economic Research, Ljubljana; Occassional Papers Series,
http://www.ef.uni-lj.si/enote/rcef/delovniZvezki.asp; htpp://www.ier.si
The Four Capital Model, Matrix and Accounts Bojan Radej
1

The Four Capital Model, Matrix and Accounts
Bojan Radej*1
(cc) 2007, Bojan Radej. This work is licensed under the Creative Commons Attribution-Noncommercial-No Derivative Works 3.0 License. To view a copy of this license, visit http://creativecommons.org/licenses/by-nc-nd/3.0/.
Ljubljana, August 2007
* Associate to the Economic Faculty, Ljubljana; Independent social researcher, Ljubljana, Slovenia, [email protected]
2

THE FOUR CAPITAL MODEL, MATRIX AND ACCOUNTS
Abstract: The sustainability imperative can be translated into a claim for homothetic growth (Giraud, 1996) which equalises growth opportunities for all forms of capital: economic, social, human and natural. In order to apply this imperative, policymakers need empirical and analytically rigorous tools to present interactions between capitals as multiple and parallel. For this purpose Ekins and Medhurst (2003) compiled the four capital model based on the combined quantitative-qualitative methodology of ‘sustainability assessment framework’ that is derived from impact assessment methodology. This expert-based assessment technique is well-known in ecological and sustainable economics. The paper finds that Ekins and Medhurst applied microscopic (project) assessment approach for studying macroscopic phenomena such as development programmes consisting of tens or hundreds projects. The methodological consequence is that they could not fully utilize the potential of the model in its complexity. Thus, a more orthodox formulation is proposed which at first transforms the sustainability assessment framework into the standard Leontief’s (1970) input-output matrix from which the standard accounting tool – an integrated system of capital accounts – is derived. It is only after this adjustment of the starting model that one can tell not only how the realisation of the particular policy, plan or programme will influence each of the four forms of capital; but more relevantly, one can identify also all trade-offs and synergies that would be initiated with these policies amongst the forms of capital themselves. Recognition of these multiple relations appears as a precondition for balanced sustainable wealth creation.
Keywords: Capital; Sustainability; Input-output models; Accounting; Government Policy.
JEL Code: E22, Q56, R15, E01, I38
Acknowledgements This paper summarises some conclusions reached in the research project that was financed by the 6th EU framework research programme (http://www.srdtools.info; http://www.rra-mura.si/). I would like to acknowledge the valuable comments given to the previous version of the paper by Romeo Varga (RRA Mura), professor Paul Ekins (PSI), James Medhurst (GHK), Patrick ten Brink (IEEP), and the project team members. I would like to acknowledge the translation and language editing of Sunčan Stone. At the end I remain responsible for the consequences of eventually not listening to all of their well intended advice.
This paper has been published in Slovene version in Casopis za kritiko znanosti, Ljubljana, vol. 34, no 227 (spring 2007, http://www.studentskazalozba.si/si/knjiga.asp?ID_knjiga=996.
3

1. Introduction
Sustainability is a concept that implies balanced development from the economic,
social, human as well as natural aspect. It explicitly recognises the parallel existence of the
different components of national wealth. Previously these various aspects were studied in
isolation. It has often been the case that one form of capital, i.e. economic, has increased at
the expense of one or more of the other capital forms. To fully grasp the concept demands a
better understanding of the complex interactions between the forms of capital.
The problems come in turning the lofty aims into action for example when trying to
assess these parallel trends analytically rigorous. The sheer scope of what can be
encompassed within sustainable development raises problems of aggregation and synthesis.
However, it has increasingly become obvious that it is not possible to trace sustainable
development with one composite descriptor or indicator. Overwhelmed by the complexity of
sustainable development, policy analysts often assume that any model used to tackle the
problems of such complexity should be equally complex and impractical for everyday use. As
a result, sustainability concepts increasingly turn out to be a hostage of their own vagueness.
On the declarative level governments are committed to sustainable development,
however the existing normative system includes ‘neither a definition of sustainable
development nor any guidance on how the concept could or should be interpreted by planning
teams and programme managers’.2 In principle the notion of sustainability should be
contestable because it is intrinsically normative, subjective and ambiguous (Rotmans, 1998).
But its normative basis3 remains poorly specified, it is also too abstract for direct
measurement and there is no common measurement unit (Esty et al., 2005). The question
therefore arises: how, and with what sort of procedure, could sustainability be researched
from the various domains (capitals) simultaneously? It is our aim to develop a tool for
observing sustainable development as simultaneity of its four domains or “four capitals”.
The nature of capital has become a contentious issue for economists and social
researchers. As recognised in academic literature the different aspects of capital have been of
2 Institute for Regional Development and Structural Planning. 2000 Regional Pathways to Sustainability, Office for Official Publications of the European Communities, Luxembourg, p. 32, in Ekins et al., 2003. 3 The EU Maastricht Treaty states that ‘the Community shall have as its task, [ … ] a harmonious and balanced development of economic activities …’. The 1998 Treaty of Amsterdam went further by adopting a commitment to a ‘balanced and sustainable development’.
4

interest such as capital accumulation, wealth creation, technical efficiency, allocative
efficiency, relative factor costs and factor contributions, economies of scale, productivity and
invention (OECD, 2001). Lately, the interest in ‘capital studies’ focused on balanced
development of sometimes conflicting aspects in investment projects, programmes and
policies. So far various approaches have been proposed in economic theory by Solow,
Markandya, Pearce and Atkinson (1997) among others. The World Bank estimates the total
stocks as well as the annual changes in various capitals (Hamilton) by countries. These
methods provide results with a unilateral meaning expressed in dollars or percentage of gross
domestic product (GDP). However, they are problematic in their assumptions and without
exception too complicated and general to be used as tools in the everyday decision-making,
especially on sub-national levels, where tools with a unilateral meaning have been proven to
be rigid and weak.
Instead of purely quantitative approaches, Ekins and Medhurst (2003) proposed a
qualitative approach - expert-based evaluation of policies’ and programmes’ impacts on
various capitals. Model has been first put forward in Ekins (1992) and elaborated further in
Ekins (2000). His original solution was transplanted from the expert-based impact assessment
method which originates in ecological economics and is concerned with the balance between
economic and nature capital.4 The impact assessment approach is based on the estimation of
positive, negative or neutral impacts of proposed policies, programmes or projects on the
specified assessment criteria. This approach is both, qualitative and quantitative. It is
qualitative because impacts are studied separately in contexts that are specific to each form of
capital individually – what is seen as a positive impact is determined for each capital
differently. Yet the distinction between positive and negative impact preserves minimum
required characteristics that enable their rudimentary quantitative manipulation – aggregation.
Ekins then generalised the impact assessment approach and applied it to the assessment of the
relationship between all four capitals – the method now includes social and human
(intangible) capital, in addition to tangible (economic and natural) capital.
In the first step of the methodological procedure the experts, stakeholders in
programme preparation or even the general public, select and analyse a smaller number of
representative core or highlight indicators for each form of capital. In the second step they
4 Cf. Sadler B., R. Verheem. 1996. Strategic Impact Assessment: Status, Challenges and Future Directions. Dutch Ministry of Housing, Spatial Planning and the Environment. The Environment Impact Assessment Commission of the Netherlands; also http://www.sia-trade.org/; http://www.iaia.org/eialist.html, [VI/06]
5

evaluate how the implementation of a certain policy/programme is in concordance to the
criteria (indicators) that were chosen in the first step. Two pieces of information can be
obtained from the procedure. By aggregating the impacts of a programme across four capitals,
the model predicts the aggregate influence of programme on the sustainability of
development. By aggregating the estimates of impacts of all interventions for each form of
capital, the model predicts their aggregate impacts on each individual form of capital.
Comparing these aggregates indicates if the impacts of policy/programme on the four capitals
are equally beneficial or balanced. This method was given the name Four Capital Model.5
The logic of the impact assessment methodology is linear and causal (how policies
impact capitals) not multi-relational as implied in the concept of sustainable development. It
is illustrated below that this inconsistency can produce quite misleading assessment results.
To appraise interactive and multi-relational aspect of policies, the original four capital model
needs to be modified, and that is the intention of this paper. The modification is in full support
of the genuine motivation for the original solution (the sustainability assessment framework).
This modification enables a consistent insight into the ‘cross-sustainability’ (trade-offs)
between capitals, which brings the original idea of the four capitals to fuller expression. The
experiment supports earlier claims of social researchers for a new model for economic
development as a strategic 'portfolio management’ (Dixon et al., 1998) of the four capitals.
The paper is organised as follows: the next chapter briefly reviews existing approaches
to capital measurement in economics and social research. Then the paper proceeds with the
presentation of the original Ekins and Medhurst’s model. In the subsequent chapter, the
original model is transformed into an input-output table. The procedure is applied to the case
of the assessment of the regional development programme for the Pomurje (Slovenia) for the
period 2007-2013. In the conclusion, the main practical consequences for policymakers and
all other stakeholders of programme/policy preparation are discussed.
5 Munasinghe has used a multi-capital approach to study the sustainable development trends (1995; the three capitals model) as have Serageldin and Steer (1994; the four-capital model; both with an entirely different derivation). The four capitals approach has also been chosen as a framework in composition of genuine progress indicator (www.skills.org.uk/jordan.pdf, diagram 1.1, [III/07]).
6

2. Measuring Capital
The nature of capital and its contribution to wealth creation has been a contentious issue
for economists and social researchers. Why is it necessary to measure capital in the first
place? Because capital not only represents power and wealth but is also a generator of future
wealth. The stock of each type of capital available today is what determines potential
production in the future. Alfred Marshall draws together the threads of Austrian thinking on
capital as "scarcity" (Bohm-Bawerk, Hayek and their followers), and British views on capital
as "value" (Smith, Ricardo) to fuse them into a coherent synthesis. This perspective, however,
was opposed by Marx who saw capital as accumulated labour and capitalism as a social
relationship between owners and workers. While the synthesis was becoming concerned with
how capital could raise levels of productivity and, by making things more efficiently and
cheaply, satisfy a growing consumption demand, the Marxist were focusing primarily on the
creation of capital (Ward, 1997).
When economists reach an agreement on the theory of capital they will shortly reach
an agreement on everything else – at present there is not even an agreement as to what the
subject is about (Bliss, 1975). Different capital concepts have been put forward and the
measurement consequences depend on the perspective one chooses to adopt. The standard
approaches are presented in OECD (2001). Harris (2005) distinguishes two basic approaches:
the accounting and the economic approach. The accounting approach is in line with the non-
temporal focus of standard accounting methods that treats the appropriate financial flows as
events in the current year rather than potential future events. On the other hand the economic
approach takes the inter-temporal (current value) perspective.
Over the last two decades authors in the field of sustainable economics have added a
great deal to the development of the capital theory. Sustainability is aimed at identifying
whether societies are consuming their capital or simply living off it. Development is
considered to be sustainable either in resources (wealth) if they remain constant or rise over
time, or in utility if the consumption of present generation (wellbeing) remains constant or
rises over time. The economic approach to sustainability originates in the Hicks-Lindahl
definition of (sustainable) income as the maximum flow of benefits possible from a given set
of assets, without compromising the flow of future benefits. To sustain this flow, policies
make a deliberate choice between current consumption and current investment, and therefore
between current consumption and future consumption (Solow, 1987).
7

Eisner (1999) conflates the ex ante constant consumption with the ex post capital
maintenance approach. Defining sustainability as maintaining a capital stock is a neoclassical
stance that assumes the possibility of ‘weak’ substitution between ‘natural’ and ‘man-made’
capital. The potential for unsustainable development lies in the loss of one or more capital
stocks. Capitals are typically complements rather than substitutes in the provision of
wellbeing – thus a depletion of one asset can not generally be made good by investment in
another. This raises the question as to whether it is the total stock of capital that must be
maintained, with substitutions allowed between various forms of capital, or whether certain
capital components are non-substitutable, i.e. they contribute to wellbeing in a unique way
that cannot be replicated by another form of capital (strong sustainability). The higher stock
of economic, social and human capital in cities does not necessarily guarantee higher
sustainability in comparison with rural areas. One particular community with more equalised
opportunities for sustainable development can sometimes more than offset initially eventually
smaller overall stock of capital because their policies impose fewer negative trade-offs
between different regional resources.
Flow measures of capital have also been proposed, such as savings measures. A
nation’s saving rate is a traditional measure that is explicitly based on capital methodology.
Conventionally, gross savings rates that contain depletion of the produced capital which is
spontaneously reproduced within the monetised economy itself reveal little as regards the rate
of sustainability. Net saving that does not include depreciation is a step closer; however it still
focuses solely on the produced assets. In order to obtain a genuine measure of sustainability,
the genuine savings measure has been composed (Hamilton, 2000, 2006). It only measures
changes in the long-term stock of both produced and non-produced capital, thus also
reflecting environmental depletion. As an aggregate genuine savings, at least from the
viewpoint of measuring weak sustainability, is the most relevant indicator (Ward, 1997).
Nevertheless, defining sustainability solely in terms of capital changes is also subject to
certain complications. As no lower limit is imposed on the level of welfare, a society would
be identified as sustainable if its welfare remained low but did not drop any lower; it is also
problematic in cases where there are short-term fluctuations in welfare (Harris, 2005).
As recognised already, capital should not be assumed to be homogenous phenomenon.
Our total wealth consists of various forms of capital. This is an idea that ecological
economists have been proposing for two decades (including Ekins). At first they shed light
8
mainly on the economy-nature nexus.6 Initially, studies in social7 and human capital8 have
developed independently from sustainable economics. Today, sustainability concepts are
understood in the broadest sense, involving the parallel existence of several essentially
different domains such as three generations (present, past, future) or four capitals. Because of
this the question that is increasingly important in capital measurement is about how to
incorporate this parallelism into the measure of wealth? Accountants tried to incorporate the
ecologic costs into the system of national accounts. However, there are serious doubts that it
is possible to describe such a complex phenomena like sustainable development with the
application of only one highly aggregated measure of sustainability comparable to gross
domestic product, such as green domestic product (Measure of Economic Welfare)9 or Index
of Sustainable Economic Welfare (Daly, Cobb 1989).
The indicator approach addresses the same problem on measuring diversified capitals.
It is mainly applied by social researchers. A significant advance in the social approach,
compared with the economic and accounting approach, is not in the increase of the
preciseness of the measurement but in the increase of the variety of aspects on the basis of
which judgements are made. The idea behind it is that a small number of relatively simple (to
obtain) key indicators can sometimes successfully explain the main characteristics of the main
social phenomena. The separate indicators on economic, social and other forms of capital can
become important sustainability tools. An advantage of the indicator approach is that each of
the capitals can be specifically reported in its own terms. But nothing is really available for
free and several problems accompany this methodological approach. Their interpretative
power is more limited than usually thought. The drawback of measuring capitals in non-
monetary units is that this makes it much harder to form synthesised conclusions upon which
investors and policymakers could rely. Without combining the indicators, it is not possible to
draw any overall conclusions regarding progress towards sustainable development (Ekins and 6 Cf. Hartwick J.M. 1977. Intergenerational Equity and the Investing of Rents from Exhaustible Resources, American Economic Review, vol. 67, pp. 972-4; Solow R. M. 1986. On the intergenerational allocation of natural resources, Scandinavian Journal of Economics, No. 88, pp. 141-9. 7 Cf. Putnam R. 1995. Bowling Alone: America’s Declining Social Capital. Journal of Democracy, 6(1), pp. 65-87; Narayan D. 1999. Bonds and Bridges: Social Capital and Poverty. Washington, World Bank – Poverty group, 52 pp., http://www.worldbank.org/poverty/scapital/library/narayan.pdf; [VI/06]. Dasgupta P., I. Serageldin, eds. 2000. Social Capital: A Multifaceted Perspective. Washington, World Bank. 8 Cf. Mincer J. Investment in Human Capital and Personal Income Distribution. The Journal of Political Economy, 1958; Becker G.S 1964. Human Capital. New York: Columbia University Press. 9 Nordhaus W., J. Tobin. 1973. Is Growth Obsolete?, in Milton Moss, ed., The Measurement of Economic and Social Performance, Studies in Income and Wealth, Vol. 38, National Bureau of Economic Research, pp. 509-532.
9

Medhurst, 2003). Next, since the indicators will have positive and negative values, a problem
arises regarding the aggregation of their assessment results. Any aggregation exercise of this
type implies that a positive effect on one criterion outweighs the negative effect on another.
Responding in terms of strong sustainability, this is not necessarily the case. Hence, a
limitation of the indicator approach is that unless all indicators within the framework are
moving in the same direction (i.e. all making development more or less sustainable) it is not
possible to say whether there is an overall increase in sustainable development (ibid).
In order to find a solution for this problem in the various scientific disciplines,
sustainability thresholds have emerged as a new research field (ten Brink et al., 2007). A set
of system thresholds exist that should not be crossed for this would endanger the basic
integrity of the system. This sets out threshold points as transition points between
qualitatively alternate functionings of the systems. The use of thresholds introduces a
distinction between the different system qualities that can be observed along the interval of
possible values for each particular indicator. Negative and positive trends in social indicators
can be aggregated (averaged, regressed, correlated, benchmarked…) within each interval of
one and the same system quality, but not across the threshold values. For example, per capita
income that is below the poverty line should be strictly separated in empirical studies from
high per capita incomes. As in policymaking, qualitative judgements prevail, the distinction
between different qualities in empirical argumentation in policy studies should be explicit and
it is crucial.
While simple and uniform quantitative sustainability measures of capital remain
highly elusive, many aspects of sustainability can be measured and expressed ‘at least’
qualitatively. These techniques are appropriate, if not even obligatory, for researching
subjects that are qualitative by nature. Undoubtedly sustainable development can be
understood as a qualitative subject. Capital possesses both quantity and quality components
(Ward, 1997). The ‘quality’ approach is concerned with the distinction between acceptable
and unacceptable trade-offs amongst capitals. The outputs or impacts of policies/programmes
can be categorised as ‘favourable’ or ‘unfavourable’ (GHK et. al, 2002). Unacceptable
impacts that breach some critical thresholds of sustainability should normally be eliminated as
a possible policy/programme. The ‘favourable’ represent the desired outputs, as well as any
positive incidental external effects that may be associated with it. The ‘unfavourable’
represent the negative effects, including capital depreciation, pollution and other negative
10

externalities that contribute to environmental damages, human health, etc. Insofar as they
have an effect on capital stocks, the ‘unfavourable’ can be regarded as a negative investment.
So the main intention of the qualitative assessment techniques is not to accurately measure the
effects but merely characterise them (their mutual relationships and trade-offs) as non-
acceptable, negative, neutral or positive.
In the continuation the model is applied to the case assessment of the regional
development programme for the Pomurje region, for the period 2007-2013 (RDPP; Radej,
2006). Ekins and Medhurst’s starting point is then transformed into an input-output matrix of
the four capitals which makes it possible to introduce a standard social accounting approach –
this enables the simulation of accounting framing of qualitative pieces of information - see the
flowchart bellow. This finally permits treating the four capitals consistently, in the sense that
it is rational from the viewpoint of the region and democratic from the viewpoint of the
special interests of stakeholders as represented by each form of capital (see Arrow, 1951).
11

Chart 1: Flow-chart of the extended four capital model
Selection of priority measures of Regional Development Programme
Is a measure sustainable (relative to the critical thresholds)?
No Yes
Abandon this measure, find an alternative
IMPACT ASSESSMENT
Select Crtiteria NORMATIVE JUDGEMENT
Compose a frame (measures by criteria)
Table 1 Experts' assesment
Results aggregated by… Table 2 …measures
…criteria/capitals SOCIAL ACCOUNTING
Table 3 IO matrix of 4c
Table 4 Capital Accounts
2.1 The original four capital model
Ekins and Medhurst (2003) constructed their model from the sustainability assessment
framework (SAF; Table 1), which will be explained using the assessment of the above
mentioned programme as an example. In the sustainability assessment framework, the various
capitals are represented through the use of a range of criteria – domain specific and
representative indicators – which relate to the most important regional development issues as
determined by regional stakeholders.
The criteria selection is usually a normative choice as articulated through the political
process. The assessment is framed by the reference of regional development programme’s
measures to the relevant impact criteria – indicators as positive, negative or neutral impacts
12
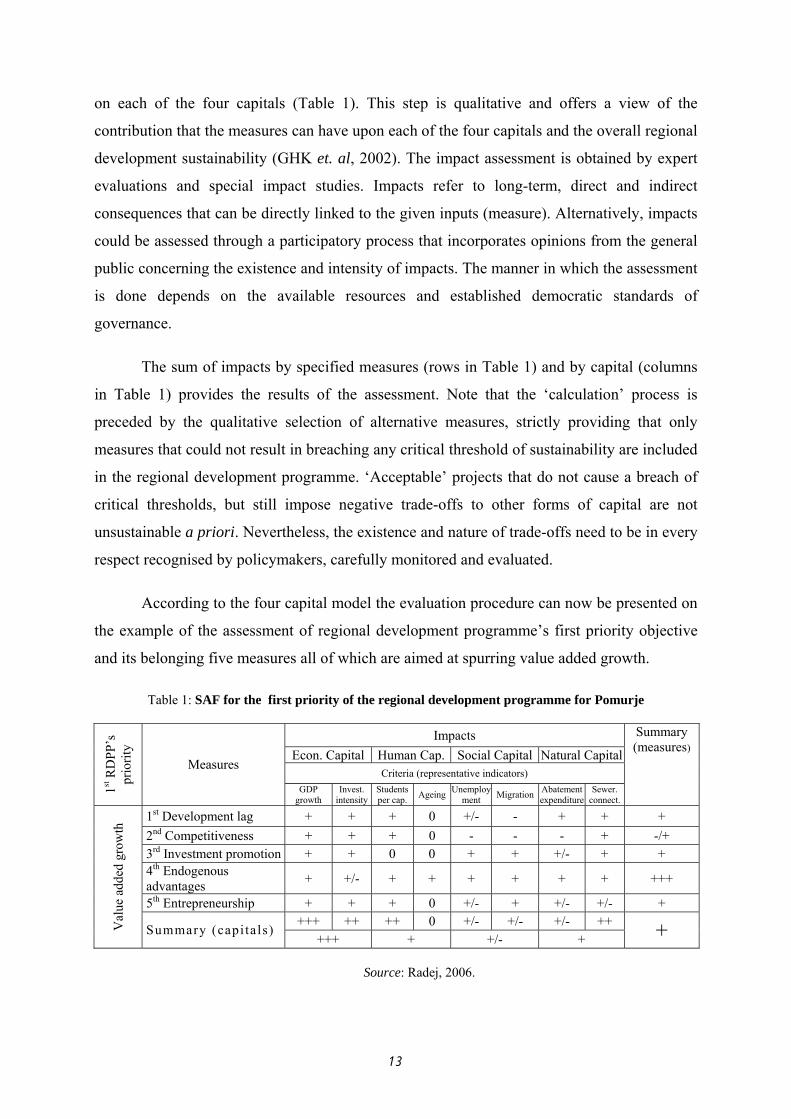
on each of the four capitals (Table 1). This step is qualitative and offers a view of the
contribution that the measures can have upon each of the four capitals and the overall regional
development sustainability (GHK et. al, 2002). The impact assessment is obtained by expert
evaluations and special impact studies. Impacts refer to long-term, direct and indirect
consequences that can be directly linked to the given inputs (measure). Alternatively, impacts
could be assessed through a participatory process that incorporates opinions from the general
public concerning the existence and intensity of impacts. The manner in which the assessment
is done depends on the available resources and established democratic standards of
governance.
The sum of impacts by specified measures (rows in Table 1) and by capital (columns
in Table 1) provides the results of the assessment. Note that the ‘calculation’ process is
preceded by the qualitative selection of alternative measures, strictly providing that only
measures that could not result in breaching any critical threshold of sustainability are included
in the regional development programme. ‘Acceptable’ projects that do not cause a breach of
critical thresholds, but still impose negative trade-offs to other forms of capital are not
unsustainable a priori. Nevertheless, the existence and nature of trade-offs need to be in every
respect recognised by policymakers, carefully monitored and evaluated.
According to the four capital model the evaluation procedure can now be presented on
the example of the assessment of regional development programme’s first priority objective
and its belonging five measures all of which are aimed at spurring value added growth.
Table 1: SAF for the first priority of the regional development programme for Pomurje
Impacts Econ. Capital Human Cap. Social Capital Natural Capital
Criteria (representative indicators)
1st R
DPP
’s
prio
rity
Measures
GDP growth
Invest. intensity
Students per cap. Ageing Unemploy
ment Migration Abatement expenditure
Sewer. connect.
Summary (measures)
1st Development lag + + + 0 +/- - + + + 2nd Competitiveness + + + 0 - - - + -/+ 3rd Investment promotion + + 0 0 + + +/- + + 4th Endogenous advantages + +/- + + + + + + +++
5th Entrepreneurship + + + 0 +/- + +/- +/- + +++ ++ ++ 0 +/- +/- +/- ++ V
alue
add
ed g
row
th
Summary (capi ta ls) +++ + +/- + +
Source: Radej, 2006.
13

Table 1 illustrates that the first measure of the first regional development programme
priority objective deals with the reduction of the development lag in the income per capita.
The implementation of this measure will, of course, have a favourable influence on the
growth of gross domestic product per capita and the growth of investments – this implies a
sustainable favourable overall impact on the economic capital. Next, the reduction of the
development lag would most probably result in an increase in the number of students
(favourably impacting regional human capital) who would have to emigrate to other regions,
as the Pomurje region has no university capacities. This migration will certainly have a
negative impact on social capital. The influence of the income gap reduction on the natural
capital will be favourable, because poverty itself is seen as a driver of nature degradation in
the region – inter alia it will induce new investments on the construction of collection and
purification of the waste water systems. Next, it is forecast that the impact of reducing the
development (income) gap on unemployment will be mixed. The growth of the regional
income will increase the purchasing power of households, which will favourably influence
demand, spending, production and employment. However, it is to be expected that the internal
distribution of growth effects will not be equally spread and will increase the income
differences within the region. It is feared that closing down the income gap externally –
relative to the national average – will result in increased income differences internally. In such
a way, lowering the regional income gap, which is essential for the sustainability of economic
capital, is seen as possibly damaging to the regional social capital.
In the same way as experts have evaluated the possible impacts of the first regional
development programme’s measure on the four regional capitals they also evaluated the rest.
Then all the impacts from Table 1 are summarised by rows, which means that first one
removes one ‘+’ for every ‘-’ or ‘+/-’ from the addition and then one adds the remaining ‘+’
according to a certain rule: for instance three pluses in a row produce one plus in the row sum
at the right edge of the Table 1 – this is characterised as a ‘weak positive influence’ of
measure upon the regional sustainable development; four pluses in a row give two pluses in
the row sum and this is read as a ‘positive influence’; five pluses or more contribute three
pluses in the row sum which is interpreted as a ‘strong positive influence’ of the particular
measure on the sustainable development. This is how the rows are summarised. The impacts
of individual measures in columns have to be summarised in the same way but with a
different ‘weighting’, depending on the number of measures that are included in a particular
regional development programme’s priority objective. Those with a larger number of
14

measures have to correspondingly exhibit a higher number of positive impacts in order to be
evaluated in the summary of the column as weakly, normally or strongly positive –
sustainable.10 Such an adding procedure is imprecise, quite artificial and in a way impractical.
However, it also exhibits certain advantages: it should be remembered that one is dealing with
phenomena for which there are no ideal measuring tools, nor can they be assessed purely
quantitatively.
Let’s return to the interpretation of the assessment results for the first regional
programme’s priority objective in Table 1.The impact that all measures of this programme
priority objective have on the individual capital is displayed in the sum column and is
obtained as the mean of the assessed impacts of the measures on the two previously selected
criteria. It can be seen that the realisation of the first regional development programme
priority objective will have a strong positive influence on economic capital, a weak positive
influence on human and natural capital, and a mixed positive/negative impact on social
capital.
As shown by the sum of all row and column sums in Table 1 (in the bottom right
corner) the first priority objective of regional development programme will only modestly
contribute to the regional sustainable development. The impacts will be extensive, and mixed,
accompanied by considerable negative trade-offs between capitals, most of which are linked
to efforts to increase competitiveness of the regional economy (second measure).
Following the same procedure as described above the impacts of the remaining (five)
priorities of regional development programme are assessed (Table 2). In the continuation the
results for all six priorities and thus for the entire regional development programme are
presented and analysed. The first row has been transferred from Table 1 (the sum column).
The second row in Table 2 shows that tourism as the second regional priority will also only
have a weak sustainable impact upon the regional development (sum rows). The main reason
for such a disappointing result can be revealed from the disaggregated assessment of its
measures (which goes beyond the remit of this paper) which mainly deal with the formation
of the tourist infrastructure – organisational, informational, business – i.e. measures that have
only a small medium-term contribution to the four regional capitals.
10 The impact evaluation could be weighted according to the amount of financing that is allocated for each measure in the financial budget of the regional development programme for Pomurje. Of course in this case one would also have to derive weighted sums for the sustainability assessment framework.
15

Table 2: Sustainability Assessment Framework for the regional development programme for Pomurje Impact on capitals
RDPP Priorities Economic Capital
Human Capital
Social Capital
Natural Capital
Summary (priorities)
1 s t Value added growth +++ + +/- + + 2 n d Tour ism + 0 0 0 + 3 r d Heal th 0 + + 0 0 4 t h Rural development +++ + + ++ ++ 5 t h Infras tructure +++ + ++ ++ ++ 6 t h Environment + + + + + RDPP – Overal l impact on the four capi tals ++ + + + +
Source: Radej, 2006.
The most problematic is the contribution of the third priority, i.e. the priority linked to
health. The zero in the sum row indicates that the four regional capitals will not be observably
improved with these measures. The explanation behind this is that corresponding measures
are excessively sectored (not seen) – i.e. relevant for regional health institutions with too
small an association to the other regional concerns, such as for instance producing healthy
food and access to drinking water, health tourism, and social economy. The most sustainable
impact on the regional capitals with two pluses in the sum row will be held by the realisation
of the fourth and fifth regional development programme priority.
Table 2 suggests the following conclusions. The aggregate impacts of regional
development programme on four capitals do not appear to be very problematic. Regional
development programme will positively influence the economic capital, while it will have
only a weak positive impact on the remaining three capitals. All aggregate impacts are
positive, the differences are relatively small and overall development relatively balanced
between the main four domains of sustainability. In this way, the four capital assessment as
proposed by Ekins and Medhurst (2003) would result in acceptance of overall regional
development programme. This certainly would not represent an enthusiastic acceptance, but is
also far from a rejection of the programme, which promises to increase the total stock and
stock of each capital and thus obviously contributes to the improvement of social welfare in
the present and in the future.
By deriving these main conclusions the core purpose of using the original Ekins and
Medhurst’s assessment model is fulfilled. However, the whole message of experts’
assessment is far from exhausted. The entire regional development programme will according
to the predictions of the participating experts have merely a weak positive influence on the
sustainable development of the Pomurje region (one plus in the lower right corner). This is a
16
consequence of the fact that these regional development programme measures and their
impacts are not sufficiently coordinated and linked in the desired pattern. Instead, they only
asymmetrically serve certain specific needs (interests) of the stakeholders, and the collective
‘multiplication effect’ from the integration of measures is therefore almost absent. The
equality of opportunities aspect for all regional capitals remains largely unexplained by the
original model. Development may be balanced, providing positive impacts of programmes on
the four capitals but still not providing equal opportunities for growth which is crucial for
regional sustainability. This means that different aspects of balanced development should be
differentiated in policy analysis. The sustainability imperative for homothetic growth (Giraud,
1996) which demands equalisation of growth opportunities for all forms of capital needs to be
understood in the context of balance between capitals rather than the balance between policy
impacts.
Ekins and Medhurst’s version of the model enables the study of the influence of
regional development programmes on the four capitals but does not address trade-offs
between the four capitals themselves. In the continuation this paper focuses on this aspect.
This does not change the conclusions derived so far, but the adaptation of the basic model
moves the idea of the four capital model to its maximum expression. The proposed solution
also changes the sole assumption of the nature of the assessment effort – it is no longer a
unidirectional causality of standard assessments of policy effectiveness. The adjusted model
focuses instead on multi-causal, relational questions. That advances the four capital model
from being merely an evaluative tool into a tool that might help organise policymaking on
sustainable development.
2.2 Transforming the original four capital model
The Ekins and Medhurst’s solution can be adapted without difficulty in the desired
direction. When constructing the sustainability assessment framework, Ekins and Medhurst
(2003) started from the well-established method of impact assessment that has been standard
practiced for assessing microphenomena such as investment projects (i.e. as environmental
impacts of construction of a power plant or highway). However Ekins and Medhurst (2003)
used this methodology to evaluate macrophenomena such as development programmes that
include tens or even hundreds of very different investment projects. This inconsistency in the
17
scale of the starting model can be avoided by adapting the assessment procedure. The
adaptation pertains to rows in Table 2. The measures of regional development programme are
seen by Ekins and Medhurst (2003) as inputs into regional capitals, and can thus also be
grouped according to which form of capital they are predominantly invested in.
The first, second and fourth priority serve mainly for the growth of the economic
capital, thus these three rows in Table 2 are treated as being intended for the growth of
economic capital. The third priority (health) mainly serves the human capital; the fifth priority
(infrastructure) serves the social capital, while the sixth priority (environment) serves the
natural capital.11 On the other side, the outputs are gathered in columns that show how
effective the individual inputs will be, and how they impact the regional capitals. Output is
understood as a change in the quality and quantity of each capital at the end of the concerned
period relative to the present.
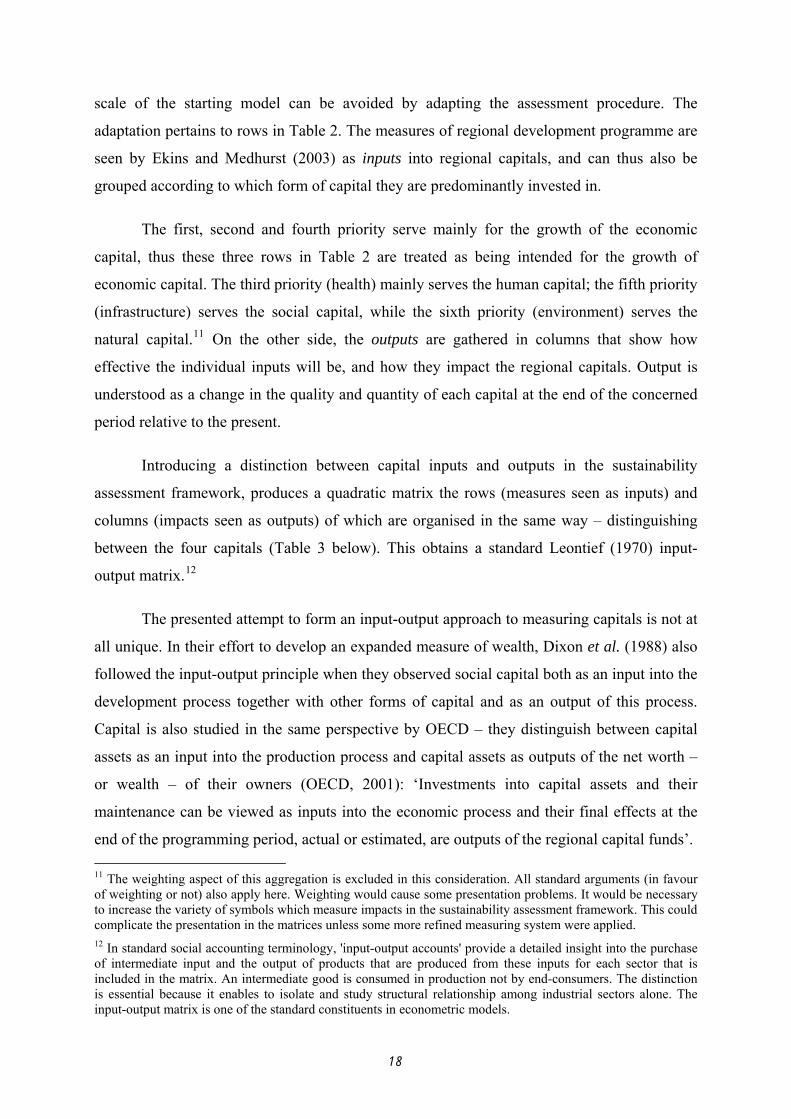
Introducing a distinction between capital inputs and outputs in the sustainability
assessment framework, produces a quadratic matrix the rows (measures seen as inputs) and
columns (impacts seen as outputs) of which are organised in the same way – distinguishing
between the four capitals (Table 3 below). This obtains a standard Leontief (1970) input-
output matrix.12
The presented attempt to form an input-output approach to measuring capitals is not at
all unique. In their effort to develop an expanded measure of wealth, Dixon et al. (1988) also
followed the input-output principle when they observed social capital both as an input into the
development process together with other forms of capital and as an output of this process.
Capital is also studied in the same perspective by OECD – they distinguish between capital
assets as an input into the production process and capital assets as outputs of the net worth –
or wealth – of their owners (OECD, 2001): ‘Investments into capital assets and their
maintenance can be viewed as inputs into the economic process and their final effects at the
end of the programming period, actual or estimated, are outputs of the regional capital funds’. 11 The weighting aspect of this aggregation is excluded in this consideration. All standard arguments (in favour of weighting or not) also apply here. Weighting would cause some presentation problems. It would be necessary to increase the variety of symbols which measure impacts in the sustainability assessment framework. This could complicate the presentation in the matrices unless some more refined measuring system were applied. 12 In standard social accounting terminology, 'input-output accounts' provide a detailed insight into the purchase of intermediate input and the output of products that are produced from these inputs for each sector that is included in the matrix. An intermediate good is consumed in production not by end-consumers. The distinction is essential because it enables to isolate and study structural relationship among industrial sectors alone. The input-output matrix is one of the standard constituents in econometric models.
18

Table 3: Input-output matrix of the four capitals for the regional development programme for Pomurje Impacts (outputs)
Economic capital Human capital Social capital Natural capital Economic capital +++ + +/- + Human capital 0 + + 0 Social capital +++ + ++ ++
Mea
sure
s (in
puts
)
Natural capital + + + + Source: Radej, 2006.
This matrix offers a relational view of the trade-offs and resulting cross-sustainability
between capitals that would most likely realise with the implementation of the concerned
regional programme. The value added of the matrix presentation can be easily grasped
comparing it to the summary row in Table 2 – aggregate programme impacts on the four
capitals. The purpose of adapting the original sustainability assessment framework into a
matrix becomes clear when the matrix is cut into eight strips by row and corresponding
column – the first row and the first column, the second row and the second column, etc. Then
the appropriate strips are repasted into pairs that actually compose a set of ‘integrated capital
accounts’ (Table 4). This organising principle offers a consistent insight into the relations
between included domains (industries, commodities, capitals).
In social accounting, an ‘account’ is merely intended as a tool that displays changes in
each sector so as to imply a balancing item that equates the two sides of the account (between
revenues and expenditures or between inputs and outputs). In the national accounts system,
the ‘capital account’ meets the following identity: closing stock of capital = opening stock +
production of capital - consumption of capital ± revaluation of capital.13 In the four capital
accounts, the input and output of capital accounts refer only to the changes that are recorded
in the second and the third item of the equation. This focuses the approach on the
measurement of changes in capitals.
The unified collection of all individual sector accounts comprises the full set of
integrated sector accounts. Canadian statisticians emphasised ‘the fundamental importance of
supporting whatever set of sustainable development indicators ... in the form of a set of
integrated accounts. This is an out-and-out necessity if the indicators are to enjoy any use
beyond attracting headlines in newspapers’ (Smith, Simard, 2001).
13 In the balance of payments statistics the 'capital account' is defined differently, as an account that records all transactions between a domestic and foreign resident that involves a change of ownership of an asset. It is the net result of public and private international investment flowing in and out of a country http://www.statcan.ca/english/nea-cen/about/io.htm, [VI/06].
19

The system is presented in Table 4 below. Every capital account comprises of two
columns. Take the social capital account example in Table 4c below: the first column (input)
is transposed from the third row in Table 3 and indicates the impacts of realising the measures
that primarily increase the stock of the social capital on each of the four capitals; the first
column of the social capital account thus indicates how strong and favourable are the impacts
of the regional social measures upon the growth of the four capitals. The second column of
the social capital account (output) is obtained from the third column in Table 3 and indicates
the opposite, i.e. the impacts of realising the regional development programme’s priority
objectives for strengthening E, H, (S) and N on the S.
Table 4: Integrated system of capital accounts for the regional development programme for Pomurje Table 4a. Economic capital account Table 4b. Human capital account
E (input) E (output) H (input) H (output) Economic capital (E) +++ +++ Economic capital + 0 Human capital (H) + 0 Human capital + + Social capital (S) +/- +++ Social capital + + Natural capital (N) + + Natural capital + 0
Table 4c. Social capital account Table 4d. Natural capital account S (input ) S (output) N (input) N (output) Economic capital +++ +/- Economic capital + + Human capital + + Human capital + 0 Social capital ++ ++ Social capital + ++ Natural capital ++ + Natural capital + +
Source: Radej, 2006.
The practicality of the integrated system of capital accounts can easily be grasped with
the exposition of, once again, the social capital account. It is read row-by-row. In the upper
row it can be seen that the realisation of regional development programme’s measures
intended for the S (as inputs) will, according to the opinions of evaluators, positively effect
the growth of E (three pluses); when the measures primarily intended for the growth of E will
be enforced this will have partially negative and partially positive effects on the regional S (as
output; +/-). The regional development programme is formed such that the investments into S
will be highly integrated into the regional needs on the economic field, but not the opposite
(mirror information can be obtained from the third row of the economic capital account in
Table 4a). A similar yet smaller imbalance is indicated between N and S. In Pomurje, 40% of
region is represented by protected nature reserves, the abundance of natural resources are
poorly put to use in the sense of speeding the local communities’ sustainable development.
On the contrary, a detailed analysis (not presented here) reveals that a large part of the natural
resources remained intact merely due to the weakly linked economic and social capital in
these communities, which result in the abandonment of agricultural land and depopulation. In
protected areas the improving N is linked to the weaknesses of S, while in all other non-
20

protected areas with the prevailing industrial and intensive agricultural development, the
growth of E is the cause behind the stagnation of S. However, it is clear that sustainable
development cannot be built on the basis of systematic destruction of certain regional capitals.
In Pomurje, unilateral economic growth – as well as unilateral natural protection – causes
comparable unsustainability upon S. This aspect of cross-(un)sustainability would remain
entirely hidden if sustainable development trends were assessed only with the sustainability
assessment framework.
Let’s continue by reading the social capital account. From the second row in Table 4c
it can be seen that the trade-offs between S and H are balanced, however their links are
merely weak. This is a great problem, for both S and H are two forms of the same intangible
capital. This discovery means that the regional development programme draws a strong line
not only between S and E for the benefit of E but also between intangible and tangible
capitals for the benefit of the latter. In this sense the social capital account offers a basis for
the demand for a more dematerialised development of the region.
Therefore measures that are predominantly oriented towards S will influence the
development of the region more favourably than the regional development measures will
impact S. Even though regional development programme will weakly improve the growth of
the regional S, S will on average continue to be ‘demoralized’ by the other three capitals.
From the aspect of S, regional development programme will further deepen the existing
imbalances between the regional capitals. This means that following the realisation of
regional development programme, the difference between S and the remaining three capitals
will be even greater than today – mainly due to the poorly integrated priorities and measures
between each other.
With the insight into the economic capital account (Table 4a) one ascertains that S and
H will contribute greater positive effects for the growth of E, than the growth of E will
positively influence the growth of S and H. The growth of E is dependent on the state of S, H
and N and this dependency will only increase with the implementation of regional
development programme. From the relational (matrix) reading of the four capital model one
can finally reach the following conclusion on regional development programme as regards the
four capitals: H and N are the most poorly integrated into the ‘regional function of welfare’; S
and E are trapped in interactions that are much more fertile for E than S; the level of mutual
integration of H, S and N is low. This pattern of cross-sustainability could not be identified
21

from the initial constitution of the model. This relational insight is relevant because it
introduces more rigorous way of assessing equality of opportunities between capitals. With
the identification of these relations between the four capitals, the model and its evaluative
potential are taken to their maximum. The transformation also fully supports the genuine
motivation that stands behind Ekins and Medhurst’s original solution (the sustainability
assessment framework).
3. Conclusion
Preparing a sustainably consistent policy/programme is by no means simple. It is difficult
to improve welfare with a single form of capital – simple unilateral solutions are rare and far
between. The status of Pomurje as developmentally the most depressed region in Slovenia, for
instance, which ensures the highest inflow of development aid cannot in itself contribute to
the regionally optimal ranking of programme’s priorities, and even less can it contribute to
integration between programme measures. On the contrary, pouring money into the region
just because it is ‘less developed’ could further deepen existing, as well as cause entirely new,
imbalances and fragmentation. The most vulnerable groups of regional population have a
poorer capability of taking advantage of the new opportunities (financing) and are therefore
taken advantage of by those who are better off anyway, thus amplifying the gap. In spite of
the credible possibility that new opportunities are felt by both groups – if not equally for all
regional ‘capitals’ – this would further decrease social cohesion in the region.
Large, systematic and persistent regional disparities are obviously linked to the failure of
those responsible for governance to coordinate their own policies and measures. This points to
the institutional aspect of sustainability and unsustainability. In light of the identified capital
trade-offs (Table 4), the agency should in particular take an interest in whether the holders of
all four capitals have the same possibilities to express their grounds and specific interests in
the preparation of the programme, particularly the qualitative aspects – in the selection of
evaluation criteria, thresholds levels and in the assessment of probable impacts of proposed
policies/programmes. A special deliberation algorithm based on the four-capital idea has
recently been proposed, which can help agencies to organise negotiations between
stakeholders (O’Connor et. al, 2007). This confirms the opinion that the four-capital idea
possesses far greater applicability than solely for policy analysis purposes. Its relational
22

dimension can be fruitfully employed in framing the discussion about trade-offs (synergies)
and decision-making, with regard to the alternative programme choices. Given that the
sustainable concept is normative, i.e. in a way political, it is this relational capability of the
expanded model that is most valuable.
The proposed generalisation of the Ekins and Medhurst’s model results in simple,
context-specific tool, that is informationally undemanding and highly flexible. The main aim
of the paper has been achieved. Any model can really provide a definitive and uniform vision
of sustainability, but this certainly does not inhibit analytically-rigorous reasoning on
sustainable development. This experiment suggests that ‘complexity’ of phenomena like
sustainable development is rather straightforward and can be presented as ‘simple,’ on
condition that phenomena is recognised in its main domains as simultaneous and relational. It
is only when complex phenomena broken down to their ‘main’ factors are researched
separately from each other, as in standard economic and social research, that they cannot be
presented in a consistent and simple way. This methodological reductionism appears to be the
main reason for the present hesitation of policymakers to move their focus from a mono-
causal to a multi-causal presentation of social reality and policy choice. Here the author is in
full accord with Ekins and Medhurst (2003) who recognised that the four capital approach
allows exactly for this ‘radical challenge to the prevailing inertia in policymaking’.
23

References
1. Arrow, K., 1951. Social Choice and Individual Values, 2nd ed. (1963), New Haven: Yale University Press.
2. Atkinson, G., Doubourg, R., Hamilton, K., Munasinghe, M., Pearce, D., Young C., 1997. Measuring Sustainable Development: Macroeconomics and the Environment. Lyme: Edward Elgar Publishing.
3. Bliss, C.J., 1975. Capital Theory and the Distribution of Income. Amsterdam: North-Holland.
4. Brink ten, P., Miller, C., Kettunen, M., Ramsak, K., Farmer, A., Hjerp, P., Anderson, J., 2007. Critical Thresholds, Evaluation and Regional Development. Brussels and London: Institute for European Environmental Policy, manuscript.
5. Daly H., Cobb J., 1989. For the Common Good. Boston: Beacon Press.
6. Dixon, J., Bakkes J., Hamilton, K., Kunte, A., Lutz, E., Pagiola, S., Xie, J. 1998. Expanding the Measure of Wealth. Indicators of Environmentally Sustainable Development. Washington: World Bank - Environment Department.
7. Eisner, R., 1999. Extended Accounts for National Income and Product. Journal of Economic Literature, 26, 1611-84.
8. Ekins, P., 1992. A Four-Capital Model of Wealth Creation. In Ekins, P., Max-Neef, M. (Eds.). Real-Life Economics: Understanding Wealth Creation. London/New York: Routledge, 147-155.
9. Ekins, P. 2000. Economic Growth and Environmental Sustainability: the Prospects for Green Growth, Routledge, London/New York.
10. Ekins, P., Medhurst, J., 2003. Evaluating The Contribution Of The European Structural Funds to Sustainable Development. Presented at the 5th European Conference on Evaluation of Structural Funds, Budapest, June 26-27, http://europa.eu.int/comm/regional_policy/sources/docgener/evaluation/rado_en.htm, [VI/06]
11. Esty, D.C., Levy, M., Srebotnjak, T., de Sherbinin, A., 2005. Environmental Sustainability Index: Benchmarking National Environmental Stewardship. New Haven: Yale Center for Environmental Law & Policy, http://www.yale.edu/envirocenter, [XII/06]
12. GHK, PSI, IEEP, CE, National Evaluators. 2002. The Contribution of the Structural Funds to Sustainable Development. Concepts and Methods. Volume 2; Brussels: DG Regio, EC; http://www.psi.org.uk/research/project.asp?project_id=10, [VI/06].
13. Giraud, P.N., 1996. L’Inégalité du Monde. Économie du monde contemporain. Paris: Éditions Gallimard.
14. Harris, M., 2005. The Income Of Nations: Measurement With (What?) Theory. Sydney: University of Sydney, Environmental Economics Network workshop, Australian National University, May; htpp://een.anu.edu.au/e05prpap/harris.doc, [VI/06].
15. Hamilton, K., 2000. Genuine Saving as a Sustainability Indicator. Washington: World Bank, Paper No. 77, Environmental Economics Series, http://www-esd.worldbank.org/eei/, [VI/06].
16. Hamilton, K., Ruta, G., 2006. Measuring Social Welfare and Sustainability. Washington: World Bank, Environment Department, June 8, www.iaos2006conf.ca/pdf/Kirk%20Hamilton.pdf, [XII/06].
17. Leontief, W., 1970. Environmental Repercussion and the Economic Structure: An Input-Output Approach, Review of Economics and Statistics, 52 (August), 202-271.
18. Munasinghe, M., 1995. Environmental Economics and Sustainable Development. Washington: World Bank Environment Paper No. 3.
19. OECD. 2001. Measuring Capital. Measurement Of Capital Stocks, Consumption Of Fixed Capital And Capital Services. Paris: OECD, www.sourceOECD.org, [VI/06].
20. O’Connor, M., Bureau, P., Reichel, V. 2007. Deliberative Sustainability Assessment With the On-line Kerst Deliberation Support Tool. Guyancourt: C3ED, Université de Versailles St-Quentin-en-Yvelines, http://kerdst.c3ed.uvsq.fr, http://iacaprod.c3ed.uvsq.fr/kerdst2, [I/07].
21. Radej, B., 2006. Assessment of Structural Funds. Effectiveness on Sustainable Development - Pomurje Regional Case Study. Final report, November. 6th Framework Programme; Framework project SRDTOOLS: Regional Sustainability Appraisal: Developing Evaluation Methods and Sustainable Policies (Contract SCS8-CT-2004-502485), Murska Sobota: Regionalna razvojna agencija Mura.
24

25
22. Rotmans, J., 1998. Methods for IA: The Challenges and Opportunities Ahead. In Rotmans, J., Vellinga, P. (Eds.)., Challenges and Opportunities for Integrated Environmental Assessment; Environmental Modelling and Assessment 3(3), Special issue: pp. 155–179.
23. Serageldin, I., Steer, A. (Eds.). 1994. Making Development Sustainable: From Concepts to Action. Washington, World Bank, Environmentally Sustainable Development Occasional Paper Series, No 2.
24. Smith, R., Simard, C., 2001. A Proposed Approach To Sustainable Development Indicators Based On Capital. Ottawa: Joint ECE/Eurostat Work Session on Methodological Issues of Environment Statistics, 1-4 October, Statistics Canada, Working Paper No. 9, htpp://www.unece.org/stats/documents/2001/10/env/wp.9.e.pdf, [IX/06].
25. Solow, R.M., 1986. On the intergenerational allocation of resources. Standford Journal of Economics, 85, 141-149.
26. Solow, R.M., 1987. Growth Theory and After. Lecture to the memory of Alfred Nobel. The Sveriges Riksbank Prize in Economic Sciences. Stockholm: The Nobel Foundation, December 8, http://www.nobel.se/economics/laureates/1987/, [VI/06].
27. UNCSD. 1996. Indicators of Sustainable Development: Framework and Methodologies. New York: UN Commission on Sustainable Development.
28. Ward, M., 1997. From Pleioscene To Plasticine - The Age of Capital Measurement. Conference on Measurement of Capital Stocks, 10-14 March, Washington: The World Bank, www.oecd.org/dataoecd/8/14/2666716.pdf, [VI/06].