the food crisis, water crisis and economic development: food scarcity water scarcity poverty simon...
TRANSCRIPT
The food crisis, water crisis and economic development:
Food scarcityWater scarcity
Poverty
Simon Cook Basin focal projects
Challenge Program on Water and Food
FANRPAN Regional Policy Dialogue 2 Sep 09
My talk…
• Global crisis of food, water and development
• How does this crisis appear in river basins?
• Realities and underlying causes? • Conclusions and policy targets
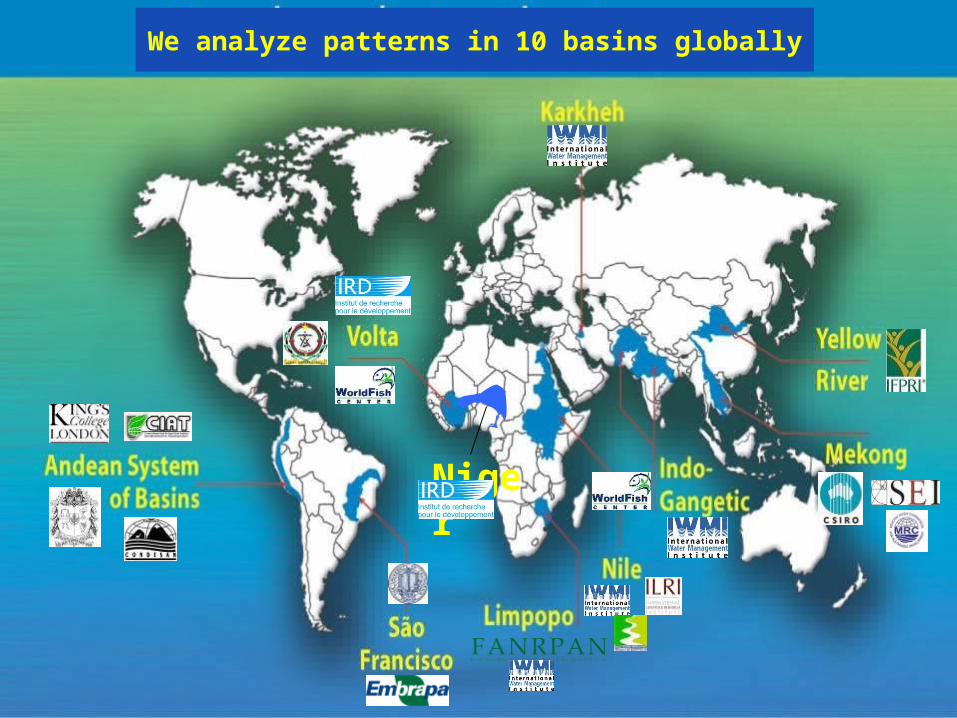
Niger
We analyze patterns in 10 basins globally
FANRPAN Regional Policy Dialogue 2 Sep 09
Why study at a GLOBAL scale?
• To understand drivers of problems– These are not random
• To compare across basins– Solutions often come from outside
• To enable judgments under uncertainty– Sometimes it helps to know why
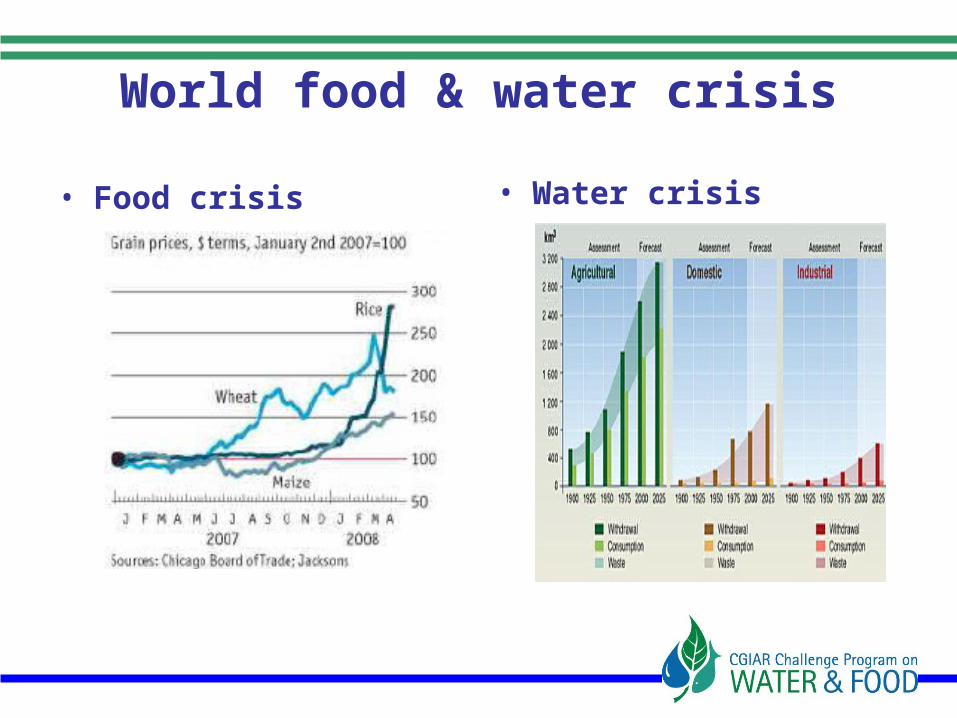
World food & water crisis
• Food crisis • Water crisis
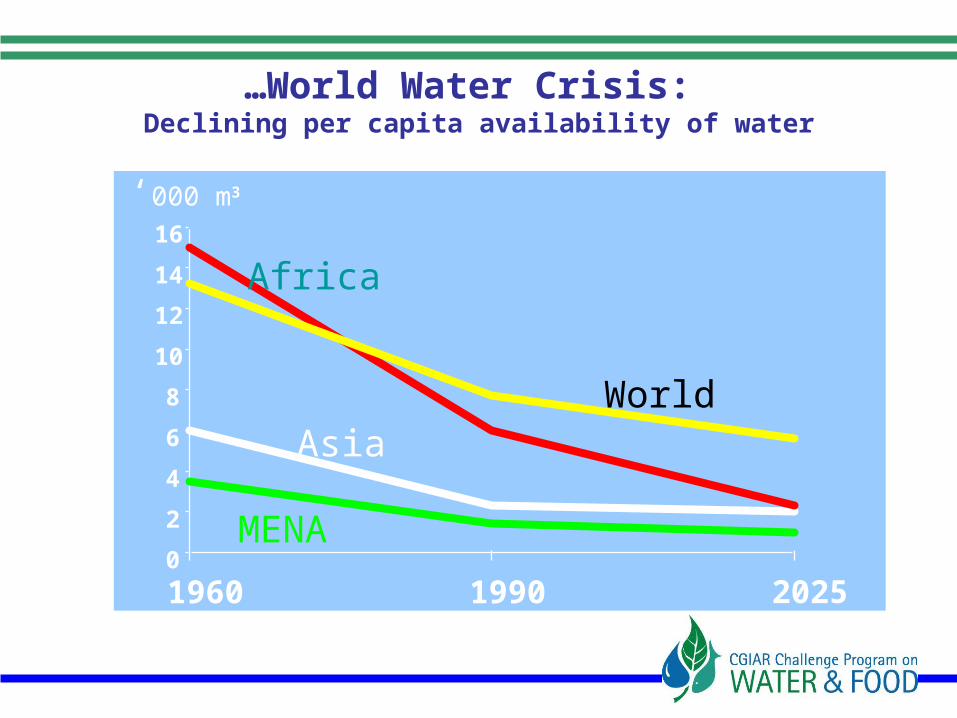
…World Water Crisis: Declining per capita availability of water
0
2
4
6
8
10
12
14
16
1960 1990 2025
Africa
WorldAsia
MENA
‘000 m3
FANRPAN Regional Policy Dialogue 2 Sep 09
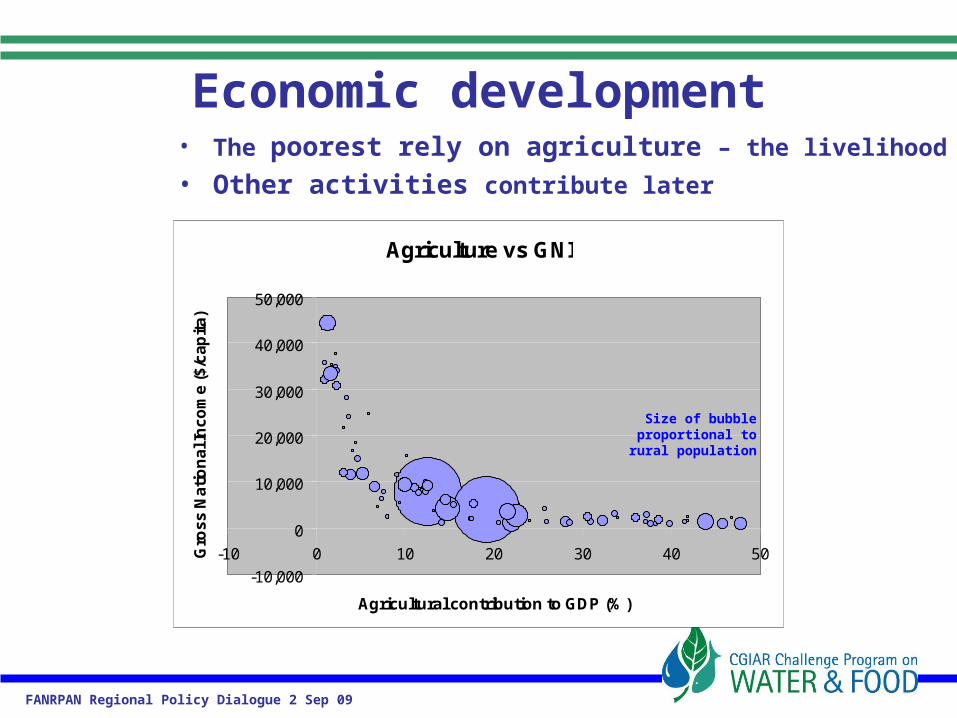
Agriculture vs GNI
-10,000
0
10,000
20,000
30,000
40,000
50,000
-10 0 10 20 30 40 50
Agricultural contribution to GDP (%)
Gro
ss
Na
tio
na
l In
co
me
($
/ca
pit
a)
• The poorest rely on agriculture – the livelihood base
• Other activities contribute later
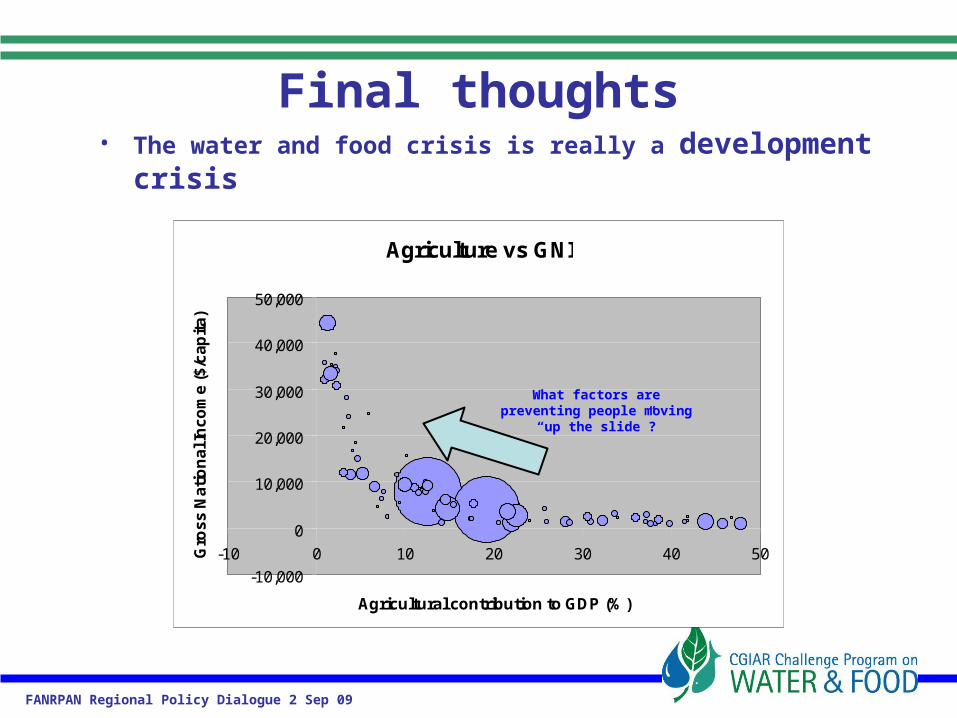
Size of bubble proportional to rural
population
Economic development
FANRPAN Regional Policy Dialogue 2 Sep 09
Global picture
• Food production must increase• …food production consumes huge volumes
of water • Other demands also increasing • Food & water systems need co-
development to support broad change• …without compromising environmental
flows
What the food & water crisis looks like in river basins

FANRPAN Regional Policy Dialogue 2 Sep 09
Limpopo

FANRPAN Regional Policy Dialogue 2 Sep 09
FANRPAN Regional Policy Dialogue 2 Sep 09
FANRPAN Regional Policy Dialogue 2 Sep 09
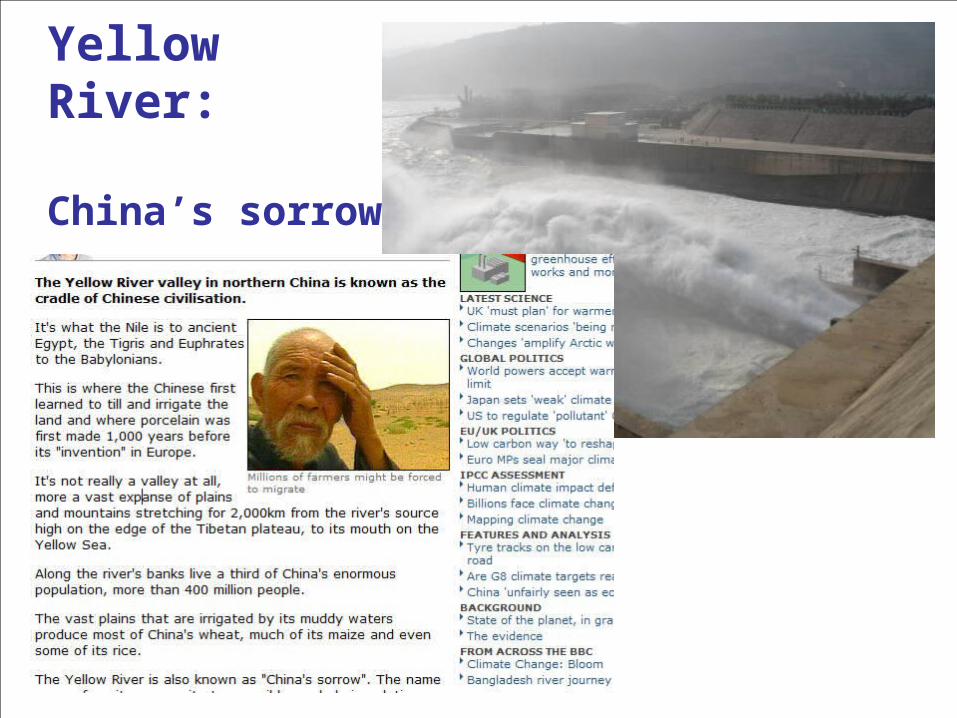
Yellow River:
China’s sorrow
FANRPAN Regional Policy Dialogue 2 Sep 09
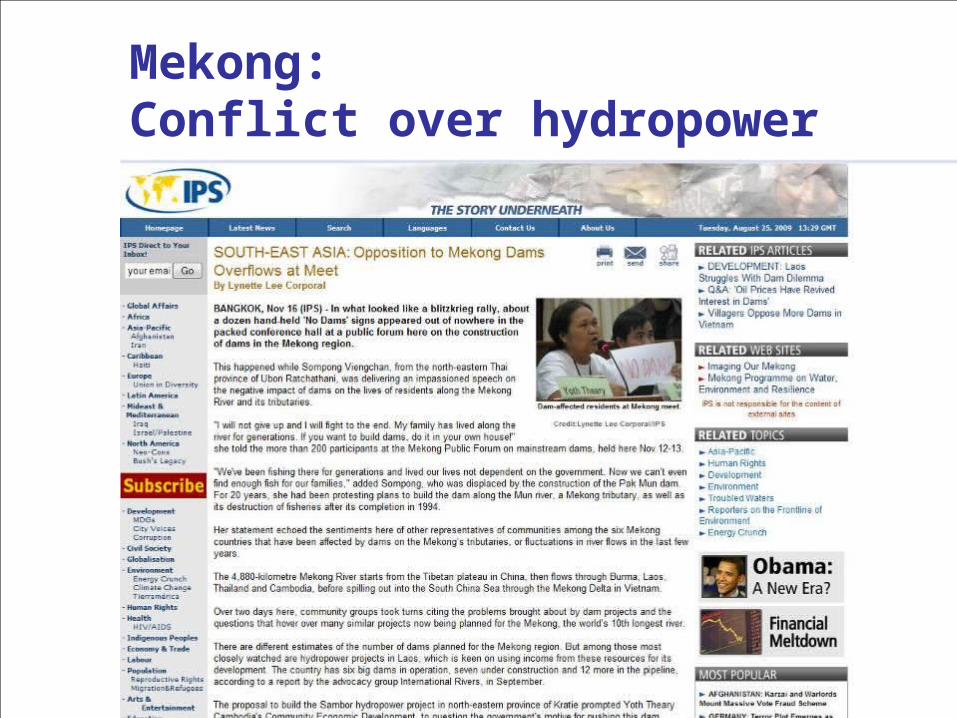
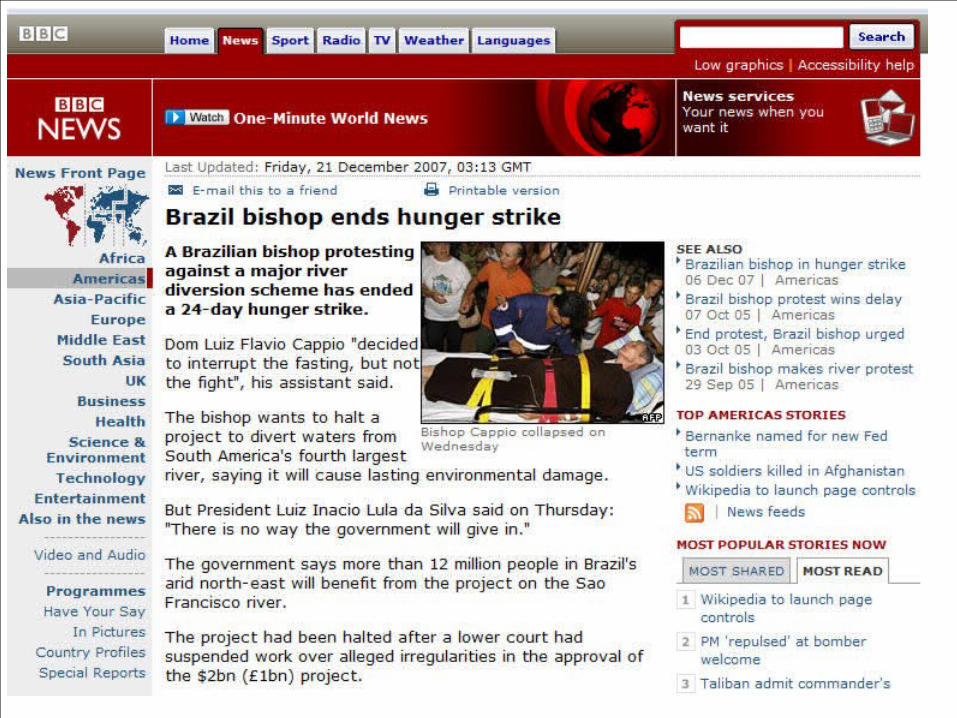
Mekong: Conflict over hydropower
FANRPAN Regional Policy Dialogue 2 Sep 09
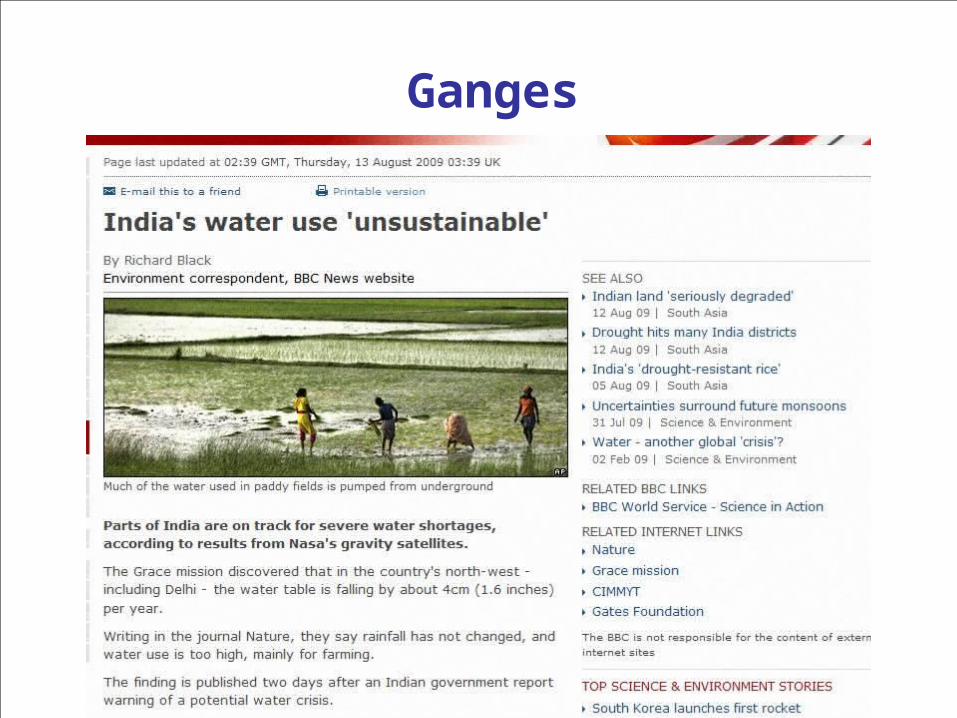
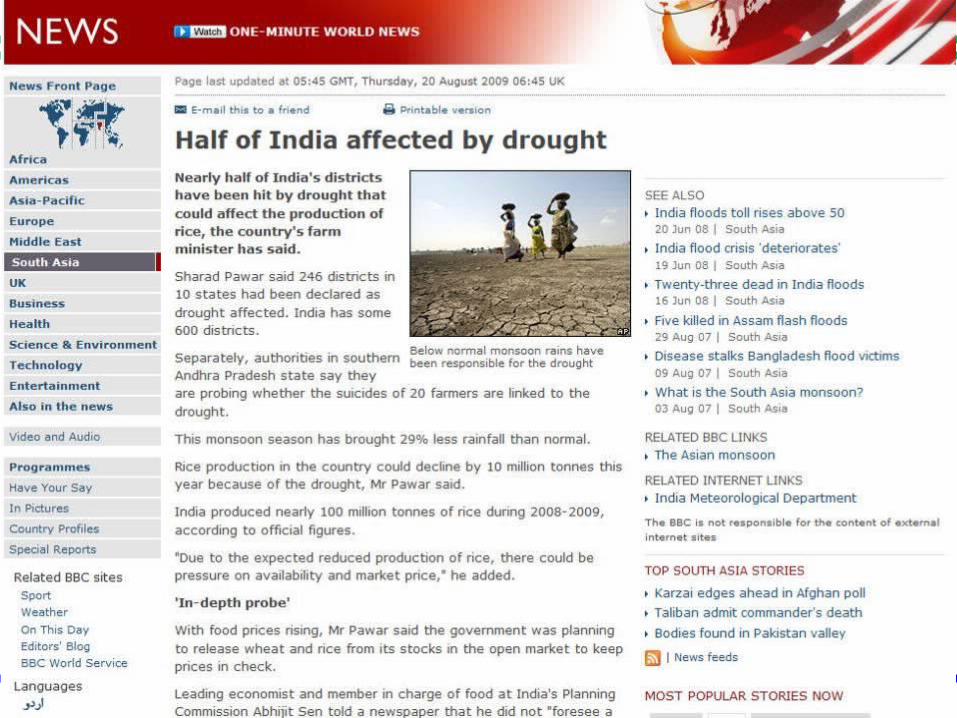
Ganges
FANRPAN Regional Policy Dialogue 2 Sep 09
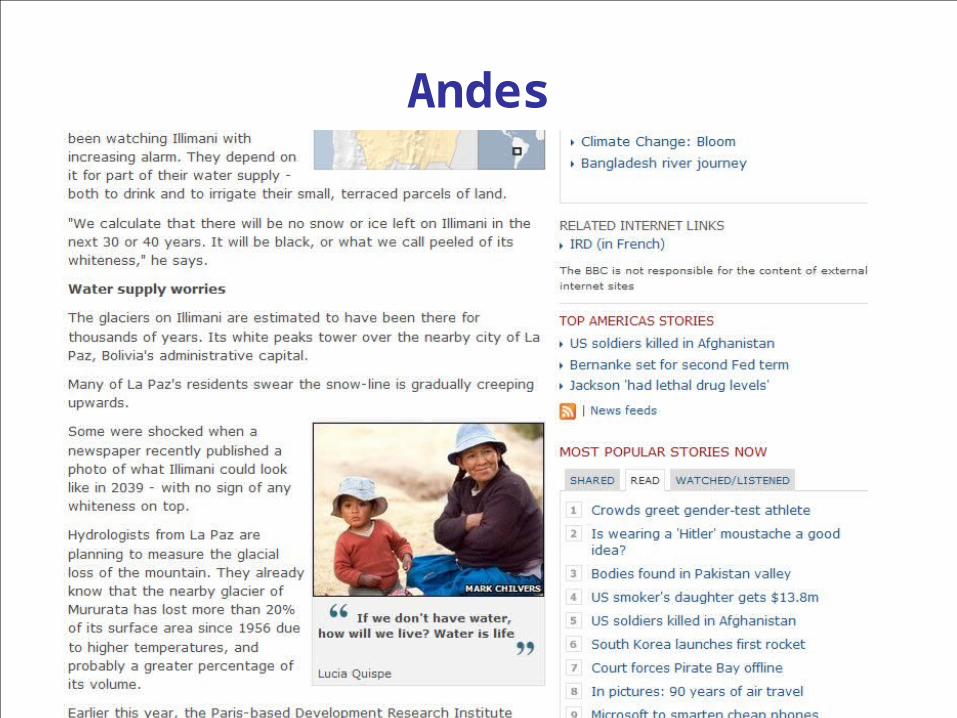
Andes
FANRPAN Regional Policy Dialogue 2 Sep 09
FANRPAN Regional Policy Dialogue 2 Sep 09
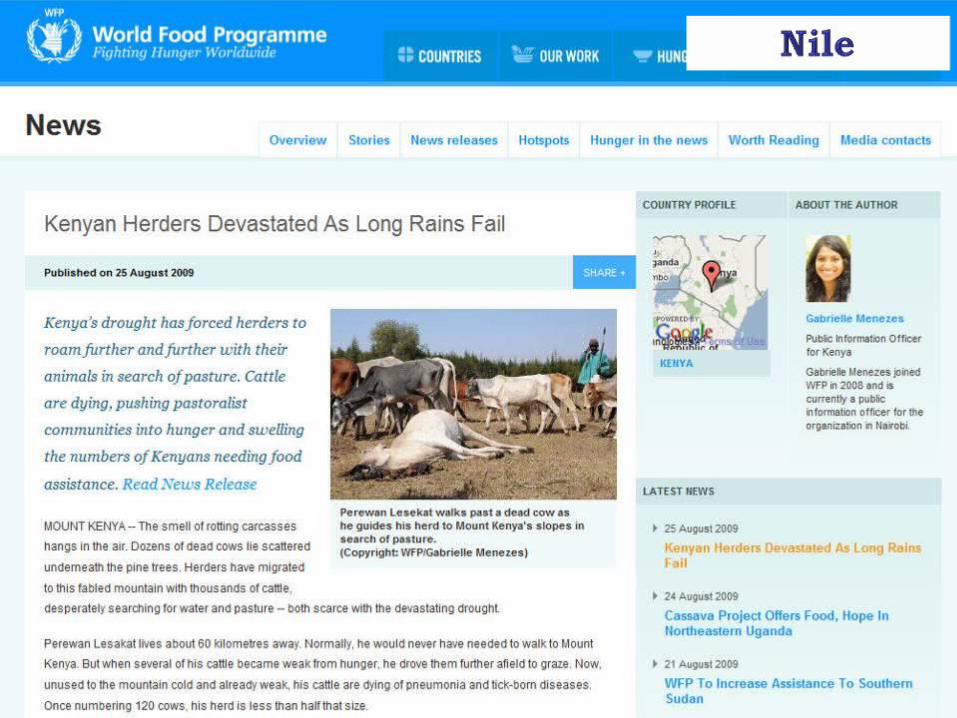
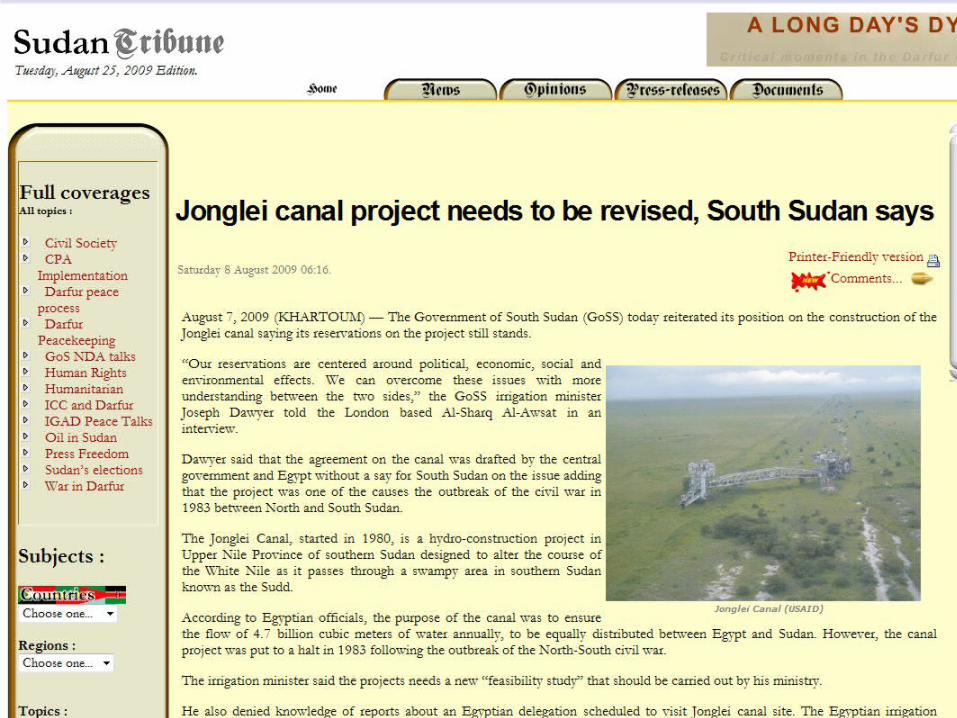
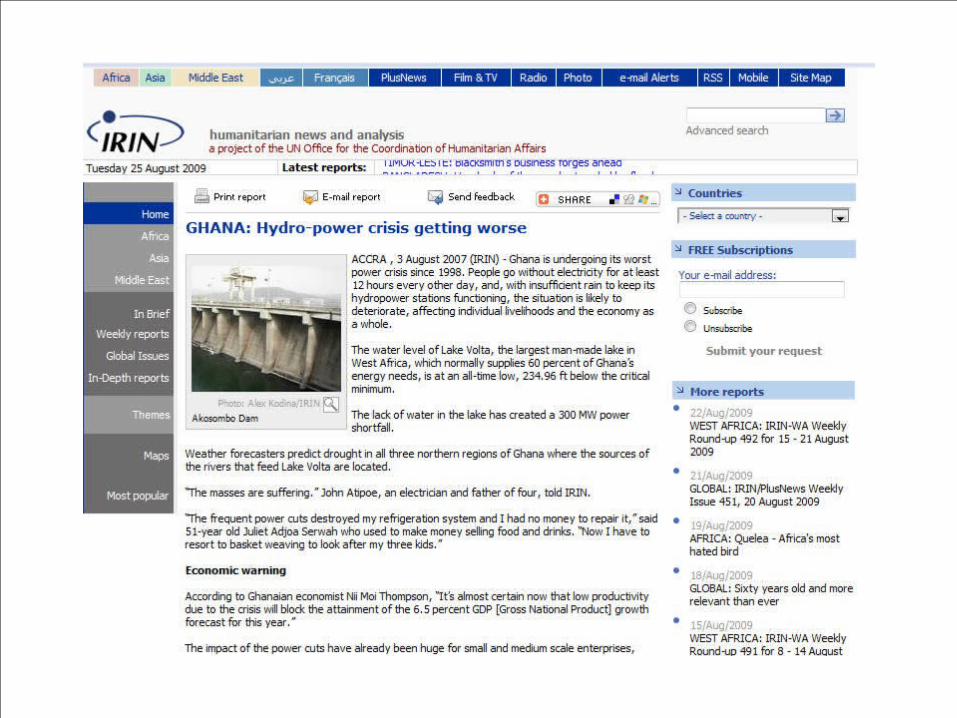
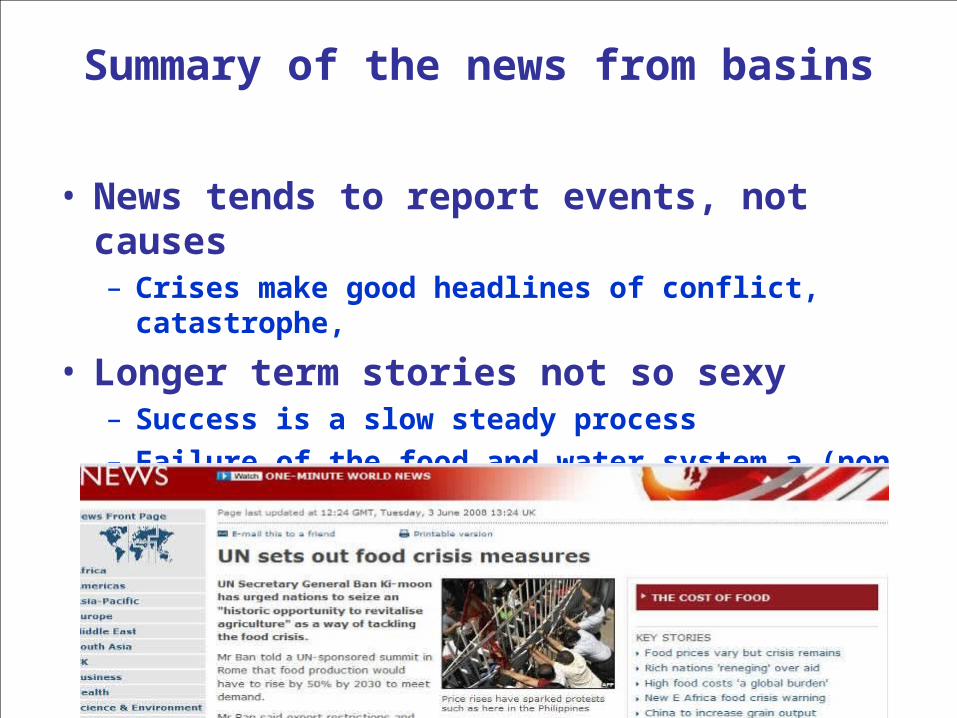
Summary of the news from basins
• News tends to report events, not causes– Crises make good headlines of conflict,
catastrophe,
• Longer term stories not so sexy– Success is a slow steady process – Failure of the food and water system a (non
story) of ‘not much happening’
FANRPAN Regional Policy Dialogue 2 Sep 09
Looking more closely at factors in basins that influence
development• Water availability• Water use• Water related hazard • Water productivity
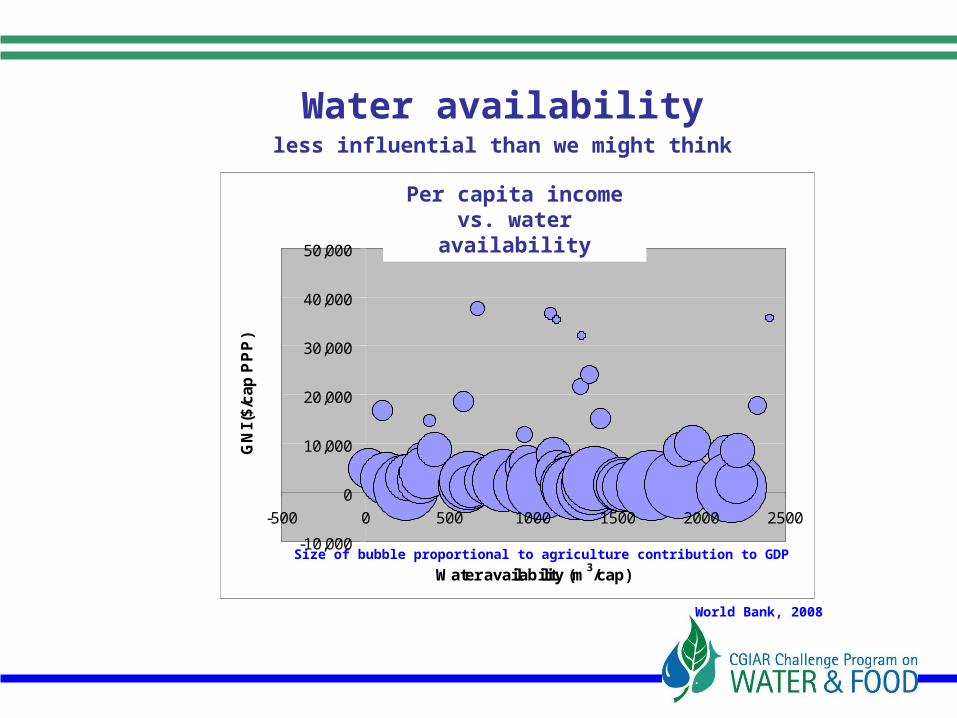
Water availabilityless influential than we might think
GNI vs Water
-10,000
0
10,000
20,000
30,000
40,000
50,000
-500 0 500 1000 1500 2000 2500
Water availability (m3/cap)
GN
I ($
/ca
p P
PP
)
Size of bubble proportional to agriculture contribution to GDP
Per capita income vs. water
availability
World Bank, 2008
FANRPAN Regional Policy Dialogue 2 Sep 09
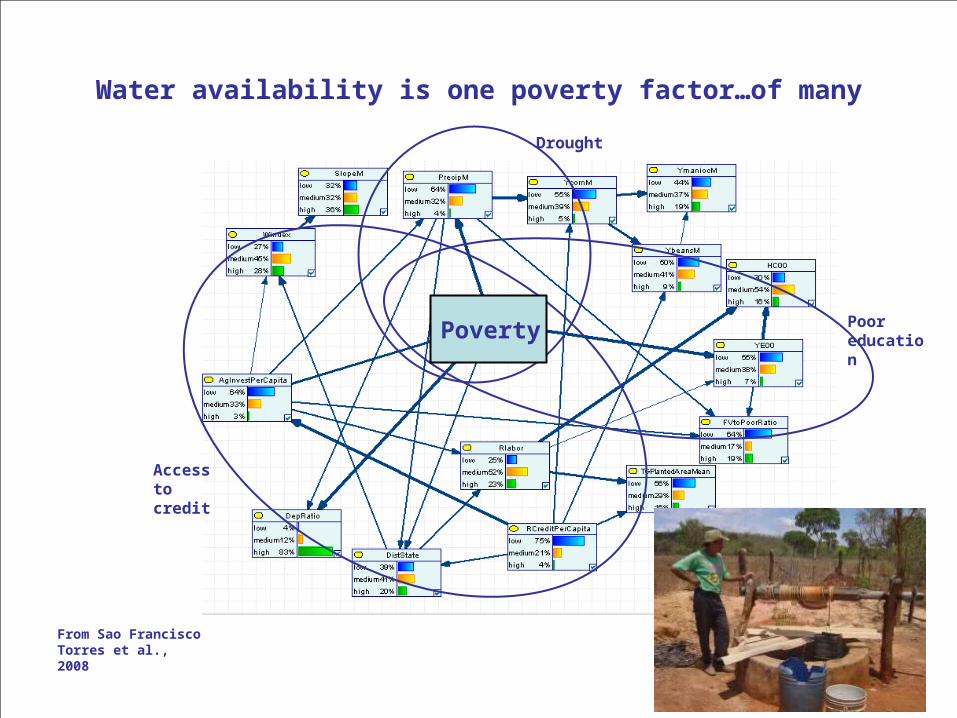
Water availability is one poverty factor…of many
From Sao FranciscoTorres et al., 2008
Drought
Poor education
Access tocredit
Poverty
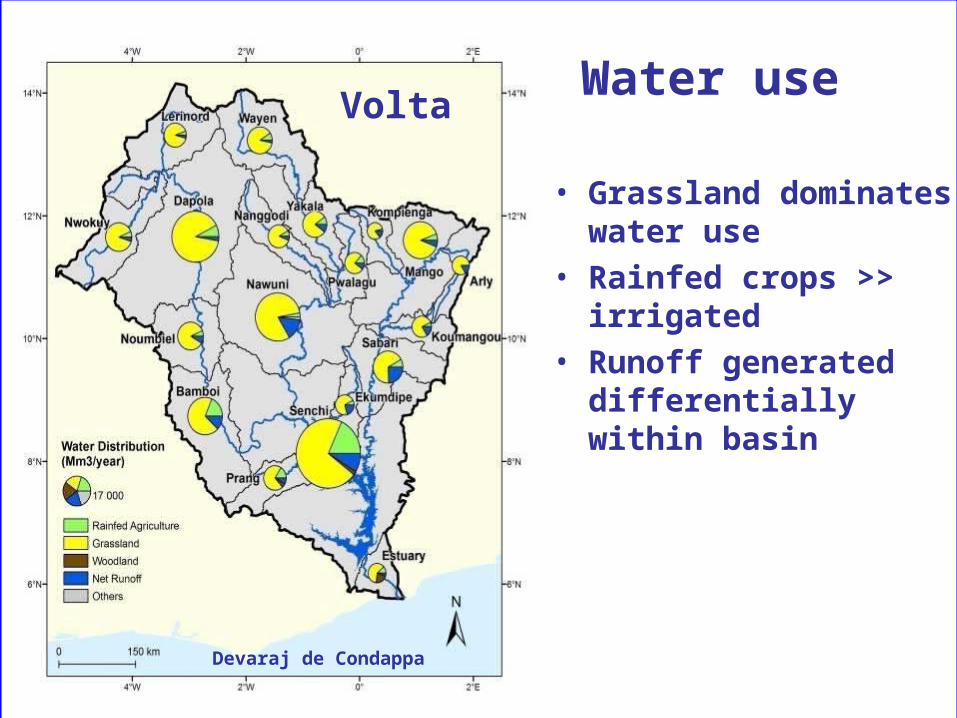
Devaraj de Condappa
VoltaWater use
• Grassland dominates water use
• Rainfed crops >> irrigated
• Runoff generated differentially within basin
FANRPAN Regional Policy Dialogue 2 Sep 09
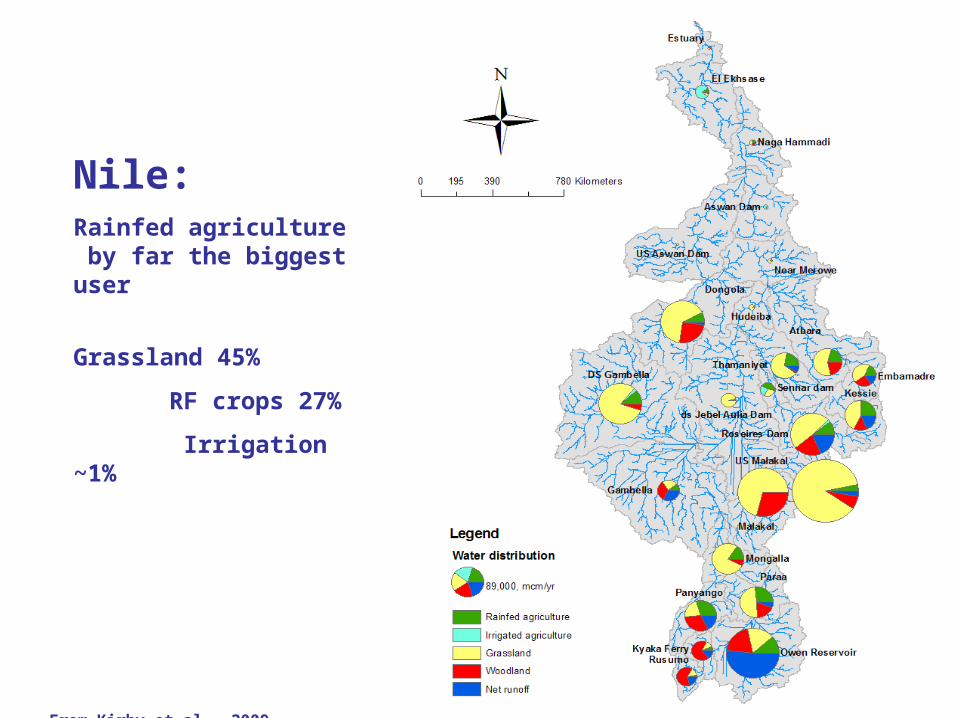
From Kirby et al., 2009
Nile:Rainfed agriculture by far the biggest user
Grassland 45%
RF crops 27%
Irrigation ~1%
FANRPAN Regional Policy Dialogue 2 Sep 09
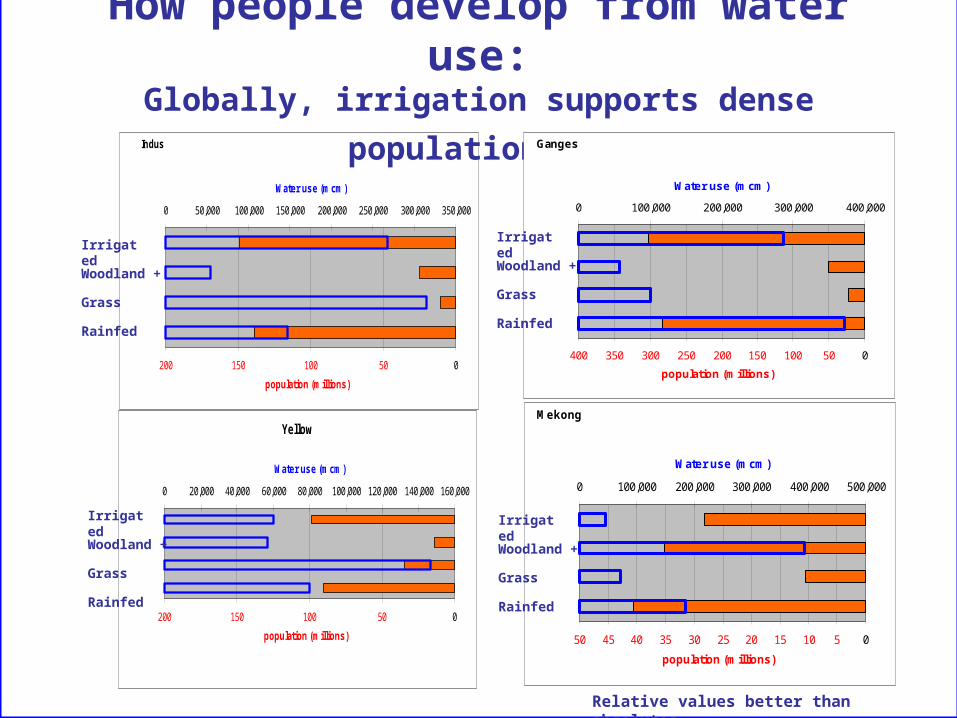
Indus
200 150 100 50 0
population (millions)
0 50,000 100,000 150,000 200,000 250,000 300,000 350,000
Water use (mcm)
How people develop from water use:
Globally, irrigation supports dense
populations….
Woodland +
Grass
Irrigated
Rainfed
Yellow
200 150 100 50 0
population (millions)
0 20,000 40,000 60,000 80,000 100,000 120,000 140,000 160,000
Water use (mcm)
Mekong
50 45 40 35 30 25 20 15 10 5 0
population (millions)
0 100,000 200,000 300,000 400,000 500,000
Water use (mcm)
Ganges
400 350 300 250 200 150 100 50 0
population (millions)
0 100,000 200,000 300,000 400,000
Water use (mcm)
Woodland +
Grass
Irrigated
Rainfed
Woodland +
Grass
Irrigated
Rainfed
Relative values better than absolutes
Woodland +
Grass
Irrigated
Rainfed
FANRPAN Regional Policy Dialogue 2 Sep 09
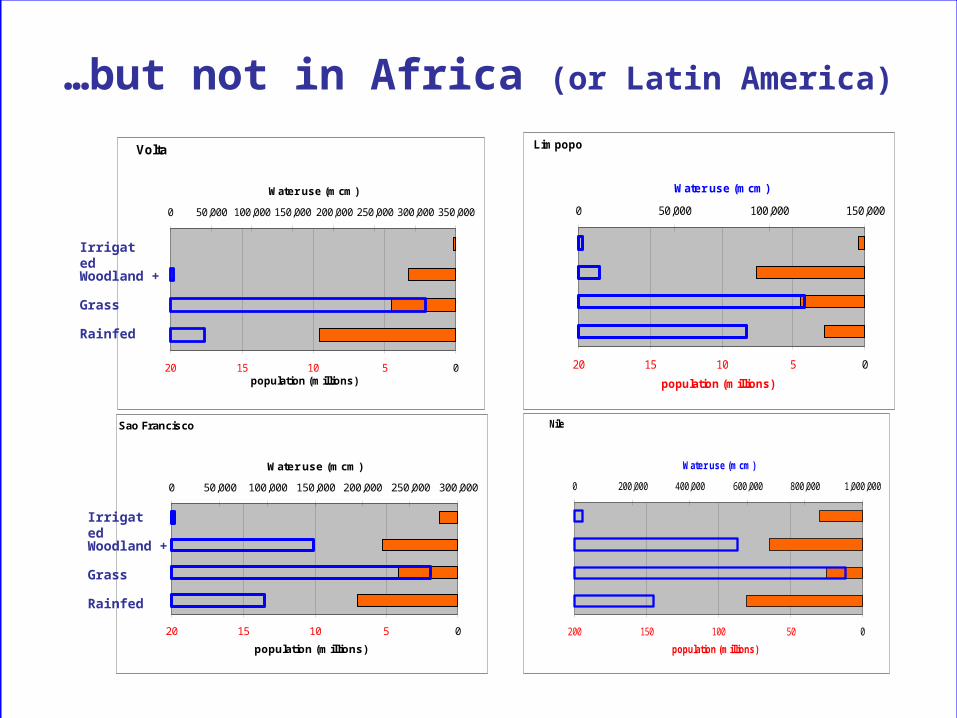
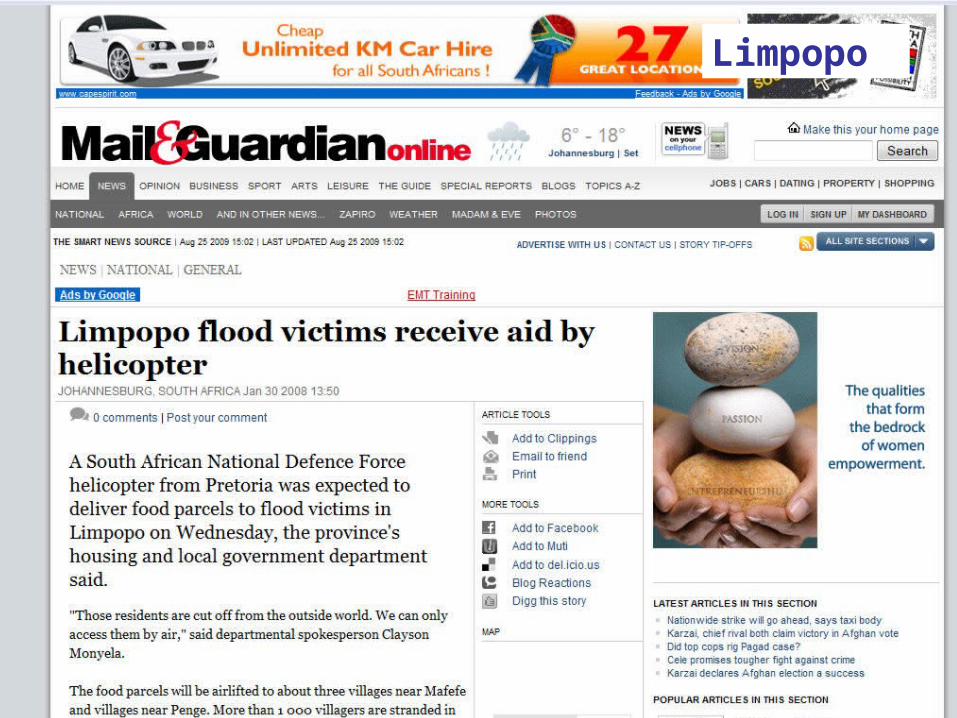
Limpopo
20 15 10 5 0
population (millions)
0 50,000 100,000 150,000
Water use (mcm)
Volta
20 15 10 5 0population (millions)
0 50,000 100,000 150,000 200,000 250,000 300,000 350,000
Water use (mcm)
Sao Francisco
20 15 10 5 0
population (millions)
0 50,000 100,000 150,000 200,000 250,000 300,000
Water use (mcm)
Woodland +
Grass
Irrigated
Rainfed
Woodland +
Grass
Irrigated
Rainfed
Nile
200 150 100 50 0
population (millions)
0 200,000 400,000 600,000 800,000 1,000,000
Water use (mcm)
…but not in Africa (or Latin America)
FANRPAN Regional Policy Dialogue 2 Sep 09
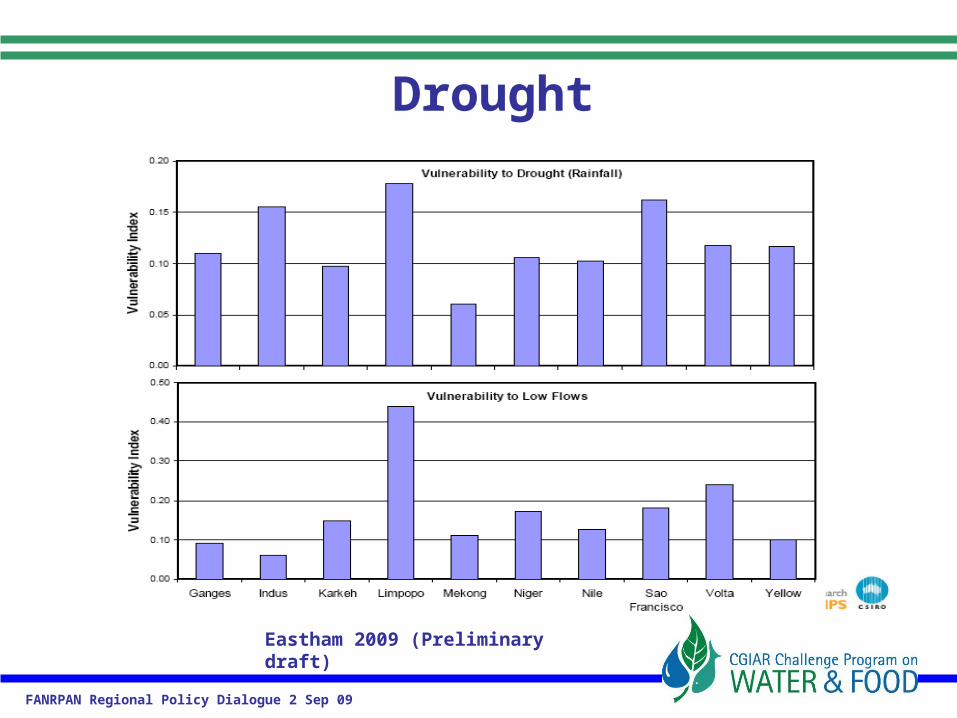
Water related hazard
• Flood• Drought• Disease
If uncontrolled, a major obstacle to investment
FANRPAN Regional Policy Dialogue 2 Sep 09
Limpopo
FANRPAN Regional Policy Dialogue 2 Sep 09
Eastham 2009 (Preliminary draft)
Drought
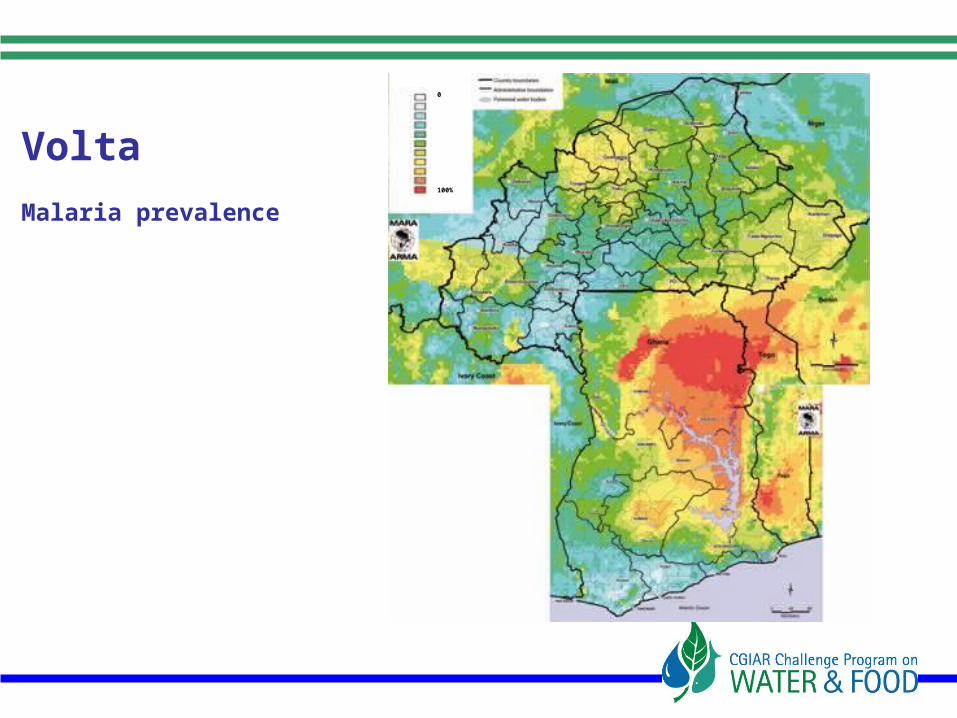
Volta
Malaria prevalence
0
100%
FANRPAN Regional Policy Dialogue 2 Sep 09
Water productivity
• Benefit per m3 water consumed• Key diagnostic of how much people
gain• Applies to
– irrigated crops– rainfed crops, livestock – fish
FANRPAN Regional Policy Dialogue 2 Sep 09
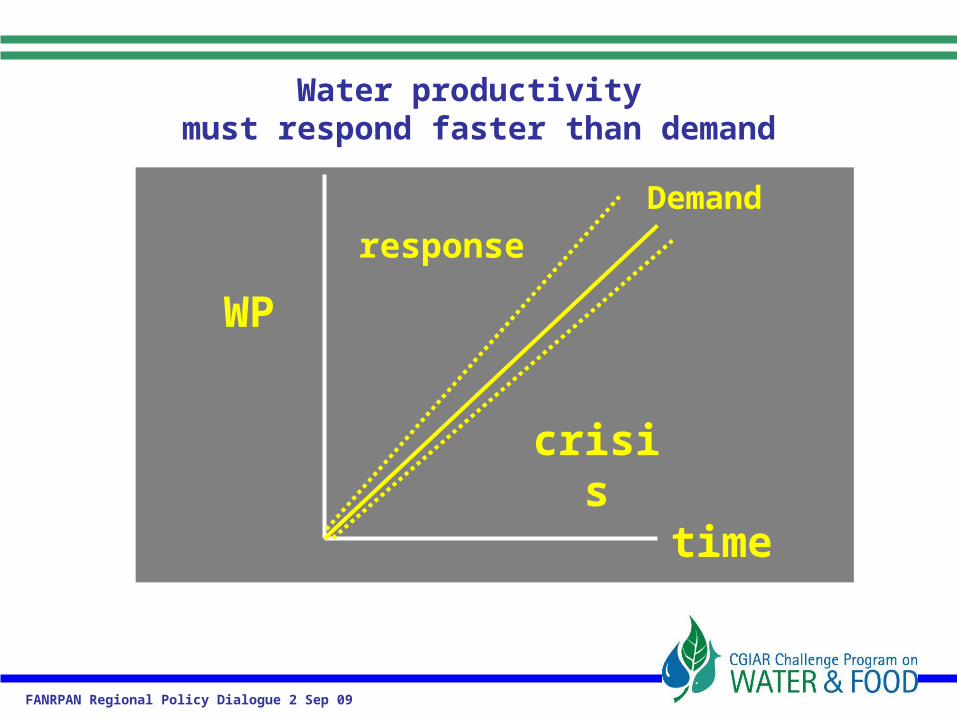
Water productivity must respond faster than demand
crisis
response
WP
time
Demand
FANRPAN Regional Policy Dialogue 2 Sep 09
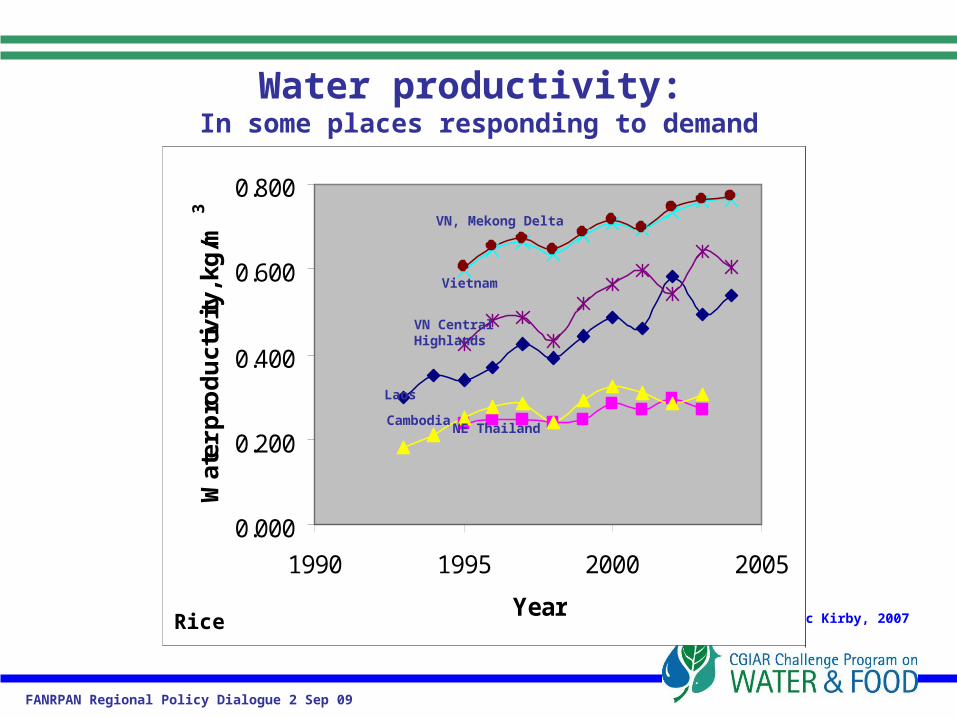
Water productivity: In some places responding to demand
Mac Kirby, 2007
0.000
0.200
0.400
0.600
0.800
1990 1995 2000 2005
Year
Wat
er p
rod
uct
ivity
, kg
/m3
Rice
VN, Mekong Delta
Vietnam
VN CentralHighlands
Laos
CambodiaNE Thailand
VoltaGenerally
<<0.2 kg/m3
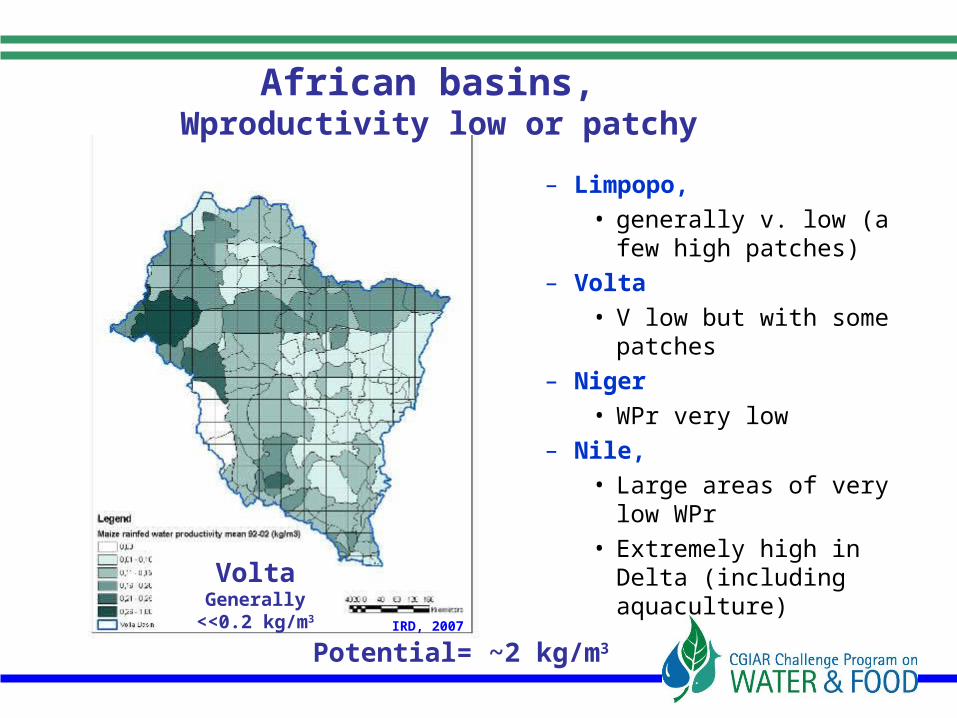
African basins, Wproductivity low or patchy
Potential= ~2 kg/m3 IRD, 2007
– Limpopo, • generally v. low (a few
high patches)– Volta
• V low but with some patches
– Niger• WPr very low
– Nile, • Large areas of very low
WPr• Extremely high in Delta
(including aquaculture)
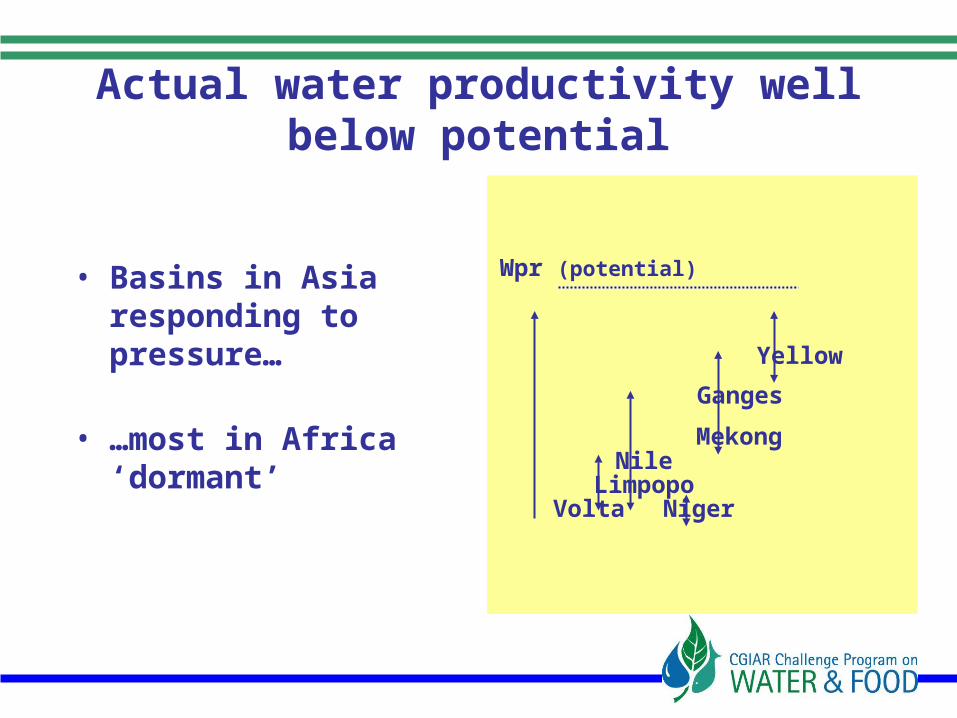
Actual water productivity well below potential
• Basins in Asia responding to pressure…
• …most in Africa ‘dormant’
Wpr (potential)
VoltaLimpopo
Nile
Niger
Ganges
Yellow
Mekong
FANRPAN Regional Policy Dialogue 2 Sep 09
Agriculture vs GNI
-10,000
0
10,000
20,000
30,000
40,000
50,000
-10 0 10 20 30 40 50
Agricultural contribution to GDP (%)
Gro
ss
Na
tio
na
l In
co
me
($
/ca
pit
a)
• The water and food crisis is really a development crisis
Final thoughts
What factors are preventing people
moving “up the slide”?
FANRPAN Regional Policy Dialogue 2 Sep 09
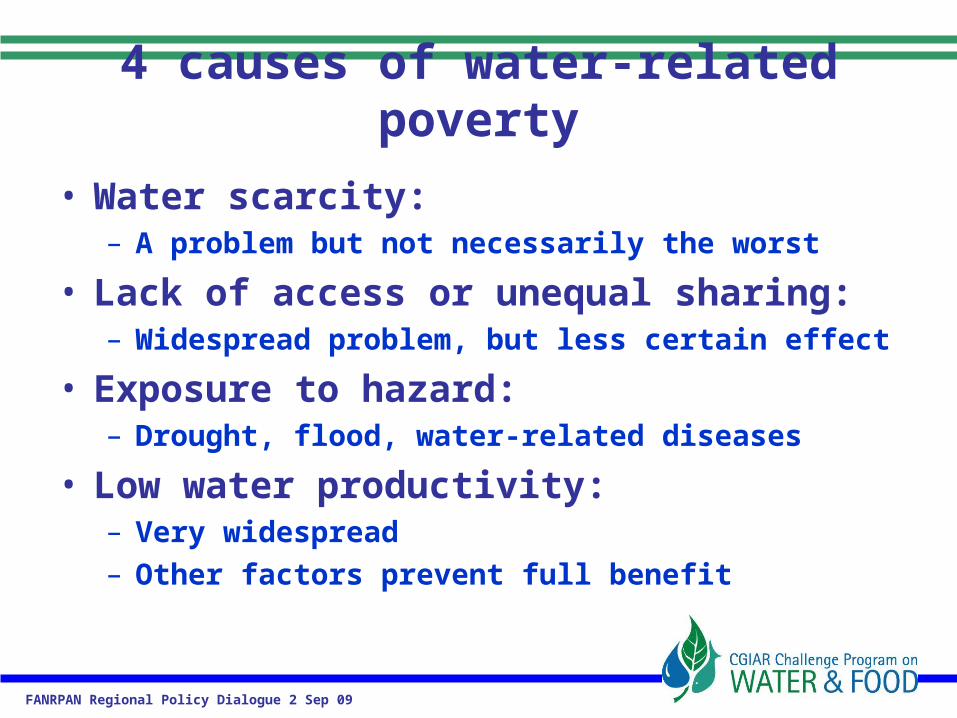
4 causes of water-related poverty
• Water scarcity: – A problem but not necessarily the worst
• Lack of access or unequal sharing:– Widespread problem, but less certain effect
• Exposure to hazard:– Drought, flood, water-related diseases
• Low water productivity:– Very widespread– Other factors prevent full benefit
FANRPAN Regional Policy Dialogue 2 Sep 09
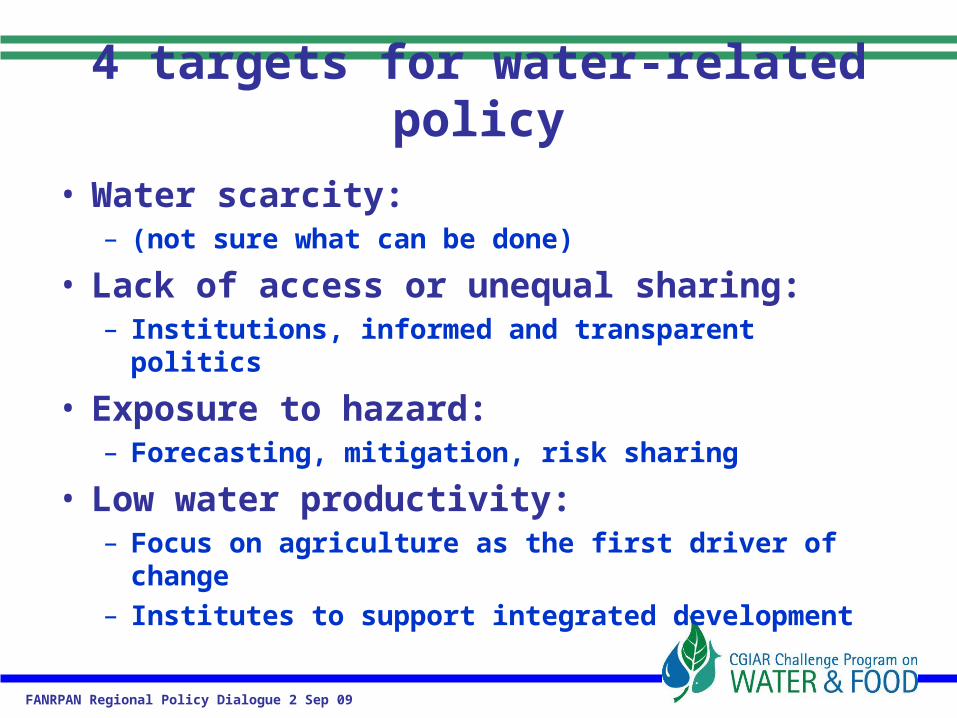
4 targets for water-related policy
• Water scarcity: – (not sure what can be done)
• Lack of access or unequal sharing:– Institutions, informed and transparent politics
• Exposure to hazard:– Forecasting, mitigation, risk sharing
• Low water productivity:– Focus on agriculture as the first driver of
change– Institutes to support integrated development
FANRPAN Regional Policy Dialogue 2 Sep 09
Thank you