the flooding hydrology of mackenzie delta lakes...
TRANSCRIPT
VOL. 42, NO. 1 (MARCH ARCTIC
1989) P. 41-49
The Flooding Hydrology of Mackenzie Delta Lakes near Inuvik, N.W.T., Canada’
P. MARSH’ and M. HEY’
(Received 29 February 1988; accepted In revised form 30 September 1988)
ABSTRACT. The hydrologic regime of lakes in the Mackenzie Delta is controlled primarily by lake sill elevations and water levels in the Mackenzie River distributary channels. The resulting variations in lake regime have important effects on the water, sediment, and nutrient balance of delta lakes, and therefore on the biologic regime of each lake.
Analysis of 12-25 years of Mackenzie River East Channel water levels allowed the documentation of the relationship between flooding regime and sill elevation for lakes in the study area near Inuvik, N.W.T. These data showed that in this portion of the delta, the timing of the spring rise in water levels is very consistent, with peak levels, for example, occurring on 3 June with a standard deviation of only 4 days. The magnitude of the spring flood varies greatly from year to year, and as a result only 67% of lakes in the study area flood annually in the spring, while the remaining lakes have a flood frequency of greater than 1 year and less than 4 years. Since the mean summer flood peak of 2.777 m as1 is considerably lower than the mean spring peak of 5.636 m asl, summer lake flooding is not as extensive, with only 20% of lakes receiving floodwater annually during the summer. By late summer, water levels drop to 1.5 m as1 annually, cutting off approximately 88% of lakes from the Mackenzie River. These data on the return period of lake flooding allowed the classification system described by Mackay (1963) to be quantified. The no-, low-, and high-closure lakes were found to represent 12,55, and 33 % respectively of all lakes in the study area.
Variations in the hydrologio regime of the Mackenzie River could occur in the future due to hydro-electric development, climate change, or rising sea level. Even small changes in Mackenzie River levels could result in a significant modification to the hydrologic regime of delta lakes. The effects on the viability of these lakes, or their chemical and nutrient balances, are not well known. Key words: Mackenzie River, Mackenzie Delta, hydrology, lakes
RGSUMÉ. Le régime hydrologique des lacs dans le delta du Mackenzie est contrôlé surtout par la hauteur du seuil des lacs et les niveaux d’eau dans les canaux tributaires du Mackenzie. Les variations qui en résultent dans le régime des lacs ont des retombées importantes sur l’eau, les sédiments et I’équilibre en éléments nutritifs des lacs deltaïques, et partant, sur le régime biologique de chaque lac.
L’analyse du niveau des eaux du canal est du fleuve Mackenzie, relevé sur une période de 12 à 25 ans, a permis de documenter la relation qui existe entre l e régime des crues et la hauteur des lacs dans la zone d‘étude près d‘Inuvik, dans les T. N.-O. Ces données révèlent que dans cette portion du delta, la période de la montée du niveau des eaux au printemps revient de façon très r8gulière, le niveau maximum par exemple ayant lieu le 3 juin avec une déviation standard de seulement 4 jours. L’ampleur de la crue de printemps varie grandement d’une année à l’autre, avec le résultat que seulement 67% des lacs dans la zone d‘étude ont une crue de printemps annuelle, tandis que les autres lacs ont une fréquence de crues de plus d‘une année et de moins de 4 ans. Vu que le maximum moyen des crues d‘été de 2,977 m au-dessus du niveau de la mer est considérablement inférieur au maximum moyen du printemps de 5,636 m au-dessus du niveau de la mer, les crues de lacs en été ne sont pas aussi généralisées, avec seulement 20% des lacs qui reçoivent des eaux de crues en eté sur une base annuelle. À la fin de l’été, les niveaux d’eau baissent chaque année à 1,5 m au-dessus du niveau de la mer isolant environ 88% des lacs du fleuve Mackenzie. Ces données sur la date de récurrence des crues des lacs ont permis de quantifier le système de classification décrit par Mackay (1963). On a trouvé que les lacs qui ne se ferment pas, ceux qui le font épisodiquement et ceux qui le font fréquemment, représentaient 12, 55 et 33% respectivement de tous les lacs dans la zone d’étude.
Des variations dans le régime hydrologique du fleuve Mackenzie pourraient se produire dans l’avenir àcause de l’exploitation hydro-électrique, des changements climatiques ou de la montée du niveau de la mer. Même de faibles changements dans les niveaux du fleuve Mackenzie pourraient avoir comme résultat une modification importante dans le régime hydrologique des lacs deltaïques. On ne connaît pas très bien les retombées de ces changements sur la durée de vie de ces lacs ou sur leurs équilibres chimiques et en Cléments nutritifs. Mots clés: fleuve Mackenzie, delta du Mackenzie, hydrologie, lacs
Traduit pour le journal par Nésida Loyer.
INTRODUCTION An important feature of the Mackenzie Delta is the large number of freshwater lakes, which cover up to 50% of the deltaic plain. Mackay (1963) first described the influx of Mackenzie River water to these lakes (called “flooding” in the remainder of this paper) and provided a simple lake clas- sification system based on the lake flooding regime. In this system the frequency and duration of flooding varied with lake elevation, with the lower elevation lakes flooded annu- ally and for relatively long durations, while lakes perched at a higher elevation were flooded infrequently and for rela- tively shorter durations. Recent studies (Gill, 1971; Cordes and McLennan, 1984; Hirst et al., 1987; Bigras, 1987) have used Mackay’s classification system with only minor changes and have also documented the following aspects of lake flood- ing. Lake flooding is initiated in early May, when Mackenzie River water levels increase dramatically (Fig. 1) due to snow
‘NHRI Contribution No. 88008
melt in the southern portions of the Mackenzie basin and from ice jams in the main channels of the Mackenzie Delta. Flooding of many lakes ceases as water levels decline from the spring peak, but some lakes may be again flooded during rain-induced peaks in the summer period (Fig. 1). Marsh (1986a,b) has demonstrated that this spring and summer flooding by the Mackenzie River dominates the water balance of delta lakes.
In spite of the utility of Mackay’s classification scheme, previous studies have not quantified the hydrologic regime of each lake type, determined the range of sill elevations for each lake type, or provided the percentage of lakes that fall into each class. This information is essential in order to utilize Mackay’s classification system and to improve our under- standing of the hydrologic regime of delta lakes. In addition, since the hydrologic regime of lakes in the Mackenzie Delta plays a significant role in controlling the productivity of the
’National Hydrology Research Institute, Environment Canada, 11 Innovation Blvd., Saskatoon, Saskatchewan, Canada S7N 3H5 @The Arctic Institute of North America
42 / P. MARSH and M. HEY
T
0.0 l . O C
- Study Period "+ Spring peak
I
O 30 60 90 120 150 180 210 240 270 300 330 360 Julian Day
I I I I I I I I I I I I I Jan Mar May July sept Nov
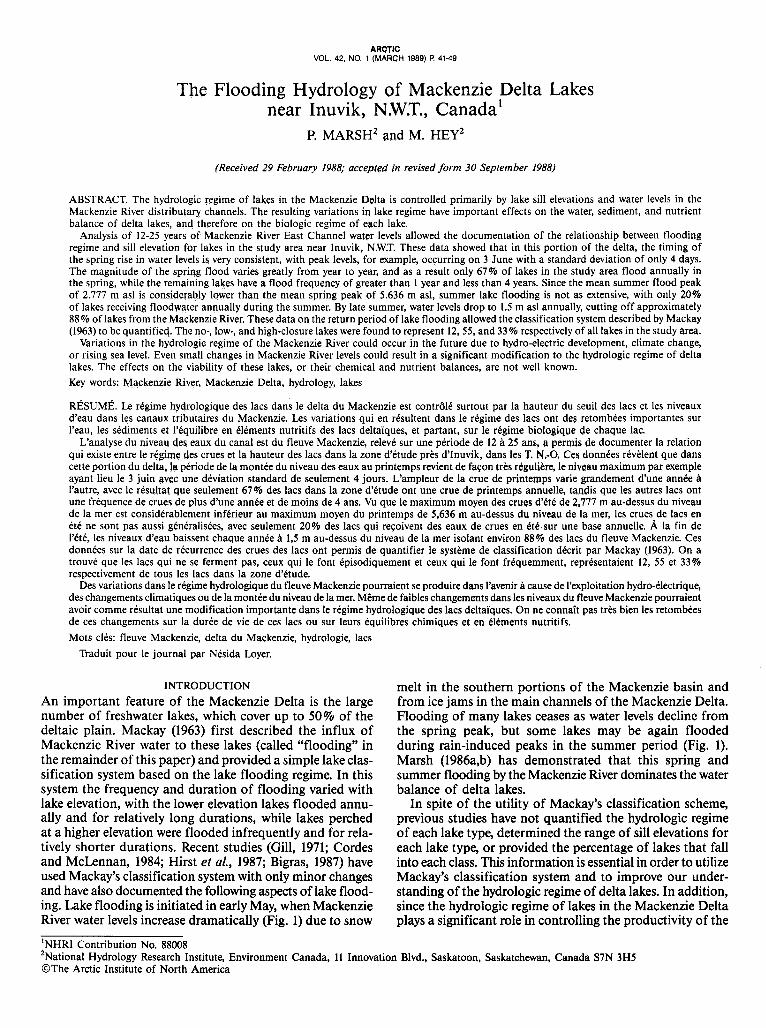
FIG. I . Water level for Mackenzie River East Channel in 1974, and illustra- tion of truncation levels and definition of terms used in the paper. Note that the spring peak level (5.570 m ad) was near the 25-year normal of 5.636 m asl, while the summer peak of 3.430 m as1 was the highest recorded be- tween 1974 and 1986.
delta ecosystem (Gill, 1971; Peterson et al., 1981; Pearce, 1986), the quantification of this lake classification system is im- portant in order to understand the current biological charac- teristics of the delta.
In light of the lack of information concerning the flooding of delta lakes, it is the purpose of this paper to analyze the flooding regime of a large number of lakes in the east-central portion of the Mackenzie Delta and to quantify a simple lake classification system that has been used in previous studies. Due to the limitations of the data set, this classification is only directly applicable to the lakes in the study area near Inuvik, N.W.T., Canada. However, the general principles may be applied elsewhere in the Mackenzie Delta.
STUDY AREA AND DATA SOURCES
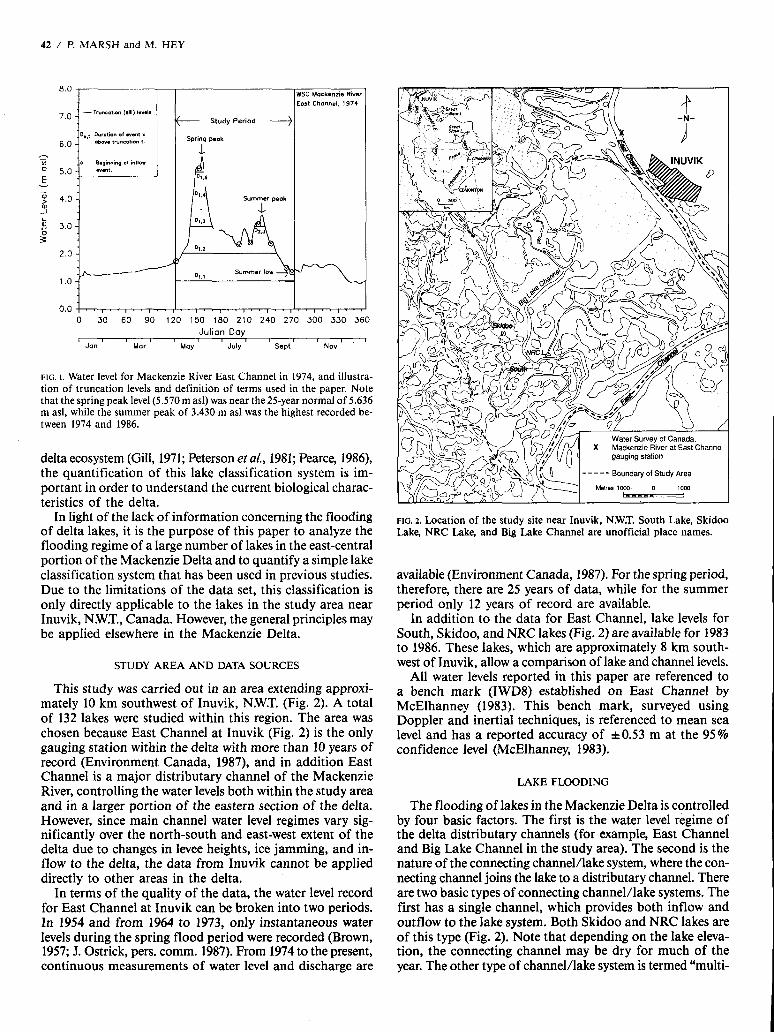
This study was carried out in an area extending approxi- mately 10 km southwest of Inuvik, N.W.T. (Fig. 2). A total of 132 lakes were studied within this region. The area was chosen because East Channel at Inuvik (Fig. 2) is the only gauging station within the delta with more than 10 years of record (Environment Canada, 1987), and in addition East Channel is a major distributary channel of the Mackenzie River, controlling the water levels both within the study area and in a larger portion of the eastern section of the delta. However, since main channel water level regimes vary sig- nificantly over the north-south and east-west extent of the delta due to changes in levee heights, ice jamming, and in- flow to the delta, the data from Inuvik cannot be applied directly to other areas in the delta.
In terms of the quality of the data, the water level record for East Channel at Inuvik can be broken into two periods. In 1954 and from 1964 to 1973, only instantaneous water levels during the spring flood period were recorded (Brown, 1957; J. Ostrick, pers. comm. 1987). From 1974 to the present, continuous measurements of water level and discharge are
FIG. 2. Location of the study site near Inuvik, N.W.T. South Lake, Skidoo Lake, NRC Lake, and Big Lake Channel are unofficial place names.
available (Environment Canada, 1987). For the spring period, therefore, there are 25 years of data, while for the summer period only 12 years of record are available.
In addition to the data for East Channel, lake levels for South, Skidoo, and NRC lakes (Fig. 2) are available for 1983 to 1986. These lakes, which are approximately 8 km south- west of Inuvik, allow a comparison of lake and channel levels.
All water levels reported in this paper are referenced to a bench mark (IWD8) established on East Channel by McElhanney (1983). This bench mark, surveyed using Doppler and inertial techniques, is referenced to mean sea level and has a reported accuracy of 10.53 m at the 95% confidence level (McElhanney, 1983).
LAKE FLOODING
The flooding of lakes in the Mackenzie Delta is controlled by four basic factors. The first is the water level regime of the delta distributary channels (for example, East Channel and Big Lake Channel in the study area). The second is the nature of the connecting channel/lake system, where the con- necting channel joins the lake to a distributary channel. There are two basic types of connecting channel/lake systems. The first has a single channel, which provides both inflow and outflow to the lake system. Both Skidoo and NRC lakes are of this type (Fig. 2). Note that depending on the lake eleva- tion, the connecting channel may be dry for much of the year. The other type of channel/lake system is termed "multi-

ple channel” or “through-flow.” This type of system has two or more connecting channels, and flow is predominantly into one end of the system and out the other, although flow direction through the system may vary during the year. Skidoo Lake is part of such a multi-channel system (Fig. 2). The third factor is the distance of the lake from a distributary channel. However, since all lakes in the study area are within a few kilometres of a distributary channel (Fig. 2), and given the low water slopes and slow rate of change of water levels, the distance from a main channel is not important in controlling lake flooding. Therefore, this factor will not be considered in the remainder of the paper. The fourth factor controlling lake flooding is the elevation of the lake relative to the distributary channels. In this paper the term “sill elevation’’ will be used, defined as the highest elevation along the connecting channel thalweg between the lake and distri- butary channel. Because of increased sedimentation where the connecting channel enters a lake, the sill is normally located at the lake entrance.
An important observation is that when distributary channel water levels are above the lake sill, the channel and lake levels are similar (Fig. 3). As a result, it is possible to use distribu- tary channel water levels to estimate the water level regime of the study lakes.
0.0 . . . . . . . . . . . . . . . . . . . . . . . . . . . . . . . . . . . . 0 30 60 90 120 150 180 210 240 270 300 330 J(
Julian Day (1 986)
FIG. 3. Water level in East Channel at Inuvik (WSC) and for Skidoo and NRC lakes in 1986. Also shown are the spring and summer sill elevations for Ski- doo and NRC lakes.
METHODOLOGY
Luke Sill Elevations
Previous work at Skidoo, South and NRC lakes demon- strated that during the spring melt period, water first floods into these lakes when East Channel water level rises above the lake sill elevation. This suggested that lake sill levels could be estimated from measurements of main channel water levels and aerial observations of the approximate time at which a lake was first flooded. This aerial survey method is the only practical technique for estimating the sill elevation of a large number of lakes, because the heavy underbrush in the study area makes ground surveying difficult.
This aerial survey method produces satisfactory results for the following reasons. First, since the water slope in the chan- nels of the study area are small (typically O.ooOo2 to 0.00004; Marsh, 1986a), and the channel lengths short, the water lev-
HYDROLOGIC REGIME OF MACKENZlE DELTA LAKES / 43
el in the main channels is a good estimate of water levels throughout the study area (Fig. 3). Second, since the sediment- laden Mackenzie River water is easily distinguished from lo- cal snow-melt water, it is possible to determine from aerial observations whether a lake has been flooded.
During a 20-day period covering late May to early June 1986, the sill elevations of 132 lakes in the study area (Fig. 2) were determined using the above-described aerial survey method. Since East Channel water levels rose slowly (0.25 meday”) and steadily over this period, observations of lake flooding were conducted every two days. Using this informa- tion, the lakes were divided into 0.5 m elevation classes.
The sill levels estimated from the aerial survey were then checked by ground surveying 14 lakes. These data show that sill elevations determined from the aerial observations are wi- thin & O S m of the ground survey measurements. Although this error is quite large, it is acceptable for the present study.
Water Levels
The usefulness of analyzing extreme discharge events in re- lation to critical discharge levels (truncation levels) has been demonstrated previously (Todorovic, 1978). Using this tech- nique, flooding statistics such as timing, duration, and mag- nitude are determined only for discharge above specific truncations. The use of truncation levels is not limited to anal- ysis of discharge events, but may also be used to analyze water levels and therefore the periodic inundation of floodplain lakes, delta lakes, or marshes. This provides essential information in studying the resulting water, sediment, chemical, and nutrient budgets of these features.
In this paper, Mackenzie River East Channel water levels are analyzed in relation to truncation levels, in order to describe the hydrologic regime of Mackenzie Delta lakes. Selected trun- cation levels will be used to represent lake sill elevations. For example, the flooding history of a lake with a sill elevation of 4 m as1 can be determined by analyzing main channel water levels using a truncation level of 4 m asl. This will provide information on flow variables only when the river level is above the lake sill elevation - i.e., the only time when the lake will be influenced by channel levels. The use of truncation levels in this study is illustrated in Figure 1.
Water levels were analyzed over the period 1 May to 30 Sep- tember (labelled “study period” on Figure 1) when the delta is most active hydrologically. This period encompasses the in- itial rise of water level and flooding of delta lakes, the spring peak, and the summer period, with fluctuating water levels. Only the winter period is not included. However, during much of the winter the lake-connecting channels are filled with ice and snow, preventing the movement of water between the main channels and most of the delta lakes.
The study period (1 May to 30 September) may be broken into two intervals, with the water levels during each dominat- ed by different processes. The spring break-up period is domi- nated by snow-melt run-off and ice jamming, while the summer period is controlled mainly by rainfall run-off. The spring period was defined as beginning on 1 May, while the summer period was defined as starting when water levels in- creased for the first time after the rapid recession from the spring peak. The initiation of the summer period therefore varies from year to year. Due to variations in the availability
44 / P. MARSH and M. HEY
of data, spring water levels were analyzed for the full 25 years of record, while for the summer period only 12 years of record were available.
Water levels during the 1 May to 30 September period were analyzed for: (1) the time at which water levels rose above given trunca-
tion levels during the rapid spring rise in water level; (2) the peak spring and summer levels; (3) the number of times and the duration that water levels
were above given truncations, where the duration was analyzed for the first event of the year, for all subsequent events combined, and for all events combined. In general, the first event corresponds to the spring high-water period. Subsequent events occur during the summer low-water period, when water levels have fallen below a given truncation level and then rise above it later in the year. However, for low sill levels, the first event of the year extends well into the summer low-water period (Fig. 1);
(4) the number of inflows to a lake, where an inflow occurs whenever the main channel water level is above the lake sill and the channel level is rising. Under this condition, channel discharge is into the lake. An inflow was recorded as such, regardless of the amount of rever- sal in water level or in the duration of the inflow before the next downtrend (outflow). This definition of an inflow event only applies to simple lake systems with a single connecting channel. Of the study lakes, South and NRC are of this type; and
( 5 ) the summer minimum water level. In each case the data were analyzed for the mean, standard deviation, and minimum and maximum values.
The probabilities of extreme high- and low-water level events were determined using the annual series. This series often has been modelled with the Gumbel distribution (Yevjevich, 1972; Haan, 1977), which provides a suitable fit to the observed data when annual floods are produced by a single hydrologic process (Woo and Waylen, 1984). The Gumbel distribution is used here to represent the peak level of the annual spring flood, the peak level occurring during the summer period, and the summer extreme low level. The cumulative form of the Gumbel for extreme maximum levels is given by
(1) P ( L ’ r L t ) = 1 - exp[-exp(-(Lt-p) / a)] where P(L’ 2 L,) is the probability that the extreme maxi- mum water level (L’) is greater than or equal to the trunca- tion level (L,), (Y = d1.283, ,f3 = p-0.4% (Haan, 1977), and p and u are respectively the mean and standard deviation of the recorded peak levels. For extreme minimum values
(2) P(L, I Lt) = 1 - exp[-exp((L,-@ / a)] where P(L, sLt ) is the probability that the extreme mini- mum water level (L,) is less than or equal to the truncation level (Lt), a = d1.283,P = p+ .45u, and p and u are respec- tively the mean and standard deviation of the recorded mini- mum levels.
The Kolmogorov-Smirnov (K-S) goodness-of-fit test was selected to examine the fit of observed frequencies of the variable values against the frequencies predicted by the Gumbel distribution. In all cases the 0.80 confi- dence level was used to reduce the chances for type I1 errors.
RESULTS
Lake Sill Elevations
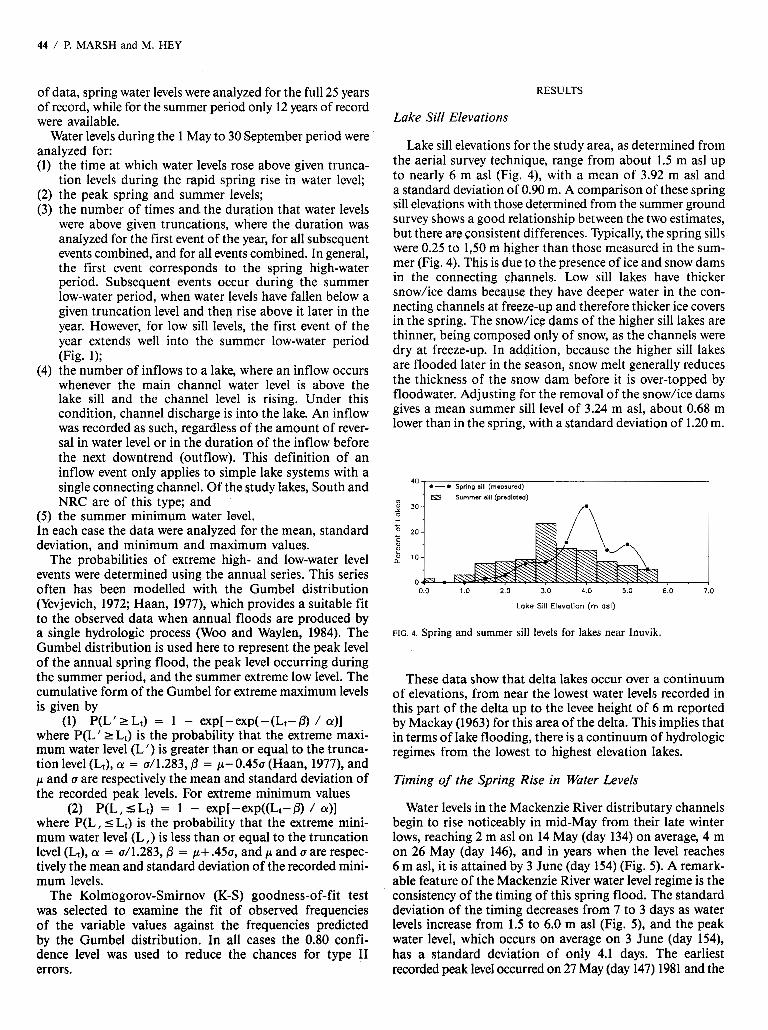
Lake sill elevations for the study area, as determined from the aerial survey technique, range from about 1.5 m as1 up to nearly 6 m as1 (Fig. 4), with a mean of 3.92 m as1 and a standard deviation of 0.90 m. A comparison of these spring sill elevations with those determined from the summer ground survey shows a good relationship between the two estimates, but there are consistent differences. Typically, the spring sills were 0.25 to 130 m higher than those measured in the sum- mer (Fig. 4). This i s due to the presence of ice and snow dams in the connecting channels. Low sill lakes have thicker snow/ice dams because they have deeper water in the con- necting channels at freeze-up and therefore thicker ice covers in the spring. The snow/iw dams of the higher sill lakes are thinner, being composed only of snow, as the channels were dry at freeze-up. In addition, because the higher sill lakes are flooded later in the season, snow melt generally reduces the thickness of the snow dam before it is over-topped by floodwater. Adjusting for the removal of the snowlice dams gives a mean summer sill level of 3.24 m asl, about 0.68 m lower than in the spring, with a standard deviation of 1.20 m.
Summer sill (predicted)
+. 2 20 c
10 II
0 0.0 1.0 2.0 3.0 4.0 5.0 6.0 7.0
Lake Sill Elevation (m asl)
FIG. 4. Spring and summer sill levels for lakes near Inuvik.
These data show that delta lakes occur over a continuum of elevations, from near the lowest water levels recorded in this part of the delta up to the levee height of 6 m reported by Mackay (1963) for this area of the delta. This implies that in terms of lake flooding, there is a continuum of hydrologic regimes from the lowest to highest elevation lakes.
Timing of the Spring Rise in Water Levels
Water levels in the Mackenzie River distributary channels begin to rise noticeably in mid-May from their late winter lows, reaching 2 m as1 on 14 May (day 134) on average, 4 m on 26 May (day 146), and in years when the level reaches 6 m asl, it is attained by 3 June (day 154) (Fig. 5) . A remark- able feature of the Mackenzie River water level regime is the consistency of the timing of this spring flood. The standard deviation of the timing decreases from 7 to 3 days as water levels increase from 1.5 to 6.0 m as1 (Fig. 5) , and the peak water level, which occurs on average on 3 June (day 154), has a standard deviation of only 4.1 days. The earliest recorded peak level occurred on 27 May (day 147) 1981 and the
HYDROLOGIC REGIME OF MACKENZIE DELTA LAKES / 45
70 A - a Moxirnum
T-Tueon ond rtmdord dsviotion
160
150
140
130
FIG. 5 . Timing of water level exceeding lake sill level in spring.
latest on 9 June (day 160) in three separate years (1954, 1965, 1978).
These data demonstrate that the timing of the spring flood peak is very consistent from year to year, occurring within a brief 20-day period that encompasses the latter part of May and early June. However, as will be shown in the following section, the magnitude of the spring flood varies greatly from year to year, and as a result not all lakes are flooded annually.
The consistency of the timing of the spring flood wave is related to a number of complex factors. In a general sense, for example, the rapid shift of the large-scale weather sys- tems from winter to summer conditions, the lag time involved in the propagation of the flood wave down the Mackenzie River, and the large size of the Mackenzie basin (1 600 000 km2) (Fig. 2), where extreme events in one section of the ba- sin are usually moderated by more normal conditions else- where, all combine to produce a consistent, rapid rise in water levels in the Mackenzie Delta in late May.
Extreme Levels
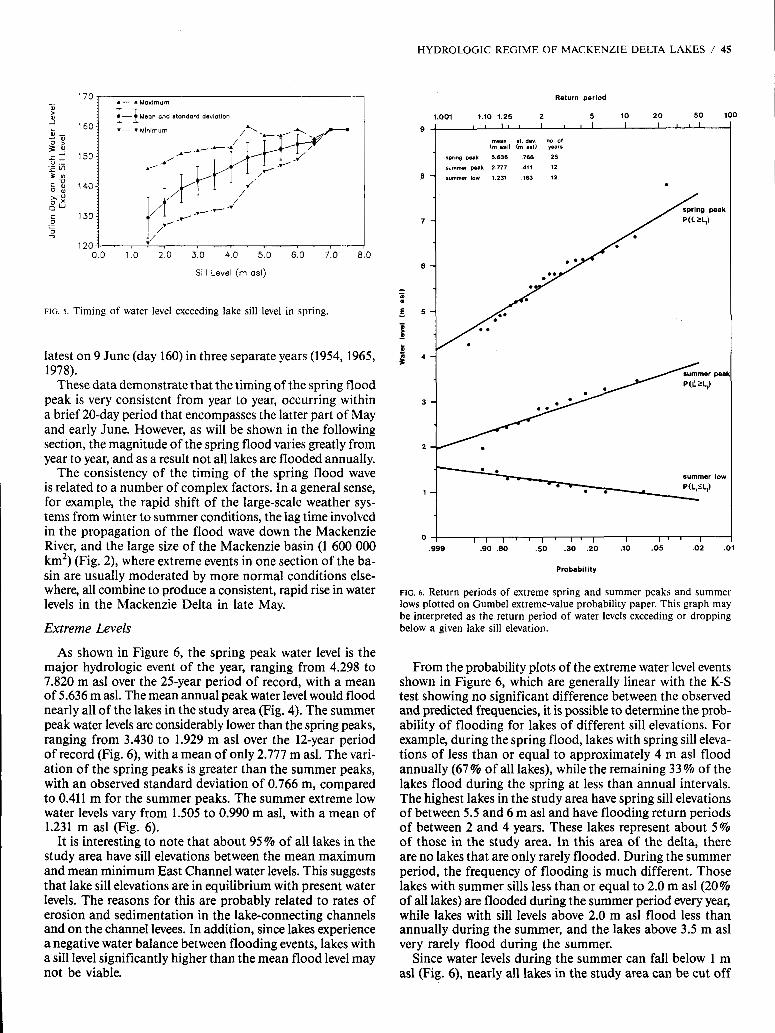
As shown in Figure 6, the spring peak water level is the major hydrologic event of the year, ranging from 4.298 to 7.820 m as1 over the 25-year period of record, with a mean of 5.636 m asl. The mean annual peak water level would flood nearly all of the lakes in the study area (Fig. 4). The summer peak water levels are considerably lower than the spring peaks, ranging from 3.430 to 1.929 m as1 over the 12-year period of record (Fig. 6), with a mean of only 2.777 m asl. The vari- ation of the spring peaks is greater than the summer peaks, with an observed standard deviation of 0.766 m, compared to 0.411 m for the summer peaks. The summer extreme low water levels vary from 1.505 to 0.990 m asl, with a mean of 1.231 m as1 (Fig. 6).
It is interesting to note that about 95 % of all lakes in the study area have sill elevations between the mean maximum and mean minimum East Channel water levels. This suggests that lake sill elevations are in equilibrium with present water levels. The reasons for this are probably related to rates of erosion and sedimentation in the lake-connecting channels and on the channel levees. In addition, since lakes experience a negative water balance between flooding events, lakes with a sill level significantly higher than the mean flood level may not be viable.
I
Probability
FIG. 6. Return periods of extreme spring and summer peaks and summer lows plotted on Gumbel extreme-value probability paper. This graph may be interpreted as the return period of water levels exceeding or dropping below a given lake sill elevation.
From the probability plots of the extreme water level events shown in Figure 6, which are generally linear with the K-S test showing no significant difference between the observed and predicted frequencies, it is possible to determine the prob- ability of flooding for lakes of different sill elevations. For example, during the spring flood, lakes with spring sill eleva- tions of less than or equal to approximately 4 m as1 flood annually (67% of all lakes), while the remaining 33 % of the lakes flood during the spring at less than annual intervals. The highest lakes in the study area have spring sill elevations of between 5.5 and 6 m as1 and have flooding return periods of between 2 and 4 years. These lakes represent about 5% of those in the study area. In this area of the delta, there are no lakes that are only rarely flooded. During the summer period, the frequency of flooding is much different. Those lakes with summer sills less than or equal to 2.0 m as1 (20% of all lakes) are flooded during the summer period every year, while lakes with sill levels above 2.0 m as1 flood less than annually during the summer, and the lakes above 3.5 m as1 very rarely flood during the summer.
Since water levels during the summer can fall below 1 m as1 (Fig. 6), nearly all lakes in the study area can be cut off
46 / P. MARSH and M. HEY
from the main Mackenzie River channels. Even with a return period of 2 years, the water level can drop to 1.25 m asl, cut- ting off approximately 90% of the lakes in the study area from the Mackenzie River for at least a brief interval.
During the spring break-up period, Mackenzie Delta lakes store large volumes of water. For example, in the study area the mean lake level rise, using the mean annual spring peak level weighted by lake area in each elevation band, is 3.9 m. Assuming that this is representative of the entire delta, and given the delta area of 12 000 km2 and lake coverage of 25 % (B.C. Hydro, 1985), the water stored in the delta lakes could represent 25% of the discharge of the Mackenzie River dur- ing the 10 May to 10 June period. Though these calculations are rough estimates and may be prone to large errors, they show that the delta lakes may play an important role in con- trolling main channel water levels during the spring break-up.
Number and Duration of Events
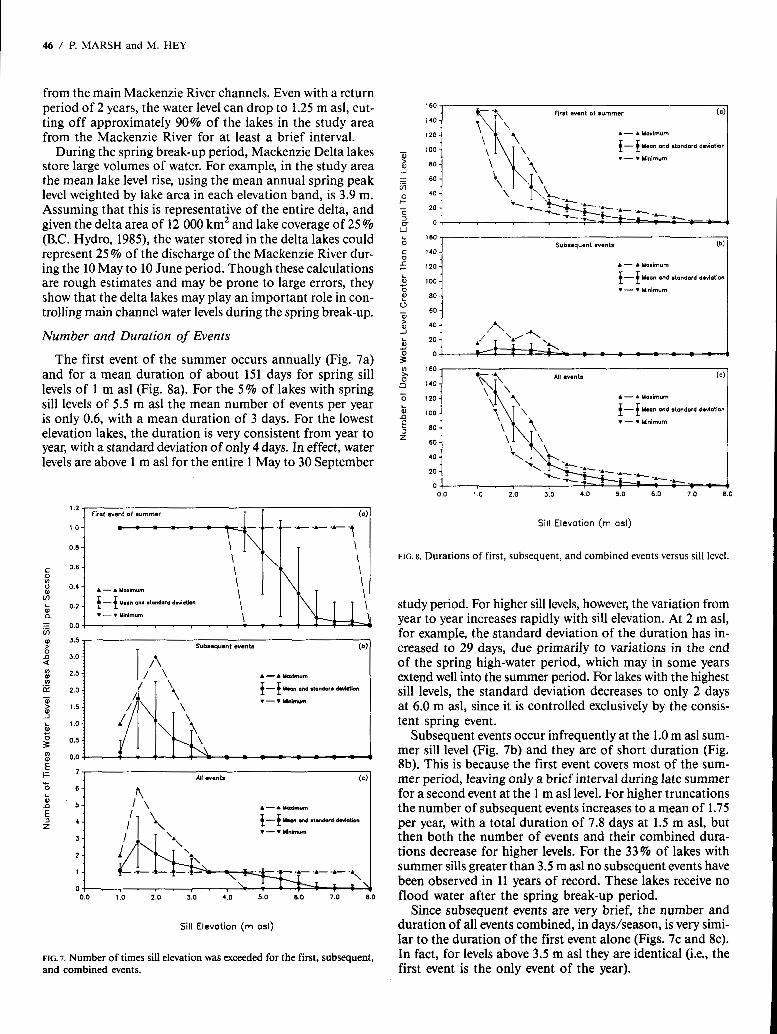
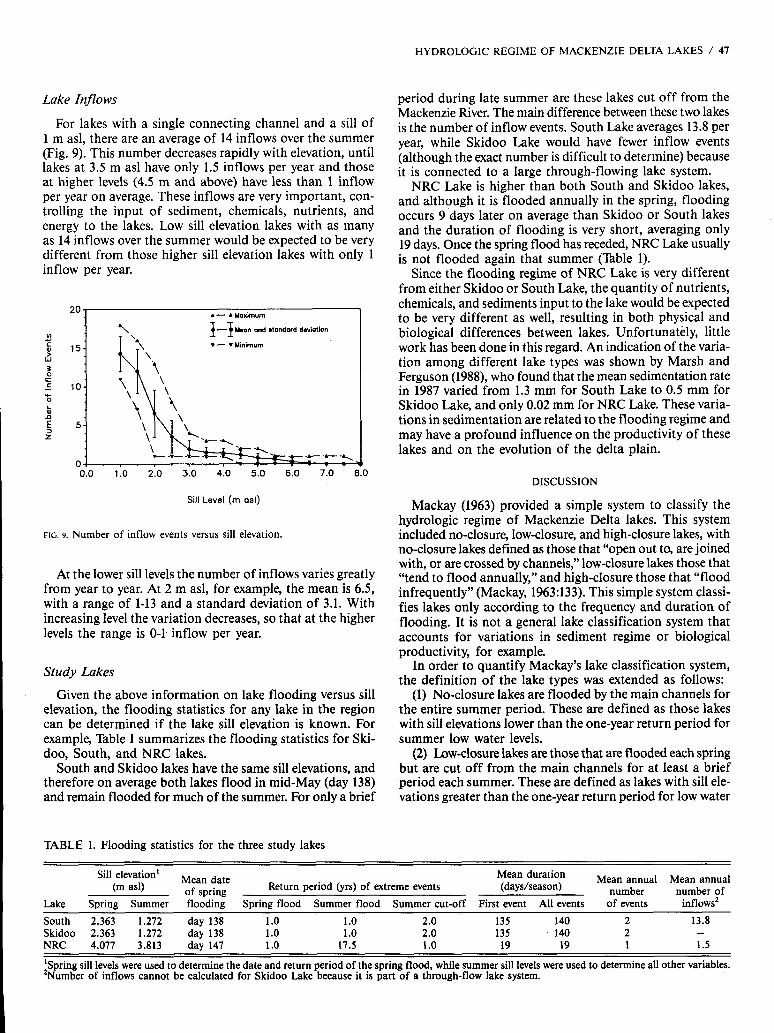
The first event of the summer occurs annually (Fig. 7a) and for a mean duration of about 151 days for spring sill levels of 1 m as1 (Fig. 8a). For the 5 % of lakes with spring sill levels of 5.5 m as1 the mean number of events per year is only 0.6, with a mean duration of 3 days. For the lowest elevation lakes, the duration is very consistent from year to year, with a standard deviation of only 4 days. In effect, water levels are above 1 m as1 for the entire 1 May to 3 0 September
L 9) 4
5 z
Sill Elevation (m a d )
FIG. 7. Number of times sill elevation was exceeded for the first, subsequent, and combined events.
601
m x n r 0
9) 4 L
5 z
Sill Elevation (m asl)
FIG. 8. Durations of first, subsequent, and combined events versus sill level.
study period. For higher sill levels, however, the variation from year to year increases rapidly with sill elevation. At 2 m asl, for example, the standard deviation of the duration has in- creased to 29 days, due primarily to variations in the end of the spring high-water period, which may in some years extend well into the summer period. For lakes with the highest sill levels, the standard deviation decreases to only 2 days at 6.0 m asl, since it is controlled exclusively by the consis- tent spring event.
Subsequent events occur infrequently at the 1.0 m as1 sum- mer sill level (Fig. 7b) and they are of short duration (Fig. 8b). This is because the first event covers most of the sum- mer period, leaving only a brief interval during late summer for a second event at the 1 m as1 level. For higher truncations the number of subsequent events increases to a mean of 1.75 per year, with a total duration of 7.8 days at 1.5 m asl, but then both the number of events and their combined dura- tions decrease for higher levels. For the 33% of lakes with summer sills greater than 3.5 m as1 no subsequent events have been observed in 11 years of record. These lakes receive no flood water after the spring break-up period.
Since subsequent events are very brief, the number and duration of all events combined, in daysheason, is very simi- lar to the duration of the first event alone (Figs. 7c and 8c). In fact, for levels above 3.5 m as1 they are identical (i.e., the first event is the only event of the year).
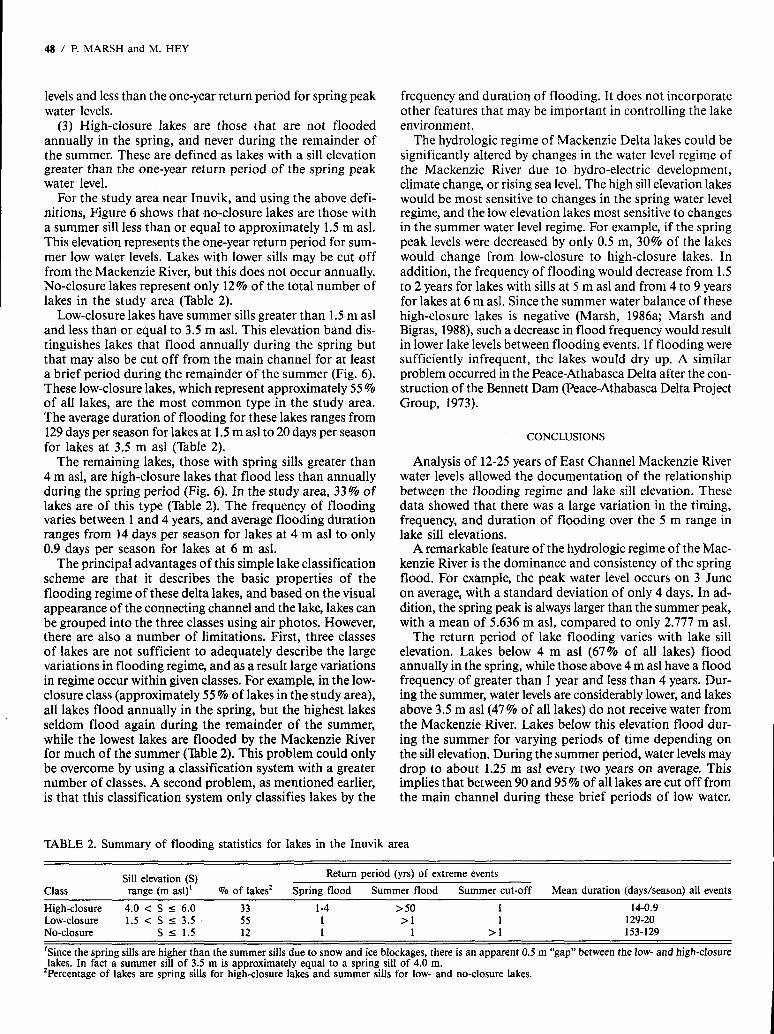
Lake Inflows
For lakes with a single connecting channel and a sill of 1 m asl, there are an average of 14 inflows over the summer (Fig. 9). This number decreases rapidly with elevation, until lakes at 3.5 m as1 have only 1.5 inflows per year and those at higher levels (4.5 m and above) have less than 1 inflow per year on average. These inflows are very important, con- trolling the input of sediment, chemicals, nutrients, and energy to the lakes. Low sill elevation lakes with as many as 14 inflows over the summer would be expected to be very different from those higher sill elevation lakes with only 1 inflow per year.
20 1 A - A Yoximum
\ ~ - ~ U . o n and utnndord deviation
T - v Minimum
10
0.0 1.0 2.0 3.0 4.0 5.0 6.0 7.0 I
Sill Level (rn a d )
FIG. 9. Number of inflow events versus sill elevation.
At the lower sill levels the number of inflows varies greatly from year to year. At 2 m asl, for example, the mean is 6.5, with a range of 1-13 and a standard deviation of 3.1. With increasing level the variation decreases, so that at the higher levels the range is 0-1 inflow per year.
Study Lakes Given the above information on lake flooding versus sill
elevation, the flooding statistics for any lake in the region can be determined if the lake sill elevation is known. For example, Table 1 summarizes the flooding statistics for Ski- doo, South, and NRC lakes.
South and Skidoo lakes have the same sill elevations, and therefore on average both lakes flood in mid-May (day 138) and remain flooded for much of the summer. For only a brief
TABLE 1. Flooding statistics for the three study lakes
HYDROLOGIC REGIME OF MACKENZIE DELTA LAKES / 47
period during late summer are these lakes cut off from the Mackenzie River. The main difference between these two lakes is the number of inflow events. South Lake averages 13.8 per year, while Skidoo Lake would have fewer inflow events (although the exact number is difficult to determine) because it is connected to a large through-flowing lake system.
NRC Lake is higher than both South and Skidoo lakes, and although it is flooded annually in the spring, flooding occurs 9 days later on average than Skidoo or South lakes and the duration of flooding is very short, averaging only 19 days. Once the spring flood has receded, NRC Lake usually is not flooded again that summer (Table 1).
Since the flooding regime of NRC Lake is very different from either Skidoo or South Lake, the quantity of nutrients, chemicals, and sediments input to the lake would be expected to be very different as well, resulting in both physical and biological differences between lakes. Unfortunately, little work has been done in this regard. An indication of the varia- tion among different lake types was shown by Marsh and Ferguson (1988), who found that the mean sedimentation rate in 1987 varied from 1.3 mm for South Lake to 0.5 mm for Skidoo Lake, and only 0.02 mm for NRC Lake. These varia- tions in sedimentation are related to the flooding regime and may have a profound influence on the productivity of these lakes and on the evolution of the delta plain.
DISCUSSION
Mackay (1963) provided a simple system to classify the hydrologic regime of Mackenzie Delta lakes. This system included no-closure, low-closure, and high-closure lakes, with no-closure lakes defined as those that “open out to, are joined with, or are crossed by channels,” low-closure lakes those that “tend to flood annually,’’ and high-closure those that “flood infrequently’’ (Mackay, 1963:133). This simple system classi- fies lakes only according to the frequency and duration of flooding. It is not a general lake classification system that accounts for variations in sediment regime or biological productivity, for example.
In order to quantify Mackay’s lake classification system, the definition of the lake types was extended as follows:
(1) No-closure lakes are flooded by the main channels for the entire summer period. These are defined as those lakes with sill elevations lower than the one-year return period for summer low water levels.
(2) Low-closure lakes are those that are flooded each spring but are cut off from the main channels for at least a brief period each summer. These are defined as lakes with sill ele- vations greater than the one-year return period for low water
Sill elevation’ Mean date of spring (m asl)
Mean duration Mean annual Mean annual Return period (yrs) of extreme events (daysheason) number number of
Lake Surina Summer flooding Suring flood Summer flood Summer cut-off First event All events of events inflows’ ~ ~~
South 2.363 1 . 2 F day 138 1 .o 1 .o 2.0 135 140 2 13.8 Skidoo 2.363 1.272 day 138 1 .o 1 .o 2.0 135 140 2 NRC 4.077 3.813 day 147 1 .o 17.5 1 .o 19 19 1 1.5
‘Spring sill levels were used to determine the date and return period of the spring flood, while summer sill levels were used to determine all other variables. ’Number of inflows cannot be calculated for Skidoo Lake because it is part of a through-flow lake system.
~ ~
-
48 / P. MARSH and M. HEY
levels and less than the one-year return period for spring peak water levels.
(3) High-closure lakes are those that are not flooded annually in the spring, and never during the remainder of the summer. These are defined as lakes with a sill elevation greater than the one-year return period of the spring peak water level.
For the study area near Inuvik, and using the above defi- nitions, Figure 6 shows that no-closure lakes are those with a summer sill less than or equal to approximately 1.5 m asl. This elevation represents the one-year return period for sum- mer low water levels. Lakes with lower sills may be cut off from the Mackenzie River, but this does not occur annually. No-closure lakes represent only 12% of the total number of lakes in the study area (Table 2).
Low-closure lakes have summer sills greater than 1.5 m as1 and less than or equal to 3.5 m asl. This elevation band dis- tinguishes lakes that flood annually during the spring but that may also be cut off from the main channel for at least a brief period during the remainder of the summer (Fig. 6). These low-closure lakes, which represent approximately 55 % of all lakes, are the most common type in the study area. The average duration of flooding for these lakes ranges from 129 days per season for lakes at 1.5 m as1 to 20 days per season for lakes at 3.5 m as1 (Table 2).
The remaining lakes, those with spring sills greater than 4 m asl, are high-closure lakes that flood less than annually during the spring period (Fig. 6). In the study area, 33 % of lakes are of this type (Table 2). The frequency of flooding varies between 1 and 4 years, and average flooding duration ranges from 14 days per season for lakes at 4 m as1 to only 0.9 days per season for lakes at 6 m asl.
The principal advantages of this simple lake classification scheme are that it describes the basic properties of the flooding regime of these delta lakes, and based on the visual appearance of the connecting channel and the lake, lakes can be grouped into the three classes using air photos. However, there are also a number of limitations. First, three classes of lakes are not sufficient to adequately describe the large variations in flooding regime, and as a result large variations in regime occur within given classes. For example, in the low- closure class (approximately 55 % of lakes in the study area), all lakes flood annually in the spring, but the highest lakes seldom flood again during the remainder of the summer, while the lowest lakes are flooded by the Mackenzie River for much of the summer (Table 2). This problem could only be overcome by using a classification system with a greater number of classes. A second problem, as mentioned earlier, is that this classification system only classifies lakes by the
frequency and duration of flooding. It does not incorporate other features that may be important in controlling the lake environment.
The hydrologic regime of Mackenzie Delta lakes could be significantly altered by changes in the water level regime of the Mackenzie River due to hydro-electric development, climate change, or rising sea level. The high sill elevation lakes would be most sensitive to changes in the spring water level regime, and the low elevation lakes most sensitive to changes in the summer water level regime. For example, if the spring peak levels were decreased by only 0.5 m, 30% of the lakes would change from low-closure to high-closure lakes. In addition, the frequency of flooding would decrease from 1.5 to 2 years for lakes with sills at 5 m as1 and from 4 to 9 years for lakes at 6 m asl. Since the summer water balance of these high-closure lakes is negative (Marsh, 1986a; Marsh and Bigras, 1988), such a decrease in flood frequency would result in lower lake levels between flooding events. If flooding were sufficiently infrequent, the lakes would dry up. A similar problem occurred in the Peace-Athabasca Delta after the con- struction of the Bennett Dam (Peace-Athabasca Delta Project Group, 1973).
CONCLUSIONS
Analysis of 12-25 years of East Channel Mackenzie River water levels allowed the documentation of the relationship between the flooding regime and lake sill elevation. These data showed that there was a large variation in the timing, frequency, and duration of flooding over the 5 m range in lake sill elevations.
A remarkable feature of the hydrologic regime of the Mac- kenzie River is the dominance and consistency of the spring flood. For example, the peak water level occurs on 3 June on average, with a standard deviation of only 4 days. In ad- dition, the spring peak is always larger than the summer peak, with a mean of 5.636 m asl, compared to only 2.777 m asl.
The return period of lake flooding varies with lake sill elevation. Lakes below 4 m as1 (67% of all lakes) flood annually in the spring, while those above 4 m as1 have a flood frequency of greater than 1 year and less than 4 years. Dur- ing the summer, water levels are considerably lower, and lakes above 3.5 m as1 (47% of all lakes) do not receive water from the Mackenzie River. Lakes below this elevation flood dur- ing the summer for varying periods of time depending on the sill elevation. During the summer period, water levels may drop to about 1.25 m as1 every two years on average. This implies that between 90 and 95 % of all lakes are cut off from the main channel during these brief periods of low water.
TABLE 2. Summary of flooding statistics for lakes in the Inuvik area
Sill elevation (S) Return period (yrs) of extreme events Class range (m ad)’ 070 of lakes2 Spring flood Summer flood Summer cut-off Mean duration (dayslseason) all events
High-closure 4.0 < S 5 6.0 33 1-4 > 50 1 14-0.9 Low-closure 1.5 < S 5 3.5 55 1 > 1 1 129-20 No-closure S 5 1.5 12 1 1 > 1 153-129
‘Since the spring sills are higher than the summer sills due to snow and ice blockages, there is an apparent 0.5 m “gap” between the low- and high-closure lakes. In fact a summer sill of 3.5 m is approximately equal to a spring sill of 4.0 m.
2Percentage of lakes are spring sills for high-closure lakes and summer sills for low- and no-closure lakes.
Data on the return period of lake flooding allowed the lake classification system developed by Mackay (1963) to be quantified. No-, low-, and high-closure lakes were shown to represent 12,55, and 33 % respectively of all lakes in the study area.
Changes in the hydrologic regime of the Mackenzie River, due to hydro-electric development, climate change, or rising sea level, could have dramatic effects on the hydrologic regime of Mackenzie Delta lakes. These effects could include decreased lake flooding and resulting lower lake levels or the drying up of the high sill elevation lakes, as well as changes in the chemical and nutrient inputs to delta lakes. The effect of these changes on the biologic regime are not well known at present.
ACKNOWLEDGEMENTS
The generous logistical support of the Polar Continental Shelf Project, Department of Energy, Mines and Resources, and the Inuvik Scientific Resource Centre, Department of Indian and Northern Affairs, is gratefully acknowledged. We also thank M. Ferguson for her assistance in the field and the Water Survey of Canada for providing the water level data for East Channel at Inuvik.
REFERENCES
B.C. HYDRO. 1985. Liard Hydroelectric Development, Mackenzie Delta Environmental Hydrology. Report ESS-92. Unpubl. report, British Columbia Power and Hydro Authority, Vancouver, British Columbia. 214 p.
BIGRAS, S.C. 1987. Lake Regimes, Mackenzie Delta, N.W.T., 1984. NHRI Contribution No. 87005. Unpubl. report, National Hydrology Research Institute, Environment Canada, Saskatoon, Saskatchewan. 52 p.
BROWN, R.J.E. 1957. Observations on break-up in the Mackenzie River and its delta in 1954. Journal of Glaciology 3(22):133-142.
CORDES, L.D., and McLENNAN, D.S. 1984. The Estimation of Sedimen- tation Rates Using '37Cs in Lakes of the Mackenzie Delta. L. Cordes and Associates, Calgary, Alberta. Unpubl. report, British Columbia Power
ENVIRONMENT CANADA. 1987. Surface Water Data Reference Index, and Hydro Authority, Vancouver, British Columbia. 55 p.
Canada, 1986. Ottawa: Inland Waters Directorate, Water Resources Branch. 401 p.
HYDROLOGIC REGIME OF MACKENZIE DELTA LAKES / 49
GILL, D. 1971. Vegetation and Environment in the Mackenzie River Delta, N.W.T.: A Study in Sub-Arctic Ecology. Ph.D. thesis, Department of Ge- ography, University of British Columbia, Vancouver, British Columbia. 694 p.
HAAN, C.T. 1977. Statistical Methods in Hydrology. Ames: Iowa State University Press. 378 p.
HIRST, S.M., MILES, M., BLACHUT, S.P., GOULET, L.A., and TAY- LOR, R.E. 1987. Quantitative Synthesis of the Mackenzie Delta Ecosystems (Main Volume). Applied Ecology Consultants, North Vancouver, British Columbia. Unpubl. report, Inland Waters Directorate, Environment Canada, Ottawa, Ontario. 375 p.
MACKAY, J.R. 1963. The Mackenzie Delta Area, N.W.T Misc. Report 23. Ottawa: Geological Survey of Canada. 202 p.
MARSH, P. 1986a. Modelling water levels for a lake in the Mackenzie Delta. In: Kane, D.L., ed. Proceedings of the Symposium: Cold Regions Hydrology, University of Alaska, Fairbanks. Bethesda, Maryland: American Water Resources Association. 23-29.
-. 1986b. Hydrology of Mackenzie Delta lakes. In: Mackay, W.C., ed. Northern Rivers and Lakes Workshop; Knowing the North: Integrating Tradition, Technology and Science. Boreal Institute for Northern Studies Occasional Publication No. 22. In press.
-and BIGRAS, S.C. 1988. Evaporation from Mackenzie Delta lakes, N.W.T. Arctic and Alpine Research 20(2):220-229.
MARSH, P., and FERGUSON, M.E. 1988. Sediment regime of lakes in the Mackenzie Delta. NHRI Contribution No. 88016. Unpubl. report, National Hydrology Research Institute, Environment Canada, Saskatoon, Saskatchewan. 67 p.
McELHANNEY SURVEYING AND ENGINEERING LTD. 1983. Mack- enzie Delta Inertial Survey. Unpubl. report, Environment Canada, Inland Waters Directorate, Western and Northern Region, Regina, Saskatchewan. 64 p.
PEACE-ATHABASCA DELTA PROJECT GROUP. 1973. The Peace- Athabasca Delta Project - Technical Report. Ottawa: Environment Canada. 175 p.
PEARCE, C.M. 1986. The Distribution and Ecology of the Shoreline Vegetation in the Mackenzie Delta, N.W.T. Ph.D. thesis, Department of Geography, University of Calgary, Calgary, Alberta. 400 p.
PETERSON, E.B., ALLISON, L.M., and KABZEMS, R.D. 1981. Alluvial Ecosystems. Mackenzie River Basin Committee, Mackenzie River Basin Study Report Supplement 2. Ottawa: Environment Canada. 129 p.
TODOROVIC, P. 1978. Stochastic models of floods. Water Resources Research 14(2):345-356.
WOO, M.K., and WAYLEN, P.R. 1984. Areal prediction of annual floods generated by two distinct processes. Hydrological Sciences Journal
YEVJEVICH, V. 1972. Probability and Statistics in Hydrology. Fort Collins: 29(1):75-88.
Water Resources Publications. 294 p.