the eurovision song contest is voting political or...
TRANSCRIPT
The Eurovision Song Contest
Is Voting Political or Cultural?1
Victor GinsburghECARES, Universite Libre de Bruxelles and
Center for Operations Research and Econometrics, Louvain-la-Neuve
Abdul NouryECARES, Universite Libre de Bruxelles
November 2004Revised October 2006
Abstract
We analyze the voting behavior and ratings of judges in a popularsong contest held every year in Europe since 1956. The dataset makesit possible to analyze the determinants of success, and gives a rareopportunity to run a direct test of vote trading. Though the votescast may appear as resulting from such trading, we show that they arerather driven by quality of the participants as well as by linguistic andcultural proximities between singers and voting countries. Therefore,and contrary to what was recently suggested, there seems to be noreason to take the result of the Contest as mimicking the politicalconflicts (and friendships).
JEL codes: D72, Z10Keywords: votre trading, voting behavior, popular music, contests.
1We are grateful for excellent suggestions made by seminar participants at Universityof Oviedo, and the many comments by two very knowledgeable anonymous referees.
1 Introduction
The purpose of this paper is to analyze the determinants of success andvoting behavior of judges in one of the most popular singing contest heldsince 1956 in Europe, the Eurovision Song Contest. The competition isinteresting since each country (player) votes for singers (or groups of singers)of all other participating countries. This gives a rare opportunity to test ina direct way whether players exchange votes.
Such exchanges seem indeed to happen. In the May 2004 contest forexample, Ukraine, the winning country, benefited from the votes of all itsformer political “neighbors.” Its average marks were 8.1, but it received 12(the highest marks) from Estonia, Latvia, Lithuania, Poland, and Russia,and 10 (the next highest, since 11 does not exist) from Belarus and Serbia.Another example involves two other countries which, though they were veryfar from winning, could be suspected to have colluded: The Netherlands,with an average rating of 2.3 received 5 points from Belgium, which in turnreceived 6 from the Dutch judges, though its average rating was only 3.7. Itis therefore reasonable to suspect that voting agreements are struck, or thatcountries cast political rather than “artistic” votes, even though there is nopolitical issue at stake.
Political voting was suggested for example by Terry Wogan, the BBC-TVcommentator after the 2000 contest.2 The BBC also draws attention to theway in which neighbors vote for each other. The issue was recently takenup by The Economist,3 following the publication of the paper by Fenn et al.(2005):
”What makes a song good? Lyrics, melody and rythm have theirplace, of course, but for entrants of the Eurovision Song Conteston May 21st, geopolitics may be the decisive factor. The data[analyzed by Fenn and colleagues] confirm what many alreadysuspected: that the contest is not always about the quality ofthe songs. The research published has shown the contest also hasa deeper meaning, and reveals how “European” each country is.Despite its Eurosceptic image, for instance, the data suggest that
2See for instance the discussion on http://homepage.ntlworl.com/waterloo/2000/politics.htm.
3May 21, 2005, vol. 375, p. 93.
Britain is very much in tune with the rest of Europe. SupposedlyFrance, by contrast, is actually out of kilter with many of itsEuropean cousins.”
The collusive voting behavior in the Eurovision song contest is studied byan increasing number of scholars with various backgrounds, including com-puter sciences, economics, sociology, etc. Yair (1995) was among the firstto study the contest. Using the voting data over the period 1975-1992, hefound three bloc areas namely Western, Mediterranean and Northern Europe.Gatherer (2004) analyzed the period 1975-2002 and identified two large blocs,called “the Viking Empire” including Scandinavian and Baltic countries, andthe “Warsaw Pact” comprising Russia, Romania and the former Yugoslavia.More recently, Gatherer (2004, 2006) used Monte Carlo simulation methodsto study voting pattern of countries over the period 1975-2005. He empha-sized the emergence of large geographical blocs since the mid-90s. Fenn etal. (2005) investigated the relations between European countries representedin the contest in terms of a dynamical network, and concluded that thereexist “unofficial cliques of countries” and vote patterns. They highlightedthis using several network techniques, as well as cluster analysis, including adendrogram which seems to support the existence of cliques.
Some additional issues in the context of the Eurovision are analyzed byHaan et al. (2005) and Bruine de Bruin (2005). They mainly focused on theeffect of performance order on the voting outcome and the difference betweentele-voting and votes cast by a jury.
A second, though indirectly, related literature concerns coalition forma-tion between countries in international organizations such as the United Na-tions, or in supra-national legislatures like the European Parliament. Thestability of international coalitions is documented by Holcombe and Sobel(1996) and Erik Voeten (2000). In particular, Voeten (2000) finds that thepositions and coalitions of countries are stable across time, issue area andimportance of issue.
In this paper we show that “quality” as determined by the jurys of thevarious competitions, and which is ignored by Fenn et al. (2005), amongothers, plays the most important role. There exist cliques or voting blocs,but these are based on linguistic and cultural similarities, which, once theyare introduced to explain the votes cast by each participating country forother countries, eliminate the effect of votes’ exchanges based on political
1
issues. We thus conclude that what may look as vote trading is in factsincere voting based on “quality,” and linguistic and cultural proximities.Still, one can argue that the voting procedure takes into account factors thatare not purely artistic.
The paper is organized as follows. In Section 2, the main features of thecompetition are given. Section 3 discusses the voting equation. Section 4describes our estimation results, and shows that those obtained by Fenn etal. (2005) can be explained from a rather different perspective. Section 5concludes.
2 The Eurovision Song Contest
The Eurovision Song Contest (ESC) was born in 1955, and held for the firsttime in Lugano, Switzerland, in 1956, with seven countries competing. Thenumber of participants increased to 16 in 1961. Non-European countries canalso take part: Israel, Morocco, and Turkey are now regular participants.The only restriction is that the television that broadcasts the show (thatis the previous year’s winning country since 1958) has to be member of theEuropean Broadcasting Union. Since 2002, there are 24 slots for finalists.4 In2001, the contest was held in front of an audience of 38,000 in Copenhagen,and broadcast live all around the world. Contests are watched by severalhundred millions of people.
The scoring system changed several times. Since 1975 – the first yearin our dataset –, the 11 (16 between 1988 and 1997) jury members in eachcountry (often a popular jury, not consisting of experts), can rate on a scalefrom 1 to 12. Televoting was introduced in 1998, so that every citizen canparticipate, and according to Haan, Dijkstra and Dijkstra (2005), “in manycountries, the number of people calling in to register their vote is in thehundreds of thousands.”
The ratings are normalized so that the favorite song gets 12 points, thenext one 10, and then 8, 7, 6, 5, 4, 3, 2 and 1. This allows each voting countryto give positive ratings to ten other countries. Participating countries cannot
4Four are reserved for the Big Four (Germany, France, Spain and the United King-dom). The selection rules for others have changed over time. Since 2004, all countries canparticipate in semi-finals. Twenty-four countries can enter the finals: the big four, the tenbest from the previous year and the ten best from the semi-finals.
2
vote for their nationals.The order in which candidates perform is randomly drawn before the
competition starts. After the performance ends, countries are asked to casttheir votes. Results are announced country by country, in the order in whichcountries performed. Participants are ranked according to their aggregatescore.
3 The Voting Equation
Our purpose is to explain vij, the vote (that is, the number of points) castby the judges of country i ∈ L in evaluating the performer of country j ∈ L(i 6= j, since country i cannot vote for its own candidate), where L is thenumber of participating countries.
If countries i and j (i 6= j) exchanged their votes without taking intoaccount any other dimension, the voting equation could simply be written
vij = αvji + uij, (1)
where α is a parameter, and uij a random disturbance. A positive α wouldindicate exchange of votes between the two countries.
To take account of other factors, the equation should contain variablesxjk, k = 1, ..., K measuring the K characteristics of performer j, as well ascharacteristics zip, p = 1, ..., P of voter i, and read
vij = αvji +∑
k
βkxjk +∑
p
γpzip + uij, (2)
where the β and the γ are parameters to be estimated.Note first that vij will appear in the right-hand side of the equation for the
observation concerning the vote of j for singer i. To circumvent this, one mayuse the vote cast in the previous competition, say vji,−1, though this needsthe additional assumption that countries keep their committments over time.An alternative is to use only one half of the observations so that every vij thatappears in the left-hand side of the equation is not used in the right-handside. This will be further discussed in Section 4, where we turn to estimation.
In an ideal world the most important determinant of voting should ob-vioulsy be the quality of the performance. One should consequently controlfor quality. Quality, however, is not observed by the analyst. As a result
3
a proxy must be constructed. One way of doing this is to take the ex-postaverage rating of a musician j by the juges of countries l ∈ L, l 6= j, whichcreates some additional endogeneity, since i’s vote is included in the measurewhen i votes. This can be avoided by excluding i’s vote from the definitionof quality when i votes, so that the quality of a given singer is defined in adifferent way for each voter:
qij =
1
L − 2
∑
l 6=i,j
vlj . (3)
As is clear from equation (3), quality is slightly different for each vote castingcountry. The difference, in practice, is negligible given the relatively largenumber of voters in any given year.
This measure of quality is quite reasonable if there are only bilateralagreements, that is, if voting blocs include exactly two countries. However,if voting blocs include more than two countries, their vote will be included,and true quality may be overestimated. Therefore, we exclude from thequality measure of a given country during a specific period the votes of allmembers belonging to the same voting bloc, as identified by Gatherer (2006),who studied collusive behavior beween 1975 and 2005. To the best of ourknowledge, this is the only study that analyzes collusion in successive five-year periods and reports on the voting blocs. Thus, we exclude the votescast by Poland and the Russian Federation in the definition of quality forUkraine during 2001 and 2003, or of the votes cast by Cyprus during 1996to 2000 in the quality definition of Greece, and so on.5 Quality is measuredas
qbj
j =1
L − bj − 1
∑
l 6=j,i∈Bj
vlj, (4)
where Bj is the set of countries that form a bloc with j in a given year (orperiod) and bj is their number. Our measure of quality is thus not affectedby the presence of voting blocs.
To avoid endogeneity a better alternative is to instrument quality. Aswill be shown in Section 4, a valid instrument is provided by lagged quality,defined in the same way as in (4).
In addition to quality, individual characteristics of the performer(s) mayalso affect the number of votes received by a performing country. These
5For more details see Figures 1 and 2 in Gatherer (2006).
4
include (a) a dummy for host country: the variable takes the value 1 forthe performer who represents the host country, (b) the language in whichthe artist sings (English, French, other),6 (c) gender of the artist, and (d)whether the artist sings alone, in a duet or in a group.7
The order in which musicians appear in a competition seems to havean effect on the outcome. Ginsburgh and Flores (1996) and Glejser andHeyndels (2001) observe that in one of the top-ranked international pianocompetitions, the Queen Elisabeth competition, those who perform first areless likely to receive high ratings. Similar observations are made by Haan,Dijkstra and Dijkstra (2005) and Bruine de Bruin (2005) for the Eurovisioncontest, in papers that are essentially devoted to examine this issue. We thusincluded the order of appearance as a determinant.
In a spatial model framework voters’ characteristics are also important de-terminants of voting behavior. Since these are more difficult to describe, onecould simplify this part of the model by assuming that each voting country isrepresented by a dummy. However, since the number of points a country canaward is exogenously fixed this approach cannot be followed. As an alterna-tive we include linguistic and cultural distances wij,p, p = 1, 2, ..., P betweenperformers i and voters j. Note that languages are not used as a measureof the distance between the language spoken by voters and the one in whichthe song is performed (most of them are nowadays performed in English),but they represent cultural proximities between populations.
Linguistic distances are based on the lexicostatistical method, invented byMorris Swadesh (1952). The method starts with a list of meanings that arebasic enough for every culture to have words for them, for example, mother,
father, blood, digits, etc. The list used by Dyen, Kruskal and Black (1992)contains 200 such meanings. Phonetic representations are collected for the
6Information on the language in which a song was performed (English, French, Other)is based on the title of the song. For example, if the title was in English, such as ”saveyour last kisses for me”, we coded the language of the song as English. Note that in somecases, a title in English or French does not necessarily mean that the song was entirelyperformed in English or in French. Likewise, a song performed essentially in English orFrench may have a title in another language.
7Gender of the singer or composition of the group (Male, Female, Duet) were con-structed from the records’ covers which, in most cases, include pictures. In some cases,however, neither name, nor photograph were sufficient to guess gender. Sometimes thecover of the record was not available at all. All those cases were dropped due to missingobservations.
5
words with these meanings for a group of languages.8 For each meaning,a linguist makes expert judgments of cognation. Two forms are said to becognate if they both descend in unbroken lines from a common ancestral word.For each pair of languages, a lexicostatistical distance between languages land m is computed. It is equal to n0
lm/(n0
lm + nlm), where n0
lm is the numberof meanings for which the speech varieties l and m are classified as “notcognate” and nlm is the number of meanings for which they are “cognate:”the larger this number, the more “distant” the two languages.9
National culture differences are represented by the four dimensions10 stud-ied by Geert Hofstede (1980, 1991). Hofstede’s ideas started with a researchproject across subsidiaries of the multinational corporation IBM in 64 coun-tries. Subsequent studies by others covered students in 23 countries, elites in19 countries, commercial airline pilots in 23 countries, up-market consumersin 15 countries, and civil service managers in 14 countries. These studiesidentified and scored the following four dimensions:11
(a) power distance measures the extent to which the less powerful members ofa society accept that power is distributed unequally; it focuses on the degreeof equality between individuals;(b) individualism measures the degree to which individuals in a society areintegrated into groups; it focuses on the degree a society reinforces individualor collective achievement and interpersonal relationships;(c) masculinity refers to the distribution of roles between genders in a so-ciety; it focuses on the degree to which a society reinforces the traditionalmasculine work role of male achievement, control, and power;(d) uncertainty avoidance deals with a society’s tolerance for uncertainty orambiguity, and refers to man’s search for truth.
8Swadesh and his followers used the idea for Indo-European languages, but this hassince been extended to African and American Indian languages.
9See Dyen, Kruskal and Black (1992, pp. 102-117) which contains a matrix of distancesbetween Indo-European languages.
10Hofstede adds a fifth distance (long-term orientation) that originates from a researchconducted in 23 countries only. Since many countries that are represented in our sampleare missing, this dimension cannot be used here. For details, see Hofstede and Bond(1988).
11The definitions are taken from http://spitswww.uvt.nl/web/iric/hofstede/page3.htmand http://geert-hofstede.international-business-center.com/index.shtml (April 2004), awebpage on which the data can also be found.
6
Table 1 illustrates the correlations between the various variables for thecountries and native languages that are present in our sample. UncertaintyAvoidance is correlated with three other variables, but otherwise, small cor-relations indicate that distances seem to pick very different dimensions ofpeoples’ behavior.
4 Data and Estimation Results
Data on contests cover 29 years (1975-2003), with an average of 22 participat-ing countries.12 This produces 462 votes (22 times 21) for each competition.Given that values of several variables are missing – in particular cultural andlinguistic distances – and since we use lagged votes we end up with 4,074 ob-servations. Using lagged qualities as instruments for present quality, furtherreduces the number of observations to 3,489 in some regressions.
The voting equation is estimated by linear methods but since votes (in factratings) are integers that take values between 0 and 12 (with the exclusionof 9 and 11), ordered probit and Tobit methods13 will also be used. Theequation is:
vij = αvji,−1 + β1qbj
j +∑
k
βkxjk +∑
p
γpwij,p + uij, (5)
using (4) as the definition of quality qbj
j .Equation (5) pools observations from 1975 to 2003. We note, however,
that voting procedures have changed since 1998, when televoting was intro-duced, while only judges were allowed to vote until 1997. One may wonderwhether the collusion assumption is as likely to hold after 1997. We checked
12Extensive information on the Eurovision Song Contest is available on various web-sites. See for example http://www.eurosong.net/data/database.htm or http://members.fortunecity.com/mcdeil69. Votes and variables such as “Order of performance” and “Hostcountry” can be collected from there. Though the competition started in 1956, our anal-ysis starts in 1975, since the current rating system was adopted in 1975 only. In 2004,new rules were again adopted for the voting system: semi-finals started to be organized,in which some countries are eliminated, but can still vote in the finals. Therefore we choseto stop in 2003.
13Only 10 performers get positive rates. Since there are on average 22 competitors, 12are rated 0.
7
for this by estimating (5) (using OLS only) on on both subperiods and testedH0: the coefficients are equal in the two subperiods . The appropriate F-testturns out to be equal to 1.04, showing that we cannot reject H0 at the 1%confidence level. We may thus conclude that there is no significant differencebetween the results of ranking by judges and ranking by tele-voters.
Columns (a) to (d) of Table 2 contain the results of an OLS estimation of(5). We first observe that quality always plays a very significant role, and canbe interpreted as showing that there is large agreement between judges onthe rating of candidates. Vote trading is significant only in specification (a),in which no account is taken of linguistic and cultural distances. It ceases tobe so in all the other specifications once linguistic and/or cultural distancesare also accounted for. Note that even when the coefficient on vote tradingis significantly different from zero, its value is very small. Though not alldistance coefficients are significantly different from zero at the five percentprobability level, they all pick negative signs (the larger the distance, thelower the rating).
Column (e) of Table 2 contains the results of a two-stage least-squares(TSLS) estimation of Eq. (5), in which the quality of performer i is instru-
mented by qbj
j,−1 and qbj
j,−2, the lagged qualities obtained in the two previouscompetitions. The instruments used for quality satisfy both validity condi-tions for “good” instruments. Current quality was regressed on all exoge-nous variables as well as on lagged qualities q
bj
j,−1 and qbj
j,−2 , which pickedt-statistics of 3 and 7 respectively, showing that we do not face weak instru-ments. It is not surprising that this correlation is high, since having beenamong the best in a given year exerts pressure on future contestants. Theexogeneity condition is also satisfied, since the current year’s vote can ob-viously have no effect on the lagged vote and therefore, on quality. Finally,the overidentifying restrictions test, which can be used since we have moreinstruments than endogenous variables, leads to a χ2 value of 0.75, whilethe tabulated value with one degree of freedom is equal to 3.84 at the 5percent level. The specification can therefore not be rejected, which impliesthat the instruments (lagged qualities) are valid and that the model is notmisspecified.
Results produced by TSLS are very similar to the previous ones. Theyshow that quality is still very significant, there is no significant vote trad-ing, singer characteristics do not matter, language proximity is significantly
8
different from zero at the one percent probability level, and two cultural dis-tance measures are significantly different from zero at the five percent level.Estimation results using ordered probit or Tobit specifications (AppendixTables 1 and 2), lead to qualitatively comparable results.
The results make it clear that some variables have statistically significanteffect on votes. However, since these are measured in different units, itis not easy to see which ones have meaningful effects. Table 3 comparesthe regression coefficients in specification (d) of Table 2 with standardizedcoefficients, obtained after multiplication of the coefficients of column (d) bysj/sy where sj and sy represent the standard deviations of regressor j and ofthe dependent variable y.14 Results show that the quality of the singer (orgroup) is the most important variable, and that the effect of vote trading isdwarfed by the effect of lingustic and cultural distances.
Table 4 reproduces results in which quality, as well as other variablesare replaced by fixed performer and voter effects. Vote trading is tested bythe introduction of lagged votes in specifications (a)-(c), and current votesin (d)-(f). Conclusions are identical to the previous ones: the vote tradingeffect vanishes once linguistic and cultural distances are accounted for.
In Section 2, we mentionned that introducing current votes was problem-atic, since every vij appears in both sides of the equation. Estimating thevoting equation with half of the votes (so that when vij appears as dependentvariable, the observation in which vji is the dependent variable is excluded)would be a solution, though one has to decide which half should be dropped.To get some insight, we run 100 regressions15 on 100 random samples of halfthe number of observations. We then count the number of times each param-eter is (or ceases to be) significantly different from zero at the five and theone percent probability levels. Results of these simulations appear in Table5. They show that quality remains significant in all cases, but that the votetrading effect ceases to be significantly different from zero once linguistic andcultural distances are introduced.16
All our results point in the same direction. “Quality” is the main de-terminant in the voting procedure, linguistic and other cultural factors are
14See Goldberger (1964, pp. 197-198.)15Only OLS were used here, since they lead to results that are similar to those obtained
by other estimation methods. The number of 100 samples was chosen arbitrarily.16Note that these results are based on definition (3) of quality, instead of (4). This
should hardly matter since the correlation between the two variables is equal to 0.97.
9
present, but not at the forefront. Political vote trading is not an issue oncecultural factors are taken into account. This thus not mean that there is novote trading, but it is rather due to cultural and linguistic factors.
Though Fenn et al. (2005) do not use regression analysis, their resultsmay be biased or misleading since quality is absent from their calculations.But even if their results were taken for granted, most of them point to lin-guistic affinities, as is clear from their dendrogram, reproduced here as Figure1b, next to a dendrogram based on distances between Indo-European lan-guages that is obtained from Dyen et al. (1992), using a clustering algorithm(Figure 1a). We discuss clusters of countries starting with those that areclose in terms of the distance appearing on the vertical axis of the Fenn atal. (2005) dendrogram.
(a) Greece and Cyprus appear very close. Greek is of course spoken in Greece,and by some 75 percent of the Cypriot population.17
(b) Denmark and Sweden come next, but their languages are very close aswell as is seen from the language dendrogram.(c) Next comes Iceland, and the group of Nordic countries. Though Estonianand Finnish do not belong to the same group of Nordic languages, they areprobably close in terms of other dimensions.(d) At approximately the same distance, one finds Ireland and the UK, whichshould hardly come as a surprise.(e) The same applies to The Netherlands and Belgium, where 60 percent ofthe population is of Germanic origin and speaks Dutch.(f) Likewise, at a rescaled distance of 1, there is a cluster formed by Bosnia,Turkey, Croatia, Malta, and Slovenia. Three of these share Slavic languages,but still, this is a rather strange group, which probably shares a feeling ofbeing at the “marches” of Europe.(g) Finally there are two countries (France and Portugal) that speak Ro-mance languages, but are far from the rest of Europe. But so are Germanyand Poland, Switzerland, Spain and Russia.
Though in (a) to (f), there are indeed factors than can be explained bygeopolitics, they can also be cast in terms of sharing cultural traits andlanguages. It is not clear why France, and Portugal, but also Germany,
17See www.ethnologue.com.
10
Poland, Switzerland, Spain and Russia to some extent cast votes that canhardly be explained. But it is unfair to claim, as The Economist does, that“Britain is in tune with the rest of Europe, [while] France is out of kilterwith many of its European cousins.”
5 Conclusions
In the popular competition examined in our paper, there is no evidence forvote trading beyond the one that can be explained by linguistic or culturaltraits or proximities. The data that are at hand here make it possible toisolate the effect, since judges cast votes on individuals, and the rating systemis finer than the usual “yes, no, abstain” voting system. It may well be thatcultural proximities are also at work in international political bodies, such asthe European Parliament, and that what appears as vote trading is ratherthe consequence of cultural factors.
Note that the effect of vote trading, even if there is some, is small: Thelargest coefficient obtained in our equations is equal to 0.03, while the “aver-age” value of the vote cast by a country is equal to 2.6.18 Though the effect issignificantly different from zero, it disappears once account is taken of cultureand language. But even so, ratings which should be based on quality only,takes into account other factors such as linguistic and cultural proximities.
One can wonder whether tele-voting, in which every citizen in a coun-try can vote through the internet, or by telephone, will not be even moredistortive, though experts are by no means very good judges.19 Tele-votingmay also have unexpected consequences in today’s global world. An exam-ple may illustrate the issue. In 1996, Turkey won the competition, with veryhigh ratings given by those countries in which the number of Turkish im-migrants was highest, as shown by the following numbers: Germany (vote:10; Turkish population: 2 millions), France (10; 261,000), The Netherlands(12: 260,000), Austria (12; 142,000), Belgium (12; 119,000). Migrants whooften long for their home country are obviously likely to support their na-tionals, and probably more likely than the country’s nationals to take partin popular polls such as the Eurovision contest, therefore biasing the result
18(1+2+...+8+10+12)/22, where the grades appear between brackets, and 22 is theaverage number of participants in a competition.
19See for example Ginsburgh (2003).
11
in favor of their home country. It may thus probably be wise to go backfrom popular voting to expert voting, though some regressions that we ranon subsamples (before and after tele-voting was introduced) do not point tosignificant differences in voting behavior.
6 References
Bruine de Bruin, Wandi (2005), Save the last dance for me: unwanted serialposition effects in jury evaluations, Acta Psychologica 118, 245-260.
Doosje, Bertjan and Alexander Haslam (2005), What have they done for uslately? The dynamics of reciprocity in intergroup contexts, Journal of
Applied Social Psychology 35, 508-535.
Dyen, Isidore, Joseph B. Kruskal, and Paul Black (1992), An Indo-Europeanclassification: A lexicostatistical experiment, Transactions of the Amer-
ican Philosophical Society 82(5), Philadelphia: American PhilosophicalSociety.
Fenn, Daniel, Omer Suleiman, Janet Efsathiou and Neil F. Johnson (2005),How does Europe make its mind up? Connections, cliques, and com-patibility between countries in the Eurovision Song Contest, arXiv:physics/0505071 v1, 10 May.
Flores Jr., Renato and Victor Ginsburgh (1996), The Queen Elizabeth mu-sical competition: How fair is the final ranking? Journal of the Royal
Statistical Society, Series D, The Statistician 45, 97-104.
Gatherer, Derek (2004), Birth of a Meme: the Origin and Evolution ofCollusive Voting Patterns in the Eurovision Song Contest, Journal
of Memetics - Evolutionary Models of Information Transmission 8.http://jom-emit.cfpm.org/2004/vol8/gatherer d letter.html.
Gatherer, Derek (2006), Comparison of Eurovision Song Contest Simula-tion with Actual Results Reveals Shifting Patterns of Collusive VotingAlliances, Journal of Artificial Societies and Social Simulation 9.
Ginsburgh, Victor (2003), Awards, success and aesthetic quality in the arts,Journal of Economic Perspectives 17 (2003), 99-111.
12
Glejser, Herbert and Bruno Heyndels (2001), The ranking of finalists in theQueen Elisabeth International music competition, Journal of Cultural
Economics 25, 109-129.
Goldberger, Arthur, S. (1964), Econometric Theory, New York: John Wileyand Sons.
Haan, Marco, Gerhard Dijkstra and Peter Dijkstra (2005), Expert judgmentversus public opinion. Evidence from the Eurovision Song Contest,Journal of Cultural Economics 29, 59-78.
Hofstede, Geert (1980), Culture’s Consequences, Beverly Hills, California:Sage.
Hofstede, Geert (1991), Culture and Organizations, London: McGraw-Hill.
Hofstede, Geert and Michael H. Bond (1988), The Confucius connection:From cultural roots to economic growth, Organizational Dynamics 16,5-21.
Holcombe, Randall G. and Russell S. Sobel (1996), The stability of inter-national coalitions in United Nations voting from 1946 to 1973, Public
Choice 86, 17-34.
Voeten, Erik (2000), Clashes in the Assembly. International Organization
54, 185-216.
Yair, Gad (1995), ’Unite Unite Europe’ The political and cultural structuresof Europe as reflected in the Eurovision Song Contest, Social Networks
17, 147-161.
13
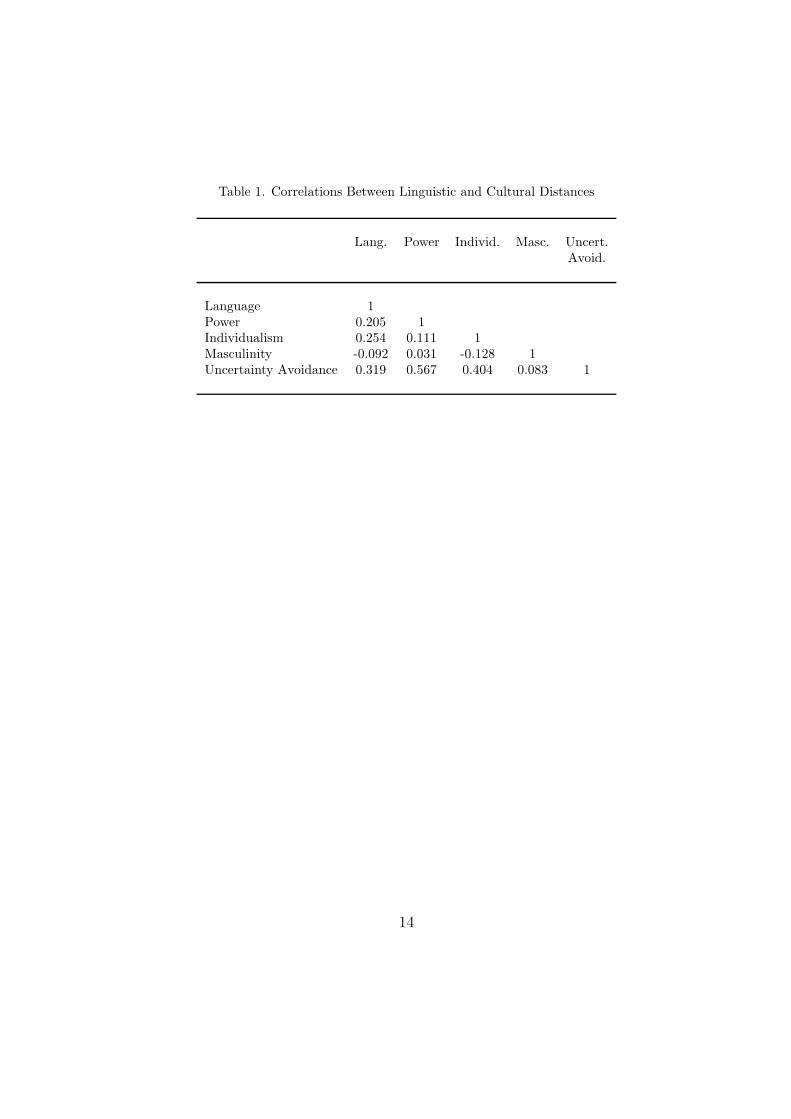
Table 1. Correlations Between Linguistic and Cultural Distances
Lang. Power Individ. Masc. Uncert.Avoid.
Language 1Power 0.205 1Individualism 0.254 0.111 1Masculinity -0.092 0.031 -0.128 1Uncertainty Avoidance 0.319 0.567 0.404 0.083 1
14
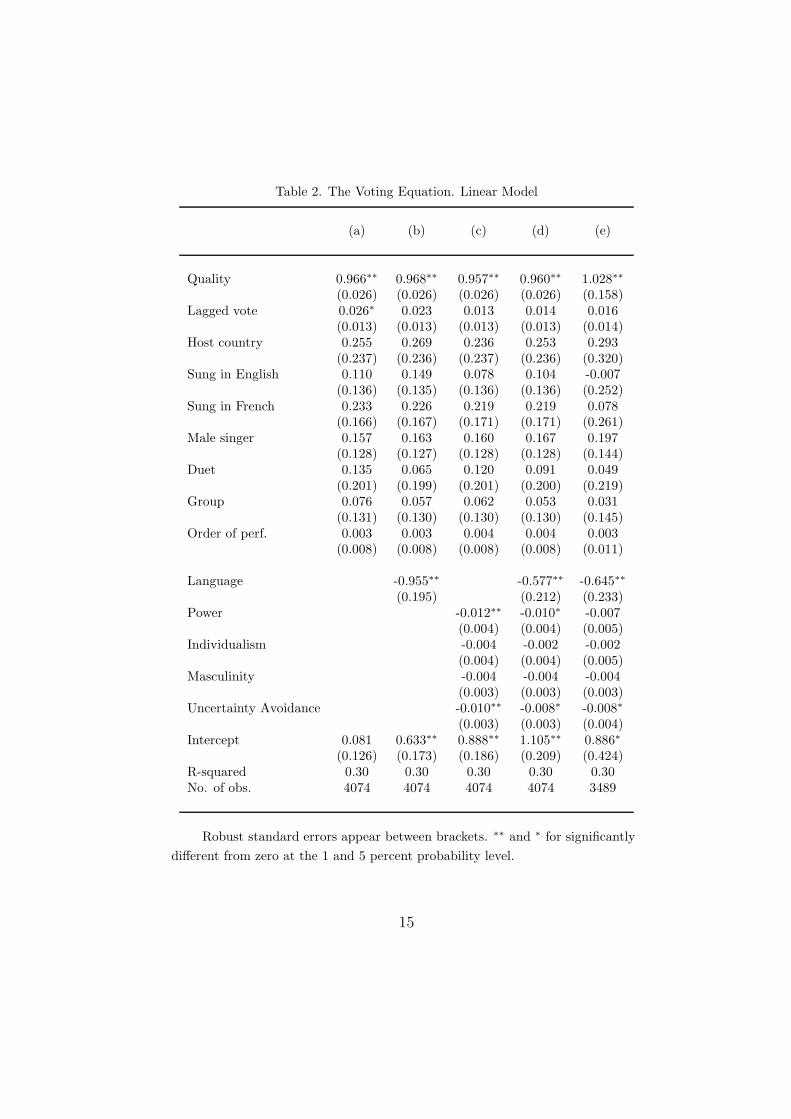
Table 2. The Voting Equation. Linear Model
(a) (b) (c) (d) (e)
Quality 0.966∗∗ 0.968∗∗ 0.957∗∗ 0.960∗∗ 1.028∗∗
(0.026) (0.026) (0.026) (0.026) (0.158)Lagged vote 0.026∗ 0.023 0.013 0.014 0.016
(0.013) (0.013) (0.013) (0.013) (0.014)Host country 0.255 0.269 0.236 0.253 0.293
(0.237) (0.236) (0.237) (0.236) (0.320)Sung in English 0.110 0.149 0.078 0.104 -0.007
(0.136) (0.135) (0.136) (0.136) (0.252)Sung in French 0.233 0.226 0.219 0.219 0.078
(0.166) (0.167) (0.171) (0.171) (0.261)Male singer 0.157 0.163 0.160 0.167 0.197
(0.128) (0.127) (0.128) (0.128) (0.144)Duet 0.135 0.065 0.120 0.091 0.049
(0.201) (0.199) (0.201) (0.200) (0.219)Group 0.076 0.057 0.062 0.053 0.031
(0.131) (0.130) (0.130) (0.130) (0.145)Order of perf. 0.003 0.003 0.004 0.004 0.003
(0.008) (0.008) (0.008) (0.008) (0.011)
Language -0.955∗∗ -0.577∗∗ -0.645∗∗
(0.195) (0.212) (0.233)Power -0.012∗∗ -0.010∗ -0.007
(0.004) (0.004) (0.005)Individualism -0.004 -0.002 -0.002
(0.004) (0.004) (0.005)Masculinity -0.004 -0.004 -0.004
(0.003) (0.003) (0.003)Uncertainty Avoidance -0.010∗∗ -0.008∗ -0.008∗
(0.003) (0.003) (0.004)Intercept 0.081 0.633∗∗ 0.888∗∗ 1.105∗∗ 0.886∗
(0.126) (0.173) (0.186) (0.209) (0.424)R-squared 0.30 0.30 0.30 0.30 0.30No. of obs. 4074 4074 4074 4074 3489
Robust standard errors appear between brackets. ∗∗ and ∗ for significantly
different from zero at the 1 and 5 percent probability level.
15
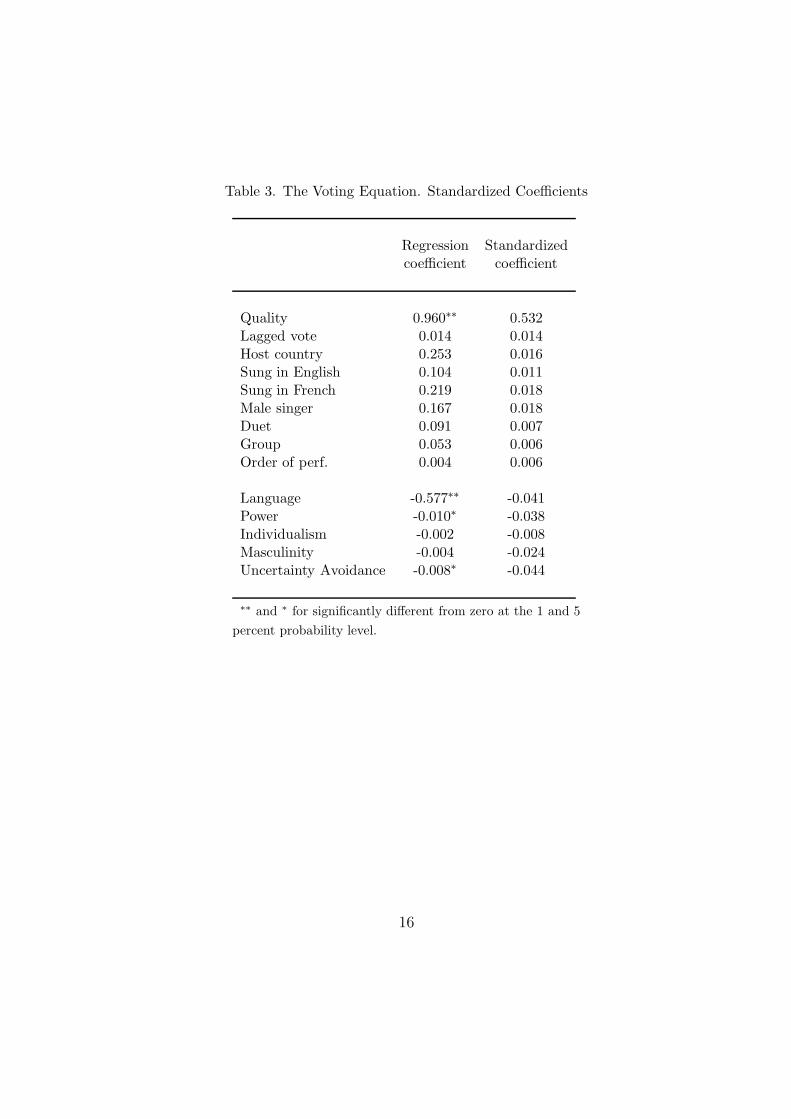
Table 3. The Voting Equation. Standardized Coefficients
Regression Standardizedcoefficient coefficient
Quality 0.960∗∗ 0.532Lagged vote 0.014 0.014Host country 0.253 0.016Sung in English 0.104 0.011Sung in French 0.219 0.018Male singer 0.167 0.018Duet 0.091 0.007Group 0.053 0.006Order of perf. 0.004 0.006
Language -0.577∗∗ -0.041Power -0.010∗ -0.038Individualism -0.002 -0.008Masculinity -0.004 -0.024Uncertainty Avoidance -0.008∗ -0.044
∗∗ and ∗ for significantly different from zero at the 1 and 5
percent probability level.
16
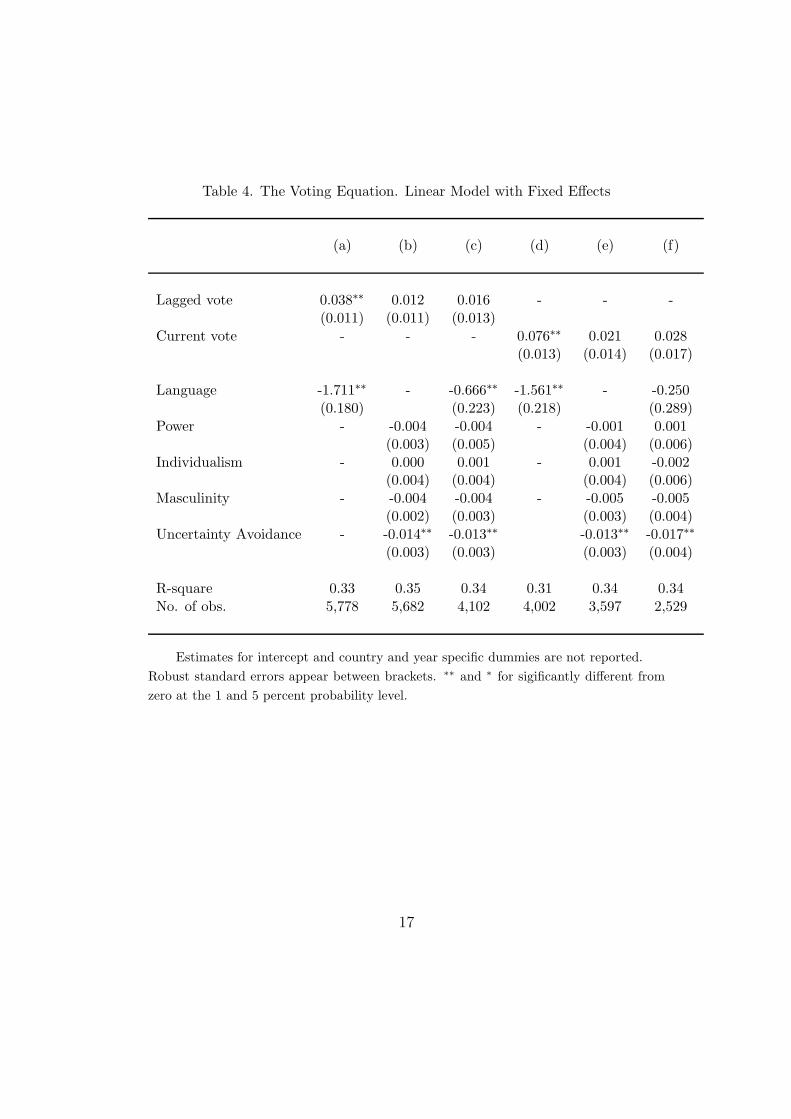
Table 4. The Voting Equation. Linear Model with Fixed Effects
(a) (b) (c) (d) (e) (f)
Lagged vote 0.038∗∗ 0.012 0.016 - - -(0.011) (0.011) (0.013)
Current vote - - - 0.076∗∗ 0.021 0.028(0.013) (0.014) (0.017)
Language -1.711∗∗ - -0.666∗∗ -1.561∗∗ - -0.250(0.180) (0.223) (0.218) (0.289)
Power - -0.004 -0.004 - -0.001 0.001(0.003) (0.005) (0.004) (0.006)
Individualism - 0.000 0.001 - 0.001 -0.002(0.004) (0.004) (0.004) (0.006)
Masculinity - -0.004 -0.004 - -0.005 -0.005(0.002) (0.003) (0.003) (0.004)
Uncertainty Avoidance - -0.014∗∗ -0.013∗∗ -0.013∗∗ -0.017∗∗
(0.003) (0.003) (0.003) (0.004)
R-square 0.33 0.35 0.34 0.31 0.34 0.34No. of obs. 5,778 5,682 4,102 4,002 3,597 2,529
Estimates for intercept and country and year specific dummies are not reported.
Robust standard errors appear between brackets. ∗∗ and ∗ for sigificantly different from
zero at the 1 and 5 percent probability level.
17
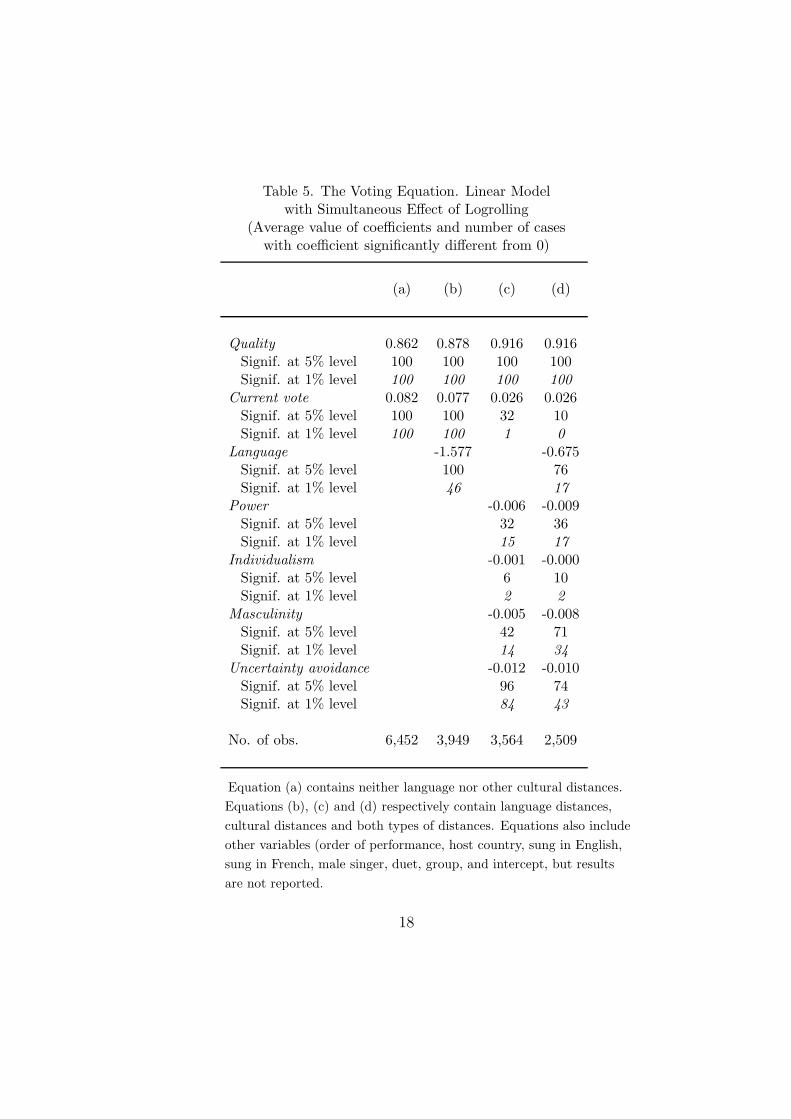
Table 5. The Voting Equation. Linear Modelwith Simultaneous Effect of Logrolling
(Average value of coefficients and number of caseswith coefficient significantly different from 0)
(a) (b) (c) (d)
Quality 0.862 0.878 0.916 0.916Signif. at 5% level 100 100 100 100Signif. at 1% level 100 100 100 100
Current vote 0.082 0.077 0.026 0.026Signif. at 5% level 100 100 32 10Signif. at 1% level 100 100 1 0
Language -1.577 -0.675Signif. at 5% level 100 76Signif. at 1% level 46 17
Power -0.006 -0.009Signif. at 5% level 32 36Signif. at 1% level 15 17
Individualism -0.001 -0.000Signif. at 5% level 6 10Signif. at 1% level 2 2
Masculinity -0.005 -0.008Signif. at 5% level 42 71Signif. at 1% level 14 34
Uncertainty avoidance -0.012 -0.010Signif. at 5% level 96 74Signif. at 1% level 84 43
No. of obs. 6,452 3,949 3,564 2,509
Equation (a) contains neither language nor other cultural distances.
Equations (b), (c) and (d) respectively contain language distances,
cultural distances and both types of distances. Equations also include
other variables (order of performance, host country, sung in English,
sung in French, male singer, duet, group, and intercept, but results
are not reported.
18
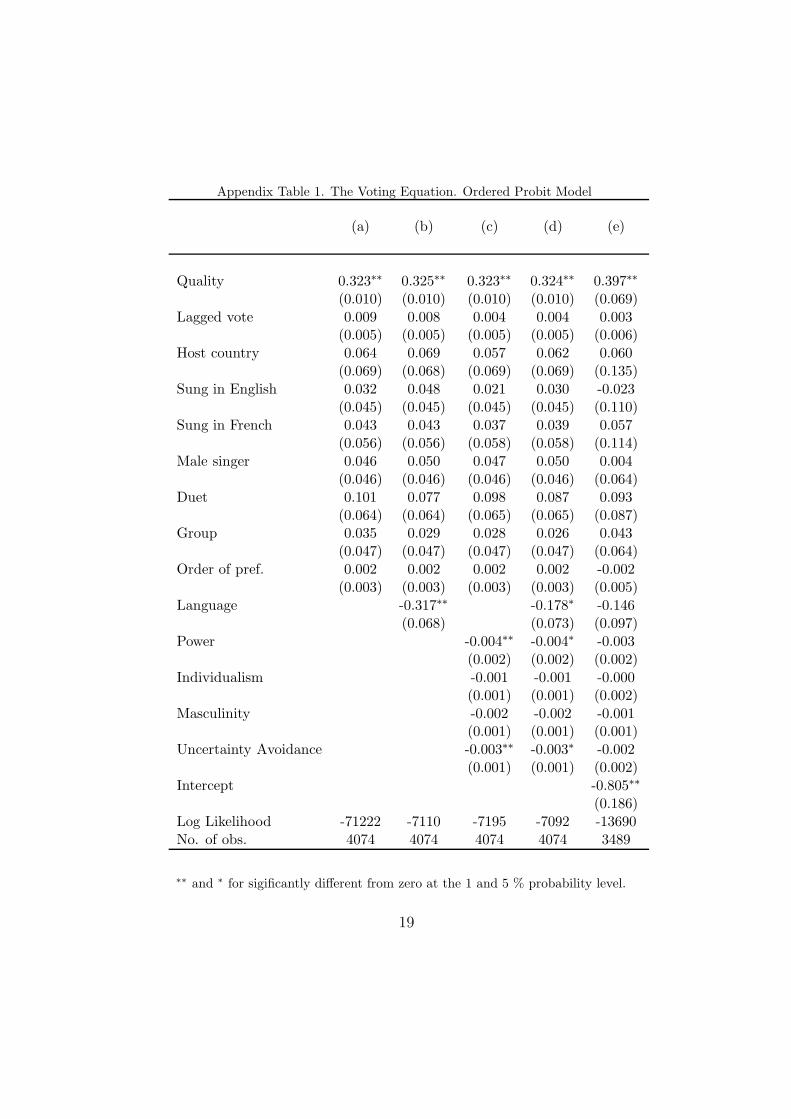
Appendix Table 1. The Voting Equation. Ordered Probit Model
(a) (b) (c) (d) (e)
Quality 0.323∗∗ 0.325∗∗ 0.323∗∗ 0.324∗∗ 0.397∗∗
(0.010) (0.010) (0.010) (0.010) (0.069)Lagged vote 0.009 0.008 0.004 0.004 0.003
(0.005) (0.005) (0.005) (0.005) (0.006)Host country 0.064 0.069 0.057 0.062 0.060
(0.069) (0.068) (0.069) (0.069) (0.135)Sung in English 0.032 0.048 0.021 0.030 -0.023
(0.045) (0.045) (0.045) (0.045) (0.110)Sung in French 0.043 0.043 0.037 0.039 0.057
(0.056) (0.056) (0.058) (0.058) (0.114)Male singer 0.046 0.050 0.047 0.050 0.004
(0.046) (0.046) (0.046) (0.046) (0.064)Duet 0.101 0.077 0.098 0.087 0.093
(0.064) (0.064) (0.065) (0.065) (0.087)Group 0.035 0.029 0.028 0.026 0.043
(0.047) (0.047) (0.047) (0.047) (0.064)Order of pref. 0.002 0.002 0.002 0.002 -0.002
(0.003) (0.003) (0.003) (0.003) (0.005)Language -0.317∗∗ -0.178∗ -0.146
(0.068) (0.073) (0.097)Power -0.004∗∗ -0.004∗ -0.003
(0.002) (0.002) (0.002)Individualism -0.001 -0.001 -0.000
(0.001) (0.001) (0.002)Masculinity -0.002 -0.002 -0.001
(0.001) (0.001) (0.001)Uncertainty Avoidance -0.003∗∗ -0.003∗ -0.002
(0.001) (0.001) (0.002)Intercept -0.805∗∗
(0.186)Log Likelihood -71222 -7110 -7195 -7092 -13690No. of obs. 4074 4074 4074 4074 3489
∗∗ and ∗ for sigificantly different from zero at the 1 and 5 % probability level.
19
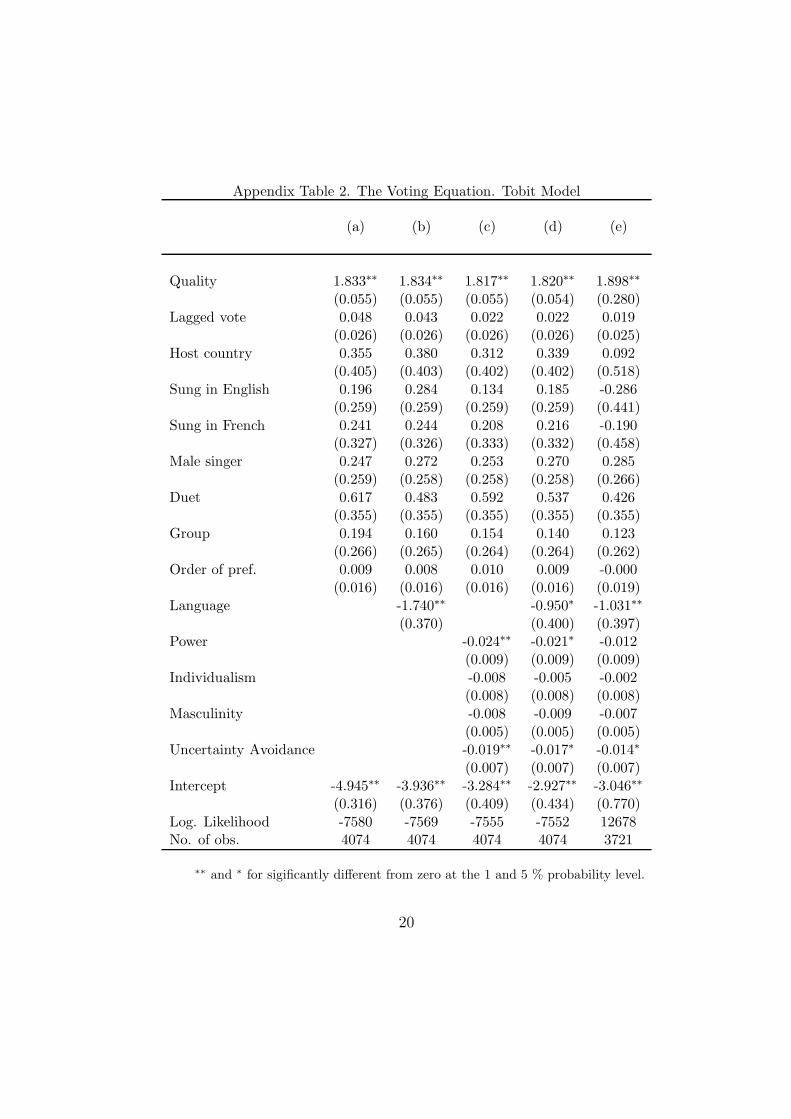
Appendix Table 2. The Voting Equation. Tobit Model
(a) (b) (c) (d) (e)
Quality 1.833∗∗ 1.834∗∗ 1.817∗∗ 1.820∗∗ 1.898∗∗
(0.055) (0.055) (0.055) (0.054) (0.280)Lagged vote 0.048 0.043 0.022 0.022 0.019
(0.026) (0.026) (0.026) (0.026) (0.025)Host country 0.355 0.380 0.312 0.339 0.092
(0.405) (0.403) (0.402) (0.402) (0.518)Sung in English 0.196 0.284 0.134 0.185 -0.286
(0.259) (0.259) (0.259) (0.259) (0.441)Sung in French 0.241 0.244 0.208 0.216 -0.190
(0.327) (0.326) (0.333) (0.332) (0.458)Male singer 0.247 0.272 0.253 0.270 0.285
(0.259) (0.258) (0.258) (0.258) (0.266)Duet 0.617 0.483 0.592 0.537 0.426
(0.355) (0.355) (0.355) (0.355) (0.355)Group 0.194 0.160 0.154 0.140 0.123
(0.266) (0.265) (0.264) (0.264) (0.262)Order of pref. 0.009 0.008 0.010 0.009 -0.000
(0.016) (0.016) (0.016) (0.016) (0.019)Language -1.740∗∗ -0.950∗ -1.031∗∗
(0.370) (0.400) (0.397)Power -0.024∗∗ -0.021∗ -0.012
(0.009) (0.009) (0.009)Individualism -0.008 -0.005 -0.002
(0.008) (0.008) (0.008)Masculinity -0.008 -0.009 -0.007
(0.005) (0.005) (0.005)Uncertainty Avoidance -0.019∗∗ -0.017∗ -0.014∗
(0.007) (0.007) (0.007)Intercept -4.945∗∗ -3.936∗∗ -3.284∗∗ -2.927∗∗ -3.046∗∗
(0.316) (0.376) (0.409) (0.434) (0.770)Log. Likelihood -7580 -7569 -7555 -7552 12678No. of obs. 4074 4074 4074 4074 3721
∗∗ and ∗ for sigificantly different from zero at the 1 and 5 % probability level.
20
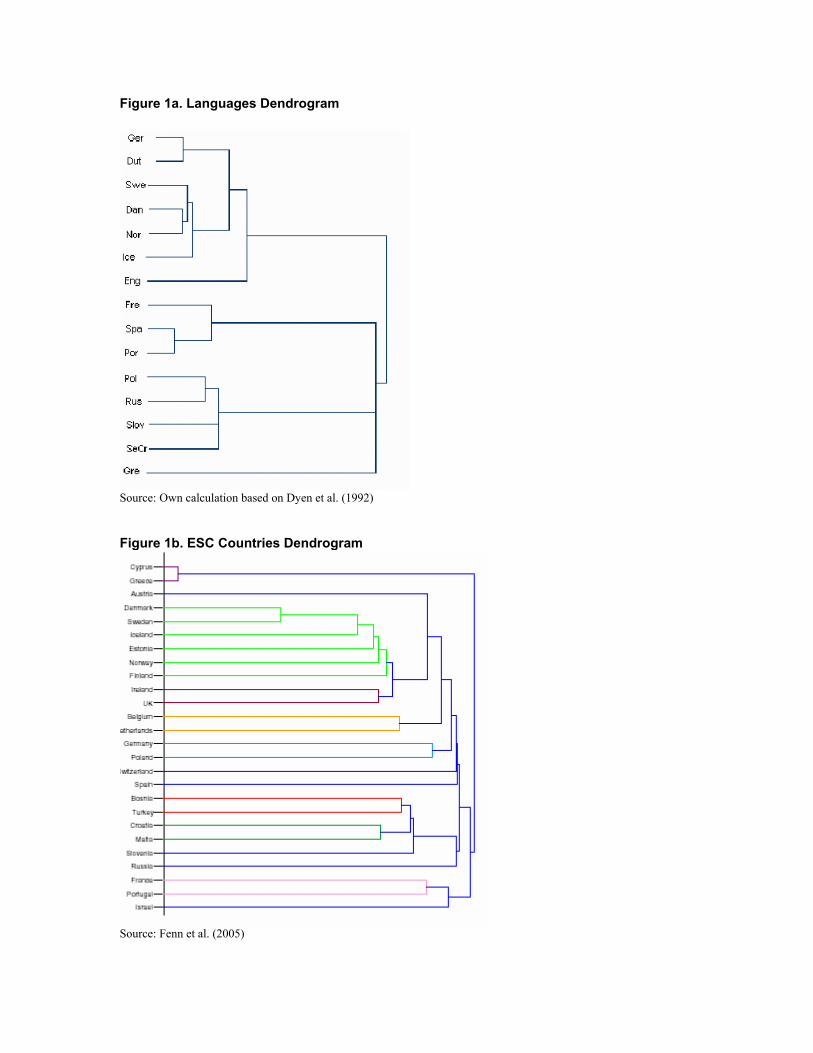
Figure 1a. Languages Dendrogram
Source: Own calculation based on Dyen et al. (1992) Figure 1b. ESC Countries Dendrogram
Source: Fenn et al. (2005)