the european origins of economic development - faculty & research
TRANSCRIPT

The European Origins of Economic Development
William Easterly and Ross Levine*
June 2012
Abstract
A large literature suggests that European settlement outside of Europe shaped institutional, educational, technological, cultural, and economic outcomes. This literature has had a serious gap: no direct measure of colonial European settlement. In this paper, we (1) construct a new database on the European share of the population during the early stages of colonization and (2) examine its impact on the level of economic development today. We find a remarkably strong impact of colonial European settlement on development. According to one illustrative exercise, 47 percent of average global development levels today are attributable to Europeans. One of our most surprising findings is the positive effect of even a small minority European population during the colonial period on per capita income today, contradicting traditional and recent views. There is some evidence for an institutional channel, but our findings are most consistent with human capital playing a central role in the way that colonial European settlement affects development today.
Keywords: Institutions; Human Capital; Political Economy; Natural Resources JEL Classification Codes: 043; 01; P48, N5
* Easterly: New York University and the NBER; Levine: University of California, Berkeley and the NBER. Steven Pennings provided superb research assistance in the final stages of this paper. The data collection project also lasted across many generations of RAs and we have received excellent research assistance and heroic data collection efforts from Alejandro Corvalan, Tomislav Ladika, Alex Levkov, Julia Schwenkenberg, Tobias Pfutze, and Liz Potamites. We also received very helpful comments from Andrei Shleifer, from our discussant Enrico Spolaore and participants in the UCLA Long Term Persistence Conference in May 2012 including Romain Wacziarg and David Weil, and seminar participants at Brown University, Harvard University, Johns Hopkins University, and Yale University.
1
1 Introduction
Countries have followed remarkably divergent paths of economic development since
European colonization. Some former colonies, such as the Congo, Ethiopia, Guinea-Bissau,
Malawi, and Tanzania, have experienced little economic development over the last few
centuries, with real per capita Gross Domestic Product (GDP) of less than $2 per day. Other
former colonies are among the richest countries in the world today, including Australia, Canada,
and the United States, all of which enjoy real per capita GDP levels of greater than $20,000 per
annum. Most former colonies fall along the spectrum between these extremes.
In seeking to explain these divergent paths, influential researchers emphasize that the
European share of the population during the early stages of colonization shaped national rates of
economic growth through several mechanisms. First, Engerman and Sokoloff (1997) (ES) and
Acemoglu, Johnson, and Robinson (2001) (AJR) stress that European colonization had enduring
effects on political institutions and hence on economic development. They argue that when
Europeans encountered national resources with lucrative international markets and did not find
the lands, climate, and disease environment suitable for large-scale settlement, only a few
Europeans tended to settle, and they would create authoritarian political institutions to extract
and exploit natural resources. The institutions created by Europeans in these “extractive
colonies” were ultimately harmful to long-run economic development. But, when Europeans
found lands, climate, and disease environments that were suitable for smaller-scale agriculture,
they tended to settle, forming “settler colonies.” In such colonies, Europeans formed institutions
more protective of political and economic rights that fostered long-run economic development.
From this perspective, a large proportion of Europeans during colonization is a precursor to
successful economic development.

2
Glaesser, La Porta, Lopez-de-Silanes, and Shleifer (2004) (GLLS) emphasize a second
mechanism, arguing that the European share of the population during colonization influenced the
rate of human capital accumulation and hence comparative economic development. They argue
that Europeans brought human capital and human capital creating institutions, which are
essential for economic growth. Since human capital disseminates slowly over generations, more
Europeans during the early stages of colonization expedited human capital accumulation across
the entire population, not just among those of European descent. Thus, the proportion of
Europeans during colonization will be positively related to human capital development and
hence overall economic development today. Moreover and critically, this view predicts that the
proportion of Europeans during colonization will matter more for current economic development
than the proportion of the population of European descent today because of the slow
dissemination of human capital.
Other researchers, either explicitly or implicitly, highlight the colonial origins of
comparative economic development. North (1990) argues that the British brought comparatively
strong political and legal institutions that were more conducive to economic development than
the institutions brought by other European nations. This view stresses the need for a sufficiently
strong European presence to instill those institutions, but does not necessarily suggest that the
proportion of Europeans during colonization will affect economic development today beyond
some initial threshold level. Spolaore and Wacziarg (2009) stress that the degree to which the
genetic heritage of a colonial population was similar to that of the economies at the technological
frontier positively affected the diffusion of technology and thus economic development, where
European migration materially affected the genetic composition of economies. Putterman and
Weil (2010) emphasize that the experience with statehood and agriculture of the ancestors of

3
people currently living within countries help explain cross-country differences in economic
success. And, Comin, Easterly, and Gong (2011) likewise find that the ancient technologies of
the ancestors of populations today help predict per capita income of those populations. In both of
these papers, the ancestral nature of a population helps account for cross-country differences in
economic development, where European colonization materially shaped the composition of
national populations. Other papers address the role of Europeans in shaping social capital, civic
capital, or democratic capital (Luigi Guiso, Paola Sapienza, Luigi Zingales, 2010, Persson,
Torsten and Guido Tabellini 2010.) Although these researchers stress alternative mechanisms
through which European colonization shaped comparative economic development, they all
emphasize that the nature of European settlements had long run consequences. Although we do
not examine the specific mechanisms underlying each theory, we do assess the broad, common
question: What was the impact of European settlement during the colonial period on economic
development today?
The purposes of this paper are (1) to construct a new database on the European share of
the population during the early stages of colonization and (2) to examine its impact on the level
of economic development today. While a considerable body of research emphasizes the role of
European colonization on subsequent rates of economic development, what has been missing in
the empirical literature is the key intermediating variable: colonial European settlement. We
believe that we are the first to explicitly measure the European share of the population during
colonization for a broad cross-section of countries and assess its impact on long-run economic
growth.
To identify the impact of the European share of the population during colonization on
economic development today, we compile data on the historical determinants of European
4
settlement to use as instrumental variables. We employ a very simple model of the cost and
benefits of European settlement to select possible instruments. Some determinants have already
been discussed in the literature, such as (1) pre-colonial population density, (2) latitude, and (3)
the disease environment facing Europeans. Pre-colonial population density raises the costs to
Europeans of obtaining and securing land for new settlers. Latitude raises the benefits of simply
transferring European technologies (such as for agriculture) to the newly settled areas. A harsh
disease environment facing Europeans obviously raises the expected costs of settlement.
To this list of common determinants of European settlement, we add one very important
new variable: indigenous mortality from European diseases. Indigenous mortality from European
diseases is a tragic natural experiment that is a very good predictor of European settlement, since
it removed or weakened indigenous resistance to Europeans invading new lands, and made
plenty of fertile land available to settlers. The phenomenon is limited to lands that had essentially
zero contact with Eurasia for thousands of years, since even a small amount of previous contact
was enough to share diseases and develop some resistance to them. For example, trans-Sahara
and trans-Indian Ocean contacts were enough to make Africa part of the Eurasian disease pool
(McNeil 1976, Karlen 1995, Oldstone 1998). Historical studies and population figures show that
only the New World (the Americas and Caribbean) and Oceania (including Australia and New
Zealand) suffered large-scale indigenous mortality due to a lack of resistance to European
diseases (McEvedy and Jones 1978). Thus, we use measures of the historical determinants of
European settlement, such as pre-colonial population density and indigenous mortality, to
identify the impact of colonial European settlement on economic development today.
We find that the European share of the population during colonization helps explain
economic development today, with effects of surprisingly large magnitudes. The proportion of

5
colonial Europeans is strongly and positively associated with current levels of economic
development after accounting for (i) British legal heritage, (ii) the percentage of years the
country has been independent since 1776, (iii) the ethnic diversity of the current population, and
(iv) current institutions. Moreover, all of these results hold when using instrumental variables for
the proportion of Europeans during colonization. The relationship between economic
development today and the proportion of Europeans during colonization does weaken when
controlling for a measure of current human capital, which is consistent with the view that human
capital was a key intermediating channel through which colonial settlement shaped current levels
of economic development.
Another important result is that the European share of the population during the early
stages of colonization is more strongly associated with economic development today than the
percentage of the population today that is of European descent. Europeans during the
colonization era seem to matter more for economic development today than Europeans today.
This finding is consistent with the view that Europeans brought growth-promoting
characteristics—such as institutions, human capital, connections with international markets, and
cultural norms—that diffused to the rest of the population over generations. This result de-
emphasizes the importance of Europeans per se and instead emphasizes the impact of what
Europeans brought to economies during colonization.
Perhaps the most novel result is that the positive marginal impact of the European share
of the population during colonization on economic development today becomes larger—not
smaller or negative—when examining only former colonies with very few European settlers. ES
and AJR stress that a small proportion of Europeans during colonization harmed development by
establishing extractive institutions, but a large settlement of Europeans spurred economic
6
development by creating egalitarian institutions. Thus, creating a small European settlement in a
region with no Europeans could actually curtail economic development by encouraging the
establishment of extractive institutions (Acemoglu and Robinson 2012). To assess these views,
we examine only economies with a small proportion of Europeans during the colonial period,
which we define as economies with less than 15 percent Europeans, including those that had
essentially zero Europeans. Even among these countries, more Europeans during colonization
are associated with greater economic development today; indeed, the estimated coefficient on the
European share of the colonial population increases in size in this subsample of countries. Thus,
the positive relationship between Europeans and economic development today is not just about
the difference between settler and extractive colonies. We do not confirm the prediction that
colonies with essentially no Europeans performed better than (or even as well as) those colonies
with a small group of Europeans.
Ample qualifications temper our conclusions. First, we do not identify a single
mechanism through which the European share of the population during colonization shaped
long-run economic development. We show that European share is strongly associated with
human capital and democratic political institutions today, but we do not trace the impact of
Europeans on human capital and political institutions over time, nor do we exclude other
potential mechanisms through which the European share of the population during colonization
might influence economic development.
Second, we do not assess the welfare implications of European settlement during
colonization; we only assess the income effect under conditions where welfare and income are
clearly not identical. Europeans often cruelly oppressed indigenous populations, as well as the
people that they brought as slaves (see Acemoglu and Robinson 2012 for compelling examples).

7
Thus, GDP per capita today cannot measure the welfare effects of European settlement; it can
only measure economic activity within a particular geographical area. Although there is no
question about European oppression, the effect of European colonization on long-run economic
development remains an open question. In this paper, we examine the relationship between
European settlement during the colonial period and economic development today to help inform
debates about the sources of the divergent paths of economic development taken by countries
around the world since the colonial period.
The remainder of the paper is organized as follows. Section 1 defines and discusses the
data, while Section 2 provides preliminary evidence on the determinants of human settlement
prior to European colonization and the factors shaping European settlement. Section 3 presents
the paper’s core results on the effect of colonial European share, considering the controls
mentioned above. Section 4 reports an exercise in development accounting to calculate what
share of global development can be attributed to Europeans. Section 5 concludes.
8
1. Data
To assess the independent impact of the European share of the population during the
early stages of colonization on the level of economic development today, we need data on (1) the
European share of the population during colonization, (2) instrumental variables for the
European share of the population to mitigate potential biases associated with measurement error
and reverse causality, (3) other exogenous determinants of economic development, so that we
can isolate the independent association between the European share of the population during
colonization and economic development, and (4) measures of economic development today.
This section describes only the two data series that we construct: (1) the European share
of the population during colonization and (2) the degree to which a region experienced large
scale indigenous mortality due to the diseases brought by European explorers in the 15th and 16th
centuries. Since the other data that we employ in our analyses are taken from readily available
sources, we define those variables when we present the analyses below.
1.1 Euro share
We compile data on the European share of the population during the early stages of
colonization (Euro share) from several sources. Since colonial administrators were concerned
about documenting the size and composition of colonial populations, there are abundant—albeit
disparate—sources of data. Of course, there was hardly anything like a modern statistical service
in colonial times, so that different administrators across different colonies in different time
periods used different and often undocumented methods for assembling population statistics.
Thus, we use a large variety of primary and secondary sources on colonial history to piece
together data on the European share of the population.

9
Although the Data Appendix provides detailed information on our sources, the years for
which we compiled data on each country, and discussions about the quality of the data, it is
worth emphasizing a few points here. First, we face the tricky issue of choosing a date to
measure European share. We would like a date as early as possible after initial European contact
to use European settlement as an initial condition affecting subsequent developments. At the
same time, we do not want to pick a date that is too early after European contact since it is only
after some process of conquest, disease control, and building of a rudimentary colonial
infrastructure that it became possible to speak of a European settlement. Given these
considerations, we try to choose a date at least a century after initial European contact, but at
least 50 years before independence, which means that for conceptual reasons we do not seek to
use a uniform date across all colonies. Given these broad objectives for choosing a date, we
must nevertheless select dates under severe data limitations. In particular, we do not have a
continuous time series for each country; rather, the data reflect dates when colonial
administrators in particular locals happened to measure or estimate populations. The Data
Appendix provides the precise dates for each country and notes that the results are robust to
using other methods for selecting a particular date for the European share of the population
during colonization.
Second, we adopt a “dog did not bark” strategy for recording zero European settlement. If
we find no historical sources documenting any European settlement in a particular colony, we
assume that there were no such settlers. This procedure runs the risk of biasing downward
European settlement. However, we believe colonial histories (which are virtually all written by
European historians) are extremely unlikely to fail to mention significant European settlements.
10
We checked and confirmed the validity of this procedure using the Acemoglu et al. (2001) data
appendix, which gives the share of Europeans in the population in 1900.
1.2 Indigenous mortality
As instruments for European share of the population during the colonial period, we use
several predetermined factors—including the degree to which Europeans brought diseases that
wiped out the indigenous population. Others have carefully documented this tragic experience,
but we believe that we are the first to use it to explain the nature of colonization and its effect on
subsequent economic development.
Although Europeans established at least a minimal level of contact with virtually all
populations in the world during the colonial period, this contact had truly devastating effects on
indigenous populations in some regions of the world but not in others. Some regions had been
completely isolated from Eurasia for thousands of years, and thus had no previous exposure or
resistance to Eurasian diseases. When Europeans then made contact with these populations—
which typically occurred during the initial stages of global European exploration and hence long
before anything resembling “European settlements,” European diseases such as smallpox and
measles spread quickly through the indigenous population, decimating the indigenous people.
For example, when the Pilgrims arrived in New England in 1620, they found the indigenous
population already very sparse because European fisherman had occasionally landed along the
coast of New England in the previous decades. Similarly, De Soto’s expedition through the
American South in 1542 spread smallpox and wiped out large numbers of indigenous people
long before British settlers arrived.

11
Thus, we construct a dummy variable, Indigenous mortality, which equals one when a
region experienced large-scale indigenous mortality due to the spread of European diseases
during the initial stages of European exploration. To identify where Europeans brought diseases
that caused widespread fatalities, we use the population data of McEvedy and Jones (1978) and
three epidemiological world histories (McNeil 1976, Karlen 1995, Oldstone 1998). Diseases had
circulated enough across Eurasia, Africa and the sub-continent, so that indigenous mortality did
not shoot up with increased exposure to European explorers, traders, and slavers during the early
stages of European colonization. The New World (Americas and Caribbean) and Oceania (the
Pacific Islands, Australia, and New Zealand) were different. When European explorers and
traders arrived, the microbes that they brought triggered extremely high mortality rates, which
accords with their previous isolation from European diseases. The evidence suggests that
mortality rates of 90 percent of the indigenous population after European contact were not
unusual. Although we originally thought in terms of a country-by-country variable for large-
scale indigenous mortality, our review of the evidence indicates little measurable variation
within the New World and Oceania. Consequently, Indigenous mortality is a simple dummy for
countries in the New World and Oceania.
The Indigenous mortality indicator has characteristics that make it a good instrument for
Euro share. History suggests that the key determinant of the indigenous mortality effects of
European’s making contact with other populations during the colonization period is the region’s
previous degree of isolation from Europe, not the extent of subsequent European settlement.
Hence, we do not believe that there is reverse causality running from European settlement to
Indigenous mortality.

12
2 Preliminaries
2.1 Where Did People Settle?
European settlers confronted a non-European world of very uneven population density.
The pre-existing density had at least two material— but opposing—effects on European
settlement. First, indigenous population density probably reflected the attractiveness of the land
for human settlement, including Europeans. Second, indigenous population density probably
reflected the potential for the indigenous people to resist European settlers. We will use the set
of variables described below to separate these two effects on European settlement during the
colonial period in the next section.
Table 1a examines the determinants of population density in 1500, drawing on a rich and
multidisciplinary literature. The dependent variable is the logarithm of population density in
1500, which we call Population density 1500 and is taken from Acemoglu et al (2002).
We examine five potential determinants of population density in 1500. First,
Biogeography is an index of the prehistoric (about 12,000 years ago) availability of storable
crops and domesticable animals, where large values signify more mammalian herbivores and
omnivores weighing greater than 45 kilograms and more storable annual or perennial wilds
grasses, which are the ancestors of staple cereals (e.g., wheat, rice, corn, and barley).1
1 Taken from Hibbs and Olsson (2004), Biogeography equals the first principal component of (a) the number of annual perennial wild grasses known to exist in the region in prehistoric times with mean kernel weight of greater than ten milligrams and (b) the number of domesticable large mammals known to exist in the region in prehistoric times with a mean weight of more than 45 kilos.
We expect
that Biogeography is positively associated with Population density 1500. Second, Latitude
measures the absolute value of the distance of the colony from the equator. Third, Malaria
ecology is an ecologically-based spatial index of the stability of malaria transmission in a region,
where larger valued signify a greater propensity for malaria transmission. The index is based on

13
jointly assessing the impact of climate and the proportion of land area infected with malaria.2
We find that population density in 1500 was greater in environments that were more
conducive to the domestication of animals and the cultivation of storable plants as measured by
Biogeography, confirming the findings in Diamond (1997). These results are robust to including
the other explanatory variables. Thus, unsurprisingly, human settlement was denser in areas
where it was easier to produce food.
We
do not have strong priors on the relationship between population density in 1500 and either
Latitude or Malaria ecology. While Latitude or Malaria ecology might influence the suitability
of a region to European settlement, it is not clear that they will shape population density before
European colonization. Fourth, Indigenous mortality is a dummy variable that equals one if the
region experienced a large drop in the indigenous population from diseases brought by
Europeans. As defined above, we constructed this variable from historical sources. Fifth, Settler
mortality equals historical deaths per annum per 1,000 European settlers (generally soldiers, or
bishops in Latin America) and is taken from AJR’s (2001) highly influential study of
comparative economic development. Though Albouy (forthcoming) has challenged the validity
of this indicator, we use Settler mortality to assess the association between European mortality
after colonization and population density prior to their arrival. Since Settler mortality occurs after
1500, we do not expect this to exert an independent, causal effect on population density in 1500.
Several other characteristics do not have a robust, independent link with population
density in 1500. Features such as the Malaria ecology and Latitude are not associated with pre-
Columbian population density in 1500. And, Settler mortality is not significantly correlated with
population density in 1500 after controlling for other characteristics of the country. This is
2 The Malaria ecology index is from Kiszewski et al (2004) and captures of the stability of malaria transmission based biological characteristics of mosquitoes such the proportion of blood meals taken from human hosts, daily survival of the mosquito, and duration of the transmission season and of extrinsic incubation.
14
consistent with the view that although characteristics like the prevalence of malaria, distance
from the equator, and the extent of European mortality might have shaped European settlement
during colonization, these characteristics did not affect the population density of former colonies
before Europeans arrived.
It is curious that Indigenous mortality, which occurred after colonization, is negatively
associated with population density in 1500. This finding indicates that areas that were isolated
from Europeans prior to colonization and hence more susceptible to European-borne diseases
had lower population density in 1500 AD. This may be related to Spolaore and Wacziarg’s
(2009) result on diffusion of technology as a function of when different branches of humanity
became separated. Populations in Oceania and the Western Hemisphere had been isolated from
the rest for a very long time, and hence they did not get either (1) the more advanced technology
originating in the Old World that would have helped support a larger population or (2) the
exposure to European diseases before colonization that would have them more resistant to
European diseases and hence to European settlement. We will see that this combination of low
density and vulnerability to European diseases plays a large role in accounting for where
Europeans settled.
15
2.2 Where Did Europeans Settle?
We now turn from the question of what shaped the settlement of humans before 1500 to
the question of what shaped the settlement of Europeans during the early stages of colonization.
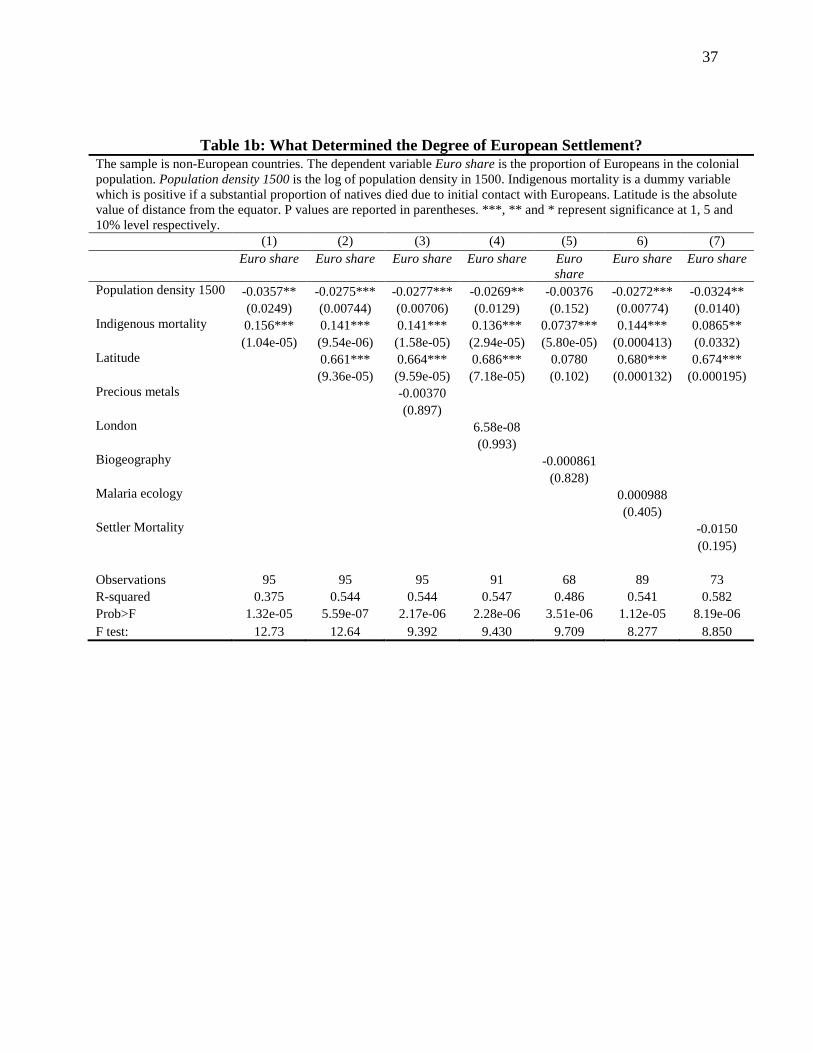
Table 1b provides regression results concerning which factors shaped European settlement
during colonization, where the dependent variable is the proportion of Europeans in the colonial
population (Euro share).
The regressors in Table 1b are as follows. First, we include Population density 1500.
Since the regressions also include other variables to control for the attractiveness of the land for
settlement, we examine the relationship between Euro share and population density in 1500
conditional on the generalized attractiveness of the land for human settlement. A plausible
interpretation of the conditional impact of Population density 1500 on Euro share is that it
gauges the ability of the indigenous population to resist European settlement. Second, Indigenous
mortality provides additional information on the inability of the indigenous population to resist
European settlers. If European diseases eliminate much of the indigenous population, this would
clearly reduce their ability to oppose European settlement. Third, Latitude might have special
relevance for European settlers, who might be especially attracted to lands with the same
temperate climate as in Europe. Fourth, Precious Metals is an indicator of whether the region has
valuable minerals since this might have affected European settlement. Fifth, one cost of settling
in a particular country might be its distance from Europe, so we use the distance from London as
a gauge (London). Finally, we examine other possible determinants of the attractiveness of the
land for settlement from Table 1a, including Biogeography, Maria ecology, and Settler
Mortality.
16
The results show that three factors account for the bulk of cross-country variation in
European settlement during the colonial period. First, the density of the indigenous population
matters. In regions with a high concentration of non-Europeans who had already occupied the
land and could supply forces of resistance, Europeans comprised a much smaller fraction of the
colonial population than in other lands. Second, indigenous mortality matters. Where the
indigenous population fell drastically because of European diseases, European settlers were more
likely to settle. Third, many of the regressions also suggest positive relationship between Euro
share and Latitude, even when conditioning on Population density 1500 and Indigenous
mortality. In general, Europeans were a larger proportion of the colonial population in higher
(temperate) latitudes, plausibly because of the similarity with the climate conditions to their
home region. However, Latitude does not enter significantly when also controlling for
Biogeography.
None of the other possible determinants are significant after controlling for these three
determinants. The differences between 1a and 1b are important, because they might affect the
plausibility of the exclusion restrictions below when we use Population density 1500 and
Indigenous mortality as instruments for European settlement. European colonial settlement,
unlike pre-Columbian population, was NOT driven by the intrinsic, long-run potential of the
land—as measured especially by Biogeography.
Three factors, Population density 1500, Indigenous mortality, and Latitude help explain
in a simple way the big picture associated with European settlements, or the lack thereof, in
regions around the world. Where all three factors were favorable for European settlement, such
as Australia, Canada, New Zealand, and the United States, the European share of the colonial
population was very high. When only some of the three factors were favorable, there tended to
17
be a minority share of European settlers. Latin America suffered large-scale indigenous
mortality, but only some regions were temperate, and most regions had relatively high pre-
Columbian population density (which is why more people of indigenous origin survived in Latin
America compared to North America, even though both regions experience high indigenous
mortality rates when exposed to European diseases). Southern Africa was temperate and had
low population density, but did not experience large-scale indigenous mortality. These factors
can also explain where Europeans did not settle. The rest of sub-Saharan Africa was tropical and
again did not experience much indigenous mortality from exposure to the microbes brought by
Europeans during colonization. And, most of Asia had high population density, did not suffer
much indigenous mortality from European borne diseases, and is in or near the tropics, all of
which combine to explain the low values of Euro share across much of Asia.
One of the most famous variables in the literature on explaining European settlement is
the Settler mortality measure calculated by AJR. Our collection of actual data on colonial
settlement allows this explanatory value to be tested for the first time. This variable does have a
significant simple correlation with European settlement, confirming the prediction in AJR. But,
when entered with the three variables that we found most robust in other specifications, the
settler mortality variable becomes insignificant and does not materially alter the statistical
significance of the other variables (though it does reduce the magnitude of their estimate
coefficients). Apparently, Settler mortality does not exert an independent effect on Euro share,
but Indigenous mortality does.
18
3 Results: Do Europeans Matter?
3.1 Do Europeans Matter? Introductory thoughts
We begin by assessing the relationship between Euro share and the current level of
economic development as measured by the average of the log of real per capita GDP over the
decade from 1995 to 2005 (Current income). Using data averaged over a decade reduces the
influences of business cycle fluctuations on our measure of current economic development. We
condition on a range of national characteristics to assess the independent relationship between
Current income and Euro share. Controlling for an array of other potential determinants of
economic development also provides some suggestive evidence on the channels linking Euro
share and Current income.
We consider the following cross-country regression:
Current income = α*Euro share + β′X + u, (1)
where X is a matrix of national characteristics that we define below, and u is an error term,
potentially reflecting economic growth factors that are idiosyncratic to particular countries, as
well as omitted variables, and mis-specification of the functional form. Different theories
provide distinct predictions about (a) the coefficient on Euro share (α), (b) whether α changes
when conditioning on particular national characteristics, and (c) how α changes across sub-
samples of countries.
We get some insight into the channels connecting Euro share and Current income by
examining how α changes when controlling for the different potential channels discussed above:
political institutions and human capital. Thus, if Euro share is related to current levels of
economic development through its effect on the formation of enduring political institutions, then
Euro share will not enjoy an independent relationship with economic development today when
19
controlling for political institutions. And, if Euro share is related to economic development
today through its effect on the spread of human capital, then Euro share will not enter
significantly when controlling for educational attainment today. We examine these issues below.
3.2 Do Europeans Matter? OLS Results
We begin by evaluating equation (1) while conditioning on an array of national
characteristics (X). Legal origin is dummy variable that equals one if the country has a common
law (British) legal tradition. This dummy variable both captures the argument by North (1990)
that the United Kingdom instilled better growth-promoting institutions than other European
powers and the view advanced by La Porta et al (2008) that the British legal tradition was more
conducive to the development of growth-enhancing financial systems than other legal origins,
such as the Napoleonic Code passed on by French and other European colonizers. Education
equals the average gross rate of secondary school enrollment from 1995 to 2005 and is taken
from the World Development Indicators. Independence equals the fraction of years since 1776
that a country has been independent. As in Beck, Demirguc-Kunt, and Levine (2003) and
Easterly and Levine (2003), we use this to measure the degree to which a country has had the
time to develop its own economic institutions. Government quality is an index of current level of
government accountability and effectiveness and is taken from Kaufman et at (2002). Ethnicity is
from Easterly and Levine (1997) and measures each country’s degree of ethnic diversity. In
particular, it measures the probability that two randomly selected individuals from a country are
from different ethnolinguistic groups. Finally, as defined above, Settler mortality measures the
degree to which European mortality during the colonial period. Since the purpose of our research

20
is to examine the impact of European settlement outside of Europe, all of the regressions exclude
European countries.
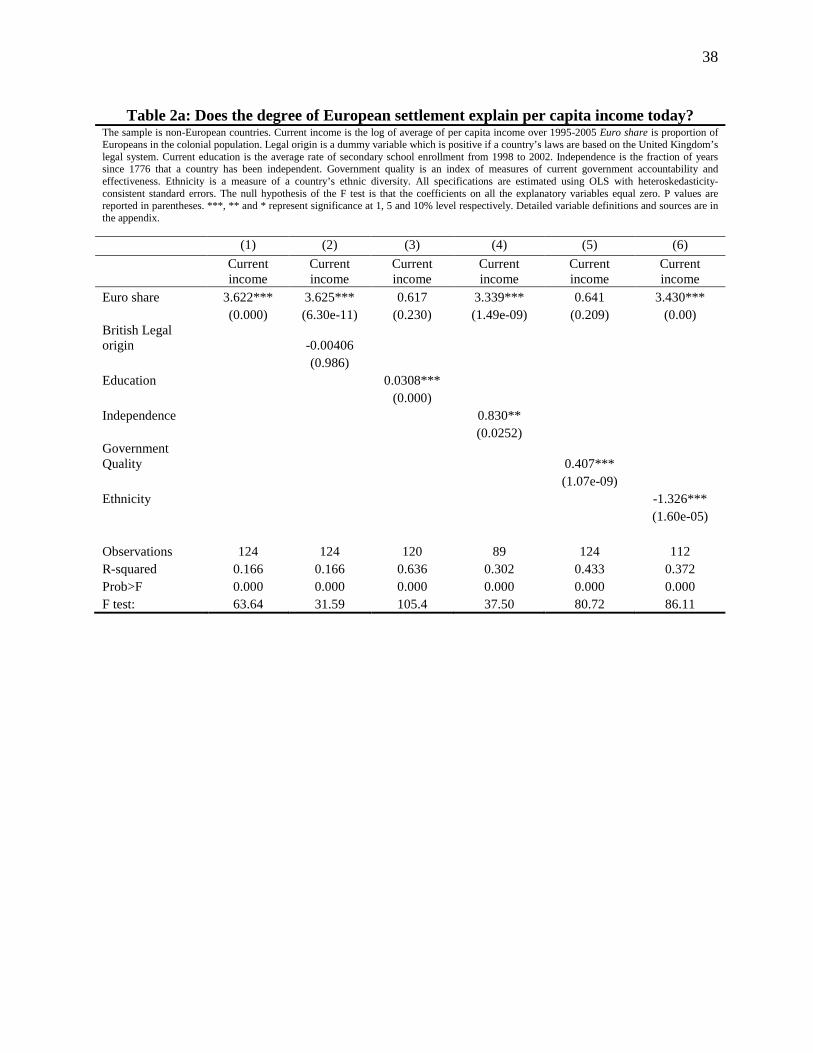
Using ordinary least squares (OLS), Table 2a shows that there is—with a few notable
exceptions—a positive, significant relation between Current income and Euro share. For
example, regression (1) indicates that an increase in Euro share of 0.1 (where the mean value of
Euro share is 0.07 and the standard deviation is 0.07) is associated with an increase in Current
income of 0.36 (where the mean value of Current income is 8.2 and the standard deviation is
1.3). The strong positive link between the European share of the population during colonization
and current economic development holds when conditioning on different national characteristics,
with two key exceptions. The coefficient on Euro share falls drastically and becomes
insignificant when conditioning on either Government quality or Education. These findings are
consistent with—though by no means a definitive demonstration of—the views that the share of
Europeans in the population during colonization shaped long-run economic development by
affecting political institutions and human capital accumulation.
These results could be driven by a few former colonies in which Europeans were a large
fraction of the population during the early stages of economic development and that just happen
to be well-developed former colonies today. Thus, we conduct the analyses for a sample of
countries in which Euro share was less than 15 percent.3
3 We also considering entering Euro Share in a quadratic function, in a spline regression, or in some other nonlinear function. However, these functional forms do not lend themselves to the IV techniques we will use in the next section, so we chose instead to stick with the procedure of a restricted sample in which Euro Share was less than .15.
The goal of restricting the sample to
only those countries where Europeans account for a small proportion of the population is to
assess whether the relation between Euro share and Current income holds when there is only a
small minority of Europeans. While there is no formal definition of what constitutes a “minority
21
European colony,” we use less than 15 percent European as a conservative benchmark of a non-
settler colony.
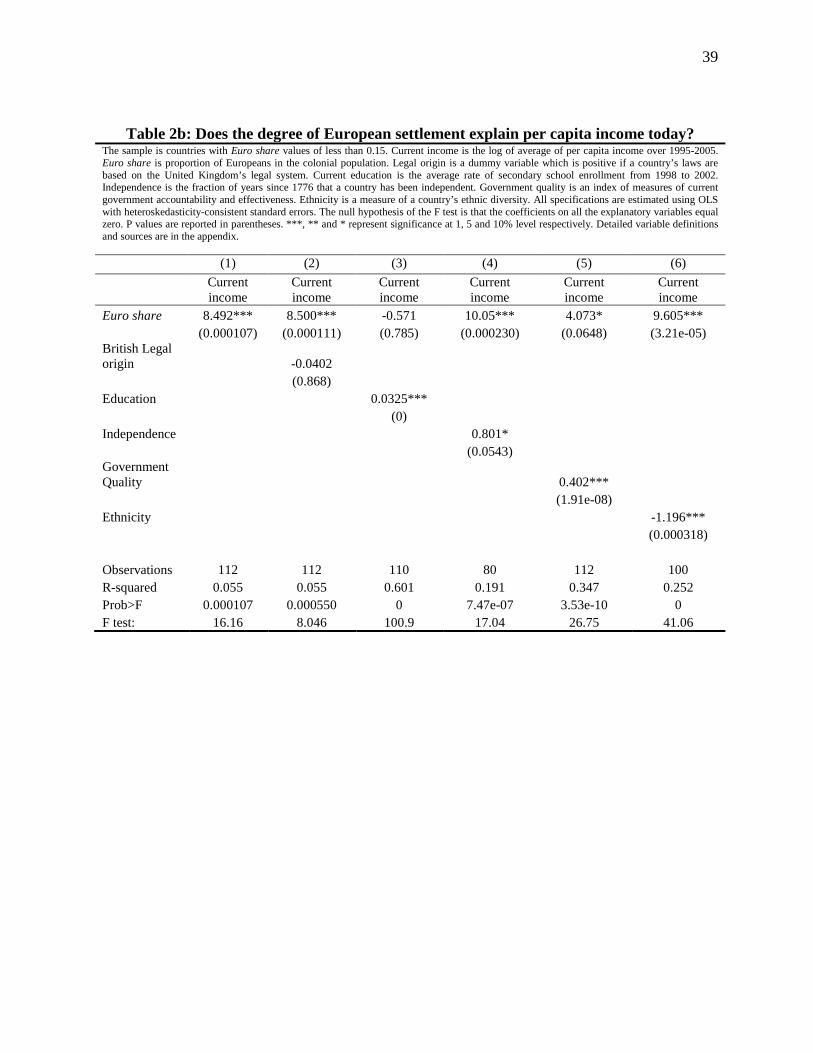
As shown in Table 2b, however, the coefficient on Euro share actually becomes larger
when restricting the sample to those countries in which Euro share is less than 15 percent. The
increase in the coefficient on Euro share when restricting the sample to former colonies with
small values of Euro share suggests that the relationship between the European share of the
population during colonization and the level of economic development does not simply represent
the economic success of “settler colonies.” Rather, a marginal increase in Euro share has a
bigger effect on subsequent economic development in colonies with only a few Europeans—
there seems to be diminishing marginal long-run development product to Euro share. A marginal
increase in Euro share is associated with an especially large boost to long-run economic growth
in former colonies with only a small share of Europeans.
The relationship between Current income and Euro share is sensitive to controlling for
political institutions and especially to controlling for human capital accumulation. As shown in
Table 2b, the size of the economic association between Current income and Euro share shrinks
and becomes insignificant when conditioning on educational attainment (regression 3), and the
association between Current income and Euro share shrinks though remains significant at the 10
percent level when conditioning on political institutions (regression 5).
The coefficient on British legal origin is never significant (nor will it be in the rest of the
paper). It is also of interest that many of the colonies with Euro Share < .15 were Spanish
colonies. Hence we find no evidence for the popular view that British colonization or legal origin
led to more development than Spanish colonization or legal origin.
22
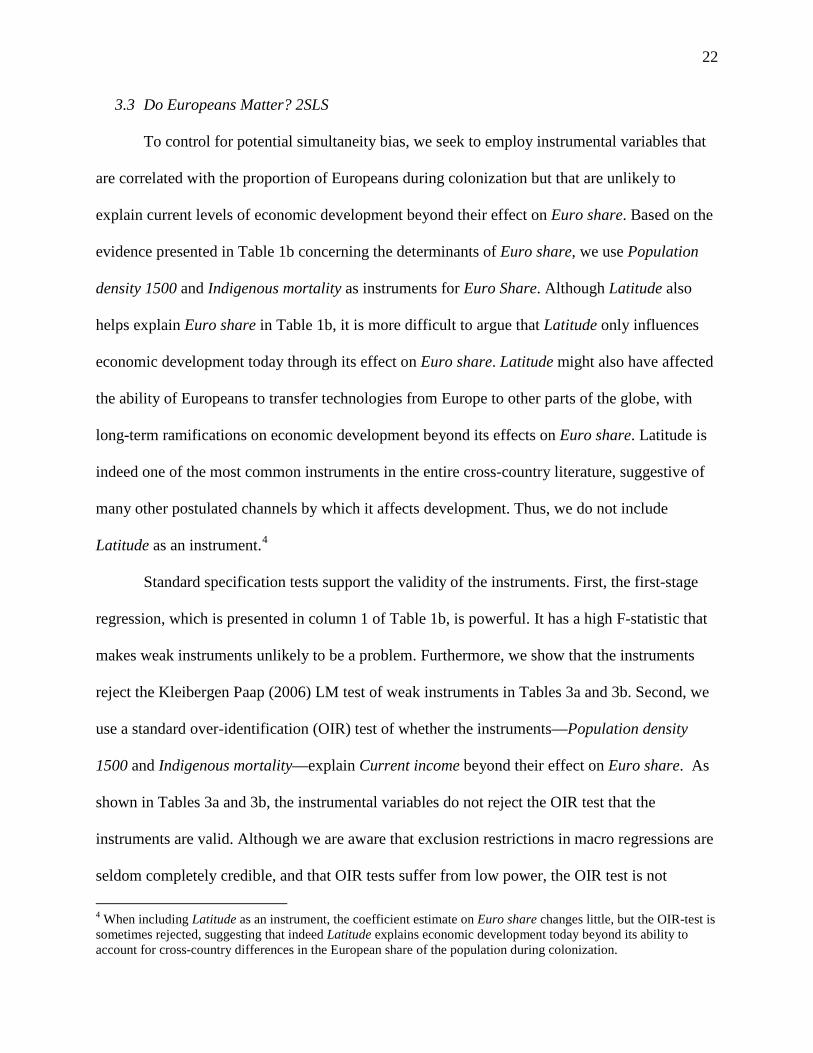
3.3 Do Europeans Matter? 2SLS
To control for potential simultaneity bias, we seek to employ instrumental variables that
are correlated with the proportion of Europeans during colonization but that are unlikely to
explain current levels of economic development beyond their effect on Euro share. Based on the
evidence presented in Table 1b concerning the determinants of Euro share, we use Population
density 1500 and Indigenous mortality as instruments for Euro Share. Although Latitude also
helps explain Euro share in Table 1b, it is more difficult to argue that Latitude only influences
economic development today through its effect on Euro share. Latitude might also have affected
the ability of Europeans to transfer technologies from Europe to other parts of the globe, with
long-term ramifications on economic development beyond its effects on Euro share. Latitude is
indeed one of the most common instruments in the entire cross-country literature, suggestive of
many other postulated channels by which it affects development. Thus, we do not include
Latitude as an instrument.4
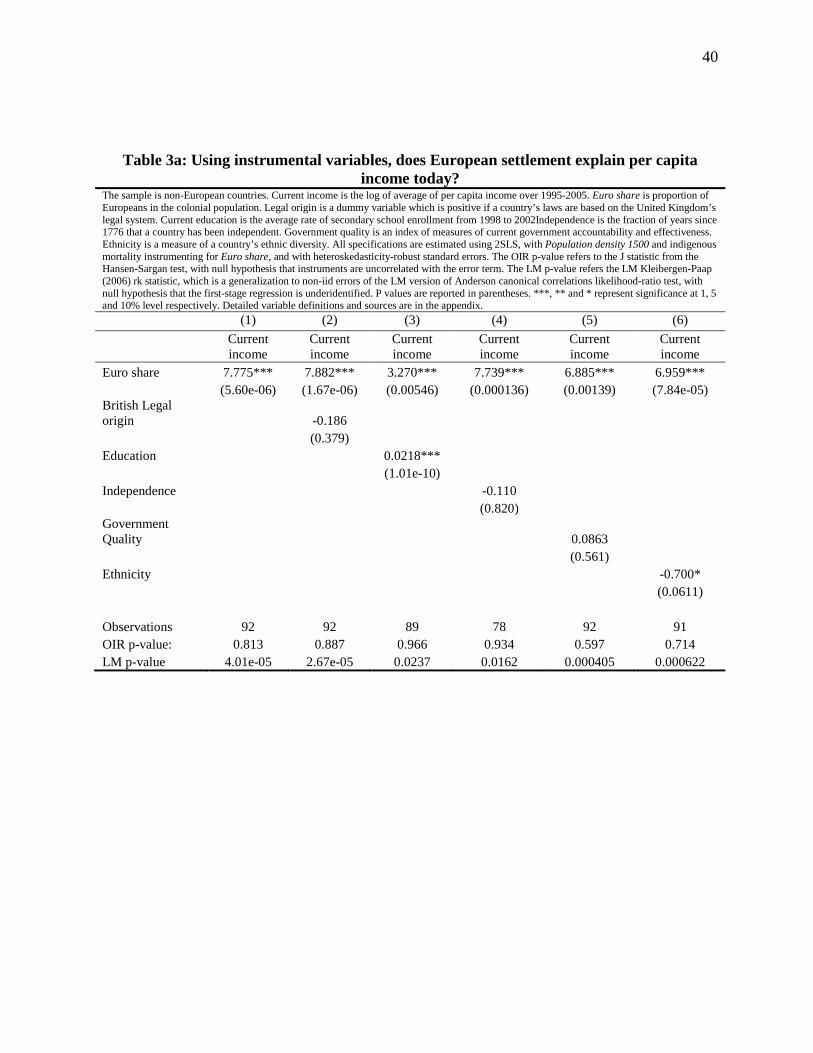
Standard specification tests support the validity of the instruments. First, the first-stage
regression, which is presented in column 1 of Table 1b, is powerful. It has a high F-statistic that
makes weak instruments unlikely to be a problem. Furthermore, we show that the instruments
reject the Kleibergen Paap (2006) LM test of weak instruments in Tables 3a and 3b. Second, we
use a standard over-identification (OIR) test of whether the instruments—Population density
1500 and Indigenous mortality—explain Current income beyond their effect on Euro share. As
shown in Tables 3a and 3b, the instrumental variables do not reject the OIR test that the
instruments are valid. Although we are aware that exclusion restrictions in macro regressions are
seldom completely credible, and that OIR tests suffer from low power, the OIR test is not
4 When including Latitude as an instrument, the coefficient estimate on Euro share changes little, but the OIR-test is sometimes rejected, suggesting that indeed Latitude explains economic development today beyond its ability to account for cross-country differences in the European share of the population during colonization.
23
rejected and there are sound conceptual reasons for using Population density 1500 and
Indigenous mortality as excluded instruments.
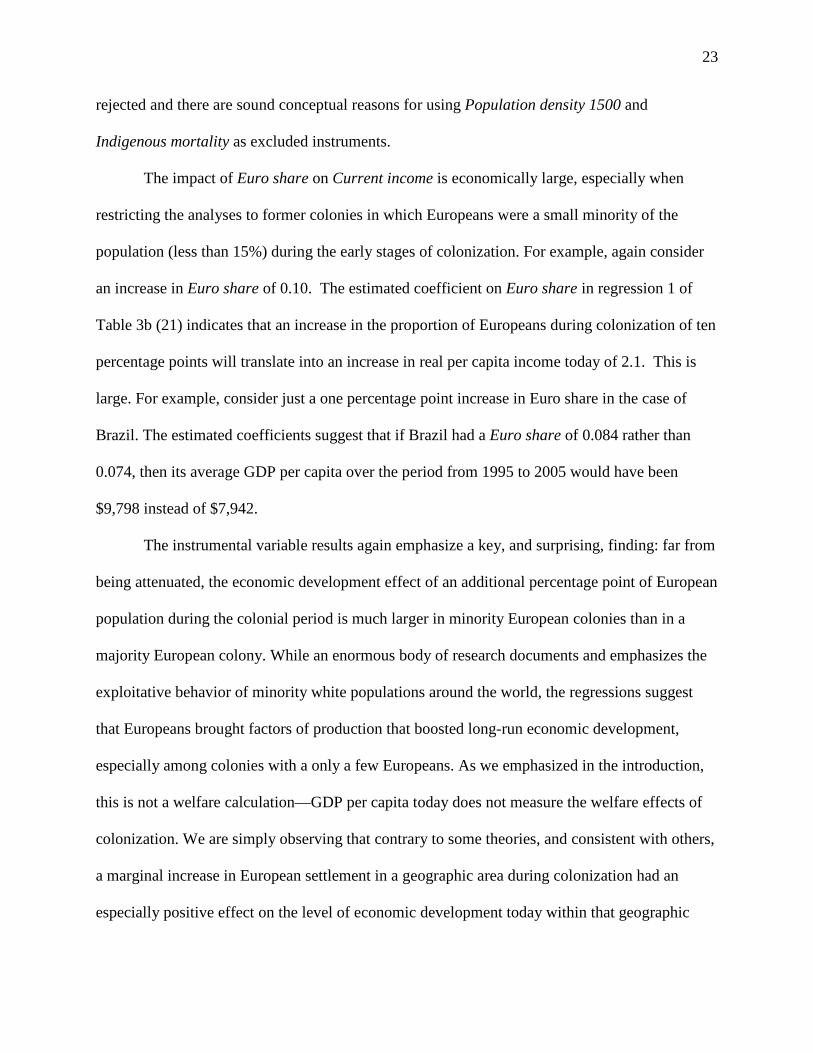
The impact of Euro share on Current income is economically large, especially when
restricting the analyses to former colonies in which Europeans were a small minority of the
population (less than 15%) during the early stages of colonization. For example, again consider
an increase in Euro share of 0.10. The estimated coefficient on Euro share in regression 1 of
Table 3b (21) indicates that an increase in the proportion of Europeans during colonization of ten
percentage points will translate into an increase in real per capita income today of 2.1. This is
large. For example, consider just a one percentage point increase in Euro share in the case of
Brazil. The estimated coefficients suggest that if Brazil had a Euro share of 0.084 rather than
0.074, then its average GDP per capita over the period from 1995 to 2005 would have been
$9,798 instead of $7,942.
The instrumental variable results again emphasize a key, and surprising, finding: far from
being attenuated, the economic development effect of an additional percentage point of European
population during the colonial period is much larger in minority European colonies than in a
majority European colony. While an enormous body of research documents and emphasizes the
exploitative behavior of minority white populations around the world, the regressions suggest
that Europeans brought factors of production that boosted long-run economic development,
especially among colonies with a only a few Europeans. As we emphasized in the introduction,
this is not a welfare calculation—GDP per capita today does not measure the welfare effects of
colonization. We are simply observing that contrary to some theories, and consistent with others,
a marginal increase in European settlement in a geographic area during colonization had an
especially positive effect on the level of economic development today within that geographic

24
region, especially in places that had only a small, minority of Europeans living in the area during
colonization.
The relationship between Current income and Euro share weakens appreciably when
conditioning on Education and weakens slightly when controlling for Government quality,
especially when focusing on the sample of countries with less than 15 percent Euro share. In
Table 3b, the estimated coefficient on the exogenous component of Euro share drops by about
two-thirds and become significant at only the 10 percent level when controlling for Education,
suggesting that the relation between Euro share and Current income is not independent of its
association with Education. The relationship between Current income and Euro share also
changes when conditioning on Government quality. In Table 3b, controlling for Government
quality reduces the size of the estimated coefficient on Euro share by about one-third, although it
remains significant at the one percent level.
This is suggestive again that the human capital and institutional channels are important
for the effect of colonial European settlement on development today, with stronger evidence for
the human capital channel. Of course, we do not control for the potential endogenous
determination of education and political institutions (an important but inescapable caveat given
the usual inability to develop a full identification strategy covering three endogenous regressors).
And, so we simply provide these analyses as suggestive of the potential channels, without nailing
them down empirically—a nontrivial task left for future research.
Overall, the IV findings are suggestive of a causal impact of colonial European settlement
on per capita income today. We are of course aware of the many plausible criticisms of the
internal validity of causal effects in cross-country macro regressions. The OLS results would still
remain of considerable interest in establishing a robust correlation between European settlement

25
a long time ago and outcomes today. Along with a wide array of recent research, our results
indicate that historical factors play an enduring role in shaping economic development.
3.4 Is it Europeans during Colonization or Europeans today?
Euro share might proxy for the proportion of the current population that is of European
descent. Figure 1 shows there is indeed a positive association between colonial Euro share and
European share in modern times (measured in 2000 from Putterman and Weil 2010).
Consequently, it may be inappropriate to interpret the results on Euro share as reflecting the
enduring impact of Europeans during the colonization period on economic development. Rather,
Europeans might have simply migrated to economically successful countries after colonization.
To assess the strength of the independent relationship between the level of economic
development today and the European share of the population during the early stages of the
colonial, we therefore control for the proportion of the population today that is of European
descent (Tables 4a and 4b). We would like to use instrumental variables for both Euro share and
the fraction of the population today that is of European descent and therefore separately identify
the impact of each on Current income. But, we faced a weak instruments problem: we could not
find instrumental variables that separately explained Euro share and the current European share
of the population, while also satisfying the exclusion restriction. Since the standard errors of the
IV regressions are not reported correctly with a weak instruments problem, we do not report
them. Instead, we use OLS regressions to produce suggestive partial correlations between
Current income and Euro share while controlling for the proportion of Europeans today (Euro
2000 P-W) and other explanatory variables.
26
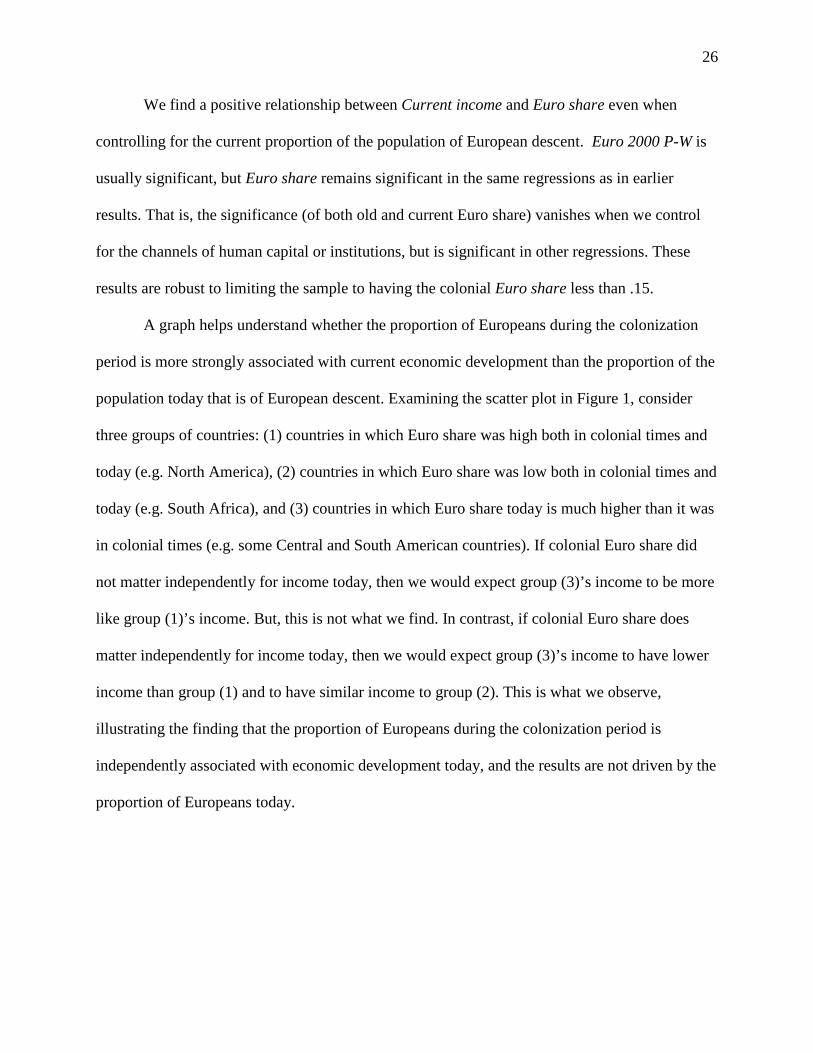
We find a positive relationship between Current income and Euro share even when
controlling for the current proportion of the population of European descent. Euro 2000 P-W is
usually significant, but Euro share remains significant in the same regressions as in earlier
results. That is, the significance (of both old and current Euro share) vanishes when we control
for the channels of human capital or institutions, but is significant in other regressions. These
results are robust to limiting the sample to having the colonial Euro share less than .15.
A graph helps understand whether the proportion of Europeans during the colonization
period is more strongly associated with current economic development than the proportion of the
population today that is of European descent. Examining the scatter plot in Figure 1, consider
three groups of countries: (1) countries in which Euro share was high both in colonial times and
today (e.g. North America), (2) countries in which Euro share was low both in colonial times and
today (e.g. South Africa), and (3) countries in which Euro share today is much higher than it was
in colonial times (e.g. some Central and South American countries). If colonial Euro share did
not matter independently for income today, then we would expect group (3)’s income to be more
like group (1)’s income. But, this is not what we find. In contrast, if colonial Euro share does
matter independently for income today, then we would expect group (3)’s income to have lower
income than group (1) and to have similar income to group (2). This is what we observe,
illustrating the finding that the proportion of Europeans during the colonization period is
independently associated with economic development today, and the results are not driven by the
proportion of Europeans today.

27
4. How much development is attributable to Europeans?
In this section, we do some global development accounting to illustrate how much of
development might be associated with European settlers. This exercise uses the estimated
equation for Euro share with no controls
(1) iii EuroShareomeCurrentInc εβα ++=)ln( Next, define the counterfactual CurrentIncomeCF for every country outside of Europe by removing the European effect: (2) iEuroShare
iCFi eomeCurrentIncomeCurrentInc ⋅−⋅= β
Of course, CurrentIncomei=CurrentIncomeCF
i for any country i where Eurosharei=0.
The counterfactual population-weighted global mean is then simply the weighted mean
across all non-European countries of CurrentIncomeCFi , where Pi is population in country i, and
P is total global population (we have data on 139 non-European countries).
(3) CFi
i
iCF omeCurrentIncPPy ∑
=~
The global population-weighted per capita income iy is
(4) i
i
i yPP∑
=y
ii
i omeCurrentIncPPy ∑
=~
The share of development attributed to European settlement is then
−=
yyys
CF
e ~~~
As an illustrative exercise, we use regression (1) of Table 3a, which is the simplest
instrumental variable regression. It includes all countries outside of Europe. The coefficient
estimate is β = 7.8.
Using the 2000 population weights, the data and estimated coefficients indicate that 47%
of the development outside of Europe is attributed to the share of European settlers during the

28
early stages of colonization
−yyy CF
~~~
. We repeat our frequent caveat that global per capita
income is not a welfare measure, especially in light of the history of European exploitation of
non-Europeans. As an exercise in positive analysis, however, it is striking how much of global
development is associated with Europeans (not even considering the development of Europe
itself).
5. Conclusions
The results are consistent with the view that the proportion of Europeans during the early
stages of colonization exerted an enduring, positive impact on economic development. These
findings hold when (1) restricting the sample to non-settler colonies, (2) conditioning on the
current proportion of the population of European descent, and (3) using instrumental variables to
extract the exogenous component of Euro share.
These results relate to theories of the origins of the divergent paths of economic
development followed since Europeans colonization. Engerman and Sokoloff (ES) (1997)
emphasize that agricultural, mineral, the size and robustness of the indigenous population, and
other endowments encountered by Europeans affected the formation of institutions, including
political institutions, with long-run effects on economic development. ES emphasize that the
degree of European settlement reflects these endowments, but Europeans per se are not a causal,
independent explanation of the divergent paths of economic development since colonization. In
the findings presented above, however, the proportion of Europeans during the early colonial
period had a lasting effect beyond endowments and political institutions—Europeans brought
factors that fostered long-run economic development. ES also suggested a negative effect of
minority European settlement, but we find no evidence of this. We find the positive effect of
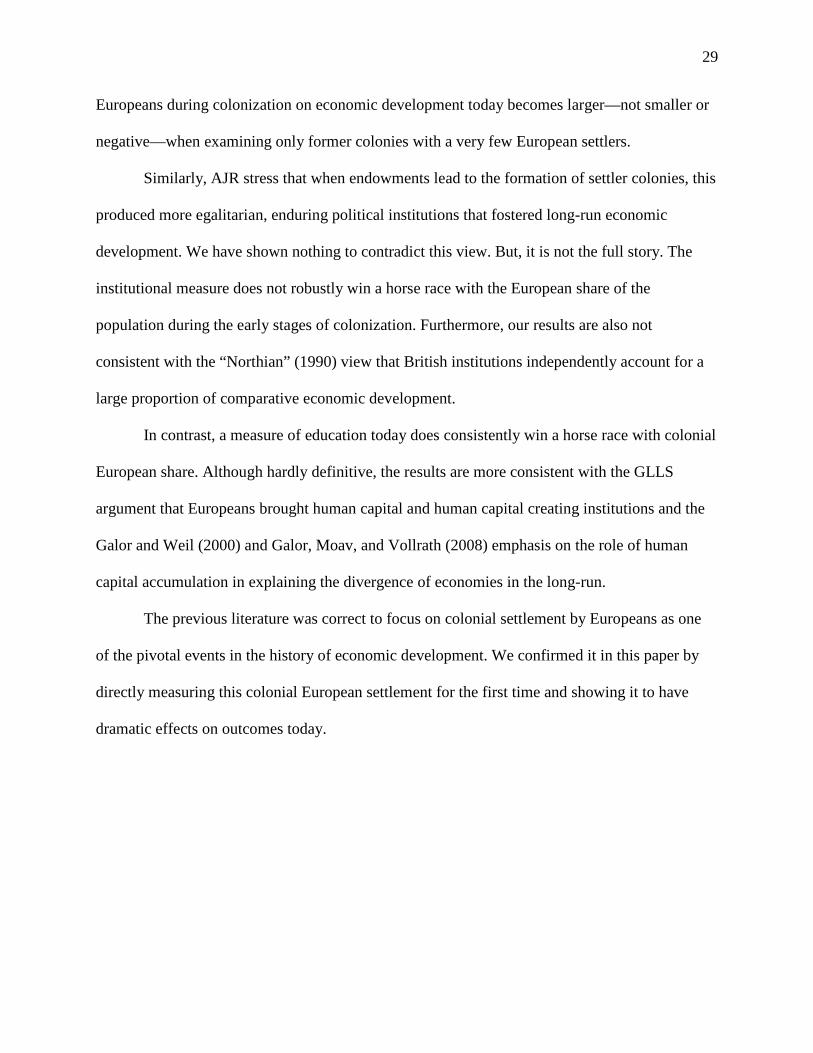
29
Europeans during colonization on economic development today becomes larger—not smaller or
negative—when examining only former colonies with a very few European settlers.
Similarly, AJR stress that when endowments lead to the formation of settler colonies, this
produced more egalitarian, enduring political institutions that fostered long-run economic
development. We have shown nothing to contradict this view. But, it is not the full story. The
institutional measure does not robustly win a horse race with the European share of the
population during the early stages of colonization. Furthermore, our results are also not
consistent with the “Northian” (1990) view that British institutions independently account for a
large proportion of comparative economic development.
In contrast, a measure of education today does consistently win a horse race with colonial
European share. Although hardly definitive, the results are more consistent with the GLLS
argument that Europeans brought human capital and human capital creating institutions and the
Galor and Weil (2000) and Galor, Moav, and Vollrath (2008) emphasis on the role of human
capital accumulation in explaining the divergence of economies in the long-run.
The previous literature was correct to focus on colonial settlement by Europeans as one
of the pivotal events in the history of economic development. We confirmed it in this paper by
directly measuring this colonial European settlement for the first time and showing it to have
dramatic effects on outcomes today.
30
Bibliography
Acemoglu, D., S. Johnson and J. Robinson (2001), “The Colonial Origins of Comparative Development: An Empirical Investigation,” American Economic Review, 91 (5): 1369-1401.
Acemoglu, D., S. Johnson and J. Robinson (2002), “Reversal of Fortune: Geography and
Institutions in the Making of the Modern World Income Distribution”, Quarterly Journal of Economics 117(4): 1231-1294
Acemoglu, D., S. Johnson and J. Robinson (2005), “Institutions as the Fundamental Cause of
Long-Run Growth”, in Aghion and Durlauf, editors, Handbook of Economic Growth, Amsterdam: North Holland
Acemoglu, D. and J. Robinson, (2008), “Persistence of Elites, Power and Institutions”, American
Economic Review, 98 (1): 267-293. Acemoglu, D. and J. Robinson (2012), Why Nations Fail: The Origins of Power, Prosperity, and
Poverty. Crown Publishers: New York, Albouy, D. (forthcoming), “The Colonial Origins of Comparative Development: An Empirical
Investigation: Comment”, American Economic Review Baron Castro (1942) “La poblacion de El Salvador: estudio acerca de su desenvolvimiento desde
la epoca prehispanica hasta nuestros dias” (The population of El Salvador: study of their development from pre-Hispanic era to the present day). Spain: Consejo Superior de Investigaciones Cientificas.
Banerjee, D. and L. Iyer, (2005), “History Institutions and Economic Performance: The Legacy
of Colonial Land Tenure Systems in India”, American Economic Review, 95(4):1190-1213.
Beck, T., A. Demirguc-Kunt, and R. Levine (2003),“Law, Endowments, and Finance.” Journal
of Financial Economics, 70: 137-181. Bisin, A. G. Topa and T. Verdier (2004), “An Empirical Analysis of Religious Homogamy and
Socialization in the U.S, Journal of Political Economy, 112(3): 615-64 Bisin, A. and T. Verdier, “Beyond the Melting Pot: Cultural Transmission, Marriage, and the
Evolution of Ethnic and Religious Traits”, Quarterly Journal of Economics, 115(3): 955-988
Bockstette, V., A. Chanda, and L. Putterman (2002), States and Markets: the Advantage of an
Early Start, Journal of Economic Growth, 7: 347-369 Comin, D., W. Easterly, and E. Gong (2010), “Was the Wealth of Nations Determined in 1000
B.C.?”, American Economic Journal: Macroeconomics, 2(3): 65–97
31
Diamond, J. (1997), “Guns, Germs, and Steel: The Fates of Human Societies”, New York: Norton
Easterly, W. and R. Levine (1997), “Africa's Growth Tragedy: Policies and Ethnic Divisions."
Quarterly Journal of Economics, 112 (4):1203-1250 Easterly, W. and R. Levine (2003), “Tropics, germs, and crops: the role of endowments in
economic development”, Journal of Monetary Economics, 50 (1): 3-40 Easterly, W. (2007), "Inequality does cause underdevelopment" Journal of Development
Economics, 84 (2): 755-776. Engerman, S. and K. Sokoloff (1997), “Factor Endowments, Institutions, and Differential Paths
of Growth among New World Economies: A View from Economic Historians of the United States” in How Latin America Fell Behind, in Haber, editor, Stanford: Stanford University Press: 260–304
Fernandez, R. and A. Fogli (2009), “Culture: An Empirical Investigation of Beliefs, Work, and
Fertility”, American Economic Journal: Macroeconomics 1 (1): 146–77 Galor, O. and D. Weil (2000), "Population, Technology and Growth: From Malthusian
Stagnation to the Demographic Transition and Beyond," American Economic Review, 90 (Sept.): 806-828.
Galor, O., O. Moav and D. Vollrath (2009), “Inequality in Land ownership, the Emergence of
Human Capital Promoting Institutions and the Great Divergence”, Review of Economic Studies, 76 (1): 143-179
Galor, O. and O. Moav (2006), “Das Human Kapital: A Theory of the Demise of the Class
Structure”, Review of Economic Studies, 73(1): 85-117 Glaeser, E., R. La Porta, F. Lopez-de-Silanes and A. Shleifer (2004) "Do Institutions Cause
Growth?", Journal of Economic Growth, 9 (3): 271-303. Guiso, L. P. Sapienza, L. Zingales (2010), “Civic Capital as the Missing Link”, in Jess Benhabib,
Alberto Bisin and Matthew Jackson (editors) Handbook of Social Economics, Amsterdam: North Holland
Hibbs, D.A. Jr. and O. Olsson , (2004) “Geography, biogeography, and why some countries are rich and others are poor” Proceedings of the National Academy of Sciences 101 (10): 3715-372
Hofstede, G. (2001), Culture's Consequences: Comparing Values, Behaviors, Institutions and
Organizations Across Nations, 2nd Edition Thousand Oaks CA: Sage Publications

32
Hofstede, G and G. Hofstede (2005), “Cultures and Organizations: Software of the Mind” 2nd Edition, New York: McGraw-Hill USA
Karlen, A. (1995), Man and Microbes: Disease and Plagues in History and Modern Times New
York: Simon & Schuster Kaufman, D. A. Kraay, and P. Zoido-Lobaton (2002) “Governance Matters II: Updated
Indicators for 2000-01”, World Bank Policy Research Working Paper 2772 Kleibergen, F., and R. Paap (2006), “Generalized reduced rank tests using the singular value
decomposition”. Journal of Econometrics 133: 97-126. Kiszewski, A., A. Mellinger, A. Spielman, P. Malaney, S.E. Sachs and J. Sachs (2004), “A
Global Index Representing the Stability of Malaria Transmission”, American Journal of Tropical Medicine and Hygine 70 (5): 486-498
La Porta, R., F. Lopez-de-Silanes, and A. Shleifer,(2008), “The Economic Consequences of
Legal Origins,” Journal of Economic Literature, 46: 285–332. Licht, A., C. Goldschmidt, and S. Schwartz (2007), “Culture rules: The foundations of the rule of
law and other norms of governance”, Journal of Comparative Economics, 35: 659–688 Madison A. (2006) “The World Economy”, Organization for Economic Co-operation and
Development. Development Centre, Vol 1-2 McAlister L. (1984), “Spain and Portugal in the New World, 1492-1700”, USA: U of Minnesota
Press McNeil W. (1976), Plagues and Peoples New York: Anchor Press McEvedy C. and R. Jones (1978), Atlas of World Population History, New York: Facts on File Miguel, E, and R. Fisman (2007), “Corruption, Norms and Legal Enforcement: Evidence from
Diplomatic Parking Tickets,” Journal of Political Economy, 115(6): 1020–1048. Miguel, E., S. Saiegh, and S. Satyanath (2008), “National Cultures and Soccer Violence,”
mimeo, University of California, Berkeley North D. (1990), “Institutions, Institutional Change, and Economic Performance” UK:
Cambridge University Press Nunn, N. (2009), “The Importance of History for Economic Development,” Annual Review of Economics, 1(1): 65-92. Nunn, N. (2008), “The Long-Term Effects of Africa’s Slave Trades,” Quarterly Journal of
Economics, 123 (1): 139–176.

33
Oldstone M. (1998), Viruses, Plagues, and History, USA: Oxford University Press Persson, T. and G. Tabellini (2010),“Democratic Capital: The Nexus of Political and Economic
Change”, American Economic Journal: Macroeconomics, 1(2): 88–126. Putterman, L. and D. Weil (2010), “Post-1500 Population Flows and the Long Run Determinants
of Economic Growth and Inequality”, Quarterly Journal of Economics, 125(4): 1627-1682
Rodrik, D., A. Subramanian, and F. Trebbi (2004), “Institutions Rule: The Primacy of
Institutions over Geography and Integration in Economic Development”, Journal of Economic Growth, 9(2)
Rosentblat A. (1954), “ ” (The indigenous
population and racial mixing in America), Buenos Aires: Editorial Nova
Spolaore E. and R. Wacziarg, R. (2009), “The Diffusion of Development”, Quarterly Journal of Economics, 124 (2):469-529
Tabellini, G. (2008a), “The Scope of Cooperation: Values and Incentives,” Quarterly Journal of
Economics, 123: 905–950. Tabellini, G. (2008b), “Institutions and Culture”, Journal of the European Economic Association
Papers and Proceedings, 6(2-3)
34
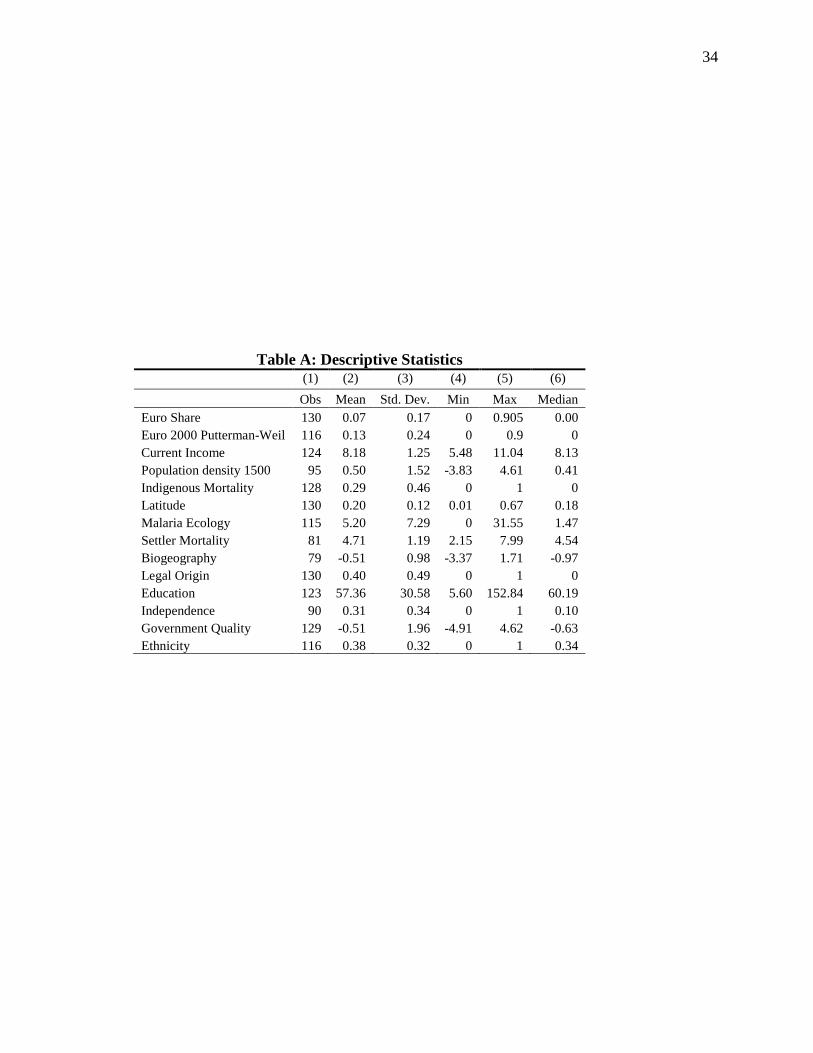
Table A: Descriptive Statistics (1) (2) (3) (4) (5) (6) Obs Mean Std. Dev. Min Max Median
Euro Share 130 0.07 0.17 0 0.905 0.00 Euro 2000 Putterman-Weil 116 0.13 0.24 0 0.9 0 Current Income 124 8.18 1.25 5.48 11.04 8.13 Population density 1500 95 0.50 1.52 -3.83 4.61 0.41 Indigenous Mortality 128 0.29 0.46 0 1 0 Latitude 130 0.20 0.12 0.01 0.67 0.18 Malaria Ecology 115 5.20 7.29 0 31.55 1.47 Settler Mortality 81 4.71 1.19 2.15 7.99 4.54 Biogeography 79 -0.51 0.98 -3.37 1.71 -0.97 Legal Origin 130 0.40 0.49 0 1 0 Education 123 57.36 30.58 5.60 152.84 60.19 Independence 90 0.31 0.34 0 1 0.10 Government Quality 129 -0.51 1.96 -4.91 4.62 -0.63 Ethnicity 116 0.38 0.32 0 1 0.34

35
Table B: Variable Definitions Definition Source
Euro Share Proportion of Europeans in colonial population Constructed. See Appendix for
details.
Euro 2000 P-W
Proportion of Europeans in 2000 population. Constructed from Putterman and Weil’s (2010) migration database by (for each country in the sample) adding the proportion of ancestors coming from each European country. Putterman and Weil (2010)
Current Income Ln average of GDP per capita over 1995-2005 (PPP, Constant 2005 International $)
World Bank World Development Indicators
Population density 1500 Log Population per square km in 1500 AJR (2002)
Indigenous Mortality
Dummy variable reflecting high rates of indigenous mortality from European diseases.
McEvedy and Jones (1978), McNeil (1976), Karlen (1995),
Oldstone (1998) Latitude The absolute value of latitude in degrees, divided by 90 to be between 0 and 1 CIA World Factbook
Malaria Ecology
An index of the stability of malaria transmission based biological characteristics of mosquitoes such the proportion of blood meals taken from human hosts, daily survival of the mosquito, and duration of the transmission season and of extrinsic incubation. Kiszewski et al (2004)
Settler Mortality Log of potential settler mortality, measured in terms of deaths per annum per 1,000 "mean strength” (constant population) AJR (2001)
Biogeography
The first principal component of log of number of native plants species and log number of native animals specifics, where plants are defined as “ storable annual or perennial wild grasses with a mean kernel weight exceeding 10 mg (ancestors of domestic cereals such as wheat, rice, corn, and barley)” and animals are defined denotes the number of species of wild terrestrial mammalian herbivores and omnivores weighing >45 kg that are believed to have been domesticated prehistorically in various regions of the world.” Hibbs and Olsson (2004) p2 Hibbs and Olsson (2004)
British Legal Origin A dummy variable indicating British legal origin. La Porta et al (1999)
Education Average rate of gross secondary school enrollment from 1995-2005 World Bank World Development
Indicators Independence The fraction of years since 1776 that a country has been independent Easterly and Levine (1997) Government
Quality The first principal component of the six governance indicators from the 2002 vintage of Kaufman et al Kaufman et al (2002)
Ethnicity An index of ethnic diversity (updated). Easterly and Levine (1997)

36
Table 1a: Human Settlement before European Colonization The sample is non-European countries. The dependent variable the log of population density in 1500. Biogeography is an index of domesticable animals and plants existing prior to colonization. Indigenous mortality is a dummy variable which is positive if a substantial number of natives died due to initial contact with Europeans. Maria ecology is an ecologically-based spatial index of the stability of malaria transmission. All specifications are estimated using OLS with heteroskedasticity-consistent standard errors. The null hypothesis of the F test is that the coefficients on all the explanatory variables equal zero. P values are reported in parentheses. ***, ** and * represent significance at 1, 5 and 10% level respectively. Detailed variable definitions and sources are in the appendix.
(1) (2) (3) (4) (5) Population
density 1500
Population density 1500
Population density 1500
Population density 1500
Population density 1500
Biogeography 0.609** 0.696** (0.0152) (0.0482) Latitude -3.084 -3.103 (0.101) (0.170) Malaria ecology 0.0275 0.00749 (0.105) (0.746) Indigenous mortality -1.361*** -0.603 (8.64e-06) (0.136) Observations 69 96 90 96 69 R-squared 0.110 0.053 0.017 0.182 0.207 Prob>F 0.0152 0.101 0.105 8.64e-06 0.0360 F test: 6.211 2.750 2.681 22.16 2.743
37
Table 1b: What Determined the Degree of European Settlement? The sample is non-European countries. The dependent variable Euro share is the proportion of Europeans in the colonial population. Population density 1500 is the log of population density in 1500. Indigenous mortality is a dummy variable which is positive if a substantial proportion of natives died due to initial contact with Europeans. Latitude is the absolute value of distance from the equator. P values are reported in parentheses. ***, ** and * represent significance at 1, 5 and 10% level respectively. (1) (2) (3) (4) (5) 6) (7) Euro share Euro share Euro share Euro share Euro
share Euro share Euro share
Population density 1500 -0.0357** -0.0275*** -0.0277*** -0.0269** -0.00376 -0.0272*** -0.0324** (0.0249) (0.00744) (0.00706) (0.0129) (0.152) (0.00774) (0.0140) Indigenous mortality 0.156*** 0.141*** 0.141*** 0.136*** 0.0737*** 0.144*** 0.0865** (1.04e-05) (9.54e-06) (1.58e-05) (2.94e-05) (5.80e-05) (0.000413) (0.0332) Latitude 0.661*** 0.664*** 0.686*** 0.0780 0.680*** 0.674*** (9.36e-05) (9.59e-05) (7.18e-05) (0.102) (0.000132) (0.000195) Precious metals -0.00370 (0.897) London 6.58e-08 (0.993) Biogeography -0.000861 (0.828) Malaria ecology 0.000988 (0.405) Settler Mortality -0.0150 (0.195) Observations 95 95 95 91 68 89 73 R-squared 0.375 0.544 0.544 0.547 0.486 0.541 0.582 Prob>F 1.32e-05 5.59e-07 2.17e-06 2.28e-06 3.51e-06 1.12e-05 8.19e-06 F test: 12.73 12.64 9.392 9.430 9.709 8.277 8.850
38
Table 2a: Does the degree of European settlement explain per capita income today? The sample is non-European countries. Current income is the log of average of per capita income over 1995-2005 Euro share is proportion of Europeans in the colonial population. Legal origin is a dummy variable which is positive if a country’s laws are based on the United Kingdom’s legal system. Current education is the average rate of secondary school enrollment from 1998 to 2002. Independence is the fraction of years since 1776 that a country has been independent. Government quality is an index of measures of current government accountability and effectiveness. Ethnicity is a measure of a country’s ethnic diversity. All specifications are estimated using OLS with heteroskedasticity-consistent standard errors. The null hypothesis of the F test is that the coefficients on all the explanatory variables equal zero. P values are reported in parentheses. ***, ** and * represent significance at 1, 5 and 10% level respectively. Detailed variable definitions and sources are in the appendix.
(1) (2) (3) (4) (5) (6) Current
income Current income
Current income
Current income
Current income
Current income
Euro share 3.622*** 3.625*** 0.617 3.339*** 0.641 3.430*** (0.000) (6.30e-11) (0.230) (1.49e-09) (0.209) (0.00) British Legal origin -0.00406 (0.986) Education 0.0308*** (0.000) Independence 0.830** (0.0252) Government Quality 0.407*** (1.07e-09) Ethnicity -1.326*** (1.60e-05) Observations 124 124 120 89 124 112 R-squared 0.166 0.166 0.636 0.302 0.433 0.372 Prob>F 0.000 0.000 0.000 0.000 0.000 0.000 F test: 63.64 31.59 105.4 37.50 80.72 86.11
39
Table 2b: Does the degree of European settlement explain per capita income today? The sample is countries with Euro share values of less than 0.15. Current income is the log of average of per capita income over 1995-2005. Euro share is proportion of Europeans in the colonial population. Legal origin is a dummy variable which is positive if a country’s laws are based on the United Kingdom’s legal system. Current education is the average rate of secondary school enrollment from 1998 to 2002. Independence is the fraction of years since 1776 that a country has been independent. Government quality is an index of measures of current government accountability and effectiveness. Ethnicity is a measure of a country’s ethnic diversity. All specifications are estimated using OLS with heteroskedasticity-consistent standard errors. The null hypothesis of the F test is that the coefficients on all the explanatory variables equal zero. P values are reported in parentheses. ***, ** and * represent significance at 1, 5 and 10% level respectively. Detailed variable definitions and sources are in the appendix.
(1) (2) (3) (4) (5) (6) Current
income Current income
Current income
Current income
Current income
Current income
Euro share 8.492*** 8.500*** -0.571 10.05*** 4.073* 9.605*** (0.000107) (0.000111) (0.785) (0.000230) (0.0648) (3.21e-05) British Legal origin -0.0402 (0.868) Education 0.0325*** (0) Independence 0.801* (0.0543) Government Quality 0.402*** (1.91e-08) Ethnicity -1.196*** (0.000318) Observations 112 112 110 80 112 100 R-squared 0.055 0.055 0.601 0.191 0.347 0.252 Prob>F 0.000107 0.000550 0 7.47e-07 3.53e-10 0 F test: 16.16 8.046 100.9 17.04 26.75 41.06
40
Table 3a: Using instrumental variables, does European settlement explain per capita
income today? The sample is non-European countries. Current income is the log of average of per capita income over 1995-2005. Euro share is proportion of Europeans in the colonial population. Legal origin is a dummy variable which is positive if a country’s laws are based on the United Kingdom’s legal system. Current education is the average rate of secondary school enrollment from 1998 to 2002Independence is the fraction of years since 1776 that a country has been independent. Government quality is an index of measures of current government accountability and effectiveness. Ethnicity is a measure of a country’s ethnic diversity. All specifications are estimated using 2SLS, with Population density 1500 and indigenous mortality instrumenting for Euro share, and with heteroskedasticity-robust standard errors. The OIR p-value refers to the J statistic from the Hansen-Sargan test, with null hypothesis that instruments are uncorrelated with the error term. The LM p-value refers the LM Kleibergen-Paap (2006) rk statistic, which is a generalization to non-iid errors of the LM version of Anderson canonical correlations likelihood-ratio test, with null hypothesis that the first-stage regression is underidentified. P values are reported in parentheses. ***, ** and * represent significance at 1, 5 and 10% level respectively. Detailed variable definitions and sources are in the appendix.
(1) (2) (3) (4) (5) (6) Current
income Current income
Current income
Current income
Current income
Current income
Euro share 7.775*** 7.882*** 3.270*** 7.739*** 6.885*** 6.959*** (5.60e-06) (1.67e-06) (0.00546) (0.000136) (0.00139) (7.84e-05) British Legal origin -0.186 (0.379) Education 0.0218*** (1.01e-10) Independence -0.110 (0.820) Government Quality 0.0863 (0.561) Ethnicity -0.700* (0.0611) Observations 92 92 89 78 92 91 OIR p-value: 0.813 0.887 0.966 0.934 0.597 0.714 LM p-value 4.01e-05 2.67e-05 0.0237 0.0162 0.000405 0.000622
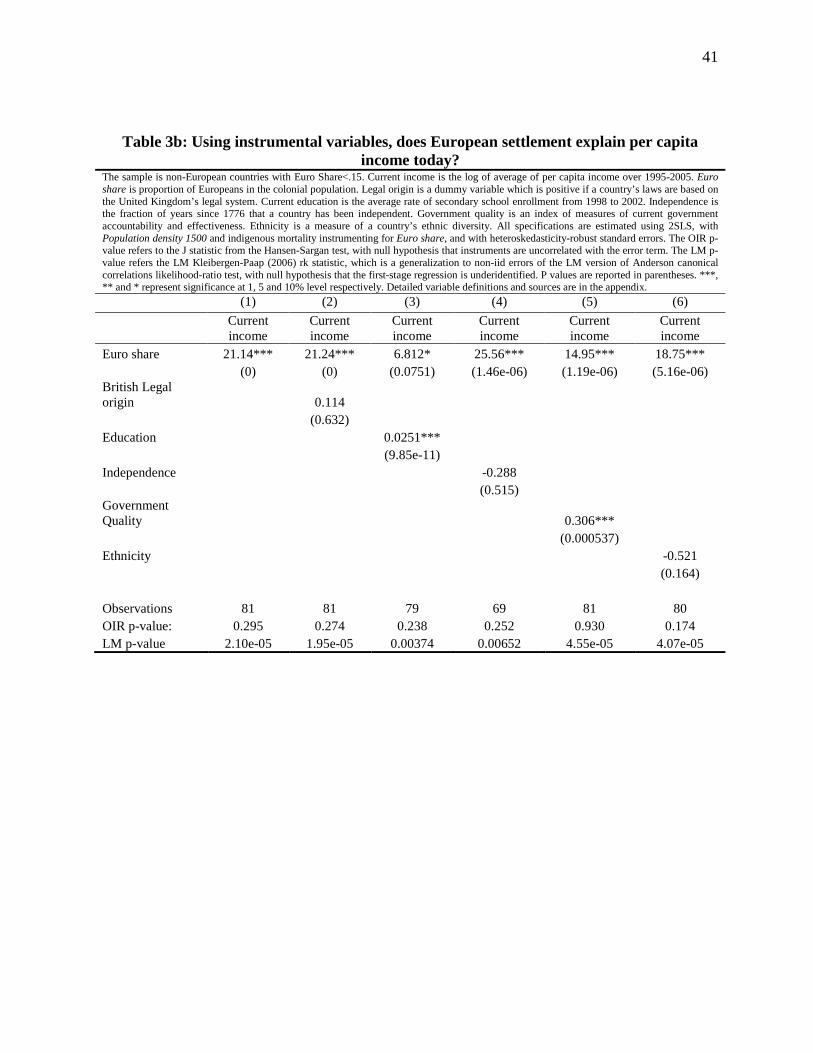
41
Table 3b: Using instrumental variables, does European settlement explain per capita income today?
The sample is non-European countries with Euro Share<.15. Current income is the log of average of per capita income over 1995-2005. Euro share is proportion of Europeans in the colonial population. Legal origin is a dummy variable which is positive if a country’s laws are based on the United Kingdom’s legal system. Current education is the average rate of secondary school enrollment from 1998 to 2002. Independence is the fraction of years since 1776 that a country has been independent. Government quality is an index of measures of current government accountability and effectiveness. Ethnicity is a measure of a country’s ethnic diversity. All specifications are estimated using 2SLS, with Population density 1500 and indigenous mortality instrumenting for Euro share, and with heteroskedasticity-robust standard errors. The OIR p-value refers to the J statistic from the Hansen-Sargan test, with null hypothesis that instruments are uncorrelated with the error term. The LM p-value refers the LM Kleibergen-Paap (2006) rk statistic, which is a generalization to non-iid errors of the LM version of Anderson canonical correlations likelihood-ratio test, with null hypothesis that the first-stage regression is underidentified. P values are reported in parentheses. ***, ** and * represent significance at 1, 5 and 10% level respectively. Detailed variable definitions and sources are in the appendix.
(1) (2) (3) (4) (5) (6) Current
income Current income
Current income
Current income
Current income
Current income
Euro share 21.14*** 21.24*** 6.812* 25.56*** 14.95*** 18.75*** (0) (0) (0.0751) (1.46e-06) (1.19e-06) (5.16e-06) British Legal origin 0.114 (0.632) Education 0.0251*** (9.85e-11) Independence -0.288 (0.515) Government Quality 0.306*** (0.000537) Ethnicity -0.521 (0.164) Observations 81 81 79 69 81 80 OIR p-value: 0.295 0.274 0.238 0.252 0.930 0.174 LM p-value 2.10e-05 1.95e-05 0.00374 0.00652 4.55e-05 4.07e-05
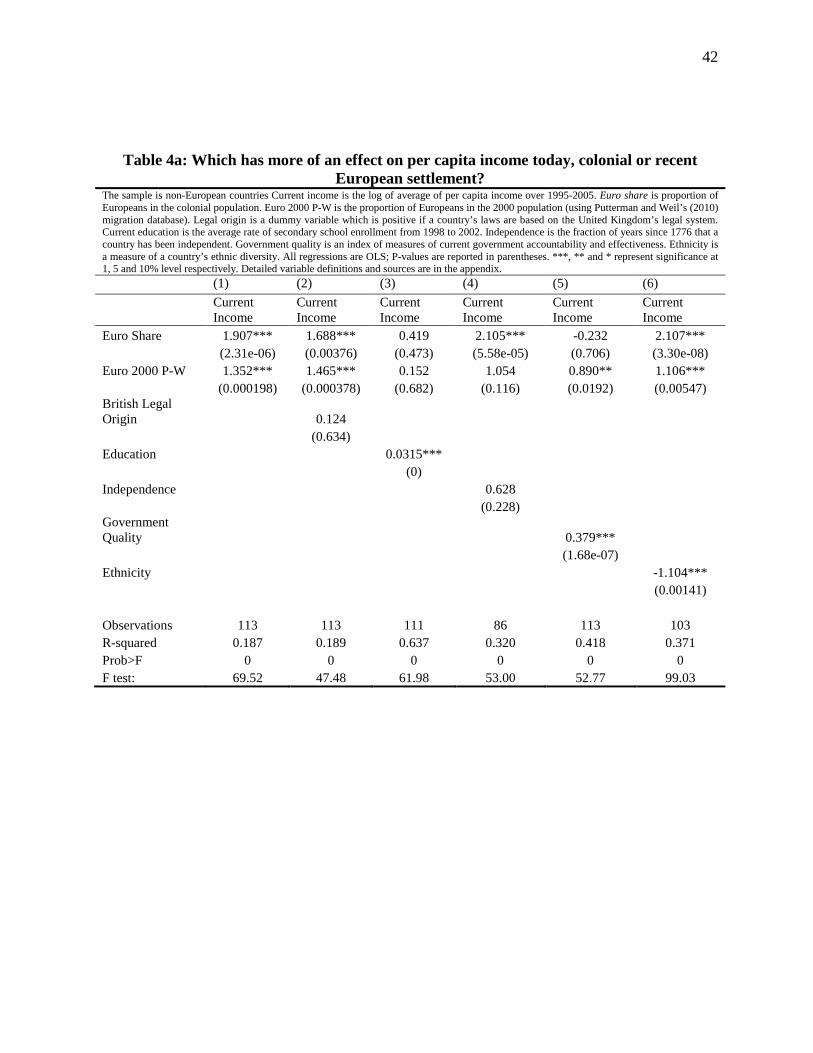
42
Table 4a: Which has more of an effect on per capita income today, colonial or recent European settlement?
The sample is non-European countries Current income is the log of average of per capita income over 1995-2005. Euro share is proportion of Europeans in the colonial population. Euro 2000 P-W is the proportion of Europeans in the 2000 population (using Putterman and Weil’s (2010) migration database). Legal origin is a dummy variable which is positive if a country’s laws are based on the United Kingdom’s legal system. Current education is the average rate of secondary school enrollment from 1998 to 2002. Independence is the fraction of years since 1776 that a country has been independent. Government quality is an index of measures of current government accountability and effectiveness. Ethnicity is a measure of a country’s ethnic diversity. All regressions are OLS; P-values are reported in parentheses. ***, ** and * represent significance at 1, 5 and 10% level respectively. Detailed variable definitions and sources are in the appendix. (1) (2) (3) (4) (5) (6) Current
Income Current Income
Current Income
Current Income
Current Income
Current Income
Euro Share 1.907*** 1.688*** 0.419 2.105*** -0.232 2.107*** (2.31e-06) (0.00376) (0.473) (5.58e-05) (0.706) (3.30e-08) Euro 2000 P-W 1.352*** 1.465*** 0.152 1.054 0.890** 1.106*** (0.000198) (0.000378) (0.682) (0.116) (0.0192) (0.00547) British Legal Origin 0.124 (0.634) Education 0.0315*** (0) Independence 0.628 (0.228) Government Quality 0.379*** (1.68e-07) Ethnicity -1.104*** (0.00141) Observations 113 113 111 86 113 103 R-squared 0.187 0.189 0.637 0.320 0.418 0.371 Prob>F 0 0 0 0 0 0 F test: 69.52 47.48 61.98 53.00 52.77 99.03

43
Table 4b:Which has more of an effect on per capita income today, colonial or recent European settlement?
The sample is non-European countries with Euro Share<.15. Current income is the log of average of per capita income over 1995-2005. Euro share is proportion of Europeans in the colonial population Euro 2000 P-W is the proportion of Europeans in the 2000 population (using Putterman and Weil’s (2010) migration database). Legal origin is a dummy variable which is positive if a country’s laws are based on the United Kingdom’s legal system. Current education is the average rate of secondary school enrollment from 1998 to 2002. Independence is the fraction of years since 1776 that a country has been independent. Government quality is an index of measures of current government accountability and effectiveness. Ethnicity is a measure of a country’s ethnic diversity. All regressions are OLS. P values are reported in parentheses. ***, ** and * represent significance at 1, 5 and 10% level respectively. Detailed variable definitions and sources are in the appendix. (1) (2) (3) (4) (5) (6) Current
Income Current Income
Current Income
Current Income
Current Income
Current Income
Euro Share 6.246** 5.895** -1.604 9.285*** 2.494 8.386*** (0.0212) (0.0391) (0.522) (0.00420) (0.408) (0.00182) Euro 2000 P-W 0.948** 1.050** 0.317 0.193 0.728 0.592 (0.0272) (0.0302) (0.456) (0.824) (0.123) (0.170) British Legal Origin 0.0961 (0.719) Education 0.0331*** (0) Independence 0.778 (0.183) Government Quality 0.384*** (3.85e-07) Ethnicity -1.087*** (0.00172) Observations 106 106 104 79 106 96 R-squared 0.078 0.080 0.601 0.193 0.343 0.258 Prob>F 1.85e-05 5.74e-05 0 1.18e-06 1.04e-09 0 F test: 12.14 8.250 64.94 12.36 18.62 27.45
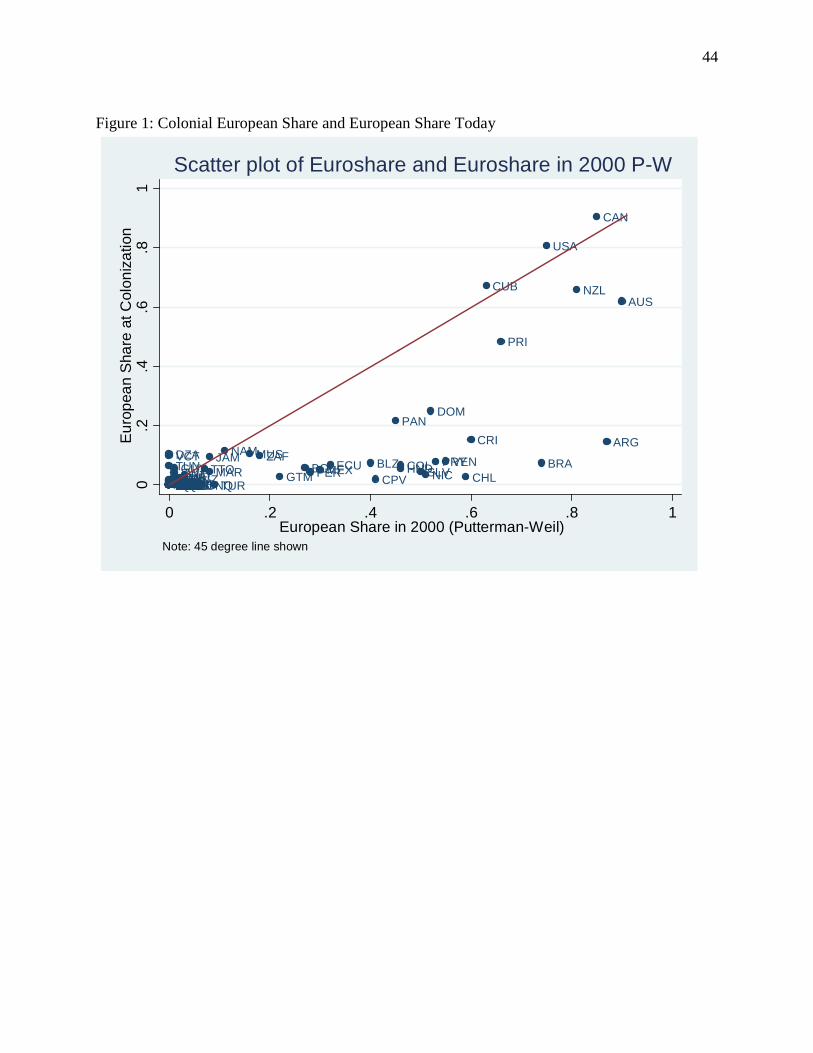
44
Figure 1: Colonial European Share and European Share Today
AFGAGOARE
ARG
AUS
BDIBENBFABGDBHR
BLZBOL BRA
BTNBWACAF
CAN
CHLCHNCIVCMRCOG
COL
COM CPV
CRI
CUB
DOM
DZAECU
EGYERIETHFJIGABGHAGINGMBGNBGNQGTM
GUYHKG
HNDHTIIDNINDIRNIRQ
JAM
JORJPNKENKHMKORKWTLAOLBNLBRLBYLKALSOMAR
MDGMEX
MLIMNGMOZMRT
MUS
MWIMYS
NAM
NERNGANIC
NPL
NZL
OMNPAK
PAN
PERPHLPNG
PRI
PRY
QATRWASAUSDNSENSGPSLESLV
SOMSTPSWZSYRTCDTGOTHATONTTOTUN
TURTZAUGA
USA
UZB
VCT VEN
VNMYEM
ZAF
ZMBZWE
0.2
.4.6
.81
Eur
opea
n S
hare
at C
olon
izat
ion
0 .2 .4 .6 .8 1European Share in 2000 (Putterman-Weil)
Note: 45 degree line shown
Scatter plot of Euroshare and Euroshare in 2000 P-W

45
Data Appendix
This appendix describes the construction of the dataset on the European share of the
population in countries around the world during the early stages of colonization. The primary
goal is to define what we did, so that the numbers are transparent and replicable. At the end of
the appendix, we list some of the problems that we encountered in constructing the database, and
the difficulties that we faced in choosing which years to use in defining a country’s “European
share of the population during the early stages of colonization.” The dataset and other key
information are contained in the excel workbook titled “Appendix_Europeans,” which is
available on request. In this Appendix when discussing details of the dataset, we refer to specific
worksheets within this workbook.
Data sources and definitions
We primarily rely on 46 sources, which are listed in the worksheet titled “bibliography”
and the worksheet titled “web.” Many of these are scholarly books about particular regions or
countries and some are atlases. As a few examples, Robert Wells wrote The Population of the
British Colonies in America before 1776; Simeon Ominde wrote The Population of Kenya,
Tanzania, and Uganda; and, McEvedy and Jones assembled Atlas of World Population History.
We also use primary sources (such as national and colonial censuses) to both check these sources
and to expand the number of countries and data points. Besides the books and official documents
listed in the worksheet “bibliography,” some datasets are provided online. We list these in the
worksheet “web.”

46
In terms of defining “European settlers,” we strive in collecting the data to identify
Europeans as people from the geographic region of Europe; it is NOT a racial or ethnic
description. So, some observers might consider the populations of some countries outside of
Europe as racially or ethnically equivalent to Europeans, but that is irrelevant to us. We are only
concerned with resettlement from Europe to outside Europe, defined geographically.
Furthermore, in assembling the data on settlers, we strive to exclude colonial officials or business
people that are temporarily stationed abroad; we strive to only include Europeans who
permanently resettle outside of Europe.
Data: By country, year, and source
For each country, we provide an entry for each year for which we found information on
the European share of the population. For each data point, we provide the source of the
information (including the page number) and brief notes about the data, whenever relevant.
Some of these notes are important. For example, the 1744 and 1778 values for Argentina are
based only on the population around Buenos Aires, for the country as a whole. Similarly, one of
the values for Ecuador in 1781 measures only the population around Quito. These notes, the data,
and the sources of each data point are listed in the worksheet, “country_year_source.”
For example, Lyle N. McAlister, in Spain and Portugal in the New World, 1492 -1700,
(University of Minnesota Press, 1984) provides data on page 131 on the population of Argentina
in 1570. He notes that there are 2000 whites, 4000 blacks, 300,000 “others” in Argentina. Since
whites are typically used to describe people of European descent, we calculate European share in
Argentina in 1570 as 0.0065.
47
In some cases, the data sources provide a range of years (rather than a single year)
corresponding to data on the share of the population that is European. For example, one of the
observations on Mexico is listed as 1568-1570 in the underlying data. In these cases, we choose
the average of the range and enter this as the year for the observation. Thus, for the Mexico
example, we choose the year 1569 when entering the data. All of these cases are separately
identified in the worksheet “periods.” This has no bearing on our analyses, but might be relevant
for others that use these data.
In a few cases, we found two data sources that provide information on the same year (or
range of years) for the same country. In some cases, these two data sources agree, in which case
we simply report both observations within the worksheet “country_year_sources.” In a few
cases, the data sources give different numbers for the share of Europeans in a country in a given
year. In this case, we report both numbers in the worksheet “country_year_sources” and use the
average of the two observations when constructing the data on which we conduct our analyses.
Data: Share of Europeans used in the analyses
From these data scattered over many years since the 16th century, we construct several
measures of the share of Europeans during colonization for each country, where we have one
measure per country. To do this, we arrange the data in a manner that is amenable for the
construction of a single measure of the share of Europeans during colonization for each country.
In the worksheet “euro share,” each row is a country. The columns provide possible data entries
for many years running from 1540 (which is our first observation, for Chile) through to the late
20th century. We do not include all years as column headings; rather, we only include years for
which we have at least one non-missing value for one country.

48
First, we construct simple, objective measures that average the value of each country over
particular periods. For example, we average each country’s entries over the period from 1500 to
1801; and, we average values over the period from 1700 to 1950. These measures are provided in
the worksheet titled “euro share.” Other researchers can obviously take these data and use
whichever periods they find most appropriate.
These simple, objective measures for computing the share of Europeans during
colonization, however, have some limitations. Specifically, averaging over uniform time periods
for all countries might not create accurate measures for each particular country of the proportion
of the population that is European during a colony’s formative period—the period when a colony
was creating an initial set of (potentially enduring) political, educational, and cultural
institutions. We fully recognize that there is not a precise definition of “the” formative period of
colonization. Nevertheless, influential studies of comparative economic development emphasize
the potential role of Europeans during a colony’s history when it establishes major institutional
norms. This motivates our efforts to give empirical substance to this amorphous notion. From
this perspective, using the European share of the population of Mexico in 1650 might be more
appropriate than using the share in 1850, but using the European share of the population in 1650
in some parts of Sub-Saharan Africa (or other parts of the world) might be inappropriate because
European colonization evolved differently there. Thus, we face a challenging goal: account for
these historical differences in the timing and process of colonization to construct a more
conceptually useful measure of “euro share” for each country. We face this challenge while
operating under severe data constraints.
Thus, the second method for constructing a measure of each country’s European share of
the population during the formative years of colonization attempts to select the best year, or
49
range of years, given the particulars of the country and data availability. We would like a date as
early as possible after initial European colonization to use European settlement as an initial
historical condition affecting subsequent developments. At the same time, we can’t pick a date
that is too early after the start of European colonization. It was only after some process of
conquest, disease control, and building rudimentary colonial infrastructure that it becomes
possible to speak of a European community that might influence economic, political, and cultural
conditions. Given these considerations, it would not make sense to use a uniform date across all
colonies.
Thus, we formulated the following “guidelines.” Subject to data limitations, we tried to
constrain the timing of the European measure to be at least a century after initial European
contact. Furthermore, we tried to choose a date that was at least 50 years before independence to
measure the colonial period. Finally, if there were a few measures close together, we took the
average.
In the worksheet “euro share,” we provide a measure of each country’s European share of
the population – euro share—that represents our assessment of the best year, or range of years,
for measuring European share during the formative years of colonization for each particular
country, where this assessment is almost always done subject to extreme data constraints. When
using a range of years, we average to compute euro share. The worksheet also provides the year,
or range of years, used to compute euro share. This second method is neither simple nor fully
objective. Though we do our best to follow the guidelines outlined above, data limitations and
the idiosyncrasies of colonial histories make things complex and subjective. Nevertheless, we
believe euro share is a more accurate representation of the share of Europeans during the
50
formative years of colonization that simply averaging over a uniform time period for all former
colonies.
Though the excel spreadsheet “euro share” provides the details for each country, it is
valuable to illustrate some of the constraints that we face and the choices that we made. For
much of Latin America, Angel Rosentblat (1954) provides detailed estimates of the composition
of the population in 1650. We have used these estimates when available. In many countries, the
next available observation is not until a century (or more) later. For example, after 1650, the next
observation is not until 1798 in Brazil, 1940 in Bolivia, 1777 in Mexico, and 1744 in Argentina.
For some of these countries, we have earlier population estimates that are reported in the excel
file. For example, we have observations in 1570 for Argentina, Bolivia, Brazil, and Mexico. But,
following the guidelines sketched above, we determined that this was too early after Europeans
first arrived.
There are other problems, some of which force us to break with the “guidelines” sketched
above. For example, the first number that we have for the United States is the 1790 census,
which is obviously not fifty years before the country became independent. Similarly, we do not
have data on the composition of the population before 1950 for several countries in Africa,
including the Democratic Republic of Congo, Djibouti, Gabon, Sao Tome and Principe, Senegal,
Tunisia, and Rwanda. Jamaica and El Salvador provide some particular challenges. For Jamaica,
the numbers on European share of the population show considerable variability over the period
from 1570 to 1673; but then, the numbers (provided by various sources) are quite consistent from
1700 through 1943. So, to compute euro share, we take the average over the period from 1700-
1750. For El Salvador, there is one extremely large observation in 1796 (0.48) that deviates from
other estimates in nearby years (e.g., 0.03 in 1807) provided by the same source (Baron Castro,

51
1942). Since (1) the estimates for euro share over the entire period with available data from 1551
to 1950 are reasonably constant except for this one observation 1796 and (2) there seems to be a
change in the definition of “white” for this particular year, we decided not to include this
observation in the “euro share” worksheet. For El Salvador, therefore, we compute the average
over the period from 1551-1807, excluding this 1796 outlier because of the change in definition.
Data: Countries in which Europeans did not settle
There are many countries in which Europeans did not settle to any appreciable degree. In
these countries, unsurprisingly, we do not find historical sources documenting the share of
Europeans during the colonial period. Thus, we face a problem: We do not want eliminate these
countries from the sample when we know that European settlers were not a material part of their
history, but we do not have documentation to that effect. Thus, although we cannot strictly prove
that there were no Europeans, available evidence suggests that Europeans did not settle
everywhere and we can incorporate this information into our analyses.
We follow the following procedure. We conduct a worldwide search for colonial data on
European settlement. Besides the sources listed in the workbook, we examine many additional
sources in search of data. When we fail to find any mention of European settlement in any of
these sources for a given nation, we coded that country as having zero European settlement. This
procedure runs the risk of biasing downward European settlement for these countries. But,
colonial histories seem unlikely to ignore material European settlement. We confirm our data
using information from Acemoglu et al. 2001 on the European share of the population in 1900.
Problems: A brief discussion of a few of the problems

52
There are many challenges associated with constructing this database on the European
share of the population during the period of colonization. First, although colonists did document
the number of Europeans in the total population at various points during colonization, the
processes and periodicities were not standardized. We just do not know if the same colonial
power used the same methods in different countries in different years, not to mention differences
across European powers. For example, different colonial powers probably used different
methods to estimate population numbers. In a census-based method, there could be an
undercount of non-European populations, which would bias population numbers downward and
European shares upward. In a sampling methodology, there is zero expected bias only if the
samplings were random. Unfortunately, we have almost no information on methods followed to
get these population numbers. Put simply, we do not have a continuous time series of data
collected using similar measures by a centralized coordinating entity.
Second, most of the cells in the data running from the 16th century to the 20th century are
empty. This means that for many countries we cannot get measures of the share of Europeans in
the population within decades of the years that we would ideally want to measure euro share.
Although most countries do not experience huge changes in the share of Europeans, some
experience substantial changes, so this is another challenge facing the construction of the
database.
Third, the basic conceptual predictions about the role of Europeans during colonization
and their enduring influence on economic development do not provide a concrete definition of
when to measure the share of Europeans during colonization. We try to measure the share of
Europeans about a century after the start of colonization and 50 years before independence, but
this simply represents the articulation of a hopefully helpful empirical guideline to measure a still

53
vague concept. Without ignoring these—and other—challenges, we constructed the database and
use it to provide empirical evidence on the relationship between the share of Europeans during
colonization and comparative economic development.