the equity and fixed income characteristics of asian reits
TRANSCRIPT
INTERNATIONAL JOURNAL OF REAL ESTATE AND LAND PLANNING
VOL.1 (2018) eISSN 2623-4807
Available online at https://ejournals.lib.auth.gr/reland
© 2018 by Author(s). This is an open-access article distributed under the terms and conditions of the Creative Commons Attribution 4.0 International (CC BY 4.0). See https://creativecommons.org/licenses/by/4.0/
The equity and fixed income characteristics of Asian REITs: Evidence
from Japan, Singapore and Hong Kong
Woon Weng Wonga
aRMIT University, 360 Swanston Street, Melbourne 3000, Australia
Abstract
The factors that govern the returns generating process for Real Estate Investment Trusts (REITs) have been the
focus of much research in recent years. On the one hand, certain REIT markets have been found to possess equity
like characteristics such as aggressive returns with commensurately high rates of volatility and exposure to market
risk, interest rates and general macroeconomic factors. Conversely, other REIT markets exhibit bond like
characteristics such as inflation hedging and other defensive properties which make them attractive to investors
with conservative risk appetites.
Compared to Western markets, REITs are a relatively recent entrant to Asian security markets with relatively less
research examining their performance and associated risk factors. This study explores the equity and fixed income
characteristics of Asian REITs across three key markets: Japan, Singapore and Hong Kong which represent the
largest and most mature sectors in the region.
Utilising the Autoregressive Distributed Lag model (ARDL) and the associated bounds testing approach developed
by Persaran et al., Singporean REITs were found to exhibit the most equity like characteristics while Hong Kong
REITs were found to exhibit the most bond like (defensive) characteristics. Evidence from the Japanese market was
less clear, which may be the result of recent deflationary cycles. Additionally, there is a high degree of inter-
relatedness between the three markets limiting the potential benefits of risk mitigation through diversification.
Lastly, the speed of adjustment was found to be relatively high with up to 35 percent of disequilibrium being
corrected within one period.
Keywords: REITs; securitised property; listed property trusts; capital asset pricing; Autoregressive
Distributed Lag models (ARDL); time series analysis; bounds testing; financial risk factors;
inflation risk; property investment
1 Introduction
Real Estate Investment Trusts (REITs) first came into existence in the U.S. with the passage of legislation by
Congress in 1960. Originally conceived as 'pass through entities', REITs provided investors with a valuable
alternative to direct property investment. Furthermore, the securitised nature of REITs offered additional benefits
REAL ESTATE AND LAND PLANNING 2018
Available online at https://ejournals.lib.auth.gr/reland
156
such as enhanced liquidity, diversification, high income yields, tax transparency, mandatory distributions and
professional asset management. Since the 1990s, there has been an explosive growth in U.S. REITs with a total of
119 funds (and a combined market capitalisation of USD 8.73bn) in 1990 to a total of 224 funds (and a combined
market capitalisation of USD 1,018bn) in 2016 (NAREIT, 2017).
By contrast, Asian REITs have existed for a far shorter period. The first Asian REIT was established in 2001 following
the listing of the Nippon Building Fund on the Tokyo stock exchange. Since then, Asian REITs have grown in size
and value with a current market capitalisation of over USD 200bn. Importantly, Asian REITs provide access to the
lucrative markets of China and India. In 2014, Asia accounted for USD 7 trillion in investible real estate
representing approximately 25% of the global market. By 2020, this is estimated to grow to USD 17 trillion
representing approximately 35% of the global market (Newell, 2012).
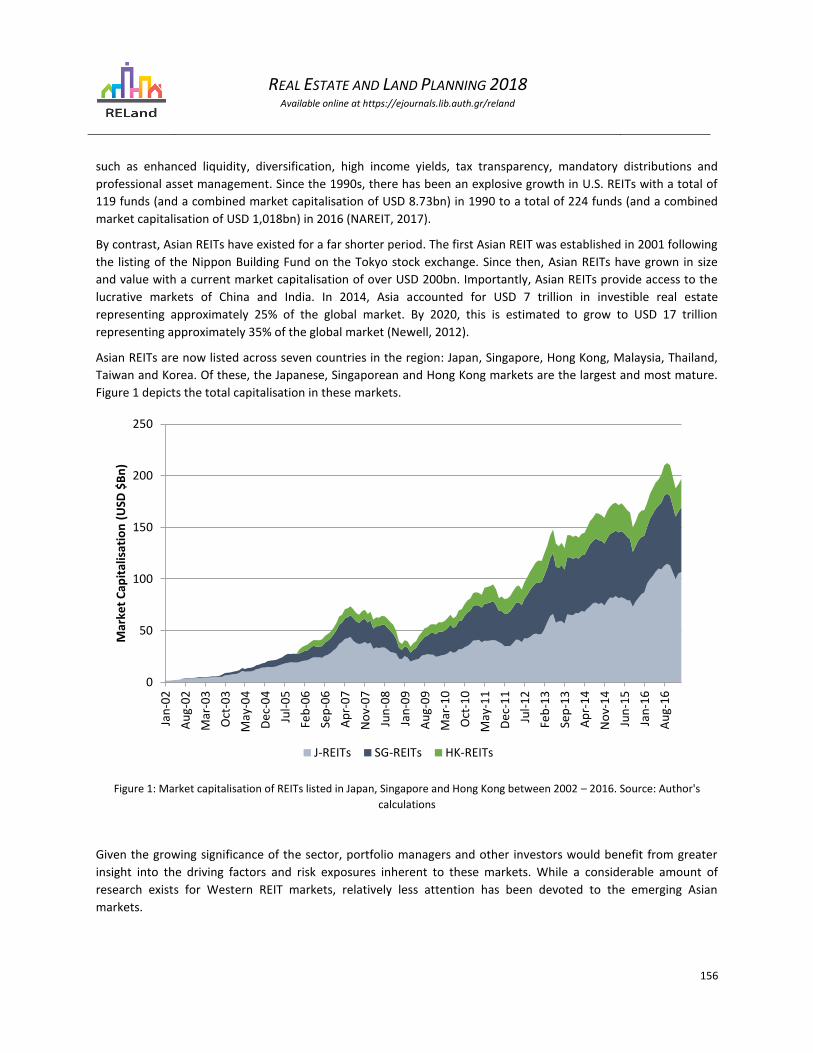
Asian REITs are now listed across seven countries in the region: Japan, Singapore, Hong Kong, Malaysia, Thailand,
Taiwan and Korea. Of these, the Japanese, Singaporean and Hong Kong markets are the largest and most mature.
Figure 1 depicts the total capitalisation in these markets.
Figure 1: Market capitalisation of REITs listed in Japan, Singapore and Hong Kong between 2002 – 2016. Source: Author's
calculations
Given the growing significance of the sector, portfolio managers and other investors would benefit from greater
insight into the driving factors and risk exposures inherent to these markets. While a considerable amount of
research exists for Western REIT markets, relatively less attention has been devoted to the emerging Asian
markets.
0
50
100
150
200
250
Jan
-02
Au
g-0
2
Mar
-03
Oct
-03
May
-04
De
c-0
4
Jul-
05
Feb
-06
Sep
-06
Ap
r-0
7
No
v-0
7
Jun
-08
Jan
-09
Au
g-0
9
Mar
-10
Oct
-10
May
-11
De
c-1
1
Jul-
12
Feb
-13
Sep
-13
Ap
r-1
4
No
v-1
4
Jun
-15
Jan
-16
Au
g-1
6
Mar
ket
Cap
ital
isat
ion
(U
SD $
Bn
)
J-REITs SG-REITs HK-REITs
REAL ESTATE AND LAND PLANNING 2018
Available online at https://ejournals.lib.auth.gr/reland
157
This study aims to address this shortcoming. By combining modern portfolio theory with well established
econometric methods, this study seeks to examine the returns generating process for Asian REITs listed on the
major markets of Singapore, Hong Kong and Japan. The findings indicate that Singaporean REITs posses more
equity-like (as opposed to bond-like) characteristics. They are also not an effective hedge against inflation and
have a negative exposure to interest rate risk. By contrast, Hong Kong REITs exhibit more defensive qualities and
resemble fixed income securities in terms of risk profile. They are an effective hedge against inflation and are not
exposed to interest rate risk. Evidence from the Japanese market however, is less clear. Japanese REITs do not
appear to suffer from inflation risk but are negatively exposed to interest rate risk.
In addition to these findings, there is a high degree of inter-relatedness between Asian REIT markets limiting the
possibility of risk mitigation through portfolio diversification however the defensive nature of HK-REITs may
provide some benefit in this regard. The remainder of this study is structured as follows: Section 2 provides a
review of literature. Data and methodology are discussed in sections 3 and 4 respectively. Results are presented in
section 5 and section 6 concludes.
2 Literature review
The returns generating process that govern the behaviour of REITs has been the focus of much investigation in
recent years (Chan, Hendershott and Sanders, 1990; Peterson and Hsieh, 1997; Karolyi and Sanders, 1998;
Glascock, Lu and So, 2000; Glascock and Lu-Andrews, 2014). These studies have applied various theories of
modern portfolio analysis and their associated econometric tests to reach conclusions as diverse as the methods
used to ascertain them. To provide a complete epistemology would be beyond the scope of this paper. However
the following section attempts to provide a brief distillation of key findings in particular as they relate to the
objectives of the current study.
A common theme underlying much of the existing research is the exact nature and/or classification of REITs as an
asset class. On the one hand, REITs exhibit characteristics that align them to fixed income securities such as bonds,
government securities and other yield bearing instruments (Cheong, Gerlach, Stevenson, Wilson, Zurbregg, 2009;
McMahan, 1994). This comparison is based on the regularity and magnitude of distributions paid to shareholders,
which occurs by virtue of the regulatory environment. In many jurisdictions, REITs are required to pay a substantial
portion of their income as dividends1. In others, undistributed income is taxed at high marginal rates creating a
natural incentive for full distribution2.
In other cases, REITs have exhibited characteristics more consistent with common equity. Glascock, Lu and So
(2000) and Glascock and Lu-Andrews (2014) for example, argue that by acting as perverse inflation hedges, REITs
have evolved to assimilate stock market features. Their findings have been corroborated by other studies (Gyourko
and Linneman, 1988; Goebel and Kim, 1989; Titman and Warga, 1989; Park et al., 1990; Chen et al., 1990; Liu et al.,
1997).
This distinction (between fixed income and common equity) is important as it determines the nature and degree to
which REITs are exposed to common risk factors. For example, an expectation that REITs are driven by excess
market returns is based on the degree to which they behave as common equity. Similar arguments may be made
1 In the U.S. for example, REITs are required to payout 90 percent of their income as dividends 2 In Australia, undistributed income is taxed at the highest marginal rate of 46.5 percent (EPRA 2013)

REAL ESTATE AND LAND PLANNING 2018
Available online at https://ejournals.lib.auth.gr/reland
158
for exposure to other factors such as inflation (expected and unexpected), interest rates, credit spreads, default
premiums and industrial production to name a few.
Various studies have demonstrated a positive exposure to market indices (Mengden and Hartzell, 1986; Ross and
Zisler, 1987, 1991; Ennis and Burik, 1991; Gyourko and Keim, 1992; Liu and Mei, 1992; Li and Wang, 1995; Peterson
and Hsieh, 1997; Karolyi and Sanders, 1998; Li and Wang, 1995). Chan, Hendershott and Sanders (1990) apply a
multifactor arbitrage pricing model to the cross section of REIT index returns and determine that exposure to
market returns, unexpected inflation and the term structure of interest rates explain approximately 60 percent of
variation. Peterson and Hsieh (1997) find evidence of a relationship between REIT returns and market returns as
well as common risk factors such as size and value (as measured by book-to-market equity). Utilizing a multi-beta
asset pricing model, Karolyi and Sanders (1998) find that "stock market and term structure risk premium variables
are important for REIT returns, which (they) interpret as evidence of REITs as a hybrid of stocks and bonds in terms
of their risk exposures" (p.246).
Another commonly explored theme is the effect of inflation. The Fisher equation predicts that the real rate of
return on an asset is equal to its nominal rate less inflation. That is, any increases (reductions) to inflation must be
met with a commensurate increase (reduction) to nominal returns if the real rate of return is to be maintained.
However, this link (between returns and inflation) is dependent on asset class. Fama and Schwert (1977)
demonstrate that fixed income securities such as bonds and government securities were a complete hedge against
expected inflation while private residential real estate was a complete hedge against both expected and
unexpected inflation. Conversely, common stocks were negatively related to expected inflation and "probably also
to the unexpected component" (p.115).
Therefore, positive correlations with inflation measures suggest defensive properties comparable to fixed income
securities while the opposite implies greater similarity to common stocks. Given the underlying assets of REITs are
primarily real estate, it may not be unreasonable to assume REITs possess inflation hedging properties. However,
evidence from the literature indicate they do not (Gyourko and Linneman, 1988; Goebel and Kim, 1989; Titman
and Warga, 1989; Park et al., 1990; Chen et al., 1990; Liu et al., 1997).
Glascock, Lu and So (2002) argue that inflation itself is a proxy for shifts in monetary policy. As they explain: "The
observed negative relationship between REIT returns and inflation is merely a manifestation of the effects of
changes in monetary policy" (p. 302). Glascock and Lu-Andrews (2014) further demonstrate that changes to
funding liquidity, which may be brought about by changes to monetary policy significantly affects market-wide
liquidity flowing through as negative shocks to stock returns.
One final set of effects which are commonly examined in the literature is the impact of interest rates. One possible
explanation is based on the discount rate. In principle, stock prices may be written as a function of discounted
dividends: 𝑝 = 𝑓(𝐸(𝑐) 𝑟⁄ ) where c represents a dividend stream and r is the discount rate. A higher interest rate
lowers the present value of future dividends placing downward pressure on prices and hence returns. Cheong et
al. (2009) offer a more direct explanation. By examining the balance sheet of Equity and Mortgage REITs in the
U.S., they find that long term debt represents approximately 40-50 percent of total liabilities. Therefore rising
interest rates increase the cost of debt which significantly impacts cash flows.
Other studies highlight the importance of credit spreads (between long and short term interest rates). A narrowing
spread which could be an indication of impending economic stress could negatively impact fund performance.
During crisis episodes such as recessions, central banks are expected to lower interest rates. In such an
environment, investors may prefer a steady income stream such as those offered by long term bonds. The
resultant increase in demand for long term bonds bids up their prices and reduces yield flattening the yield curve.
REAL ESTATE AND LAND PLANNING 2018
Available online at https://ejournals.lib.auth.gr/reland
159
In summary, studies of REITs and the process by which they generate returns are varied and their findings are
diverse. Measures of market return, inflation and interest rates hold particular interest within the extant literature.
The current programme of research is thus motivated by these findings.
3 Data
This study examines the REIT sectors of Singapore, Hong Kong and Japan between 2002 and 2016. Data from
earlier periods were unavailable as REITs were not common in Asian markets prior to 2002. Furthermore, data
from the Hong Kong market was only available from 2006 onwards. Nevertheless, this sample period spans all
phases of the economic cycle from robust growth in the early 2000's through the global financial crisis (GFC) of
2007-09 and subsequent recovery in the post-GFC era thus providing a rich source of financial information.
As the previous section explains, variables relating to market returns, inflation and interest rates have been found
to possess explanatory power in determining REIT returns. For the purposes of this study, market returns for the
Singaporean, Japanese and Hong Kong markets were measured using the straits times index (STI), Nikkei index and
Hang Seng index respectively. Inflation was derived from CPI figures and long term interest rates were measured
via the 10 year government bond yield. Additionally, unemployment was measured using the unemployment rate
and national production was measured using gross domestic production. These variables are a matter of public
record and easily accessible through the relevant statistical/data collection agencies.
Total returns indices (TRI) were used to measure individual REIT returns. Such indices were selected because they
not only calculate changes to adjusted closing prices but also incorporate distributions paid to shareholders to
compute a theoretical growth in value to share holdings. Value weighted total returns indices were used to
measure returns to the REIT sector. Individual market capitalisation rates as a proportion of total capitalisation in
the sector were used as weights. All financial and accounting variables were available at monthly frequency and
obtained via Datastream (provided by Thomson Reuters). Several filtering conditions were applied to ensure data
integrity. Funds with less than 24 months of available data were removed to avoid small sample bias. Additionally,
funds with less than SGD100M, HKD500M and JPY(¥)10Bn in market capitalisation were not considered.
Annualised summary measures of selected variables for the Singaporean, Japanese and Hong Kong market are
depicted in Tables 1 - 3.
REAL ESTATE AND LAND PLANNING 2018
Available online at https://ejournals.lib.auth.gr/reland
160
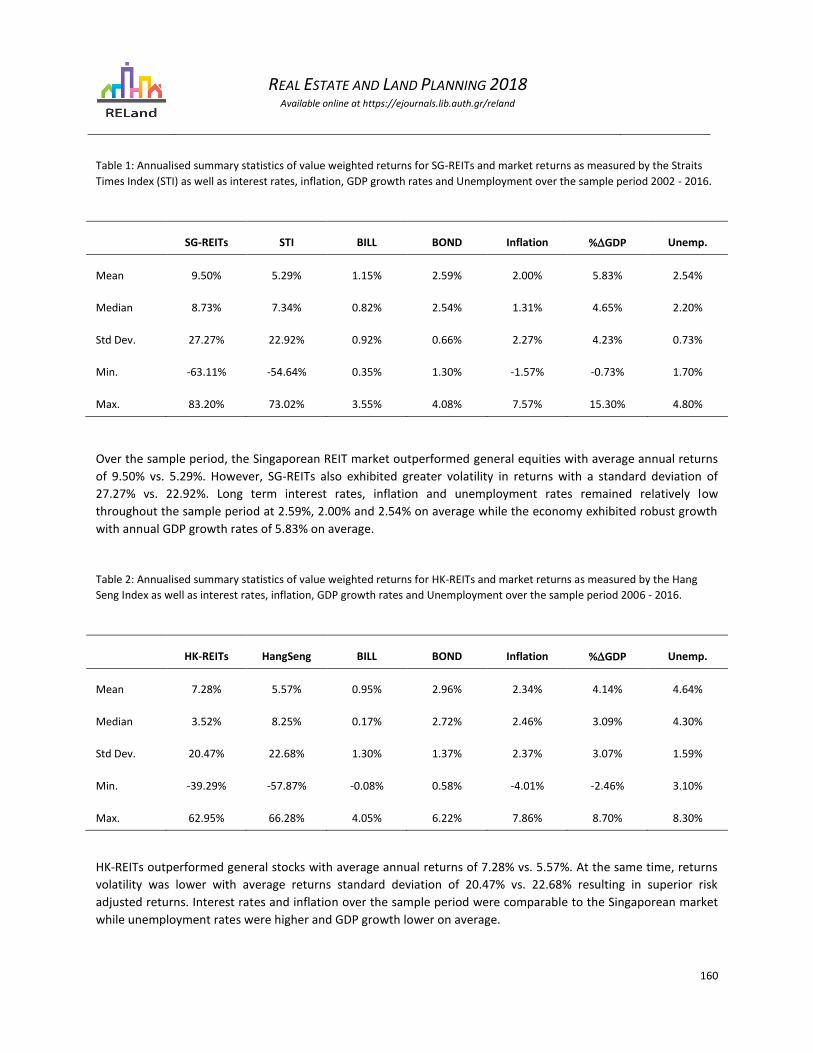
Table 1: Annualised summary statistics of value weighted returns for SG-REITs and market returns as measured by the Straits
Times Index (STI) as well as interest rates, inflation, GDP growth rates and Unemployment over the sample period 2002 - 2016.
SG-REITs STI BILL BOND Inflation %GDP Unemp.
Mean 9.50% 5.29% 1.15% 2.59% 2.00% 5.83% 2.54%
Median 8.73% 7.34% 0.82% 2.54% 1.31% 4.65% 2.20%
Std Dev. 27.27% 22.92% 0.92% 0.66% 2.27% 4.23% 0.73%
Min. -63.11% -54.64% 0.35% 1.30% -1.57% -0.73% 1.70%
Max. 83.20% 73.02% 3.55% 4.08% 7.57% 15.30% 4.80%
Over the sample period, the Singaporean REIT market outperformed general equities with average annual returns
of 9.50% vs. 5.29%. However, SG-REITs also exhibited greater volatility in returns with a standard deviation of
27.27% vs. 22.92%. Long term interest rates, inflation and unemployment rates remained relatively low
throughout the sample period at 2.59%, 2.00% and 2.54% on average while the economy exhibited robust growth
with annual GDP growth rates of 5.83% on average.
Table 2: Annualised summary statistics of value weighted returns for HK-REITs and market returns as measured by the Hang
Seng Index as well as interest rates, inflation, GDP growth rates and Unemployment over the sample period 2006 - 2016.
HK-REITs HangSeng BILL BOND Inflation %GDP Unemp.
Mean 7.28% 5.57% 0.95% 2.96% 2.34% 4.14% 4.64%
Median 3.52% 8.25% 0.17% 2.72% 2.46% 3.09% 4.30%
Std Dev. 20.47% 22.68% 1.30% 1.37% 2.37% 3.07% 1.59%
Min. -39.29% -57.87% -0.08% 0.58% -4.01% -2.46% 3.10%
Max. 62.95% 66.28% 4.05% 6.22% 7.86% 8.70% 8.30%
HK-REITs outperformed general stocks with average annual returns of 7.28% vs. 5.57%. At the same time, returns
volatility was lower with average returns standard deviation of 20.47% vs. 22.68% resulting in superior risk
adjusted returns. Interest rates and inflation over the sample period were comparable to the Singaporean market
while unemployment rates were higher and GDP growth lower on average.
REAL ESTATE AND LAND PLANNING 2018
Available online at https://ejournals.lib.auth.gr/reland
161
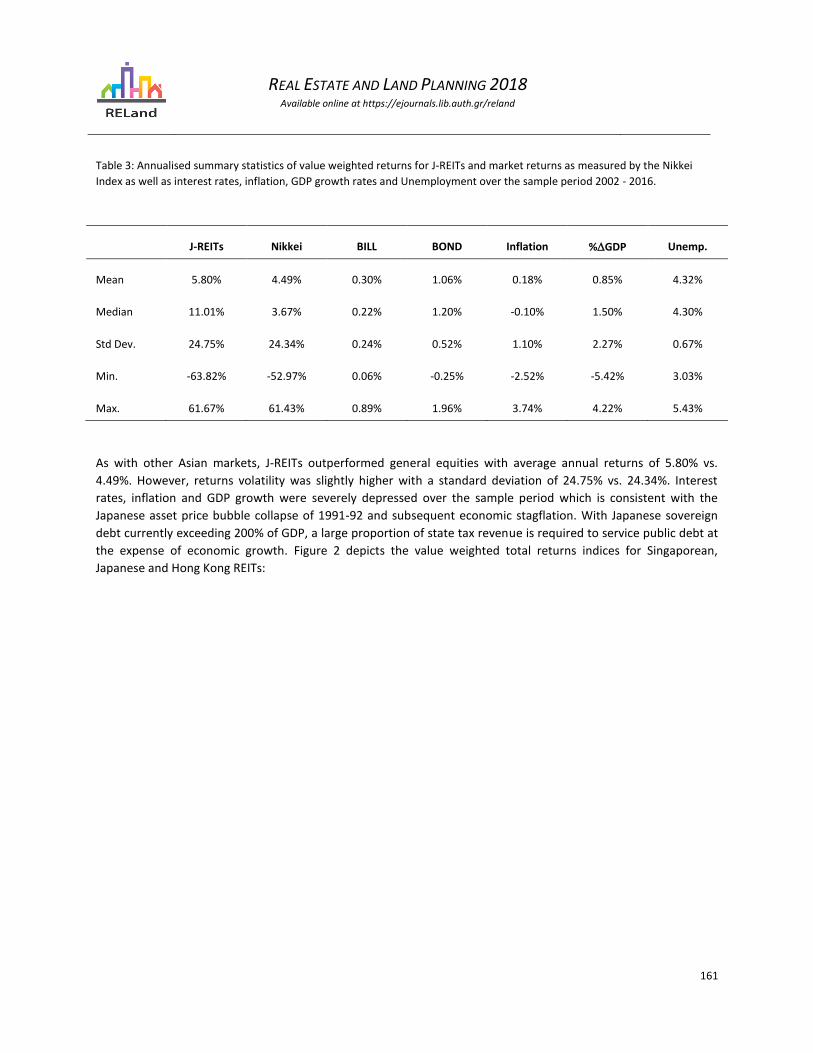
Table 3: Annualised summary statistics of value weighted returns for J-REITs and market returns as measured by the Nikkei
Index as well as interest rates, inflation, GDP growth rates and Unemployment over the sample period 2002 - 2016.
J-REITs Nikkei BILL BOND Inflation %GDP Unemp.
Mean 5.80% 4.49% 0.30% 1.06% 0.18% 0.85% 4.32%
Median 11.01% 3.67% 0.22% 1.20% -0.10% 1.50% 4.30%
Std Dev. 24.75% 24.34% 0.24% 0.52% 1.10% 2.27% 0.67%
Min. -63.82% -52.97% 0.06% -0.25% -2.52% -5.42% 3.03%
Max. 61.67% 61.43% 0.89% 1.96% 3.74% 4.22% 5.43%
As with other Asian markets, J-REITs outperformed general equities with average annual returns of 5.80% vs.
4.49%. However, returns volatility was slightly higher with a standard deviation of 24.75% vs. 24.34%. Interest
rates, inflation and GDP growth were severely depressed over the sample period which is consistent with the
Japanese asset price bubble collapse of 1991-92 and subsequent economic stagflation. With Japanese sovereign
debt currently exceeding 200% of GDP, a large proportion of state tax revenue is required to service public debt at
the expense of economic growth. Figure 2 depicts the value weighted total returns indices for Singaporean,
Japanese and Hong Kong REITs:
REAL ESTATE AND LAND PLANNING 2018
Available online at https://ejournals.lib.auth.gr/reland
162
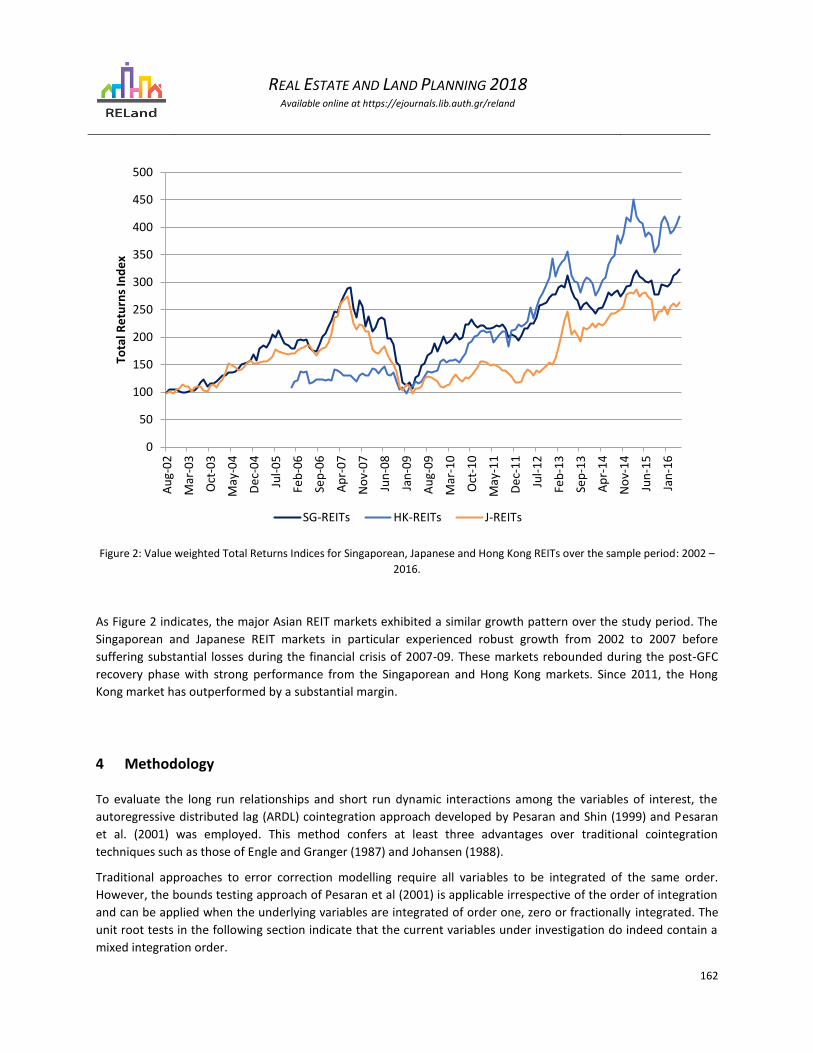
Figure 2: Value weighted Total Returns Indices for Singaporean, Japanese and Hong Kong REITs over the sample period: 2002 –
2016.
As Figure 2 indicates, the major Asian REIT markets exhibited a similar growth pattern over the study period. The
Singaporean and Japanese REIT markets in particular experienced robust growth from 2002 to 2007 before
suffering substantial losses during the financial crisis of 2007-09. These markets rebounded during the post-GFC
recovery phase with strong performance from the Singaporean and Hong Kong markets. Since 2011, the Hong
Kong market has outperformed by a substantial margin.
4 Methodology
To evaluate the long run relationships and short run dynamic interactions among the variables of interest, the
autoregressive distributed lag (ARDL) cointegration approach developed by Pesaran and Shin (1999) and Pesaran
et al. (2001) was employed. This method confers at least three advantages over traditional cointegration
techniques such as those of Engle and Granger (1987) and Johansen (1988).
Traditional approaches to error correction modelling require all variables to be integrated of the same order.
However, the bounds testing approach of Pesaran et al (2001) is applicable irrespective of the order of integration
and can be applied when the underlying variables are integrated of order one, zero or fractionally integrated. The
unit root tests in the following section indicate that the current variables under investigation do indeed contain a
mixed integration order.
0
50
100
150
200
250
300
350
400
450
500A
ug-
02
Mar
-03
Oct
-03
May
-04
De
c-0
4
Jul-
05
Feb
-06
Sep
-06
Ap
r-0
7
No
v-0
7
Jun
-08
Jan
-09
Au
g-0
9
Mar
-10
Oct
-10
May
-11
De
c-1
1
Jul-
12
Feb
-13
Sep
-13
Ap
r-1
4
No
v-1
4
Jun
-15
Jan
-16
Tota
l Re
turn
s In
de
x
SG-REITs HK-REITs J-REITs
REAL ESTATE AND LAND PLANNING 2018
Available online at https://ejournals.lib.auth.gr/reland
163
The second advantage is that the ARDL test is relatively more efficient in the case of small and finite sample sizes.
By contrast, the approaches of Johansen (1988) and Johansen and Jusellius (1992) for example, are based on the
asymptotical efficiency of maximum likelihood estimation. When these procedures are applied to relatively small
sample sizes, the resultant parameter estimates are subject to small sample bias. The third advantage of the ARDL
technique is that long run parameter estimates are unbiased (Harris and Sollis, 2003).
By way of summary, the ARDL bounds testing approach involves several key steps. The first is to test for the
presence of unit roots in the variables. As previously mentioned, the ARDL approach may be applied to variables
with a mixed order of integration however, none of the variables may be integrated of order 2 or higher. The next
stage involves the formulation of an unrestricted/unconstrained error correction model3 (ECM), which refers to
the fact that the error correction term in a conventional ECM is replaced with one period lagged variables without
restriction of coefficients. The third step is to determine the appropriate lag structure for the model. Various
'information criteria' may be used such as the Akaike Information Criteria (AIC), Schwarz/Bayes criteria (SC),
Hannan-Quinn information criteria (HQ), etc. These criteria are based on a high log-likelihood value, with a
'penalty' for additional lags. The SC tends to favour more parsimonious model specifications while the AIC typically
suggests more lags.
Once the serial independence of errors have been established, bounds testing may proceed. Note that serial
independence is required for parameter estimates to be consistent. The bounds testing is in effect, a coefficient
restriction test on the (long run) lagged variables. If the null hypothesis (that the coefficients are zero) is rejected,
then a long run relationship may be assumed to exist between the variables. Note that exact critical values for the
F-test for an arbitrary mix of I(0) and I(1) variables are not available however, Pesaran et al. (2001) supply bounds
on the critical values.
Assuming the bounds testing confirms the presence of cointegration, a long run model may be estimated in 'levels'
via OLS. The lagged residuals from this may subsequently be used as an error correction term (ECT) in the
'restricted' ECM which is also estimated via OLS. The coefficient of the ECT may then be interpreted as the 'speed
of adjustment', which measures how quickly the system returns to equilibrium following a short run shock. The
coefficient estimates from the long run variables in the unrestricted ECM may also be used to derive implied long
run coefficients.
3 Pesaran et al. (2001) refer to this as a 'conditional ECM'
REAL ESTATE AND LAND PLANNING 2018
Available online at https://ejournals.lib.auth.gr/reland
164
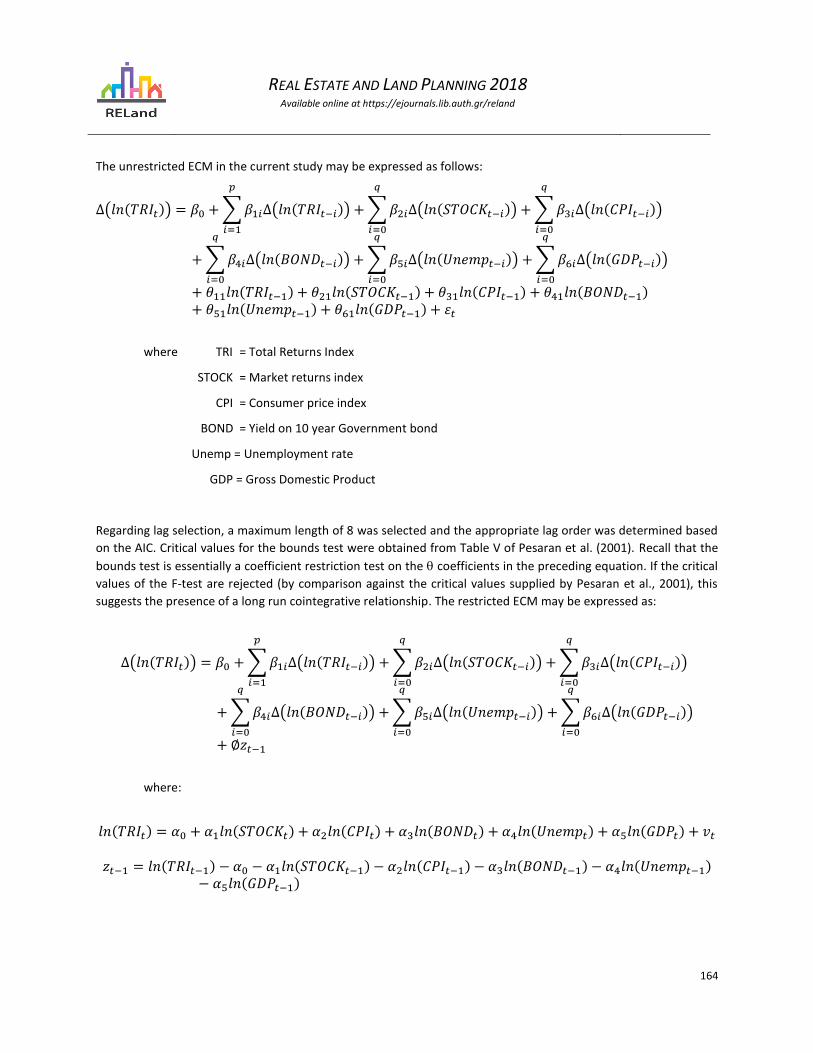
The unrestricted ECM in the current study may be expressed as follows:
∆(𝑙𝑛(𝑇𝑅𝐼𝑡)) = 𝛽0 +∑𝛽1𝑖∆(𝑙𝑛(𝑇𝑅𝐼𝑡−𝑖))
𝑝
𝑖=1
+∑𝛽2𝑖∆(𝑙𝑛(𝑆𝑇𝑂𝐶𝐾𝑡−𝑖))
𝑞
𝑖=0
+∑𝛽3𝑖∆(𝑙𝑛(𝐶𝑃𝐼𝑡−𝑖))
𝑞
𝑖=0
+∑𝛽4𝑖∆(𝑙𝑛(𝐵𝑂𝑁𝐷𝑡−𝑖))
𝑞
𝑖=0
+∑𝛽5𝑖∆(𝑙𝑛(𝑈𝑛𝑒𝑚𝑝𝑡−𝑖))
𝑞
𝑖=0
+∑𝛽6𝑖∆(𝑙𝑛(𝐺𝐷𝑃𝑡−𝑖))
𝑞
𝑖=0
+ 𝜃11𝑙𝑛(𝑇𝑅𝐼𝑡−1) + 𝜃21𝑙𝑛(𝑆𝑇𝑂𝐶𝐾𝑡−1) + 𝜃31𝑙𝑛(𝐶𝑃𝐼𝑡−1) + 𝜃41𝑙𝑛(𝐵𝑂𝑁𝐷𝑡−1)+ 𝜃51𝑙𝑛(𝑈𝑛𝑒𝑚𝑝𝑡−1) + 𝜃61𝑙𝑛(𝐺𝐷𝑃𝑡−1) + 𝜀𝑡
where TRI = Total Returns Index
STOCK = Market returns index
CPI = Consumer price index
BOND = Yield on 10 year Government bond
Unemp = Unemployment rate
GDP = Gross Domestic Product
Regarding lag selection, a maximum length of 8 was selected and the appropriate lag order was determined based
on the AIC. Critical values for the bounds test were obtained from Table V of Pesaran et al. (2001). Recall that the
bounds test is essentially a coefficient restriction test on the coefficients in the preceding equation. If the critical
values of the F-test are rejected (by comparison against the critical values supplied by Pesaran et al., 2001), this
suggests the presence of a long run cointegrative relationship. The restricted ECM may be expressed as:
∆(𝑙𝑛(𝑇𝑅𝐼𝑡)) = 𝛽0 +∑𝛽1𝑖∆(𝑙𝑛(𝑇𝑅𝐼𝑡−𝑖))
𝑝
𝑖=1
+∑𝛽2𝑖∆(𝑙𝑛(𝑆𝑇𝑂𝐶𝐾𝑡−𝑖))
𝑞
𝑖=0
+∑𝛽3𝑖∆(𝑙𝑛(𝐶𝑃𝐼𝑡−𝑖))
𝑞
𝑖=0
+∑𝛽4𝑖∆(𝑙𝑛(𝐵𝑂𝑁𝐷𝑡−𝑖))
𝑞
𝑖=0
+∑𝛽5𝑖∆(𝑙𝑛(𝑈𝑛𝑒𝑚𝑝𝑡−𝑖))
𝑞
𝑖=0
+∑𝛽6𝑖∆(𝑙𝑛(𝐺𝐷𝑃𝑡−𝑖))
𝑞
𝑖=0
+ ∅𝑧𝑡−1
where:
𝑙𝑛(𝑇𝑅𝐼𝑡) = 𝛼0 + 𝛼1𝑙𝑛(𝑆𝑇𝑂𝐶𝐾𝑡) + 𝛼2𝑙𝑛(𝐶𝑃𝐼𝑡) + 𝛼3𝑙𝑛(𝐵𝑂𝑁𝐷𝑡) + 𝛼4𝑙𝑛(𝑈𝑛𝑒𝑚𝑝𝑡) + 𝛼5𝑙𝑛(𝐺𝐷𝑃𝑡) + 𝑣𝑡 𝑧𝑡−1 = 𝑙𝑛(𝑇𝑅𝐼𝑡−1) − 𝛼0 − 𝛼1𝑙𝑛(𝑆𝑇𝑂𝐶𝐾𝑡−1) − 𝛼2𝑙𝑛(𝐶𝑃𝐼𝑡−1) − 𝛼3𝑙𝑛(𝐵𝑂𝑁𝐷𝑡−1) − 𝛼4𝑙𝑛(𝑈𝑛𝑒𝑚𝑝𝑡−1)
− 𝛼5𝑙𝑛(𝐺𝐷𝑃𝑡−1)
REAL ESTATE AND LAND PLANNING 2018
Available online at https://ejournals.lib.auth.gr/reland
165
The parameter may be interpreted as the 'speed of adjustment'. This estimation procedure was applied to the
three Asian REIT markets under investigation: Singapore, Hong Kong and Japan. Empirical results are presented in
the following section.
5 Results
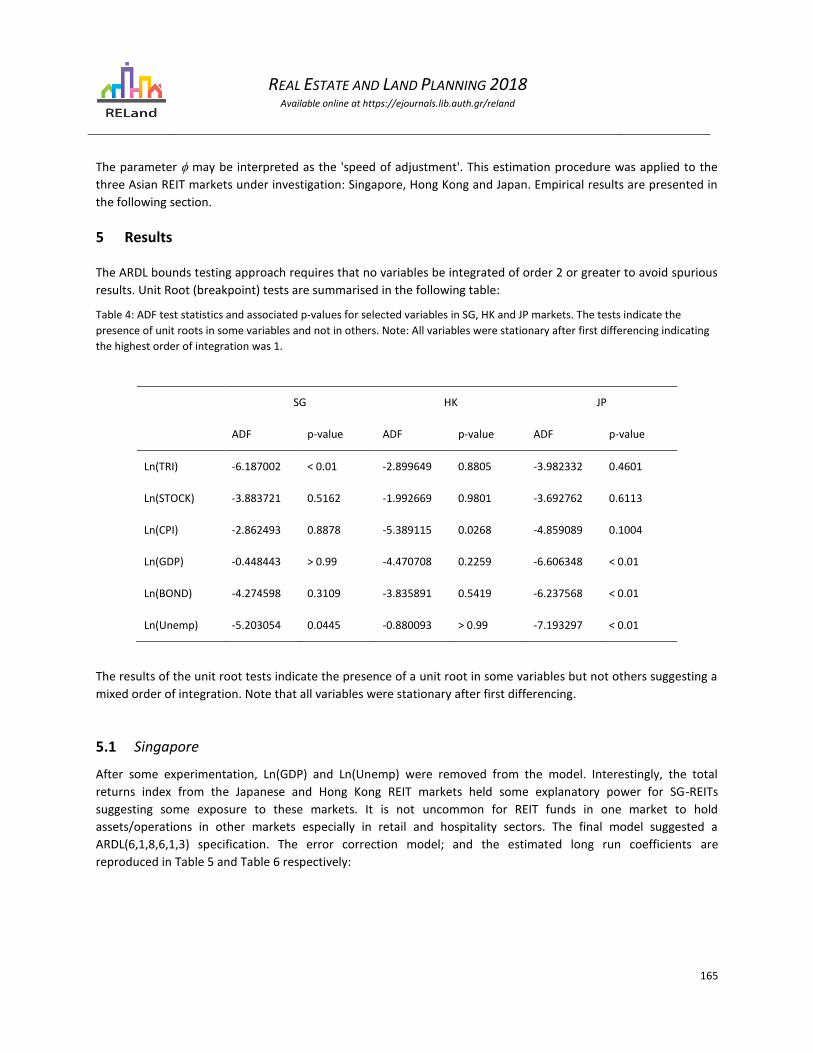
The ARDL bounds testing approach requires that no variables be integrated of order 2 or greater to avoid spurious
results. Unit Root (breakpoint) tests are summarised in the following table:
Table 4: ADF test statistics and associated p-values for selected variables in SG, HK and JP markets. The tests indicate the
presence of unit roots in some variables and not in others. Note: All variables were stationary after first differencing indicating
the highest order of integration was 1.
SG HK JP
ADF p-value ADF p-value ADF p-value
Ln(TRI) -6.187002 < 0.01 -2.899649 0.8805 -3.982332 0.4601
Ln(STOCK) -3.883721 0.5162 -1.992669 0.9801 -3.692762 0.6113
Ln(CPI) -2.862493 0.8878 -5.389115 0.0268 -4.859089 0.1004
Ln(GDP) -0.448443 > 0.99 -4.470708 0.2259 -6.606348 < 0.01
Ln(BOND) -4.274598 0.3109 -3.835891 0.5419 -6.237568 < 0.01
Ln(Unemp) -5.203054 0.0445 -0.880093 > 0.99 -7.193297 < 0.01
The results of the unit root tests indicate the presence of a unit root in some variables but not others suggesting a
mixed order of integration. Note that all variables were stationary after first differencing.
5.1 Singapore
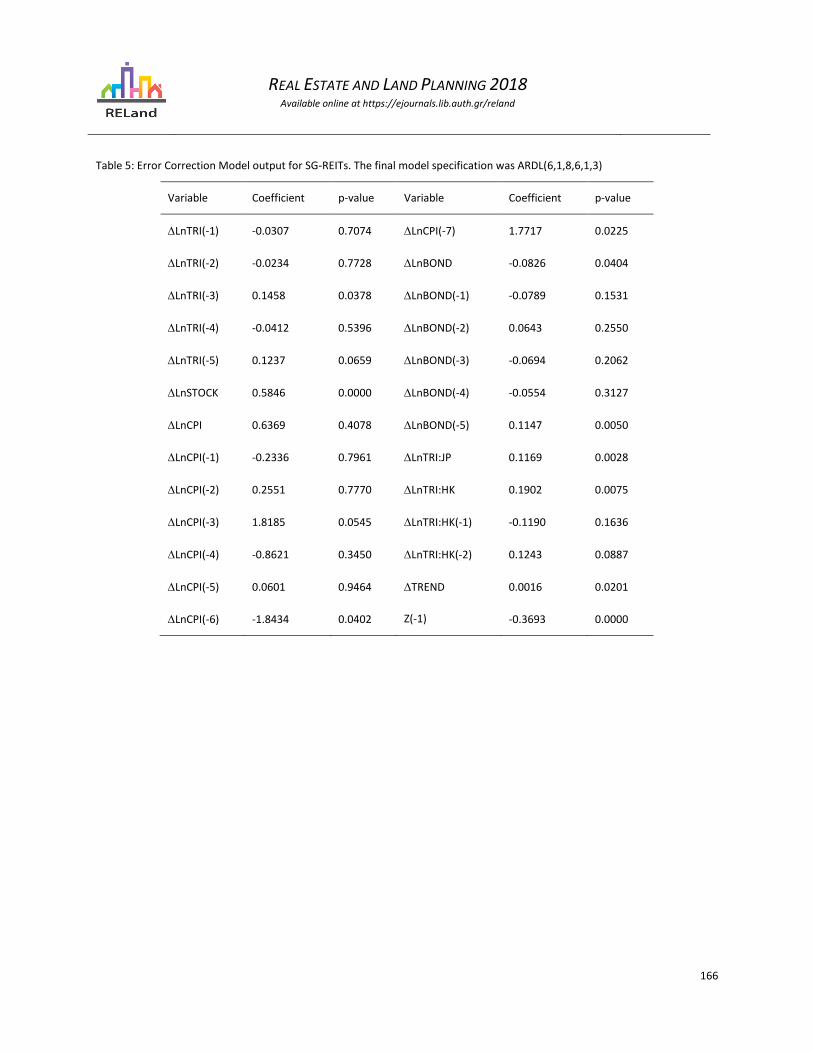
After some experimentation, Ln(GDP) and Ln(Unemp) were removed from the model. Interestingly, the total
returns index from the Japanese and Hong Kong REIT markets held some explanatory power for SG-REITs
suggesting some exposure to these markets. It is not uncommon for REIT funds in one market to hold
assets/operations in other markets especially in retail and hospitality sectors. The final model suggested a
ARDL(6,1,8,6,1,3) specification. The error correction model; and the estimated long run coefficients are
reproduced in Table 5 and Table 6 respectively:
REAL ESTATE AND LAND PLANNING 2018
Available online at https://ejournals.lib.auth.gr/reland
166
Table 5: Error Correction Model output for SG-REITs. The final model specification was ARDL(6,1,8,6,1,3)
Variable Coefficient p-value Variable Coefficient p-value
LnTRI(-1) -0.0307 0.7074 LnCPI(-7) 1.7717 0.0225
LnTRI(-2) -0.0234 0.7728 LnBOND -0.0826 0.0404
LnTRI(-3) 0.1458 0.0378 LnBOND(-1) -0.0789 0.1531
LnTRI(-4) -0.0412 0.5396 LnBOND(-2) 0.0643 0.2550
LnTRI(-5) 0.1237 0.0659 LnBOND(-3) -0.0694 0.2062
LnSTOCK 0.5846 0.0000 LnBOND(-4) -0.0554 0.3127
LnCPI 0.6369 0.4078 LnBOND(-5) 0.1147 0.0050
LnCPI(-1) -0.2336 0.7961 LnTRI:JP 0.1169 0.0028
LnCPI(-2) 0.2551 0.7770 LnTRI:HK 0.1902 0.0075
LnCPI(-3) 1.8185 0.0545 LnTRI:HK(-1) -0.1190 0.1636
LnCPI(-4) -0.8621 0.3450 LnTRI:HK(-2) 0.1243 0.0887
LnCPI(-5) 0.0601 0.9464 TREND 0.0016 0.0201
LnCPI(-6) -1.8434 0.0402 Z(-1) -0.3693 0.0000
REAL ESTATE AND LAND PLANNING 2018
Available online at https://ejournals.lib.auth.gr/reland
167
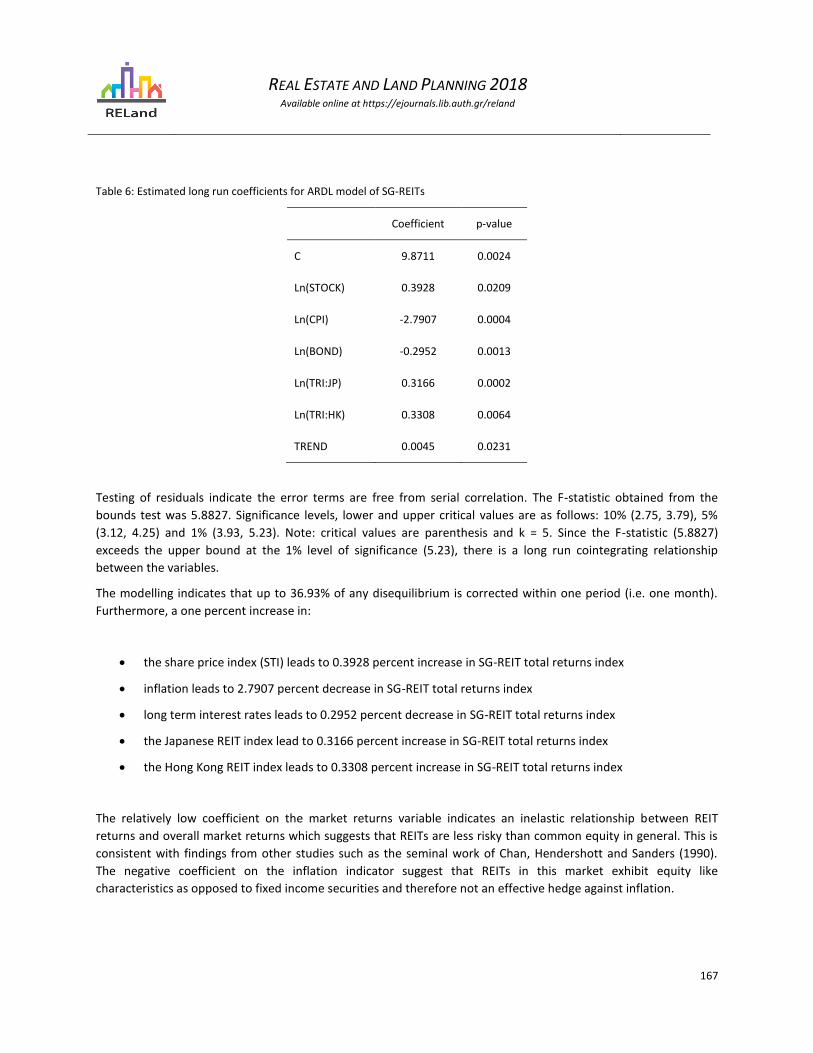
Table 6: Estimated long run coefficients for ARDL model of SG-REITs
Coefficient p-value
C 9.8711 0.0024
Ln(STOCK) 0.3928 0.0209
Ln(CPI) -2.7907 0.0004
Ln(BOND) -0.2952 0.0013
Ln(TRI:JP) 0.3166 0.0002
Ln(TRI:HK) 0.3308 0.0064
TREND 0.0045 0.0231
Testing of residuals indicate the error terms are free from serial correlation. The F-statistic obtained from the
bounds test was 5.8827. Significance levels, lower and upper critical values are as follows: 10% (2.75, 3.79), 5%
(3.12, 4.25) and 1% (3.93, 5.23). Note: critical values are parenthesis and k = 5. Since the F-statistic (5.8827)
exceeds the upper bound at the 1% level of significance (5.23), there is a long run cointegrating relationship
between the variables.
The modelling indicates that up to 36.93% of any disequilibrium is corrected within one period (i.e. one month).
Furthermore, a one percent increase in:
• the share price index (STI) leads to 0.3928 percent increase in SG-REIT total returns index
• inflation leads to 2.7907 percent decrease in SG-REIT total returns index
• long term interest rates leads to 0.2952 percent decrease in SG-REIT total returns index
• the Japanese REIT index lead to 0.3166 percent increase in SG-REIT total returns index
• the Hong Kong REIT index leads to 0.3308 percent increase in SG-REIT total returns index
The relatively low coefficient on the market returns variable indicates an inelastic relationship between REIT
returns and overall market returns which suggests that REITs are less risky than common equity in general. This is
consistent with findings from other studies such as the seminal work of Chan, Hendershott and Sanders (1990).
The negative coefficient on the inflation indicator suggest that REITs in this market exhibit equity like
characteristics as opposed to fixed income securities and therefore not an effective hedge against inflation.
REAL ESTATE AND LAND PLANNING 2018
Available online at https://ejournals.lib.auth.gr/reland
168
The significance of the BOND variable suggests that SG-REITs may be exposed to interest rate risk. Historically, the
Monetary Authority of Singapore (MAS) imposed borrowing limits of 35% and up to 60% for funds with strong
credit rating. However, to strengthen REIT performance, in Oct 2014 the MAS lifted borrowing restrictions to 45%
and removed the cap for funds with strong credit rating (Monetary Authority of Singapore, 2017). As a result,
average gearing levels4 have gradually increased from approximately 30% to 40% by the end of 2016. These
findings are broadly consistent with Liow and Huang (2006) who demonstrate that Asian property stocks are
sensitive to interest rate movements.
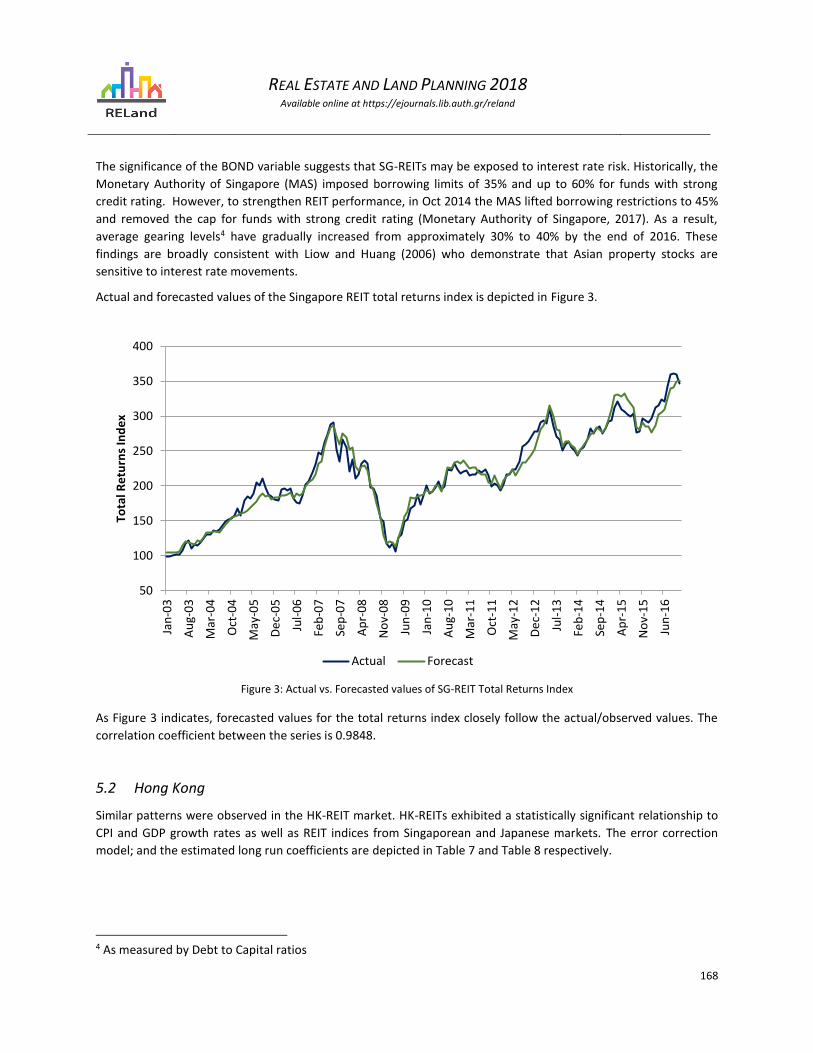
Actual and forecasted values of the Singapore REIT total returns index is depicted in Figure 3.
Figure 3: Actual vs. Forecasted values of SG-REIT Total Returns Index
As Figure 3 indicates, forecasted values for the total returns index closely follow the actual/observed values. The
correlation coefficient between the series is 0.9848.
5.2 Hong Kong
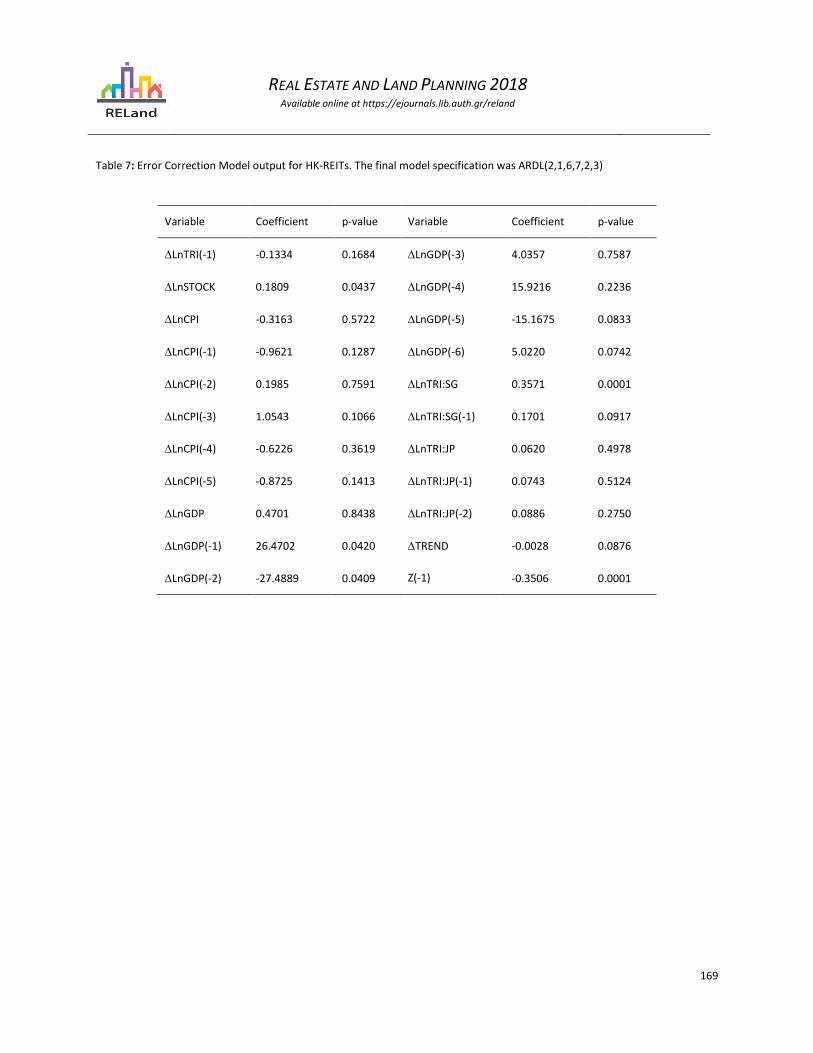
Similar patterns were observed in the HK-REIT market. HK-REITs exhibited a statistically significant relationship to
CPI and GDP growth rates as well as REIT indices from Singaporean and Japanese markets. The error correction
model; and the estimated long run coefficients are depicted in Table 7 and Table 8 respectively.
4 As measured by Debt to Capital ratios
50
100
150
200
250
300
350
400
Jan
-03
Au
g-0
3
Mar
-04
Oct
-04
May
-05
De
c-0
5
Jul-
06
Feb
-07
Sep
-07
Ap
r-0
8
No
v-0
8
Jun
-09
Jan
-10
Au
g-1
0
Mar
-11
Oct
-11
May
-12
De
c-1
2
Jul-
13
Feb
-14
Sep
-14
Ap
r-1
5
No
v-1
5
Jun
-16
Tota
l Re
turn
s In
de
x
Actual Forecast
REAL ESTATE AND LAND PLANNING 2018
Available online at https://ejournals.lib.auth.gr/reland
169
Table 7: Error Correction Model output for HK-REITs. The final model specification was ARDL(2,1,6,7,2,3)
Variable Coefficient p-value Variable Coefficient p-value
LnTRI(-1) -0.1334 0.1684 LnGDP(-3) 4.0357 0.7587
LnSTOCK 0.1809 0.0437 LnGDP(-4) 15.9216 0.2236
LnCPI -0.3163 0.5722 LnGDP(-5) -15.1675 0.0833
LnCPI(-1) -0.9621 0.1287 LnGDP(-6) 5.0220 0.0742
LnCPI(-2) 0.1985 0.7591 LnTRI:SG 0.3571 0.0001
LnCPI(-3) 1.0543 0.1066 LnTRI:SG(-1) 0.1701 0.0917
LnCPI(-4) -0.6226 0.3619 LnTRI:JP 0.0620 0.4978
LnCPI(-5) -0.8725 0.1413 LnTRI:JP(-1) 0.0743 0.5124
LnGDP 0.4701 0.8438 LnTRI:JP(-2) 0.0886 0.2750
LnGDP(-1) 26.4702 0.0420 TREND -0.0028 0.0876
LnGDP(-2) -27.4889 0.0409 Z(-1) -0.3506 0.0001
REAL ESTATE AND LAND PLANNING 2018
Available online at https://ejournals.lib.auth.gr/reland
170
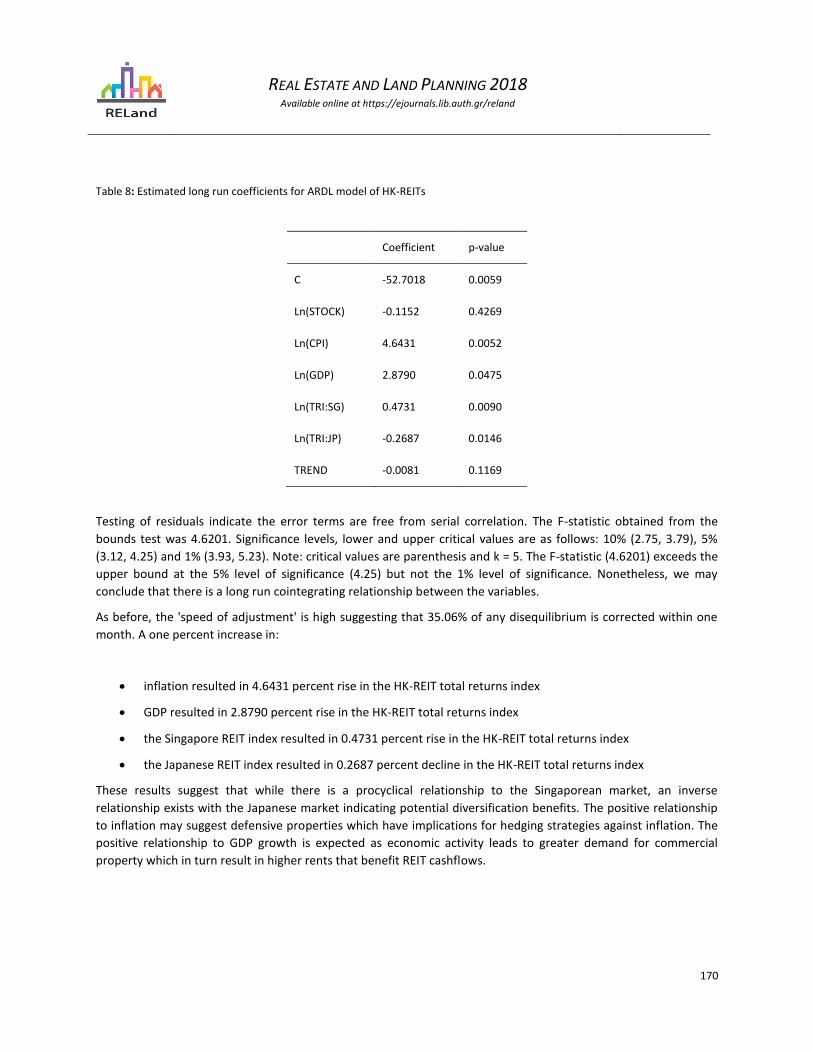
Table 8: Estimated long run coefficients for ARDL model of HK-REITs
Coefficient p-value
C -52.7018 0.0059
Ln(STOCK) -0.1152 0.4269
Ln(CPI) 4.6431 0.0052
Ln(GDP) 2.8790 0.0475
Ln(TRI:SG) 0.4731 0.0090
Ln(TRI:JP) -0.2687 0.0146
TREND -0.0081 0.1169
Testing of residuals indicate the error terms are free from serial correlation. The F-statistic obtained from the
bounds test was 4.6201. Significance levels, lower and upper critical values are as follows: 10% (2.75, 3.79), 5%
(3.12, 4.25) and 1% (3.93, 5.23). Note: critical values are parenthesis and k = 5. The F-statistic (4.6201) exceeds the
upper bound at the 5% level of significance (4.25) but not the 1% level of significance. Nonetheless, we may
conclude that there is a long run cointegrating relationship between the variables.
As before, the 'speed of adjustment' is high suggesting that 35.06% of any disequilibrium is corrected within one
month. A one percent increase in:
• inflation resulted in 4.6431 percent rise in the HK-REIT total returns index
• GDP resulted in 2.8790 percent rise in the HK-REIT total returns index
• the Singapore REIT index resulted in 0.4731 percent rise in the HK-REIT total returns index
• the Japanese REIT index resulted in 0.2687 percent decline in the HK-REIT total returns index
These results suggest that while there is a procyclical relationship to the Singaporean market, an inverse
relationship exists with the Japanese market indicating potential diversification benefits. The positive relationship
to inflation may suggest defensive properties which have implications for hedging strategies against inflation. The
positive relationship to GDP growth is expected as economic activity leads to greater demand for commercial
property which in turn result in higher rents that benefit REIT cashflows.
REAL ESTATE AND LAND PLANNING 2018
Available online at https://ejournals.lib.auth.gr/reland
171
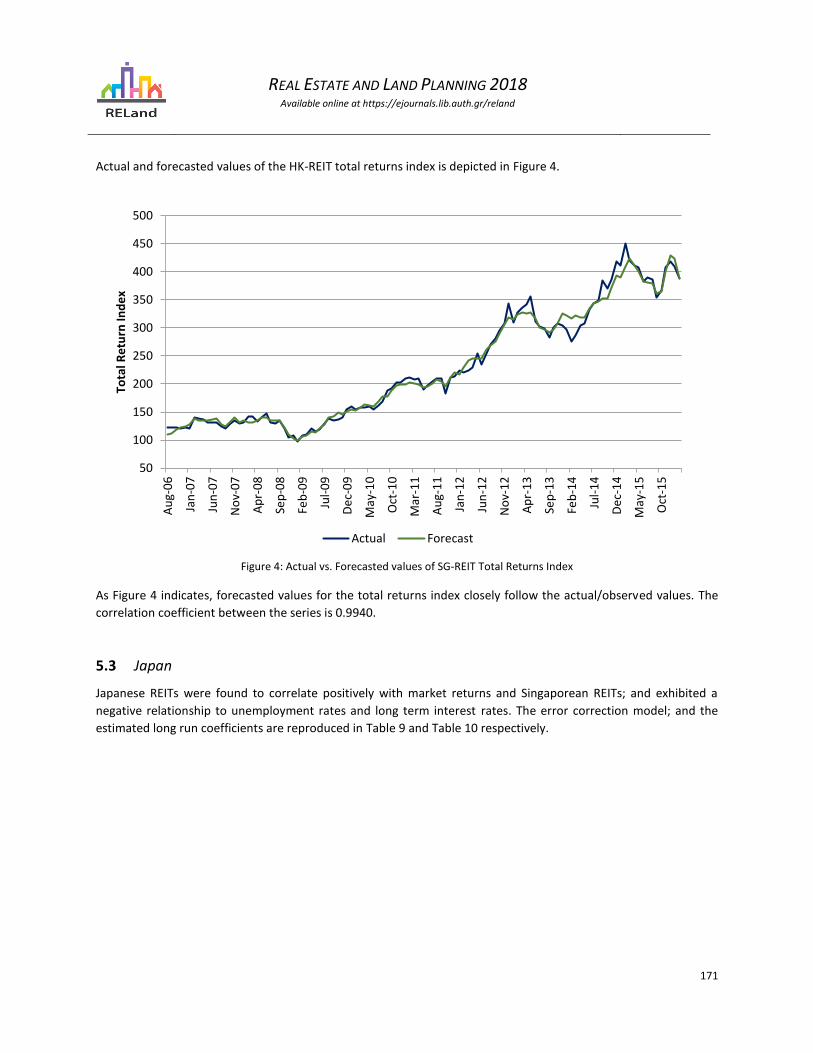
Actual and forecasted values of the HK-REIT total returns index is depicted in Figure 4.
Figure 4: Actual vs. Forecasted values of SG-REIT Total Returns Index
As Figure 4 indicates, forecasted values for the total returns index closely follow the actual/observed values. The
correlation coefficient between the series is 0.9940.
5.3 Japan
Japanese REITs were found to correlate positively with market returns and Singaporean REITs; and exhibited a
negative relationship to unemployment rates and long term interest rates. The error correction model; and the
estimated long run coefficients are reproduced in Table 9 and Table 10 respectively.
50
100
150
200
250
300
350
400
450
500
Au
g-0
6
Jan
-07
Jun
-07
No
v-0
7
Ap
r-0
8
Sep
-08
Feb
-09
Jul-
09
De
c-0
9
May
-10
Oct
-10
Mar
-11
Au
g-1
1
Jan
-12
Jun
-12
No
v-1
2
Ap
r-1
3
Sep
-13
Feb
-14
Jul-
14
De
c-1
4
May
-15
Oct
-15
Tota
l Re
turn
Ind
ex
Actual Forecast
REAL ESTATE AND LAND PLANNING 2018
Available online at https://ejournals.lib.auth.gr/reland
172
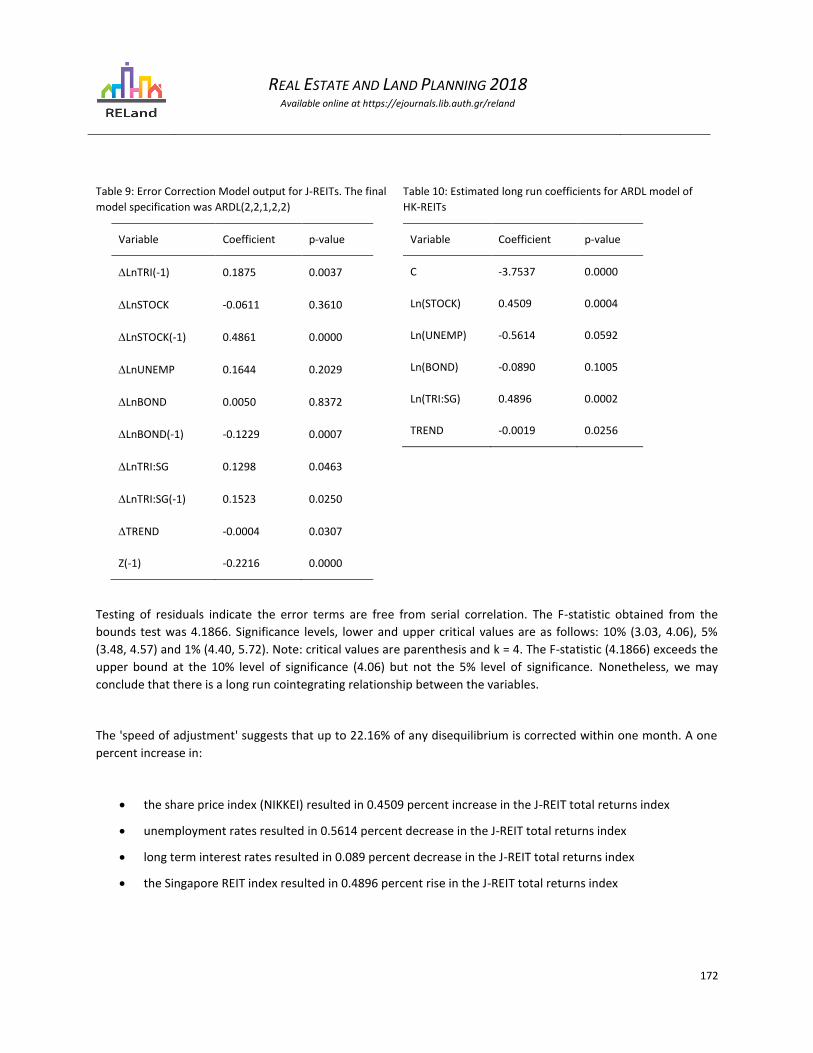
Table 9: Error Correction Model output for J-REITs. The final
model specification was ARDL(2,2,1,2,2)
Variable Coefficient p-value
LnTRI(-1) 0.1875 0.0037
LnSTOCK -0.0611 0.3610
LnSTOCK(-1) 0.4861 0.0000
LnUNEMP 0.1644 0.2029
LnBOND 0.0050 0.8372
LnBOND(-1) -0.1229 0.0007
LnTRI:SG 0.1298 0.0463
LnTRI:SG(-1) 0.1523 0.0250
TREND -0.0004 0.0307
Z(-1) -0.2216 0.0000
Table 10: Estimated long run coefficients for ARDL model of
HK-REITs
Variable Coefficient p-value
C -3.7537 0.0000
Ln(STOCK) 0.4509 0.0004
Ln(UNEMP) -0.5614 0.0592
Ln(BOND) -0.0890 0.1005
Ln(TRI:SG) 0.4896 0.0002
TREND -0.0019 0.0256
Testing of residuals indicate the error terms are free from serial correlation. The F-statistic obtained from the
bounds test was 4.1866. Significance levels, lower and upper critical values are as follows: 10% (3.03, 4.06), 5%
(3.48, 4.57) and 1% (4.40, 5.72). Note: critical values are parenthesis and k = 4. The F-statistic (4.1866) exceeds the
upper bound at the 10% level of significance (4.06) but not the 5% level of significance. Nonetheless, we may
conclude that there is a long run cointegrating relationship between the variables.
The 'speed of adjustment' suggests that up to 22.16% of any disequilibrium is corrected within one month. A one
percent increase in:
• the share price index (NIKKEI) resulted in 0.4509 percent increase in the J-REIT total returns index
• unemployment rates resulted in 0.5614 percent decrease in the J-REIT total returns index
• long term interest rates resulted in 0.089 percent decrease in the J-REIT total returns index
• the Singapore REIT index resulted in 0.4896 percent rise in the J-REIT total returns index
REAL ESTATE AND LAND PLANNING 2018
Available online at https://ejournals.lib.auth.gr/reland
173
As with the Singaporean market, J-REITs exhibited a statistically significant exposure to general equities however,
this relationship was relatively inelastic. J-REITs also exhibited a negative exposure to unemployment and long
term interest rates and were positively correlated to the SG-REITs limiting the possibility for diversification
benefits. Inflation risk was not a significant driver of J-REIT returns however this may be due to the relatively low
rates of inflation that prevailed over much of the modelling period.
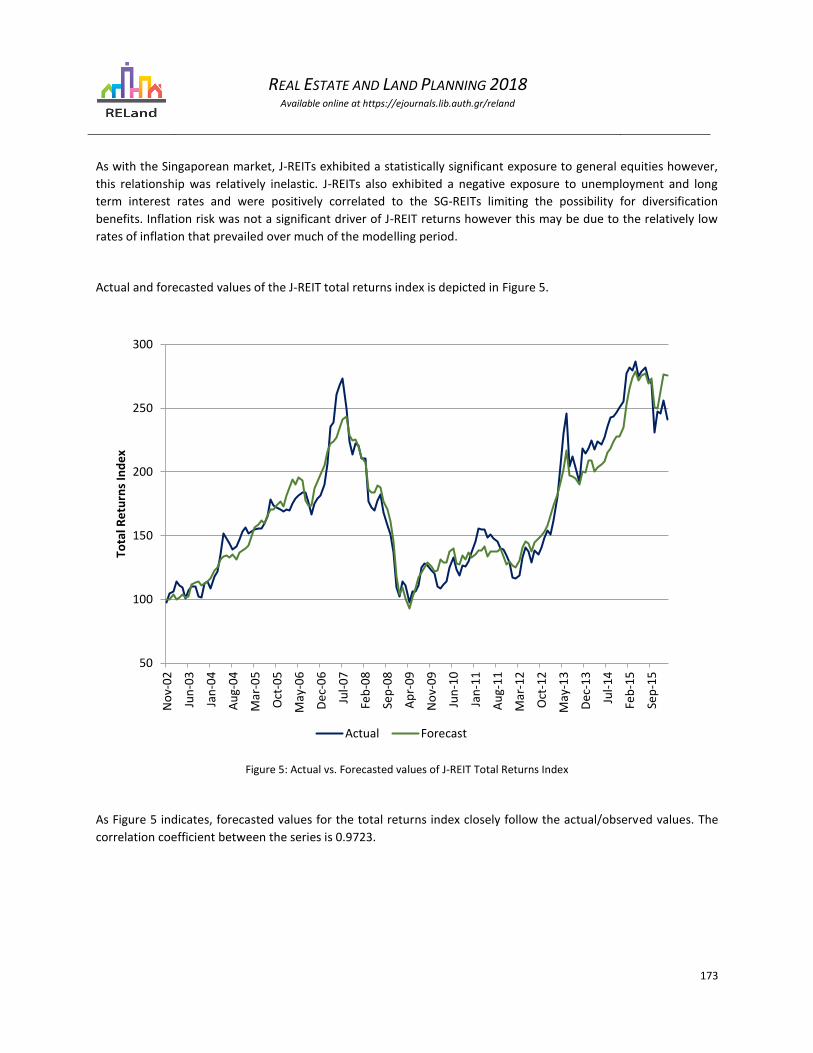
Actual and forecasted values of the J-REIT total returns index is depicted in Figure 5.
Figure 5: Actual vs. Forecasted values of J-REIT Total Returns Index
As Figure 5 indicates, forecasted values for the total returns index closely follow the actual/observed values. The
correlation coefficient between the series is 0.9723.
50
100
150
200
250
300
No
v-0
2
Jun
-03
Jan
-04
Au
g-0
4
Mar
-05
Oct
-05
May
-06
De
c-0
6
Jul-
07
Feb
-08
Sep
-08
Ap
r-0
9
No
v-0
9
Jun
-10
Jan
-11
Au
g-1
1
Mar
-12
Oct
-12
May
-13
De
c-1
3
Jul-
14
Feb
-15
Sep
-15
Tota
l Re
turn
s In
de
x
Actual Forecast
REAL ESTATE AND LAND PLANNING 2018
Available online at https://ejournals.lib.auth.gr/reland
174
6 Conclusion
This study has explored the relationship between macroeconomic risk factors and REIT returns across three key
Asian markets: Singapore, Hong Kong and Japan. Previous studies have focused on larger and more established
western markets however, as REITs increase in size and prevalence across Asia, investors may benefit from further
research into the factors that drive returns in these markets.
In the extant literature, several variables have been shown to possess explanatory power in the returns generating
process. These variables typically measure some form of exposure to market risk, inflation, interest rates,
industrial production and other general indicators of macroeconomic condition. Accordingly, this study has
adopted similar measures. Utilising a well established method – the Autoregressive distributed lag model (ARDL),
long run elasticities between these variables; as well as the 'speed of adjustment' has been estimated for REIT
sectors in the aforementioned Asian markets.
SG-REITs exhibited a statistically significant relationship to general equities and varied negatively with inflation
thereby acting as a perverse inflation hedge. This evidence suggests that SG-REITs possess more equity rather than
bond like characteristics. Additionally SG-REITs had a negative exposure to interest rate risk, which may be the
result of easing restrictions on borrowing from the monetary authority.
By contrast, the REIT market in Hong Kong demonstrated more defensive properties. HK-REITs were not exposed
to market risk and varied positively with inflation suggesting they are an effective option for inflation hedging. HK-
REITs also did not exhibit any exposure to interest rate risk which may the result of more stringent borrowing
restrictions.
The evidence from Japanese REITs is less clear. The exposure to market risk would be suggestive of equity like
characteristics however there is no evidence of inflation risk. The latter result may be due to the low rates of
inflation following the asset price bubble collapse of the early 90's and resultant deflationary cycle.
There is a high degree of inter-relatedness between the three Asian REIT markets limiting the possibility of
diversification benefits. The Singaporean market was positively correlated with both the Japanese and Hong Kong
markets while the Japanese market was positively correlated with the Singaporean market. The Hong Kong market
was positively correlated with the Singaporean market but negatively correlated with the Japanese market
suggesting some opportunity for risk mitigation through diversification. This degree of inter-relatedness is
expected given that many funds own and operate assets across the region and derive income streams accordingly.
Lastly the 'speed of adjustment' in these markets are relatively high with up to 35% of any disequilibrium being
corrected within one period.
The implications for asset allocation strategies is that portfolio managers and other investors seeking more
aggressive growth and equity like characteristics may select funds from the Singaporean and possibly Japanese
markets while those wishing to adopt a more defensive stance may consider HK-REITs. The high degree of
correlation between the markets however, limits the possibility of diversification.

REAL ESTATE AND LAND PLANNING 2018
Available online at https://ejournals.lib.auth.gr/reland
175
7 References
Chan K C., Hendershott P H., Sanders A B., (1990) 'Risk and Return on Real Estate: Evidence from Equity REITs', American Real
Estate and Urban Economics Association Journal, 18(4), p431-452.
Cheong C S., Gerlach R., Stevenson S., Wilson P J., Zurbruegg R. (2009) 'Equity and fixed income markets as drivers of securitised
real estate', Review of Financial Economics, 18, p103-111.
Engle, R. and Granger, C.W.J., (1987) 'Co-integration and an error correction: representation, estimation and testing',
Econometrica, 55(2), p251-276.
Ennis, R., Burik, P., (1991) 'Pension fund real estate investment under a simple equilibrium pricing model', Financial Analyst
Journal, 47(3), p20-30.
EPRA (2013), 'Global REIT survey 2013: A comparison of the major REIT regimes around the world', European Public Real Estate
Association
Glascock J L., Lu C., So R W., (2002), 'REIT Retuns and Inflation: Perverse or Causality Effects', Journal of Real Estate Economics
and Finance, 24(3), p301-317.
Glascock J L., Lu-Andrews R., (2014) 'An Examination of Macroeconomic Effects on the Liquidity of REITs', Journal of Real Estate
Finance and Economics, 49, p23-46.
Goebel P.R., and Kim K.S., (1989) 'Performance Evaluation of Finite-life Real Estate Investment Trusts', Journal of Real Estate
Research, 4, p57-69.
Gyourko J., Linneman P., (1988) 'Owner-occupied Homes, Income-producing Property and REITs as Inflation Hedges: Empirical
Findings', Journal of Real Estate Finance and Economics, 1, p347-372.
Gyourko, J., Keim, D., (1992) 'What does the stock market tell us about real estate returns?', AREUEA Journal, 20, p457-485.
Harris, R. and Sollis, R., (2003) Applied Time Series Modelling and Forecasting. Wiley: West Sussex.
Johansen, S.E., (1988) 'Statistical analysis of cointegration vector', Journal of Economic Dynamics and Control, 12 (2/3), p231-
254.

REAL ESTATE AND LAND PLANNING 2018
Available online at https://ejournals.lib.auth.gr/reland
176
Johansen, S. and Jusellius, K., (1992) 'Testing structural hypotheses in a multivariate cointegration analysis of the PPP and UIP
for UK', Journal of Econometrics, 53(1/2/3), p211-244.
Li, Y., Wang, K., (1995) 'The predictability of REIT returns and market segmentation', The Journal of Real Estate Research, 10(4),
p471-482.
Liow K H., Huang Q., (2006) 'Interest rate risk and time‐varying excess returns for Asian property stocks', Journal of Property
Investment & Finance, 24(3), p188-210.
Liu, C.H., Hartzell, D.J. and Hoesli, M.E., (1997) 'International Evidence on Real Estate Securities as an Inflation Hedge', AREUEA
Journal, 25, p193-221.
Liu, C., Mei, J., (1992) 'The predictability of returns on equity REITs and their co-movements with other assets', Journal of Real
Estate Finance and Economics, 5(4), p401-418.
Karolyi, G.A., Sanders, A.B., (1998) 'The variation of economics risk premiums in real estate returns', Journal of Real Estate
Finance and Economics, 15(3), p245-262.
Mengden, A., Hartzell, D., (1986) Real estate investment trusts-are they stocks or real estate? New York: Salomon Brothers Inc.
McMahan, J., (1994) 'The long view: A perspective on the REIT market', Real Estate Issues, 19, p1−4.
Monetary Authority of Singapore (2017), Media Release [Online]. Available at http://www.mas.gov.sg/news-and-
publications/media-releases/2014/strengthening-the-reit-market.aspx (Accessed: October 2017)
NAREIT (2017), FTSE NAREIT Real Estate Index Historical Market Capitalization, 1972 – 2016 [Online]. Available at
https://www.reit.com/data-research/reit-market-data/us-reit-industry-equity-market-cap (Accessed: December 2017)
Newell, G., (2012) 'The Investment Characteristics and Benefits of Asian REITs for Retail Investors', APREA [Online]. Available at
www.aprea.asia (Accessed: December 2017)
Park, J.Y., Mullineaux, D.J., and Chew, I.K., (1990) 'Are REITs Inflation Hedges?', Journal of Real Estate Finance and Economics, 3,
p91-103.
Pesaran, M. and Shin, Y., (1999) 'An Autoregressive Distributed Lag Modeling Approach to Cointegration Analysis' in S. Strom,
(ed.) Econometrics and Economic Theory in the 20th Century: The Ragnar Frisch centennial Symposium, Cambridge University
Press: Cambridge.

REAL ESTATE AND LAND PLANNING 2018
Available online at https://ejournals.lib.auth.gr/reland
177
Pesaran, M.H., Shin, Y. and Smith, R.J., (2001) 'Bounds testing approaches to the analysis of level relationship.' Journal of
Applied Economics, 16, p289-326.
Peterson, J.D., Hsieh, C.H. (1997) 'Do common risk factors in the returns on stocks and bonds explain returns on REITs?', Real
Estate Economics, 25(1), p321-345.
Ross, S., Zisler, R. (1987) Managing real estate portfolios part 2: risk and returns real estate. New York: Goldman Sachs.
Ross, S., Zisler, R. (1991) 'Risk and return in real estate.', Journal of Real Estate Finance and Economics, 4(3), p175-190.
Titman, S. and Warga, A. (1989) 'Stock Returns as Predictors of Interest Rates and Inflation', Journal of Financial and
Quantitative Analysis, 24, p47-58.