the effects of stock market rumors on stock prices: evidence from an emerging market
TRANSCRIPT
eJournal of Multinational Financial Management
11 (2001) 105–115
The effects of stock market rumors on stockprices: evidence from an emerging market
Halil Kiymaz *Finance and Economics-SBPA, Uni6ersity of Houston-Clear Lake, Houston, TX 77058, USA
Received 5 June 1999; accepted 18 February 2000
Abstract
The purpose of this study is to investigate the effects of stock market rumors on the pricesof stocks traded at the Istanbul Stock Exchange. The sample consists of 355 favorablerumors mentioned in the HOTS column of ‘Ekonomik Trend ’. While positive significantabnormal returns are observed in each of the 4 days prior to the publication date, negativeinsignificant abnormal returns are detected in the post-publication period. The findings in thepre-publication period refute the strong form of market efficiency while the findings in thepost-publication period suggest that investment decisions based on the published rumorswould not benefit investors. A further analysis based on the content of rumor shows thatearning expectations’ rumors, and purchases by foreign investors rumors generate greaterimpact on stock prices than other rumors. © 2001 Elsevier Science B.V. All rights reserved.
JEL classification: G14; G15
Keywords: Stock market rumors; Emerging market; Istanbul stock exchange
www.elsevier.com/locate/econbase
1. Introduction
Although the behavior of stock market prices has been investigated extensively,the question of whether trading based on a particular set of information can leadinvestors to obtain excess returns remains as an interesting topic to study. Studiesinvestigating effects of analysts’ recommendations or rumors on stock prices are
* Tel.: +1-281-2833208; fax: +1-181-2833951.E-mail address: [email protected] (H. Kiymaz).
1042-444X/01/$ - see front matter © 2001 Elsevier Science B.V. All rights reserved.
PII: S1042 -444X(00 )00045 -1
H. Kiymaz / J. of Multi. Fin. Manag. 11 (2001) 105–115106
mainly related to the market efficiency hypothesis. The strong form of the efficientmarket hypothesis assumes that all information, whether public or private, israpidly incorporated into security prices that no investor can use it to earn excessreturns. Although the initial studies (i.e. Diefenback, 1972; Logue and Tuttle, 1973)argue that information based on market rumors does not have any economic value,later studies report statistically significant stock price reactions to stock marketrumors. The majority of studies in literature seem to refute the market efficiencyhypothesis in its strongest form. These studies document the existence of significantabnormal returns following analysts’ recommendations or rumors. Among themLloyd-Davies and Canes (1978), Syed et al. (1989), Liu et al. (1990), Barber andLoeffler (1993) report abnormal stock price performance following recommenda-tions reported in the Dartboard column of the Wall Street Journal (WSJ).
The objective of this study is to investigate whether stock market rumors haveany impact on common stocks traded at the Istanbul Stock Exchange (ISE) byexamining the ‘Heard on the Street’ (HOTS) column of ‘Ekonomik Trend ’ (ET)weekly. Furthermore, the impact of the content of the rumors on stock prices isinvestigated. The results of this study provide additional international evidence oneffects of rumors on stock prices. The empirical findings show the existence ofpositive and significant abnormal returns in each of the 4 days prior to thepublication date, and negative insignificant abnormal returns in the post-publica-tion period. These results suggest that rumors and gossips contained in the HOTScolumn have been disseminated prior to their publication. A further analysis basedon the content of rumor reveals that the earning expectation rumors and purchasesby foreign investors rumors generate greater impact on stock prices than otherrumors.
2. Literature review
The question of whether trading based on recommendations and/or rumorspublished in newspaper or magazines would benefit investors has been investigatedextensively. The empirical studies in this subject report mixed results. Diefenback(1972) and Logue and Tuttle (1973) are two initial studies reporting that analysts’recommendations have no value for investors. Later studies, on the other hand,report that information provided by the Wall Street Journal Heard on the Streetcolumn or analysts contain valuable information to investors. Lloyd-Davies andCanes (1978) focus on financial analysts’ recommendations as discussed in theHOTS column of the WSJ. They report that buy recommendations providesignificant positive abnormal returns, while sell recommendations are associatedwith significant negative abnormal returns on the day of publication. They concludethat analysts and investment advisors provide valuable service to investors. Liu etal. (1990) extend the Lloyd-Davies and Canes (1978) study with more recent sampleand further analyze the effects of the single-company versus multi-company recom-mendations, and the trading volume around the publication day. Their findings arein the line with the Lloyd-Davies and Canes (1978) study. Moreover, the results
H. Kiymaz / J. of Multi. Fin. Manag. 11 (2001) 105–115 107
indicate that investors respond earlier to the information and single companyrecommendations have greater impact on the stock prices than those of multi-com-pany recommendations. Finally, they report higher trading volume around thepublication day.
There are also studies investigating the factors influencing the magnitude of stockmarket reaction to analysts’ information or recommendation provided by variouspublications. Beneish (1991) investigates explanations for the significant stock pricereaction to analysts’ information reported in the ‘HOTS’ column of the WSJ. Theresults indicate that market reaction persists after controlling for confoundingreleases. Furthermore, stock prices adjust prior to publication when recommenda-tions are reported on a single firm. Huth and Maris (1992) examine the same issuein terms of the usefulness of recommendations in short term trade decision makingand firm size. The findings indicate that information obtained from the HOTScolumn can produce statistically significant stock price movements. Firm size isfound to be important only for negative comments in the column. Barber andLoeffler (1993) analyze the stock price and volume behaviors using recommenda-tions published in the Dartboard column of the WSJ. They report average positiveabnormal returns of 4% in 2 days following the publication. Furthermore, averagevolume doubles normal volume level in the same period.
More recently, Mathur and Waheed (1995) investigate the stock price behavior offirms that are favorably mentioned in the ‘Inside Wall Street’ column of BusinessWeek. The results reveal the existence of positive significant abnormal returns onthe day before the publication date, the publication date, and 2 days after thepublication date. The study suggests that information provided by the column isvaluable to short term traders if transaction costs are low. Moreover, the resultsindicate that investors who invest long term based on the information obtain rateof returns below market returns.
In general, the studies on stock market rumors or analysts’ recommendationssupport the view that information provided to investors is valuable. This paperaims to investigate the effects of stock market rumors on stocks traded at the ISEto provide evidence from an emerging market.
3. Data and methodology
The study uses the stock market rumors published in the HOTS column of the‘ET ’ weekly magazine during the period of July 21, 1996 and August 17, 1997.1 TheHOTS page is published every week in ET. Topics covered in the page includeinformation about both single firms and a group of firms. The purpose of the pageis to inform investors about market developments influencing stock prices. Informa-tion provided by the HOTS, with rare exceptions, is favorable.
1 The study period of 1996–1997 is randomly selected.
H. Kiymaz / J. of Multi. Fin. Manag. 11 (2001) 105–115108
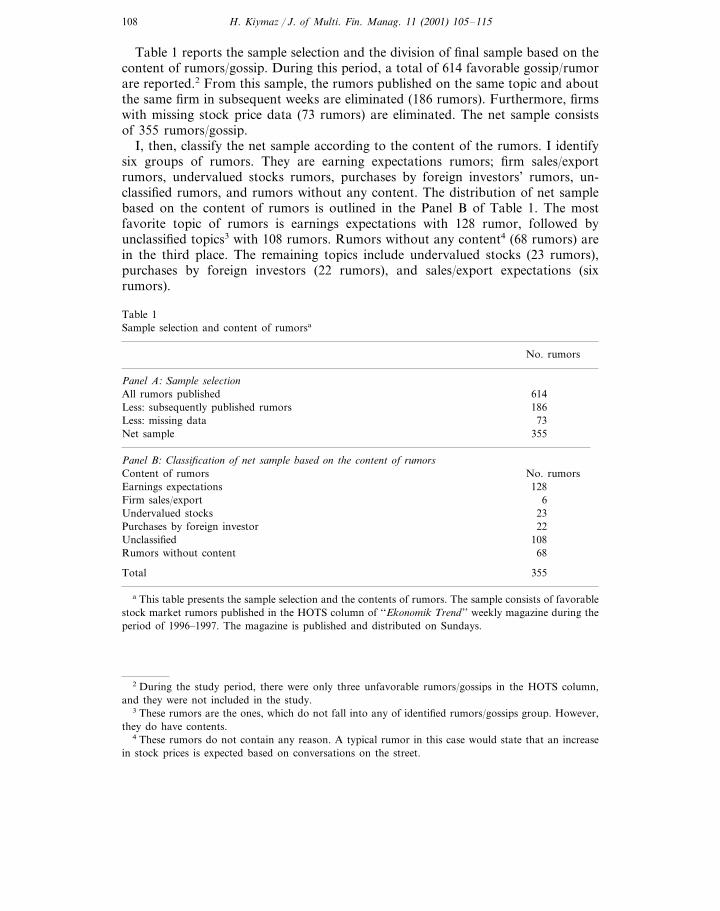
Table 1 reports the sample selection and the division of final sample based on thecontent of rumors/gossip. During this period, a total of 614 favorable gossip/rumorare reported.2 From this sample, the rumors published on the same topic and aboutthe same firm in subsequent weeks are eliminated (186 rumors). Furthermore, firmswith missing stock price data (73 rumors) are eliminated. The net sample consistsof 355 rumors/gossip.
I, then, classify the net sample according to the content of the rumors. I identifysix groups of rumors. They are earning expectations rumors; firm sales/exportrumors, undervalued stocks rumors, purchases by foreign investors’ rumors, un-classified rumors, and rumors without any content. The distribution of net samplebased on the content of rumors is outlined in the Panel B of Table 1. The mostfavorite topic of rumors is earnings expectations with 128 rumor, followed byunclassified topics3 with 108 rumors. Rumors without any content4 (68 rumors) arein the third place. The remaining topics include undervalued stocks (23 rumors),purchases by foreign investors (22 rumors), and sales/export expectations (sixrumors).
Table 1Sample selection and content of rumorsa
No. rumors
Panel A: Sample selectionAll rumors published 614
186Less: subsequently published rumorsLess: missing data 73Net sample 355
Panel B: Classification of net sample based on the content of rumorsContent of rumors No. rumors
128Earnings expectationsFirm sales/export 6Undervalued stocks 23
22Purchases by foreign investorUnclassified 108Rumors without content 68
355Total
a This table presents the sample selection and the contents of rumors. The sample consists of favorablestock market rumors published in the HOTS column of ‘‘Ekonomik Trend ’’ weekly magazine during theperiod of 1996–1997. The magazine is published and distributed on Sundays.
2 During the study period, there were only three unfavorable rumors/gossips in the HOTS column,and they were not included in the study.
3 These rumors are the ones, which do not fall into any of identified rumors/gossips group. However,they do have contents.
4 These rumors do not contain any reason. A typical rumor in this case would state that an increasein stock prices is expected based on conversations on the street.
H. Kiymaz / J. of Multi. Fin. Manag. 11 (2001) 105–115 109
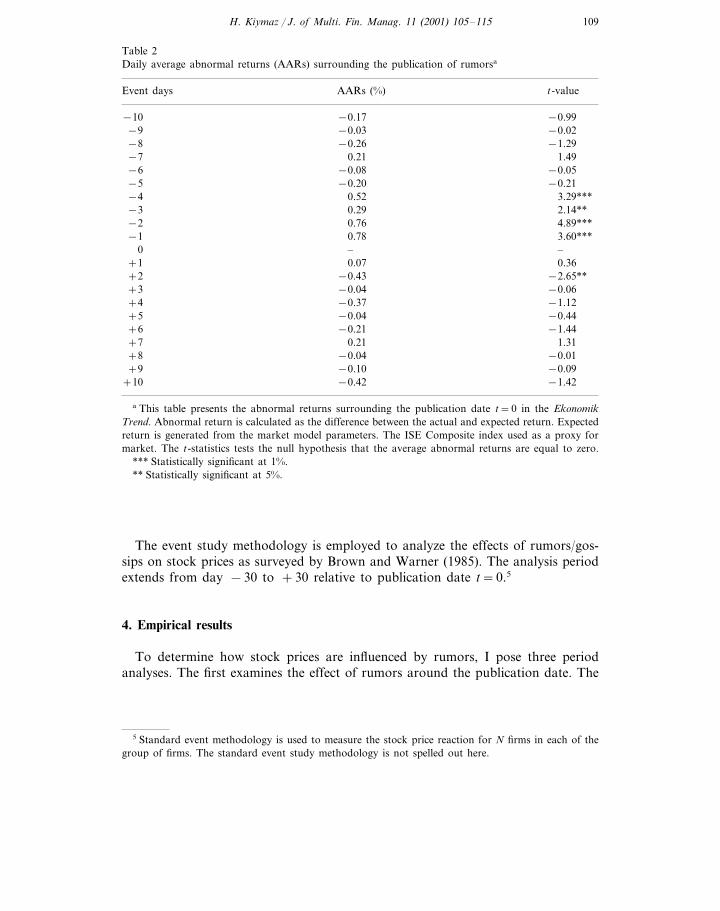
Table 2Daily average abnormal returns (AARs) surrounding the publication of rumorsa
Event days t-valueAARs (%)
−0.99−10 −0.17−9 −0.03 −0.02−8 −0.26 −1.29−7 0.21 1.49−6 −0.05−0.08−5 −0.20 −0.21−4 3.29***0.52−3 0.29 2.14**−2 4.89***0.76−1 0.78 3.60***
0 – –+1 0.07 0.36+2 −2.65**−0.43+3 −0.04 −0.06+4 −1.12−0.37+5 −0.04 −0.44+6 −1.44−0.21+7 0.21 1.31+8 −0.01−0.04+9 −0.10 −0.09
+10 −1.42−0.42
a This table presents the abnormal returns surrounding the publication date t=0 in the EkonomikTrend. Abnormal return is calculated as the difference between the actual and expected return. Expectedreturn is generated from the market model parameters. The ISE Composite index used as a proxy formarket. The t-statistics tests the null hypothesis that the average abnormal returns are equal to zero.
*** Statistically significant at 1%.** Statistically significant at 5%.
The event study methodology is employed to analyze the effects of rumors/gos-sips on stock prices as surveyed by Brown and Warner (1985). The analysis periodextends from day −30 to +30 relative to publication date t=0.5
4. Empirical results
To determine how stock prices are influenced by rumors, I pose three periodanalyses. The first examines the effect of rumors around the publication date. The
5 Standard event methodology is used to measure the stock price reaction for N firms in each of thegroup of firms. The standard event study methodology is not spelled out here.
H. Kiymaz / J. of Multi. Fin. Manag. 11 (2001) 105–115110
second looks for unusual activity prior to publication of rumors. Finally, I analyzeprice movement after the publication date.
The empirical results are reported on Tables 2–4. The daily average abnormalreturns (AARs) for all rumors are calculated over −30 and +30 period relative tothe event day 0. Only AARs for −10 and +10 period are reported on Table 2.The results indicate that the sample experiences statistically significant positiveabnormal returns prior to publication of rumors. The AARs are 0.52, 0.29, 0.76and 0.78% for the days −4, −3, −2 and −1, respectively. These results arestatistically significant at 1% level. The AARs following the publication day aremostly negative and statistically insignificant. For example, AARs are 0.07% onday +1, −0.43% on day +2, −0.04% on day +3, and −0.37% on day +4.Only AARs on day +2 is statistically significant at 5% level.
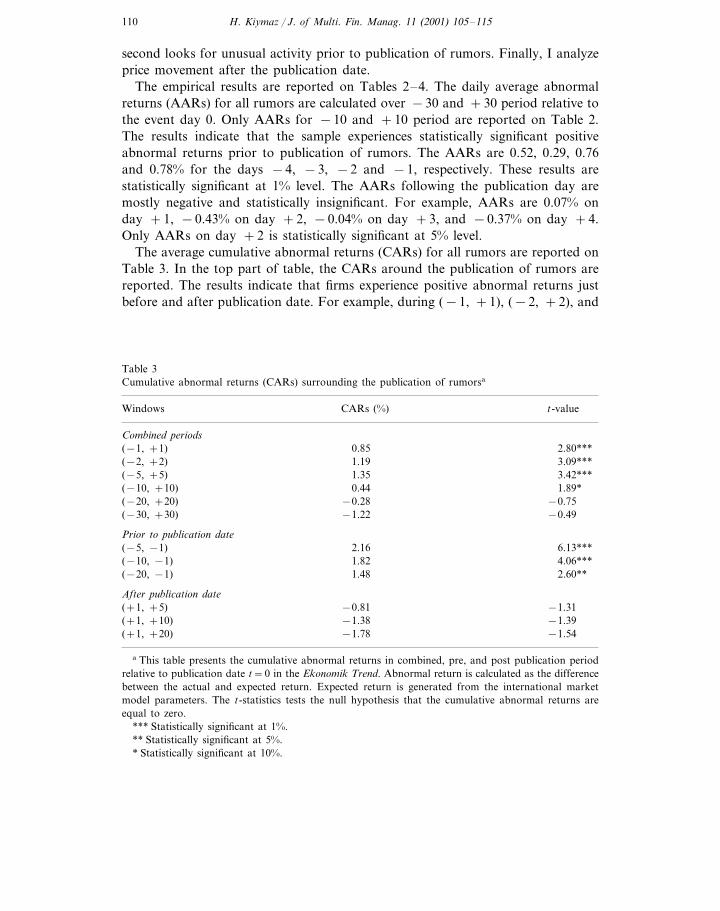
The average cumulative abnormal returns (CARs) for all rumors are reported onTable 3. In the top part of table, the CARs around the publication of rumors arereported. The results indicate that firms experience positive abnormal returns justbefore and after publication date. For example, during (−1, +1), (−2, +2), and
Table 3Cumulative abnormal returns (CARs) surrounding the publication of rumorsa
t-valueCARs (%)Windows
Combined periods0.85 2.80***(−1, +1)
3.09***1.19(−2, +2)3.42***1.35(−5, +5)1.89*0.44(−10, +10)
−0.75(−20, +20) −0.28−1.22(−30, +30) −0.49
Prior to publication date2.16(−5, −1) 6.13***1.82 4.06***(−10, −1)1.48(−20, −1) 2.60**
After publication date−0.81(+1, +5) −1.31−1.38 −1.39(+1, +10)−1.78(+1, +20) −1.54
a This table presents the cumulative abnormal returns in combined, pre, and post publication periodrelative to publication date t=0 in the Ekonomik Trend. Abnormal return is calculated as the differencebetween the actual and expected return. Expected return is generated from the international marketmodel parameters. The t-statistics tests the null hypothesis that the cumulative abnormal returns areequal to zero.
*** Statistically significant at 1%.** Statistically significant at 5%.* Statistically significant at 10%.
H. Kiymaz / J. of Multi. Fin. Manag. 11 (2001) 105–115 111
Tab
le4
Dai
lyav
erag
eab
norm
alre
turn
s(A
AR
s)ba
sed
onth
eco
nten
tof
rum
orsa
Und
erva
lued
stoc
ksE
arni
ngs
expe
ctat
ions
Unc
lass
ified
rum
ors
Rum
ors
wit
hout
cont
ent
Day
sP
urch
ases
byfo
reig
nin
vest
orSa
les/
expo
rtex
pect
atio
ns(n
=68
)(n
=22
)(n
=23
)(n
=6)
(n=
108)
(n=
128)
t-va
lue
AA
Rs
AA
Rs
t-va
lue
AA
Rs
t-va
lue
AA
Rs
t-va
lue
t-va
lue
AA
Rs
t-va
lue
AA
Rs
0.15
−0.
62−
0.56
−0.
15−
0.35
0.81
0.36
−10
0.30
0.30
0.72
−1.
55−
0.52
−0.
40−
1.15
−1.
94**
0.10
0.27
0.24
0.82
0.46
0.66
−0.
791.
13−
91.
17−
0.37
−0.
11−
0.16
0.11
−0.
15−
0.32
−0.
36−
8−
0.58
−1.
490.
04−
0.31
−0.
300.
430.
381.
050.
581.
37−
0.09
0.23
0.04
−7
−0.
020.
130.
450.
02−
0.34
0.87
1.13
−0.
110.
29−
0.07
−6
0.21
−0.
29−
0.78
0.44
0.40
0.08
−0.
110.
751.
74*
−0.
33−
0.04
−1.
03−
0.14
−1.
93*
−5
0.50
0.57
0.19
0.13
0.75
0.65
1.13
0.09
−0.
410.
832.
94**
*−
0.02
−0.
192.
44**
−0.
51−
0.47
−4
0.71
0.97
1.97
*0.
301.
460.
470.
321.
350.
21−
3−
2.27
**−
2.58
0.51
0.21
0.67
0.35
−0.
55−
1.38
1.96
6.32
***
−0.
300.
112.
38**
0.15
0.15
−2
0.22
−0.
120.
371.
412.
17**
2.18
5.88
***
0.37
0.89
−0.
89−
0.46
−0.
56−
1–
––
––
––
––
0–
––
0.81
−1.
46−
2.40
**0.
200.
600.
210.
04+
10.
150.
84−
1.10
−1.
050.
40−
0.28
−0.
09−
0.51
−0.
35−
1.04
−0.
87−
0.11
−1.
60+
2−
0.35
−0.
68−
0.79
−2.
34**
0.24
0.10
0.13
−0.
24−
0.49
−0.
56−
1.07
0.40
0.56
−0.
98−
1.40
+3
−1.
160.
63−
0.60
−0.
99−
0.21
−0.
09−
0.20
0.24
0.42
−0.
62+
4−
1.29
−1.
74−
2.07
**0.
30−
0.07
0.50
1.04
1.65
−0.
13−
0.12
−0.
44−
0.80
−0.
221.
58−
1.36
+5
0.02
−0.
39−
0.95
−0.
20−
0.12
−0.
34−
0.74
−0.
21−
0.68
+6
−0.
74−
0.08
0.06
0.24
−0.
04−
0.10
0.08
0.79
0.64
0.12
1.37
0.00
0.21
+7
0.16
0.41
−0.
530.
21−
0.93
−0.
40−
0.74
−0.
08−
0.06
−0.
11−
0.17
1.05
−0.
57−
0.52
+8
−1.
051.
072.
01**
−0.
46+
9−
1.17
0.21
−0.
07−
0.06
1.16
−0.
22−
1.75
*−
0.80
0.68
0.39
0.68
−0.
34−
0.26
−1.
330.
31−
0.35
0.76
0.81
−1.
15+
10
−2.
08**
aT
his
tabl
epr
esen
tsth
eav
erag
eab
norm
alre
turn
sba
sed
onth
eco
nten
tof
rum
ors,
surr
ound
ing
the
publ
icat
ion
date
t=0
inth
eE
kono
mik
Tre
nd.
Abn
orm
alre
turn
isca
lcul
ated
asth
edi
ffer
ence
betw
een
the
actu
alan
dex
pect
edre
turn
.E
xpec
ted
retu
rnis
gene
rate
dfr
omth
em
arke
tm
odel
para
met
ers.
The
ISE
Com
posi
tein
dex
used
asa
prox
yfo
rm
arke
t.T
het-
stat
isti
cste
sts
the
null
hypo
thes
isth
atth
eav
erag
eab
norm
alre
turn
sar
eeq
ual
toze
ro.
Eve
ntda
y(0
)re
pres
ents
the
day
ofpu
blic
atio
nof
rum
ors/
goss
ips
and
corr
espo
nds
toSu
nday
s.**
*St
atis
tica
llysi
gnifi
cant
at1%
.**
Stat
isti
cally
sign
ifica
ntat
5%.
*St
atis
tica
llysi
gnifi
cant
at10
%.
H. Kiymaz / J. of Multi. Fin. Manag. 11 (2001) 105–115112
(−5, +5) periods, CARs are 0.85, 1.19 and 1.35%, respectively. All of them arestatistically significant at 1% level. In longer time periods firms experience negativeinsignificant abnormal returns. For example, during (−20, +20) and (−30, +30)periods, CARs are −0.28 and −1.22%, respectively. Based on these results, onewould conclude that stock market rumors provide valuable information to in-vestors. Trading based on rumors would provide statistically significant abnormalreturns.
I further analyze the behavior of stock prices in the period prior and after thepublication of rumors. In the middle part of Table 3, the CARs in the pre-publica-tion period for several windows are reported. The CARs in the pre-publicationperiods are positive and statistically significant. For example; during (−20, −1),(−10, −1) and (−5, −1) periods, the CARs are 1.48, 1.82 and 2.16%, respec-tively. While the results of (−20, −1) period is statistically significant at 5%,others are statistically significant at 1% level. The significant positive stock pricereaction in the pre-publications days may be explained by two interpretations. Thefirst one is related to the possible use of information by those who initially possesit. These may include insiders, who may use information for their trading, andstock analysts, who may supply information to their clients for trading. The secondinterpretation can be attributed to the nature of the HOTS column itself. Typically,the stocks mentioned in HOTS are those that recently have been performing well.This may be one of the reasons why almost all HOTS rumors/gossips are favorable.
Finally, in the bottom part of Table 3, CARs in the after-publication period areanalyzed. The CARs for (+1, +5), (+1, +10) and (+1, +20) windows are−0.81, −1.38 and−1.78%, respectively. None of these results is statisticallysignificant. The negative gains in the after publication period would support theview that trading based on the rumors would not benefit to investors and informa-tion does not have any value. These results are contrary to those of recent USstudies, which reports a positive price reaction after the publication date. Theresults of this study seem to suggest the possible dissemination of information priorto the publication date.
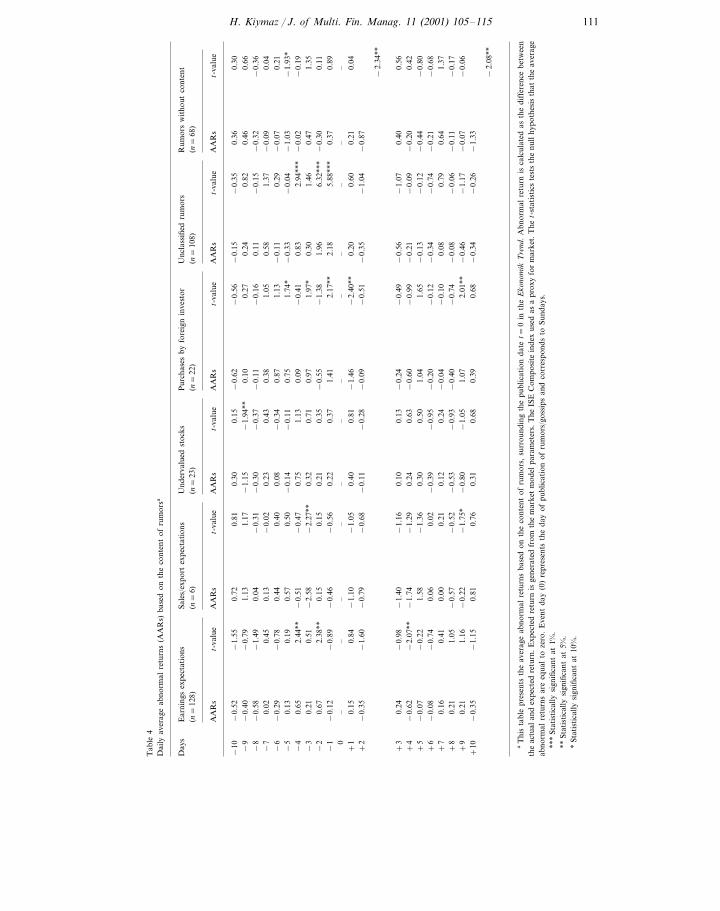
To further analyze the differences in stock price reaction with respect to thecontents of rumors, I classify gossips into six sub-groups. The results of AARs arereported on Table 4. When the pre-publication period is examined, earning expecta-tions rumors, purchases by foreign in6estor rumors, and unclassified rumors groupshave positive significant abnormal returns. For example; earning expectationsrumors group experiences abnormal returns of 0.65 and 0.67% on days −4 and−2. Both findings are statistically significant at 5% level. Unclassified rumors groupshows the highest abnormal returns in pre- publication period. The AARs are 2.18,1.96 and 0.83% for the days −1, −2, and −4, respectively. All of them arestatistically significant at 1% level. The rest of the groups do not show anystatistically significant specific patterns. In the period following the publication ofrumors, the AARs are mostly negative and some of them are statistically signifi-cant. For example; earning expectations group has a return of −0.62% on day+4, which is statistically significant at 5% level. Similarly, purchases by foreigninvestors group experiences a return of −1.46% on the day +1.
H. Kiymaz / J. of Multi. Fin. Manag. 11 (2001) 105–115 113
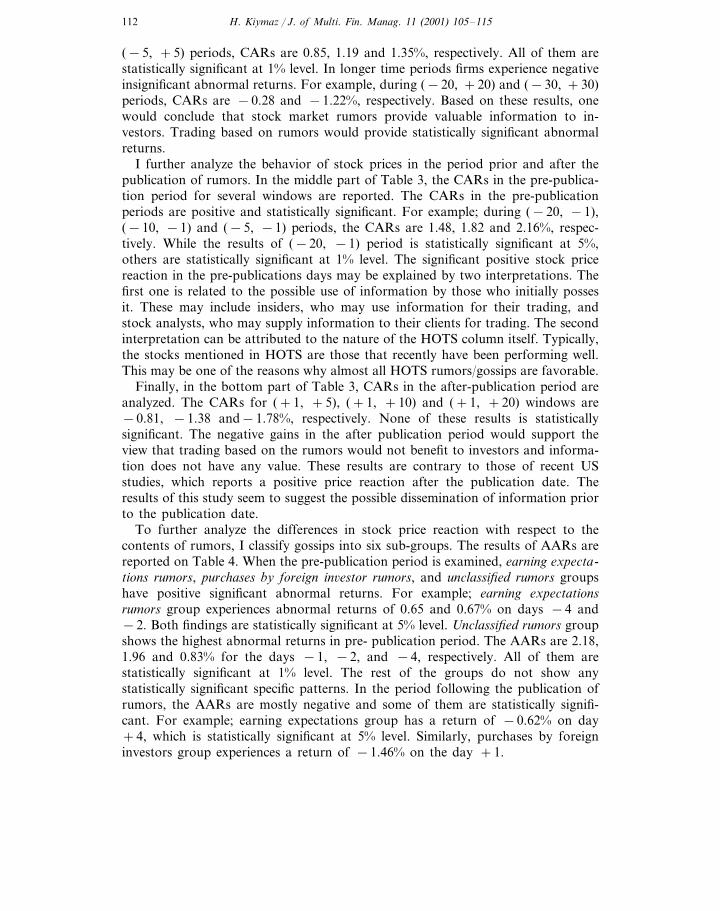
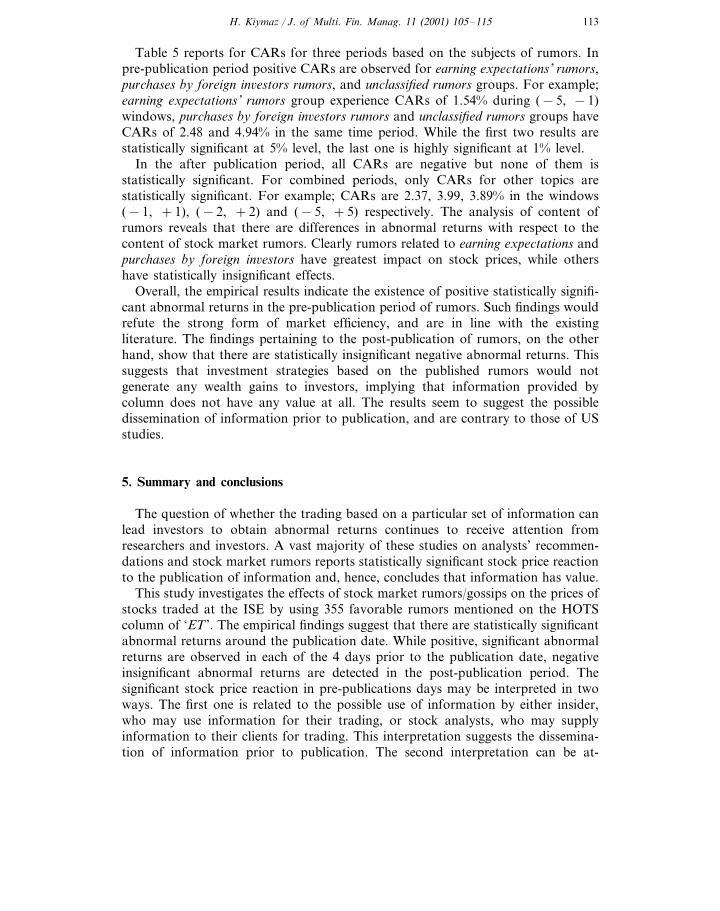
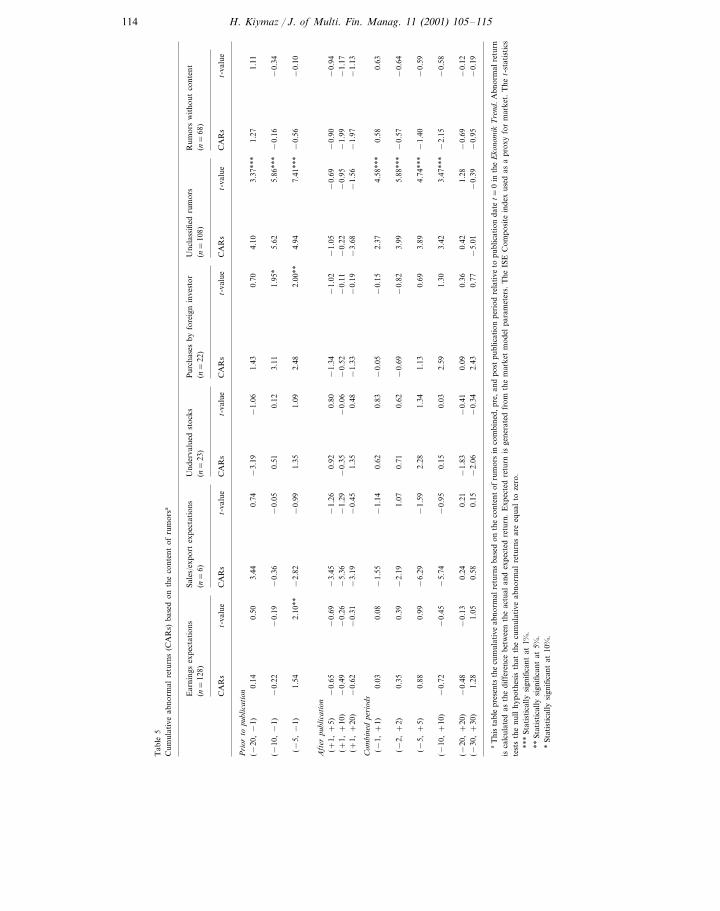
Table 5 reports for CARs for three periods based on the subjects of rumors. Inpre-publication period positive CARs are observed for earning expectations’ rumors,purchases by foreign in6estors rumors, and unclassified rumors groups. For example;earning expectations’ rumors group experience CARs of 1.54% during (−5, −1)windows, purchases by foreign in6estors rumors and unclassified rumors groups haveCARs of 2.48 and 4.94% in the same time period. While the first two results arestatistically significant at 5% level, the last one is highly significant at 1% level.
In the after publication period, all CARs are negative but none of them isstatistically significant. For combined periods, only CARs for other topics arestatistically significant. For example; CARs are 2.37, 3.99, 3.89% in the windows(−1, +1), (−2, +2) and (−5, +5) respectively. The analysis of content ofrumors reveals that there are differences in abnormal returns with respect to thecontent of stock market rumors. Clearly rumors related to earning expectations andpurchases by foreign in6estors have greatest impact on stock prices, while othershave statistically insignificant effects.
Overall, the empirical results indicate the existence of positive statistically signifi-cant abnormal returns in the pre-publication period of rumors. Such findings wouldrefute the strong form of market efficiency, and are in line with the existingliterature. The findings pertaining to the post-publication of rumors, on the otherhand, show that there are statistically insignificant negative abnormal returns. Thissuggests that investment strategies based on the published rumors would notgenerate any wealth gains to investors, implying that information provided bycolumn does not have any value at all. The results seem to suggest the possibledissemination of information prior to publication, and are contrary to those of USstudies.
5. Summary and conclusions
The question of whether the trading based on a particular set of information canlead investors to obtain abnormal returns continues to receive attention fromresearchers and investors. A vast majority of these studies on analysts’ recommen-dations and stock market rumors reports statistically significant stock price reactionto the publication of information and, hence, concludes that information has value.
This study investigates the effects of stock market rumors/gossips on the prices ofstocks traded at the ISE by using 355 favorable rumors mentioned on the HOTScolumn of ‘ET ’. The empirical findings suggest that there are statistically significantabnormal returns around the publication date. While positive, significant abnormalreturns are observed in each of the 4 days prior to the publication date, negativeinsignificant abnormal returns are detected in the post-publication period. Thesignificant stock price reaction in pre-publications days may be interpreted in twoways. The first one is related to the possible use of information by either insider,who may use information for their trading, or stock analysts, who may supplyinformation to their clients for trading. This interpretation suggests the dissemina-tion of information prior to publication. The second interpretation can be at-
H. Kiymaz / J. of Multi. Fin. Manag. 11 (2001) 105–115114
Tab
le5
Cum
ulat
ive
abno
rmal
retu
rns
(CA
Rs)
base
don
the
cont
ent
ofru
mor
sa
Und
erva
lued
stoc
ksP
urch
ases
byfo
reig
nin
vest
orU
ncla
ssifi
edru
mor
sR
umor
sw
itho
utco
nten
tSa
les/
expo
rtex
pect
atio
nsE
arni
ngs
expe
ctat
ions
(n=
68)
(n=
128)
(n=
22)
(n=
6)(n
=10
8)(n
=23
)
t-va
lue
CA
Rs
t-va
lue
CA
Rs
t-va
lue
CA
Rs
t-va
lue
CA
Rs
CA
Rs
t-va
lue
CA
Rs
t-va
lue
Pri
orto
publ
icat
ion
−1.
061.
430.
70(−
20,−
1)4.
100.
143.
37**
*0.
501.
271.
113.
440.
74−
3.19
0.12
3.11
1.95
*5.
625.
86**
*0.
51−
0.05
−0.
16−
0.36
−0.
34−
0.19
(−10
,−
1)−
0.22
1.09
2.48
2.00
**4.
947.
41**
*1.
54−
0.56
(−5,
−1)
−0.
102.
10**
−2.
82−
0.99
1.35
Aft
erpu
blic
atio
n0.
80−
1.34
−1.
02−
1.05
−0.
65−
0.69
−0.
69−
0.90
−0.
94(+
1,+
5)−
3.45
−1.
260.
92−
0.06
−0.
52−
0.11
−0.
22(+
1,+
10)
−0.
95−
0.49
−1.
99−
1.17
−0.
26−
5.36
−1.
29−
0.35
0.48
−1.
33−
0.19
−3.
68−
1.56
−1.
97−
1.13
1.35
−0.
62−
0.31
−3.
19−
0.45
(+1,
+20
)
Com
bine
dpe
riod
s−
1.14
0.62
0.83
−0.
05−
0.15
2.37
4.58
***
0.08
0.58
0.63
(−1,
+1)
−1.
550.
03
0.62
−0.
69−
0.82
3.99
5.88
***
0.35
0.71
−0.
57(−
2,+
2)−
0.64
1.07
−2.
190.
39
1.34
1.13
0.69
3.89
4.74
***
0.88
−1.
40−
0.59
(−5,
+5)
0.99
−6.
29−
1.59
2.28
0.03
2.59
1.30
3.42
3.47
***
0.15
−0.
95−
2.15
−0.
45−
0.58
−5.
74−
0.72
(−10
,+
10)
−0.
48−
1.83
−0.
410.
090.
360.
421.
28−
0.69
−0.
12−
0.13
0.24
(−20
,+
20)
0.21
0.15
−2.
06−
0.34
2.43
0.77
−5.
01−
0.39
−0.
95−
0.19
1.28
(−30
,+
30)
1.05
0.58
aT
his
tabl
epr
esen
tsth
ecu
mul
ativ
eab
norm
alre
turn
sba
sed
onth
eco
nten
tof
rum
ors
inco
mbi
ned,
pre,
and
post
publ
icat
ion
peri
odre
lati
veto
publ
icat
ion
date
t=0
inth
eE
kono
mik
Tre
nd.A
bnor
mal
retu
rnis
calc
ulat
edas
the
diff
eren
cebe
twee
nth
eac
tual
and
expe
cted
retu
rn.
Exp
ecte
dre
turn
isge
nera
ted
from
the
mar
ket
mod
elpa
ram
eter
s.T
heIS
EC
ompo
site
inde
xus
edas
apr
oxy
for
mar
ket.
The
t-st
atis
tics
test
sth
enu
llhy
poth
esis
that
the
cum
ulat
ive
abno
rmal
retu
rns
are
equa
lto
zero
.**
*St
atis
tica
llysi
gnifi
cant
at1%
.**
Stat
isti
cally
sign
ifica
ntat
5%.
*St
atis
tica
llysi
gnifi
cant
at10
%.
H. Kiymaz / J. of Multi. Fin. Manag. 11 (2001) 105–115 115
tributed to the nature of the HOTS column itself. Typically, the stocks mentionedin HOTS are those that recently have been performing well.
The negative insignificant abnormal returns in the post-publication period maysuggest that investment decisions based on the published rumors would not benefitinvestors. Hence, information provided by such columns may not have any value.A further analysis based on the content of rumors/gossips reveals that earningexpectations’ rumors, purchases by foreign investor rumors generate higher abnor-mal returns than other rumors.
Acknowledgements
I thank the participants at the 1999 meeting of Financial Management Associa-tion International, the editor, and an anonymous referee for helpful suggestions onan earlier draft.
References
Barber, B.M., Loeffler, D., 1993. The dartboard column: second-hand information and price pressure.Journal of Financial and Quantitative Analysis 28, 273–283.
Beneish, M.D., 1991. Stock prices and the dissemination of analysts’ recommendations. Journal ofBusiness 64, 393–416.
Brown, S.J., Warner, J.B., 1985. Using daily stock returns: the case of event studies. Journal of FinancialEconomics 14, 3–31.
Diefenback, R., 1972. How good is institutional brokerage research. Financial Analyst Journal 28,54–60.
Huth, W.L., Maris, B.A., 1992. Large and small firm stock price responses to heard on the streetrecommendations. Journal of Accounting and Auditing 7, 27–47.
Liu, P., Smith, D., Syed, A., 1990. Stock reaction to the Wall Street Journal’s securities recommenda-tions. Journal of Financial and Quantitative Analysis 25, 399–410.
Lloyd-Davies, P., Canes, M., 1978. Stock prices and publication of second-hand information. Journal ofBusiness 51, 43–56.
Logue, D., Tuttle, D., 1973. Brokerage houses investment advises. The Financial Review 8, 38–54.Mathur, I., Waheed, A., 1995. Stock price reactions to securities recommended in Business Week’s inside
Wall Street. The Financial Review 30, 583–604.Syed, A., Lui, P., Smith, S., 1989. The exploitation of inside information at the Wall Street Journal: a
test of strong form efficiency. The Financial Review 24, 567–759.
.