the effects of sewage treatment works on watercourses - t.swain
TRANSCRIPT

NOTTINGHAM TRENT UNIVERSITY
THE EFFECTS OF SEWAGE TREATMENT EFFLUENTS ON WATERCOURSES.
by
THOMAS M. SWAIN
Dissertation submitted in partial fulfilment of the BSc (Honours) Degree in Environmental Science
2015

2
Abstract
With the eutrophication of watercourses of primary concern at both UK and
European level, scrutiny has increased on sewage treatment works to improve levels
of treatment and demonstrate that they are not having a detrimental effect upon the
receiving watercourse. Therefore, the aim of this project was to investigate the
effects of sewage treatment effluents upon receiving watercourses to understand
whether significant differences occur between upstream and downstream samples.
Seven Severn Trent sewage treatment works of varying technology (Activated
Sludge Production, Membrane Bioreactor & Percolating Filter Bed) were sampled to
investigate their effects. River water samples were collected 200 metres upstream
and downstream as well as a final effluent sample for a range of 14 determinants
(ammonia, biological oxygen demand, boron, chloride, chemical oxygen demand,
conductivity, dissolved oxygen, nitrate, nitrite, orthophosphorus, pH, phosphorus,
sulphate & temperature) with an aim of understanding their effect upon the
watercourse. This project identified a significant decrease in pH between upstream
and downstream river water samples for pH at Site 4, a Membrane Bioreactor. All
other upstream and downstream river samples were not significant and therefore
demonstrated that STW effluents do not have a significant effect upon the receiving
watercourse. Further analysis into the pH result for Site 4 indicated that a more
likely cause for the decreased pH was the use of NaCl as a road salt as well as
increased nitrate inputs causing a eutrophic environment, thus reducing DO
concentrations as well as riverine pH. Flow was also correlated to individual
samples and demonstrated no-correlation between low pH in final effluent and
riverine pH levels. The results of this study demonstrates that sewage treatment
works are having a negligible effect upon watercourses. Technical improvements at
sewage treatment works have reduced determinant concentrations being
discharged by final effluent and are helping to achieve the WFD aim of achieving
‘good chemical and ecological status’ for all UK watercourses by 2015.
Keywords: Final Effluent; Membrane Bioreactor; Activated Sludge Process;
Percolating Filter Bed; WFD; UWWTD; eutrophication;

3
Acknowledgement
There are a number of people whom without this project would not have been
possible. Firstly I would like to thank Dr Nicholas Ray who has provided supervision
and guidance throughout this project. Secondly, to Gail Pluckrose and Mark Garth,
Severn Trent Service Delivery Managers, for their assistance in the organisation of
funding and getting this project off the ground. Thanks should also be given to
Catherine Kendall and Rowan Luck, Severn Trent Treatment Process Advisers for
their technical advice throughout this study. I would also like to extend my gratitude
to Richard Hardy of the Environment Agency giving me his time in person and
openly discussing riverine pollution and the regulators viewpoint on sewage
treatment.
I also extend my gratitude to Lawrence Green and the team at National Laboratory
Service Nottingham for being so flexible in allowing me to deliver my samples in
person and providing results personally on a weekly basis as well as giving me a
tour of their facility to see the analysis process first hand.
I would like to give special thanks to Dr Joanna Varley-Campbell and John Barratt for
their advice, criticisms and support with this project.
Finally, I would like to thank my friends and in particular my family for their support
throughout my time at Nottingham Trent University.
4
Table of Contents
Abstract II
Acknowledgement III
Table of Contents IV List of Figures VII List of Tables IX Acronyms X
1. Introduction 13 1.1. Water Quality Assessment. 13
1.1.1. Environment Agency General Quality Assessment (GQA) and Sampling regimes 14 1.2. Regulation 16
1.2.1. The EC Water Framework Directive (2000/60/EC) 16 1.2.2. The EC Urban Waste Water Treatment Directive (91/271/EEC) 17
1.2.2.1. Final effluent (FE) sampling 18 1.2.3. The EC Nitrates Directive (91/676/EEC) 19
1.3. Sources of pollution 19 1.3.1. Point pollution 19
1.3.1.1. Sewage Treatment Point Sources 19 1.3.1.2. Industrial Point Sources 20 1.3.1.3. Agricultural Point Sources 20 1.3.1.4. Misconnections 20 1.3.1.5. Storm Point Discharges 21
1.3.2. Diffuse pollution 21 1.3.2.1. Agricultural Practices 22
1.3.3. Eutrophication 23 1.3.3.1. Phosphorus 24 1.3.3.2. Nitrogen 25
1.4. Sewage Treatment works 26 1.4.1. Types of sewage treatment works 26
1.5. River water and effluent quality parameters 33 1.5.1. Physical Determinants 33
1.5.1.1. Temperature 33 1.5.1.2. Conductivity 34 1.5.1.3. Flow 34
1.5.2. Chemical Determinants 35 1.5.2.1. Ammonia 35 1.5.2.2. Biochemical Oxygen Demand (BOD) 35 1.5.2.3. Boron 35 1.5.2.4. Chloride 36 1.5.2.5. Chemical Oxygen Demand (COD) 36 1.5.2.6. Dissolved Oxygen (DO) 37 1.5.2.7. Nitrate 37 1.5.2.8. Nitrite 38 1.5.2.9. Orthophosphorus. 38 1.5.2.10. pH 39 1.5.2.11. Phosphorus 39 1.5.2.12. Sulphate 40

5
1.5.3. Chemical Standards Report 40 1.6. Gaps in current studies 44 1.7. Aims and objectives 44
1.7.1. Hypotheses 44
2. Methodology and Equipment 45 2.1. Commercial Sensitivity 45 2.2. Site Selection 45
2.2.1. Sample locations 50 2.3. Sampling Timescales 50 2.4. Sample Technique 50
2.4.1. Bridge sampling technique 50 2.4.2. Riverbank sampling technique 51 2.4.3. Final Effluent sampling technique 51
2.5. Sample Analysis 51 2.5.1. In-situ data collection 51
2.5.1.1. Temperature and DO 51 2.5.1.2. Conductivity and on-site pH 52 2.5.1.3. Flow 52
2.5.2. Laboratory Analysis 52 2.5.2.1. Ammonia 52 2.5.2.2. Biological Oxygen Demand 53 2.5.2.3. Boron 53 2.5.2.4. Chemical Oxygen Demand 53 2.5.2.5. Chloride 53 2.5.2.6. Nitrate 54 2.5.2.7. Nitrite 54 2.5.2.8. Orthophosphate, Reactive as P 54 2.5.2.9. pH Laboratory 54 2.5.2.10. Phosphorus 54 2.5.2.11. Sulphate 55
2.6. Statistical analysis 55
3. Results 56 3.1. In-situ Results 56
3.1.1. Conductivity 56 3.1.2. Dissolved Oxygen 57 3.1.3. pH on-site 58 3.1.4. Temperature 59
3.2. Laboratory Results 60 3.2.1. Ammonia 60 3.2.2. Biological Oxygen Demand 61 3.2.3. Boron 62 3.2.4. Chemical Oxygen Demand 63 3.2.5. Chloride 64 3.2.6. Nitrate 65 3.2.7. Nitrite 66 3.2.8. Orthophosphate 67 3.2.9. pH Laboratory 68 3.2.10. Phosphorus 69 3.2.11. Sulphate 70
4. Discussion 71 4.1. Study findings 71
4.1.1. Ammonia 72 4.1.2. Biological Oxygen Demand (BOD) 73 4.1.3. Boron 74 4.1.4. Chemical Oxygen Demand (COD) 74 4.1.5. Chloride 75

6
4.1.6. Conductivity 76 4.1.7. Dissolved Oxygen 77 4.1.8. Nitrate 77 4.1.9. Nitrite 78 4.1.10. Orthophosphate 78 4.1.11. pH 79 4.1.12. Phosphorus 80 4.1.13. Sulphate 81 4.1.14. Temperature 82
4.2. Further discussion 82 4.2.1. Difference between treatments 82
4.2.1.1. Activated Sludge Production (ASP) 83 4.2.1.2. Membrane Bioreactor (MBR) 83 4.2.1.3. Percolating Filter Works 84
4.2.2. Regulation 84 4.2.3. Criticisms of other literature 85
4.3. Study Limitations 86 4.4. Recommendations for further research. 86
5. Conclusion 88
References 89
Appendix 119

7
List of Figures:
Figure 1.1: Diagram showing levels of treatment required in relation to PE.
Figure 1.2: Image showing multiple ASP lanes with aerobic and anoxic zones.
Figure 1.3: Diagram of the Activated Sludge Process
Figure 1.4: Image of a Zeeweed 500 hollow fibre MBR membrane used in
wastewater treatment.
Figure 1.5: Image of a percolating filter bed.
Figure 1.6: Diagram of a percolating filter bed.
Figure 1.7: A graph taken from EEA showing river orthophosphate levels from 1992
– 2012 in European rivers.
Figure 2.1: Site diagram showing layout of Site 1.
Figure 2.2: River course and sample point map for Site 1 showing upstream, final
effluent and downstream sample locations.
Figure 3.1: Mean conductivity values across all sites (Mean ± SE).
Figure 3.2: Mean DO values across all sites (Mean ± SE) (MRV=0.20 mg/l).
Figure 3.3: Mean on-site pH values across all sites (Mean ± SE) (MRV=0.05).
Figure 3.4: Mean on-site temperature values across all sites (Mean ± SE).
Figure 3.5: Mean ammonia concentrations across all sites (Mean ± SE)
(MRV=0.19mg/l).
Figure 3.6: Mean BOD concentrations across all sites (Mean ± SE) (MRV=1.0 mg/l).
Figure 3.7: Mean boron concentrations across all sites (Mean ± SE) (MRV=0.1mg/l).
Figure 3.8: Mean COD concentrations for across all sites (Mean ± SE) (MRV =10.0
mg/l).
Figure 3.9: Mean chloride concentrations across all sites (Mean ± SE)(MRV=0.9
mg/l).
Figure 3.10: Mean nitrate concentrations across all sites (Mean ± SE)(MRV=0.006
mg/l).
Figure 3.11: Mean nitrite concentrations across all sites (Mean ± SE) (MRV see
appendix 7).
Figure 3.12: Mean orthophosphate concentrations across all sites (Mean ±
SE)(MRV=0.008 mg/l).
Figure 3.13: Mean concentrations for laboratory pH across all sites (Mean ± SE)
MRV=0.05).

8
Figure 3.14: Mean phosphorus concentrations across all sites (Mean ±
SE)(MRV=0.07 mg/l).
Figure 3.15: Mean sulphate concentrations across all sites (Mean ± SE) (MRV=1.0
mg/l).
Figure 4.1: Weekly ammonia concentrations for Site 5 (Mean ± SE)
(MRV=0.19mg/l).
Figure 4.2: Weekly ammonia concentrations for Site 7 (Mean ± SE) (MRV=0.19).
Figure 4.3: Weekly COD concentrations for Site 1 (Mean ± SE) (MRV =10.0 mg/l).
Figure 4.4: Photograph of Site 1 downstream showing agricultural (A) and surface
water (B) discharge
Figure 4.5: Marked scatter graph demonstrating flow vs. downstream pH for Site 4
with linear trend line.
Figure 4.6: FE phosphorus concentrations for all sites. (Mean ± SE)(MRV=0.07
mg/l).

9
List of Tables:
Table 1.1: A table showing GQA parameters for river water quality.
Table 1.2: Phosphorus removal requirements in relation to PE.
Table 1.3: Target phosphorus concentrations for rivers in England and Wales, with
suggested applications to different river types.
Table 1.4: A table outlining the 3 primary sewage treatment technologies
implemented in this study.
Table 1.5: EA Chemical Standards report for UK and EU river chemical
concentrations.
Table 2.1: A table showing treatment methods employed at sampled STW.
Table 2.2: A table showing site descriptions for sampled STW.
Table 3.1: Multiple comparisons of means for conductivity including post-hoc
analysis.
Table 3.2: Multiple comparisons of means for DO including post-hoc analysis.
Table 3.3: Multiple comparisons of means for pH, including post-hoc analysis.
Table 3.4: Multiple comparisons of means for temperature, including post-hoc
analysis.
Table 3.5: Multiple comparisons of means for ammonia, including post-hoc analysis.
Table 3.6: Multiple comparisons of means for BOD including post-hoc analysis.
Table 3.7: Multiple comparisons of means for boron including post-hoc analysis.
Table 3.8: Multiple comparisons of means of COD including post-hoc analysis.
Table 3.9: Multiple comparisons of means for chloride including post-hoc analysis.
Table 3.10: Multiple comparisons of means for nitrate including post-hoc analysis.
Table 3.11: Multiple comparisons of means for nitrite including post-hoc analysis.
Table 3.12: Multiple comparisons of means for orthophosphate including post-hoc
analysis.
Table 3.13: Multiple comparisons of means for pH Laboratory including post-hoc
analysis.
Table 3.14: Multiple comparisons of means for phosphorus including post-hoc
analysis.
Table 3.15: Multiple comparisons of means for sulphate including post-hoc analysis.

10
Acronyms ASP Activated Sludge Production
BOD Biological Oxygen Demand
COD Chemical Oxygen Demand
CSO Combined Sewer Overflow
DEFRA Department for Environment, Farming and Rural Affairs
DO Dissolved Oxygen
EA Environment Agency
EC European Commission
ECSFDI England Catchment Sensitive Farming Delivery Initiative
EEA European Environment Agency
FE Final Effluent
FST Final Settlement Tank
GQA General Quality Assessment
ICPOES Inductively Coupled Plasma Optical Emission Spectrometer
MBR Membrane Bio-reactor
MRV Minimum Reporting Value
NLS National Laboratory Service
nm Nanometres
NPK Nitrogen, phosphorus, and potassium.
NSA Nitrate Sensitive Area
NSAF Nitrifying Submerged Aerated Filter
NVZ Nitrate Vulnerable Zone
OECD Organisation for Economic Cooperation and Development
OSM Operator Self-Monitoring
P-stripping Phosphorus Stripping
PARIS Phosphorus from Agriculture: Riverine Impact Study (PE1226)
PE Population Equivalent
PoM Programme of Measures
PST Primary Settlement Tank
RAS Returned Activated Sludge
RBMP River Basin Management Plan
SAS Surplus Activated Sludge

11
SRP Soluble Reactive Phosphorus
STW Sewage Treatment Works
UK United Kingdom
UN United Nations
UWWTD EC Urban Waste Water Treatment Directive (91/271/ECC)
WFD EC Water Framework Directive (2000/60/EC)
Chemical elements and compounds B Boron
C Carbon
C6H8O7 Citric Acid
Cl Chlorine
Cl- Chloride
CO2 Carbon Dioxide
H2O Water
H2SO4 Sulphuric Acid
HCl- Hydrochloric Acid
K Potassium
KCl Potassium Chloride
N Nitrogen
NaCl Sodium Chloride
NH3 Ammonia
NO2- Nitrite
NO3- Nitrate
O Oxygen
P Phosphorus
PO43– Orthophosphorus
SO42- Sulphate

12
Units of measurement
l/s Litres per second
M3/d Metres cubed per day
mg/l Milligram per litre
mS/cm Millisiemens per centimetre
nm Nano Metres
µg/l Microgram per litre

13
1. Introduction
River basins have long been associated with high levels of population density due to
their fertile lands and water for irrigation, industrial processes or potable supply
(Vega et al., 1998; Petts, 1998; Acreman, 2000). This makes them the lifeblood of
many of the UK’s largest towns and cities (Rivett et al., 2011; Vörösmarty et al.,
2010). In addition, rivers also assimilate a large amount of municipal wastewater
(DeBruyn et al., 2002), agricultural discharge and highways run off which can have a
polluting effect upon even the largest of watercourses (Aitken, 2003). These
polluting inflows mean that effective and efficient water management is critical,
therefore reliable water quality information is a necessity (Neal et al., 2008).
Urban wastewater (sewage) is a combination of domestic waste flows (baths, sinks,
washing machines and toilets), wastewater from industry and highway rainwater
run off (European Council, 1991). Without treatment, the discharge of wastewater
effluents into the UK’s rivers would adversely affect the riverine environment as
well as posing a serious issue to public health (Jarvie et al., 2006). Untreated sewage
contains organic matter, bacteria and chemicals that cannot be broken down by the
riverine bacteria (DEFRA, 2012). The purpose of a sewage treatment works (STW) is
to treat the wastewater to a suitable level so that it can be discharged to
watercourses with little or no effect on the environment and/or aquatic life (Singh et
al., 2004).
1.1. Water Quality Assessment.
Water quality analysis is an important part of any water management strategy
(European Commission, 2012). Water quality is graded on chemical,
biological/ecological and aesthetic parameters in line with pre-defined limits and
regulations (Norfolk County Council, 2010; Environment Agency, 2002; DEFRA,
2012). The national regulatory body in England, the Environment Agency (EA), often
carries out this work (DEFRA, 2012). National sampling regimes are the only way to
make comparisons between water bodies and also take steps to improve water
quality and reduce pollutants (DEFRA, 2014; European Commission, 2012).

14
1.1.1. Environment Agency General Quality Assessment (GQA) and
Sampling regimes
From 1988, the Rivers Authority began the General Quality Assessment (GQA) of
rivers across the UK with the aim of providing an accurate and consistent
assessment of the UK’s water quality and its changes over time (Nixon et al., 1995;
Coquery et al., 2005; Foster et al., 2010). The GQA scheme sampled and observed a
number of parameters to understand the state of the UK’s river systems. GQA
Parameters can be found in Table 1.1 (Nixon et al., 1995; Furse et al., 2009).

15
Table 1.1: A table showing GQA parameters for river water quality (Nixon et al., 1995; Furse et al., 2009).
GQA Parameter Measures Graded from Comment
Aesthetic quality Litter, foam, odour and
colour
1 = Good to 4 = Bad Taken from first observations of the river in terms of site
and smell with the aim of giving our overall perceptions of
the river (DEFRA, 2012a; Norfolk County Council, 2010)
Biological quality Analysis of macro-
invertebrates.
A = Very good to F = Bad Biological quality data is used as a health check for the river
system. Macro-invertebrates are grouped into 83 taxa and
given scores of between 1 (pollution-tolerant taxa) and 10
(pollution-sensitive taxa) (DEFRA, 2012a; Environment
Agency, 2002)
Chemical quality Dissolved oxygen,
biochemical oxygen
demand (BOD) and
ammonia
A = Very good to F = Bad Chemical quality data was used as a test of river pollution
levels and the effects of sewage treatment, industrial and
agricultural discharges into watercourses (Norfolk County
Council, 2010; DEFRA, 2012a)
Nutrient status Phosphate and nitrate
analysis
Graded from Very Low to
Excessively High
Nutrient status is an aid to identifying anthropogenic
sources of pollution due the majority of nitrate and
phosphate discharges coming from sewage treatment
effluent and agricultural sources (Neal et al., 2010; Bowes et
al., 2010; Jarvie et al., 2006)
Key: Department for Environment Rural Affairs, DEFRA;

16
The GQA programme involved monthly sampling at 7000 monitoring sites across
over 40,000 kilometres of rivers and canals in England and Wales (DEFRA, 2012a;
Environment Agency, 2002). In 1996, with the establishment of the EA,
responsibility for the GQA was passed from the Rivers Authority to the EA. The EA
continued the GQA scheme until 2009 at which point it moved to focus river water
sampling based on the EC Water Framework Directive (2000/60/EC)(Logan &
Furse, 2002; DEFRA, 2012a; Environment Agency, 2002).
1.2. Regulation
Since 1996, the English regulator for the environment has been the EA
(Environment Agency, 2015) sponsored by the UK governmental Department for
Environment, Food and Rural Affairs (DEFRA) (DEFRA, 2015). The EA has the
mandate of protecting and enhancing the environment (DEFRA, 2014). Within
England this includes responsibility for (Environment Agency, 2015):
• Regulating major industry and waste
• Treatment of contaminated land
• River quality and resources
• Fisheries
• Inland river, estuary and harbour navigations
• Conservation and ecology
1.2.1. The EC Water Framework Directive (2000/60/EC)
The EC Water Framework Directive (WFD) (2000/60/EC) was introduced in 2000
with the primary aim to protect, enhance and restore ‘good’ ecological status in
aquatic ecosystems (European Commission, 2012). The WFD has ambitious
objectives to protect and restore aquatic ecosystems for the long-term sustainable
use of water for people, business and nature (Neal & Jarvie, 2005; Correljé et al.,
2007).

17
The WFD looks to categorise rivers by chemical and ecological status of surface
waters with the primary aim of surface waters attaining ‘good chemical and
ecological status’ by 2015 (European Commission, 2012; Neal et al., 2008).
The WFD also stipulates the introduction of River Basin Management Plans (RBMP)
and accompanied Programme of Measures (PoM) (Natural England, 2012; European
Commission, 2012). The RBMP was introduced to allow for a cross-boundary
approach to the classification, assessment and monitoring of surface waters across
central Europe (Ulén & Weyhanmeyer, 2007).
It is recognised that in some cases it may not be feasible (either technically feasible
or disproportionally costly) to bring all watercourses to ‘good’ status by 2015
(DEFRA, 2014; Hering et al., 2010). Therefore, the WFD allow member states to
apply an exemption rule on the basis of natural conditions of the watercourse and
extend the deadline to 2027 or beyond (European Commission, 2012; DEFRA, 2014).
The WFD also implements the precautionary principle (Correljé et al., 2007), which
was adopted by the UN conference on the Environment and Development 1992
(Hering et al., 2010). The precautionary principle states “where there are threats of
serious or irreversible damage to the environment, lack of full scientific certainty
should not be used as a reason for postponing cost-effective measures to prevent
environmental degradation” (Correljé et al., 2007).
1.2.2. The EC Urban Waste Water Treatment Directive (91/271/EEC)
The EC Urban Waste Water Treatment Directive (91/271/ECC) (UWWTD) is the
primary legislation regulating the discharge of effluents from industry and STW
(European Council, 1991). Regulated by the EA, the UWWTD has a primary aim of
working alongside the WFD to improve the quality of surface waters by 2015
(DEFRA, 2012).
The UWWTD states that sewage treatment facilities must be provided for flows that
meet or exceed 2000 population equivalent (PE) (Neal et al., 2009) and puts in place

18
specific treatment criteria in relation to PE (DEFRA, 2012) for example, tertiary
phosphorus stripping (P-stripping) for PE over 10,000 as demonstrated in table 1.2
(Bowes et al., 2009; Neal et al., 2009). Phosphorus is one of the primary limiting
factors for eutrophication (Mainstone & Parr, 2002) and therefore is closely
regulated by the UWWTD (Farmer, 2001). The UWWTD, in conjunction with the EA
Asset Management plans that have set out numerical consents in relation to
phosphorus discharge (Environment Agency, 2000).
Table 1.2: Phosphorus removal requirements in relation to PE (Neal et al., 2010).
Population Equivalent Phosphorus removal required.
10,000 – 100,000 2000µg/l
100,000 and above 1000µg/l
As well as setting discharge limits of phosphorus, the UWWTD also sets out
eutrophication sensitive areas where more stringent treatment processes should be
employed (DEFRA, 2012; European Council, 1991). These sensitive areas are to
protect against the discharge of nitrogen and phosphorus (Mainstone & Parr, 2002).
The UWWTD works alongside both the EC Nitrates Directive (91/676/EEC) and the
EC Drinking Water Directive (98/83/EC) in stipulating that nitrogen concentrations
in river water should not exceed 50 mg/l if to being used for potable abstraction
(Europa, 1998).
1.2.2.1. Final effluent (FE) sampling
The creation of the UWWTD has introduced the idea of regulation and prosecution
(DEFRA, 2012). Because of this, STW are now regularly sampled to ensure that the
quality of their FE is of standard. Water companies are sampled in two ways. Firstly
by operator self-monitoring (OSM) spot samples that are taken by the water
company and reported to the EA. Secondly, UWWTD samples which are 12-hour
composite samples are taken by the EA. The frequency of samples is determined by
PE and also the sensitivity of the receiving watercourse (Water Monitoring
Association, 2008).

19
1.2.3. The EC Nitrates Directive (91/676/EEC)
The EC Nitrates Directive (91/676/EEC) works alongside the WFD to regulate and
improve the quality of surface waters in relation to nitrogen (DEFRA, 2014; Ulén &
Weyhenmeyer, 2007). The Nitrate directive is a key tool for the UK to regulate both
agriculture and sewage discharges to watercourses (Jarvie & Neal., 2005; Goodchild,
2008; Van Grinsven et al., 2012). As well as the implementation of the 50mg/l river
water nitrogen concentration limit for surface waters used for abstraction, the
Nitrate Directive has also implemented the creation of Nitrate Vulnerable
Zones/Nitrate Sensitive Areas (Vinten & Dunn, 2001; Jordan & Smith, 2005).
1.3. Sources of pollution
Rivers have always been the primary source of waste of disposal with medieval
towns allowing raw sewage and household wastes to run through the streets before
discharging into rivers (Sterner, 2008). This continues today in 3rd world countries
that lack suitable sewer infrastructure with rivers assimilating raw human and
agricultural wastes as well as household discharges (Elhance, 1999). Pollution of
watercourses is split into two categories, point and diffuse, depending on how it
enters the watercourse (Singh et al., 2004; Jarvie et al., 2006; Bowes et al., 2006).
1.3.1. Point pollution
Point discharges are defined as discharges that enters the watercourse at one
specific point (Bowes et al., 2006; Neal et al., 2008). Point discharges are primarily
caused by STW, industrial inputs, slurry overflows, sewer misconnections and storm
overflows (Bowes et al., 2010; Neal et al., 2010a). Point source pollutants can often
cause more harm to rivers than diffuse pollutants due to the lack of dilution in the
immediate area of the discharge (Hunt et al., 2010; Singh et al., 2004).
1.3.1.1. Sewage Treatment Point Sources
STW are one of the largest point source discharges for both phosphate and nitrate
pollution to the UK’s surface waters (Singh et al., 2004; Wade et al., 2002). Because
STW discharges FE at a specific point, it usually causes high levels of both nitrate

20
and phosphorus concentration over a short section of the river (Hunt et al., 2010;
Jarvie et al., 2006; Bowes et al., 2008). This can be combatted by tertiary P-stripping
as well as an effective on-site biological treatment process to aid removal of nitrates
(Mainstone & Parr, 2002; Neal et al., 2005).
1.3.1.2. Industrial Point Sources
Industrial point sources are also a major cause of pollutant release into UK surface
waters (Foster et al., 1978; Amisah & Cowx, 2000). As with STW, industrial inputs
are often high in phosphorus and nitrates as well as other heavy metals and
nutrients (Neal et al., 2005; Neal et al., 2010; Wakida & Lerner, 2005). Discharges
depend upon on-site process so regulation and analysis is often tailored to specific
determinants (DEFRA, 2012; Environment Agency, 2015; DEFRA, 2010).
1.3.1.3. Agricultural Point Sources
Agriculture is one of the primary sources of riverine eutrophication (Jarvie et al.,
2006). Agricultural point sources include slurry overflows that discharge raw slurry
into watercourses causing spikes in both phosphorus and nitrates (Vega et al., 1998;
Sharpley et al., 2004; Kleinman et al., 2011). Careful pre-planning of application and
slurry storage can help keep these discharges to a minimum, as the effects of raw
slurry discharge can be catastrophic to small surface waters (Jarvie et al., 2006).
1.3.1.4. Misconnections
Misconnections are common across the UK and are often caused by the
misconnection of white goods (Dishwashers and washing machines) as well as
toilets (Faulkner et al., 2000; Broadhead et al., 2013). Misconnections happen when
instead of a connection to the foul sewer network, items are accidentally connected
to the surface water sewer, causing run-off directly to watercourses (Chandler,
2014).

21
Misconnections can often cause dramatic pollution events and eutrophication to
small surface waters due to a lack of dilution (Chandler, 2014) and a prolonged
discharge over weeks or months, often unspotted (Baker et al., 2003).
1.3.1.5. Storm Point Discharges
Across the country, our sewer network has a number of Combined Sewer Overflows
(CSOs) installed to deal with hydraulic overloading of the sewer system (Gasperi,
2008). Discharge often occurs when combined surface and foul sewers experience
high levels of hydraulic loading during weather events. CSOs are designed to release
raw sewage to river to relieve the pressure on the sewer system and prevent
flooding events (Lau, 2002; Suarez, 2005).
Although CSOs discharge raw sewage directly into surface waters, the increased
levels of dilution both within the river itself when in spate, and an increase in
surface water runoff internally in the sewer means that the effects of these point
discharges are negligible (Baker et al., 2003; Gasperi et al., 2008).
As well as CSOs, STW also discharge raw sewage in times of high hydraulic load. In
adverse weather events, when STW cannot treat the full flow of the incoming
influent, the excess will be stored in storm tanks for later treatment, thus reducing
the effect upon the environment. However, when these tanks become full, they
discharge directly into the watercourse having the same effect as CSOs (Metcalf et
al., 1986; DEFRA 2012).
1.3.2. Diffuse pollution
Diffuse pollution is where pollutants enter the watercourse from multiple points
across the length of a section of river (Arheimer et al., 2004; Faulkner, et al., 2000).
Often individually minor, diffuse pollutants are cumulatively significant and can
have dramatic effects on watercourses. Diffuse pollutants are agriculturally
dominated, entering watercourses along the full contact area with fields via surface
water run off or via leachate (Bowes et al., 2008; Neal et al., 2008a)

22
1.3.2.1. Agricultural Practices
Agriculture is one of the most intense sources of diffuse pollution across the UKs
river network with studies suggesting that around 50% of the phosphorus and 70%
of the nitrate loads delivered to rivers are as a result of agricultural sources (Neal &
Jarvie, 2005; RPA, 2003). This leachate from intensive agricultural practices across
the length of a river means that rivers can receive diffuse nitrate and phosphate
loads, often higher than a point source, along their full length causing an
accumulation in the water column (Neal et al., 2008; Jarvie et al., 2008; Withers &
Lord, 2002).
1.3.2.1.1. Fertiliser application timings
Often, one of the biggest issues causing the run off of phosphorus and nitrates is the
incorrect timing of the use of artificial NPK fertilisers (Hills et al.,1978; Sharpley et
al., 1994). If artificial fertilisers are sprayed prior to a weather event for example
rainfall or snow, this can cause a surface run off of phosphorus and nitrogen into the
watercourse (Neal & Jarvie, 2005; Withers & Lord, 2002; Jarvie et al., 2008; Vega et
al., 1998). If enough time has not passed for the crops to absorb the nitrates and
phosphates provided in the fertilizer, the excess hydraulic loading from rain running
through the soil causes surplus nutrients to be washed into watercourses (Vega et
al., 1998; Smith et al., 2001).
1.3.2.1.2. Research into effects of agriculture
One of the most informative projects into the effects of diffuse agricultural pollution
is the Phosphorus from Agriculture: Riverine Impact Study (PARIS) (PE1226) which
was investigated from 2003-2008 to look at the impacts that agricultural
phosphorus has upon riverine systems (DEFRA, 2008b). The PARIS study has been
working to reduce the agricultural impacts of phosphorus and soluble reactive
phosphorus (SRP) on UK river systems to ensure that the WFD directive target of
‘good ecological status’ by 2015 is met (DEFRA, 2012; DEFRA, 2008b).
The PARIS study has made a number of recommendations for changes to farming
practice, e.g. changes in mode of fertilisation, move towards natural fertilisation, and

23
the use of planning to ensure suitable fertilisation times (Haygarth et al., 2005;
DEFRA, 2008b). The study also identifies that in the subject streams, light and flow
were the main limiting factors of community algal growth. However, changes must
be made in riverine phosphorus content to reach the WFD good ecological status
marker for UK surface waters (DEFRA, 2008b; Mainstone & Parr, 2002).
In addition, the England Catchment Sensitive Farming Delivery Initiative (ECSFDI)
has also been set up by DEFRA to work as a tool to target the aims of the WFD
(DEFRA, 2008; DEFRA, 2008a). The ECSFDI works with farmers across the country
providing advice and seminars on soil, nutrient and manure management as well as
pesticides with the aim of tackling diffuse pollution. Although this advice and
support if voluntary, it is being shown to have a significant effect with a predicted
10-40% reduction in disuse pollution in the catchment areas. This education is
helping to reduce riverine concentrations of both phosphorus and nitrate (DEFRA,
2008; DEFRA, 2008a).
1.3.3. Eutrophication
Eutrophication occurs when an increase in the availability of nutrients causes an
increase in the biological activity of plant life, primarily, algae (Neal et al., 2002;
Bowes et al., 2008; Neal at al., 2008). Algal blooms caused by increases in riverine
nutrients can cause decreased levels of dissolved oxygen (DO) in the watercourse,
therefore reducing the ecological quality of the water (Miranda et al., 2001). One of
the biggest issues is anthropogenic eutrophication caused by nutrient rich
discharges into our watercourses (Mainstone et al., 2002). Discharges from STW,
industrial plants and agriculture have all caused eutrophication to increase over the
past 100 years (Morrison et al., 2001; Neal et al., 2005). This loading of our
watercourses with anthropogenic nutrient inputs has caused record levels of
phosphorus and nitrates concentrations that have the potential to damage the
ecological status of the UK’s watercourses (Bowes et al., 2008; Jarvie et al., 2006).
Eutrophication is one of the pillars of the WFD and is deeply embedded in UK
governmental policy through both DEFRA and the EA (Hering et al., 2010; DEFRA,

24
2012; European Commission, 2012). The EA has a specific eutrophication task force
that works to reduce UK riverine nutrient levels and prevent eutrophication events
(Mainstone et al., 2002). EA riverine SRP target levels can be found in Table 1.3.
Table 1.3: Target phosphorus concentrations for rivers in England and Wales (Environment Agency, 2000), with suggested applications to different river types (Mainstone et al., 2002).
Target Mean SRP (mgl -1) Suggested application
1 0.02 Upland watercourses and
headwaters
2 0.06 Rivers on chalk, hard
sandstone and limestone
3 0.1 Lowland rivers on clay
and alluvium
4 0.2 Interim target for heavily
enriched rivers
Eutrophication is an intrinsically seasonal process that is highest during the spring
and summer plant growing seasons (Neal & Jarvie, 2005). Eutrophication risk is
particularly high during summer months when baseline river flow conditions are
low and there will be low dilution of effluents into the watercourse (Hunt et al.,
2010). These conditions are ideal for algal blooms and eutrophication of smaller
watercourses (Arheimer et al., 2004).
1.3.3.1. Phosphorus
Phosphorus (P) is often seen as the limiting factor for eutrophication (Mainstone &
Parr, 2002) in the UK’s watercourses and is discharged by a number of
anthropogenic sources, i.e. STW, agriculture, industrial effluents into the UK’s rivers
(Bowes et al., 2008; Jarvie et al., 2006). Phosphorus is a vital compound for plants
providing aid for growth, photosynthesis, aid to cell division and the development of
new tissue. Phosphorus is also important for complex energy transformations in
plants (Richardson, 2001).

25
Phosphorus is often deficient is many plants hence the use of phosphorus based
fertilisers which add phosphorus artificially to aid plant growth (Beaton & Nelson,
2005). With phosphorus often being the limiting factor to eutrophication (Mainstone
& Parr, 2002), the rate of plant growth is directly linked to phosphorus inputs into
watercourses, meaning management of phosphorus is critical in controlling
eutrophication in UK river systems (Jarvie et al., 2008; Neal et al., 2010a). This is
why so much emphasis is placed upon controlling phosphorus inputs in both the
WFD and UWWTD (Ricci et al., 2012; Hering et al., 2010). A reduction in phosphorus
discharges and thus in riverine phosphorus concentrations can help to limit
eutrophication levels in UK rivers and aid the WFD to achieving ‘good ecological
status’ for all UK watercourses (Brouwer, 2008; Coquery et al., 2005; Foster et al.,
2005).
One of the most dangerous types of phosphorus to watercourses is soluble reactive
phosphorus (SRP) otherwise known as orthophosphate (Richardson, 2001; Bowes
et al., 2010; Correll, 1998). Orthophosphate is readily available phosphorus that is
found in solution in the water column and is readily absorbed by plants to aid
growth. High levels of Orthophosphate are common causes of eutrophication (Jarvie
& Neal, 2005; Neal et al., 2009; Wade et al., 2002).
1.3.3.2. Nitrogen
Nitrogen (N) is a key nutrient for plants and a limiting factor in eutrophication
(Anderson et al., 2002; Neal & Jarvie, 2005). Nitrogen is a key constituent in amino
acids, the building blocks of proteins and can be added to agricultural crops to
increase yield (Richards, 2000). Plants absorb nitrogen in the form of nitrate or
ammonia, both soluble in water that are present in NPK fertilisers, agricultural
slurries and are discharged to watercourses by STW and industrial discharges
(Goodchild, 1998).
In addition to anthropogenic inputs, nitrogen is also naturally occurring in the form
of nitrate and nitrite. The breakdown of organic matter containing organic nitrogen
can form ammonia, which is toxic to fish and aquatic organisms at high

26
concentrations (Hickley & Vickers, 1994). As part of the nitrogen cycle, ammonia is
also converted back to the less harmful form nitrate via nitrification from riverine
algae and plant life, thus removing ammonia from the water column (Galloway et al.,
2008).
Ammonia inputs to watercourses can come from a variety of sources, primarily
agriculture and sewage treatment (Ruiz et al., 2003). Sewage treatment, if
successful, should remove ammonia concentrations to a negligible level before
discharging to watercourses (Wagner et al., 1996). This ammonia is present as a
result of the sewage influent to the treatment works. However, low temperatures at
treatment works can cause reduced levels of nitrification in the treatment process,
thus increasing the concentration of ammonia discharged (Shammas, 1986).
Agriculture also has a large part to play in ammonia discharges. The discharge of
liquid manure to watercourses via leachate, surface run off, or storm overflow
discharge can cause catastrophic effects to watercourses due to toxic levels of
ammonia being discharged (Randall & Tsui, 2002).
1.4. Sewage Treatment works
STW are the critical link in returning sewage and grey water back into our
environment in a safe and minimally invasive way. (DEFRA, 2012) Sewage
treatment has taken great strides forward in improving the levels of treatment
achieved; this is directly improving the quality of our watercourses (DEFRA, 2014).
Varying in size, STW can take flows from one property to the discharges of a whole
city (DEFRA, 2012). Without STW, raw sewage would be discharged to the UK’s
watercourses, increasing pollution levels and reducing the possibility of potable
abstraction for safe drinking water as well as reducing the amenity value of the UK’s
watercourses.
1.4.1. Types of sewage treatment works
During this project, 3 different types of sewage treatment process will be
investigated to understand their effects on river water quality. Activated sludge
production (ASP), Percolating Filter Bed and Membrane Bioreactor (MBR) treatment

27
works are in current operation and have been specified to meet specific consents
and PE.
All STW follow a similar process, with a different choice of primary, secondary and
tertiary treatment being used in each different process (Metcalf et al., 1972).
Specification of STW technology links directly to the UWWTD as shown in Figure 1.1.
Figure 1.1: Diagram showing levels of treatment required in relation to PE (DEFRA, 2012).

28
Table 1.4: A table outlining the 3 primary sewage treatment technologies implemented in this study.
Key: Activated Sludge Process, ASP; biological oxygen demand, BOD; chemical oxygen demand, COD; Final Settlement Tank, FST;
Treatment Basic principle Benefits Drawbacks Additional points
Activated
Sludge
Process
(ASP)
ASP is the process of treating sewage effluents
using microorganisms held in suspension to break
down the organic matter in the effluent (Osada et
al., 1991). Microorganisms in the Activated
Sludge, commonly known as mixed liquor, are
mixed with incoming effluents in a number of ASP
lanes as shown in Figure 1.2 (Tomlinson et al.,
1966; Metcalf et al., 1972; Gerardi, 2005). ASP
lanes are split into aerobic and anoxic zones via
the placement of diffusers to provide the
breakdown of organic and carbonaceous material
and nitrification (Gerardi, 2005; Kim et al., 2005).
Once the effluent has passed through the ASP
lanes, it then pass forward to a secondary clarifier
or final settlement tank (FST) that settles the
excess mixed liquor before the final treated
effluent is discharged to the watercourse (Metcalf
et al., 1972)
Suitable for high PE sites.
High removal of
suspended solids, BOD &
COD
Biological nitrification
and phosphorus removal
Self-regulating with
reseeding from Returned
Activated Sludge (RAS)
shown in Figure 1.3
High levels of sludge are
produced which is
suitable for anaerobic
digestion (Metcalf et al.,
1972; Liu et al., 2000)
Energy intensive
High capital installation
costs
Requires regular
maintenance and
adjustment
High levels of sludge are
produced which requires
disposal (Metcalf et al.,
1972; Liu et al., 2000)
ASP is the most
common type of
sewage treatment
in the UK (DEFRA,
2012)

29
Table 1.4: A table outlining the 3 primary sewage treatment technologies implemented in this study.
Key: Activated Sludge Process, ASP; biological oxygen demand, BOD; chemical oxygen demand; COD; Final Settlement Tank, FST;
Treatment Basic principle Benefits Drawbacks Additional points
Membrane
Bioreactor
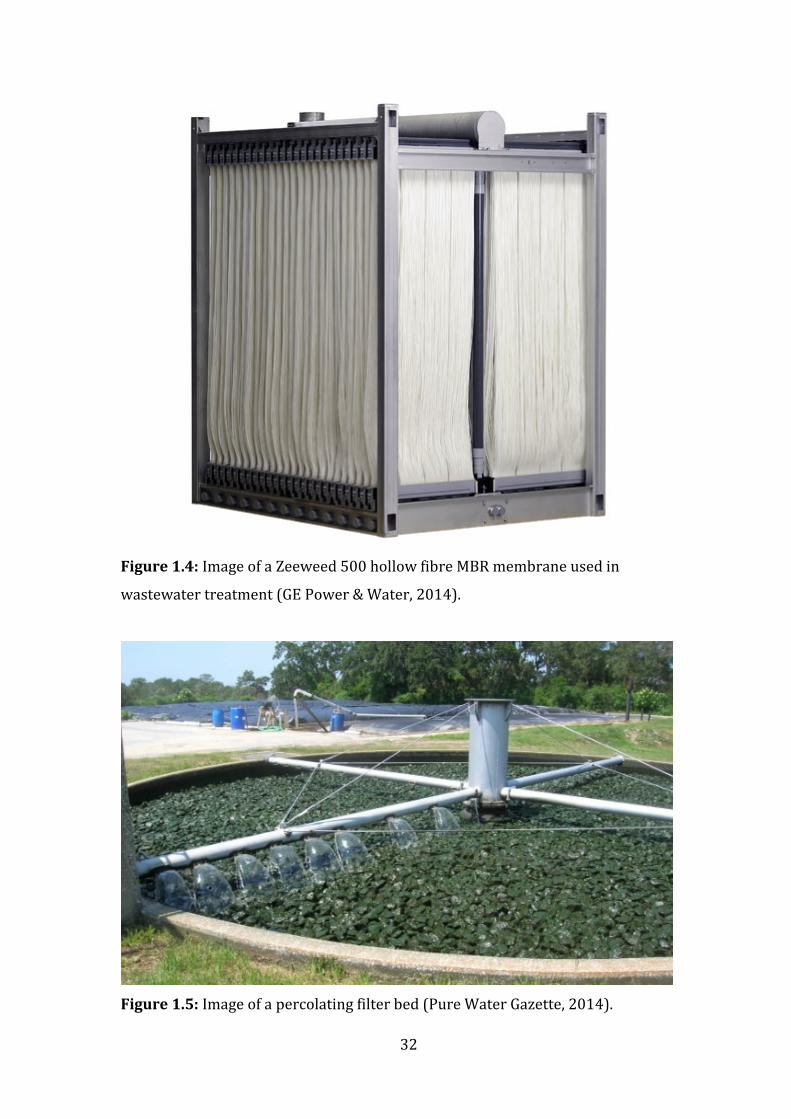
(MBR)
Membrane Bioreactor (MBR) is a
combined treatment method utilising
both ASP and a membrane unit to treat
effluent. MBR treatment plants work by
passing effluent through 6, 3 and 1mm
screens before moving to a traditional
ASP stage (Judd, 2004). Once the
effluent has passed through the ASP, it
moves into a membrane plant where
Zeeweed 500 membranes (Figure 1.4)
are submerged in tanks of effluent from
the ASP (Noble, 2006; Buer & Cumin,
2010). Negative pressure then draws
the effluent through a 0.04nm pore
membrane that removes solid particles
(Buer & Cumin, 2010). The membrane
in a MBR plant replaces the FST in a
standard ASP plant (Judd, 2010)
Low site footprint
Very high effluent quality
Very high suspended-
solids, BOD and COD
removal
High levels of effluent
disinfection
Ease of automation (Noble,
2006; Buer & Cumin, 2010)
Technically complex
High initial install capital
required
Requires highly trained
technicians
Requires screening to 1mm
High energy usage
Chloride discharge can occur
if recovery clean and back
pulses are not completed
fully (Judd, 2004; Buer &
Cumin, 2010)
Site provides
membrane cleaning
and de-ragging via 1-
minute back pulses
of final effluent at 30-
minute intervals
Maintenance cleans
using citric acid
(C₆H₈O₇) and
recovery cleans
using Hydrochloric
acid (HCl-) are
completed weekly
and 6 monthly
respectively

30
Table 1.4: A table outlining the 3 primary sewage treatment technologies implemented in this study.
Key: Activated Sludge Process, ASP; biological oxygen demand, BOD; chemical oxygen demand, COD; Membrane Bioreactor, MBR;
Treatment Basic principle Benefits Drawbacks Additional points
Percolating
(Trickling)
Filter Bed
A Percolating Filter treatment works uses
circular or rectangular tanks filled with
treatment media (Figure 1.5), often gravel or
broken rocks onto which effluent can be
sprayed via a rotating spray arm as shown in
Figure 1.6 (Metcalf et al., 1972). Highly
aerobic conditions cause bacteria that break
down the nitrates and phosphates of the
incoming effluent as it passes over the media.
This produces a treated effluent that exits the
bottom of the filter bed (Boller & Guier,
1986). Once the effluent has passed through
the filter beds, it will then pass through to a
humus settlement tank allowing any final
organic compounds that haven’t been
digested in the beds to be settled before
discharge to the watercourse (Metcalf et al.,
1972; Grady et al., 2012)
Low cost form of
treatment
Low maintenance
required
Low energy costs for
gravitational systems
Suitable for low flow
treatment (Metcalf et
al., 1972; Boller &
Guier, 1986)
Large footprint for large flow
treatment
Fly and odour issues can
occur. Fly dosing may be
required
Can have low BOD, COD and
suspended-solid removal
(Boller & Guier, 1986; Grady
et al., 2012)
Percolating Filter Bed
is often seen as a
traditional form of
treatment. Other
treatment methods
such as ASP or MBR
are often now
favoured for high
flow sites

31
Figure 1.2: Image showing multiple ASP lanes with aerobic and anoxic zones
(Swain, 2015).
Figure 1.3: Diagram of the Activated Sludge Process (Pipeline, 2003).
32
Figure 1.4: Image of a Zeeweed 500 hollow fibre MBR membrane used in
wastewater treatment (GE Power & Water, 2014).
Figure 1.5: Image of a percolating filter bed (Pure Water Gazette, 2014).

33
Figure 1.6: Diagram of a percolating filter bed (Pitocchelli, 2001).
1.5. River water and effluent quality parameters
River water and effluent parameters are tested to understand the underlying
chemical composition of the watercourse. The ability to understand the baseline
chemical composition of the watercourse allows for pollutants and toxins to be
identified. This study has set out to identify 14 individual determinants and the
effects that ASP, MBR and Percolating Filter effluents have upon water chemistry.
1.5.1. Physical Determinants
1.5.1.1. Temperature
Temperature has a dramatic impact upon riverine biological activity and growth,
defining the number, type and species of organisms that can thrive (Hester et al.,
2011). Temperature is a defining factor in river water chemistry; this is due to an
increase in temperature causing an increase in biological activity and the rate of
riverine chemical reactions (Chitluri, 2015).

34
Temperature is also critically linked to conductivity. With an increase in river
temperature, the mineral concentrations from ground rocks that are dissolved into
the water column increase therefore increasing conductivity (Vega et al., 1998).
Temperature can also change conductivity via water viscosity. An increase in a
waters viscosity, which is directly related to temperature, increases the mobility of
the ions in water causing an increase in conductivity. An increase of 1oC can cause a
2-3% increase in conductivity (Hayashi, 2004).
Finally, there is also a negative correlation between river water temperature and
DO. As temperature increases, the oxygen saturation levels in the water column
decrease causing a decrease in biological activity and growth (Sánchez et al., 2007).
1.5.1.2. Conductivity
Conductivity is a measure of the dissolved ions dissolved in the water column
(Chitluri, 2015). Measured in Siemens, conductivity relates to the amount of ions,
usually in the form of minerals from ground rock or salts that are found in
watercourses (Hill et al., 1997). Conductivity increases linearly with ion
concentrations meaning that with conductivity readings, ion concentrations in
solution can be extrapolated (Daniel et al., 2002).
Industrial discharges, STW and road run off can have a large effect upon the
conductivity of a watercourse, loading the water with charged ions that can disrupt
biological processes (Daniel et al., 2002; Morrison et al., 2001) and also disrupt
aquatic non-visual prey detection (Maciver et al., 2001).
1.5.1.3. Flow
The flow of a river is important as flow has a direct relationship to dilution and
assimilative capacity. With an increase in flow, the dilution rate of pollutants and
toxins increases (Hunt et al., 2010). This has a direct effect on the assimilative
capacity of a river, the ability of a river to transport harmful pollutants and toxins
without having affect upon aquatic life or potable water supplies
35
(Farhadian et al., 2014). Therefore, flow will regulate the amount of discharges
possible to a watercourse whilst keeping it of sound ecological status.
1.5.2. Chemical Determinants
1.5.2.1. Ammonia
Ammonia (NH3) is a highly toxic waterborne form of nitrogen that is formed during
the decomposition of organics (Worrall et al., 2009; O'Riordan et al., 2003). The
toxicity of ammonia is directly correlated to both pH and temperature. An increase
in pH or decrease in temperature can cause a dramatic rise in the toxicity of
ammonia, especially in highly alkaline watercourses (Hickey, 1994; Morrison et al.,
2001). Although a requirement for life, plants have a higher resistance to the toxicity
of ammonia than fish or other aquatic life (Randall, 2002).
1.5.2.2. Biochemical Oxygen Demand (BOD)
BOD is a measure of how much DO is being consumed as microorganisms break
down organic matter (European Environment Agency, 2014). A high BOD therefore
is indicative of high levels of biological activity that may cause a fall in DO
concentrations of rivers (Daniel et al., 2002).
High levels of BOD can be caused by organic pollution, often caused by sewage
inputs into watercourses causing a spike in biological activity (Figuerola et al., 2012;
Singh et al., 2004). High levels of BOD can also be caused by phosphorus or nitrate
spikes, both of which can be limiting factors to plant growth, this increase in plant
growth and organic matter causes a decrease in DO levels (Neal et al., 2008).
1.5.2.3. Boron
Boron (B) is a water-soluble non-metallic substance that is mined to create
substances such as boroniated fibreglass and borosilicate glass. Boron has also been
used as a whitening agent in detergents (Weinthal et al., 2005; Neal et al., 2002).

36
Due to the use of Boron in detergents and low reactivity in the hydrosphere as well
as its lack of natural inputs, boron has become a primary sewage tracer for water
quality analysis in relation to sewage inputs (Neal et al., 2010b; Neal et al., 2006).
Jarvie et al., (2006) has shown a direct correlation between riverine boron levels
and levels of sewage in watercourses demonstrating that boron can be used to
identify the presence of sewage and its dilution factor in watercourses. This has
however been questioned by Nestler et al., (2011) due to the decrease in boron use
in detergents over the past decade.
1.5.2.4. Chloride
Chloride (Cl-) is a naturally occurring ion present in fresh water. Chloride is formed
when substances such as sodium chloride (NaCl) or potassium chloride (KCl)
dissolve in water and separate to form separate ions (Green et al., 2001).
Chloride can be found in increased concentrations in watercourses due to
anthropogenic inputs for example an increase in surface water runoff from grit salt
used as a road de-icer into watercourses (Hunt et al., 2012; Godwin et al., 2003) as
well as agricultural discharges (Kelly et al., 2010). Chloride can also have an effect on
the reproductive rates of freshwater organisms and plants and if found in high
enough concentrations, as well as being toxic to aquatic life (Newman & Aplin, 1992;
Williams & Eddy, 1986).
1.5.2.5. Chemical Oxygen Demand (COD)
COD is the measurement of the total oxygen required to oxidise the chemicals in the
water column into carbon dioxide (CO2) and water (H2O) (Clair et al., 2003). High
levels of COD in effluents can cause riverine hypoxia during decomposition of
aquatic organics (Vega, et al., 1998).

37
1.5.2.6. Dissolved Oxygen (DO)
DO is the measure of the free, non-compound oxygen (O2) that is dissolved in water.
DO is measured in mg/l-1 with the maximum amount of oxygen the water can hold
being called the saturation point (Daniel, 2002).
DO has a direct correlation with temperature, with an increase in temperature
causing an inverse relationship to the DO water can retain (Wilcock et al., 1998). DO
is inputted into the water column via surface atmospheric diffusion or as a by-
product of plant photosynthesis (Cox, 2003).
Surface atmospheric diffusion increases when water is mixed through aeration via
rapids, waterfalls or other moving water bodies. This movement of water increases
the diffusion rate of O2 into the water column (Cox, 2003).
DO is as a result of the respiration of plants during photosynthesis. This DO input
from photosynthesis will peak during daytime and is seasonal with most inputs
coming during summer months (Auer & Effler, 1999; Schurr & Ruchti, 1977).
DO is also a primary indicator of pollution events, with low levels of DO being
indicative of an organic pollution from a sewage or agricultural discharge. This is
caused by microbial bacteria assimilating the available oxygen to break down the
organic pollutant (Daniel et al., 2002; Tsai, 1973). This reduction in DO can cause
very low DO levels and lead to aquatic fatalities via hypoxia (San Diego-McGlone et
al., 2008). The conventional threshold for hypoxia in river water is 2mg O2/l, with
first larval zoea stage of crustaceans, some of the most sensitive aquatic organisms,
having a hypoxic threshold of 8.6mg 02/l (Vaquer-Sunyer & Duarte, 2008).
1.5.2.7. Nitrate
Nitrate (NO3-) is a naturally occurring oxidised form of nitrogen, caused by the
nitrification of ammonia in the water column from organic breakdown first
transferring to nitrite and then finally to nitrate. (DEFRA, 2002). Excess levels of

38
nitrates in watercourses can lead to anoxia. This is a lack of DO in the water column
due to excessive nutrients generating algal blooms (Justić et al., 2003).
1.5.2.8. Nitrite
Nitrite (NO2-) is formed by the breaking down of ammonia in the water column (Kim
et al., 2006) and is highly toxic to aquatic organisms (Tilak et al., 2007). Nitrite can
cause hypoxia in fish by bonding with the haemoglobin in the fish blood stream and
replacing oxygen with methemoglobin; nitrite bonded with haemoglobin. This can
prove fatal for fish and other aquatic organisms (Williams & Eddy, 1986; Tilak et al.,
2007).
1.5.2.9. Orthophosphorus.
Orthophosphorus, (PO43–) is a measure of the forms of inorganic phosphorus that
are deposited in watercourses via the run off of fertilisers from agricultural practices
or sewage treatment (Bowes et al., 2008; Jarvie et al., 2006).
Orthophosphorus is vital for the survival of aquatic plant life but can also cause
eutrophic algal blooms causing a decrease in riverine DO levels (San Diego-McGlone
et al., 2008). As you can see from the graph in Figure 1.7, the levels of
orthophosphorus in European rivers has been reducing since 1992 (European
Environment Agency, 2015). This is due to a reduction in anthropogenic inputs via
increases in technology at STW and increase understanding of orthophosphorus
inputs by the agricultural community (Mainstone & Parr, 2002; Neal et al., 2010a).

39
Figure 1.7: A graph taken from EEA showing river orthophosphate levels from 1992 – 2012 in European rivers (European Environment Agency, 2015).
1.5.2.10. pH
pH is a numerical value given to how acidic or alkali a substance or body of water is
by measuring the concentration hydrogen (H+) ions. pH is a logarithmic scale
ranging from 0-14 with pH 7 neutral (Chitluri, 2015).
pH has a direct correlation with the solubility of nutrients. A minor increase in pH
can increase the solubility of nutrients such as phosphorus and nitrate making them
readily available for plants and thus causing a growth boom in aquatic plant
populations (Hill & Neal., 1997; Seybold et al., 2002).
1.5.2.11. Phosphorus
Phosphorus (P) is a measurement of the total phosphorus inputs, both organic and
inorganic, into a riverine system (Bowes et al., 2008; Chenet al., 2014). A limiting
factor in plant and algal growth, phosphorus can often be seen as a pollutant as it is
commonly discharged to watercourses in high quantities leading to eutrophication
(Correll, 1998).

40
Phosphorus is primarily discharged by STW as well as by industrial and agricultural
activities and natural processes (DEFRA, 2008b; Jarvie et al., 2006; Mainstone &
Parr, 2002).
1.5.2.12. Sulphate
Sulphate (SO42-) is a non-metallic element that is found in many industrial processes
and discharged by industrial processes that use sulphates or sulphuric acid (H2SO4)
for example mining and smelting operations, paper mills, textiles and tanneries
(Delisle & Schmidt, 1977; Ciardelli & Ranieri, 2001), and natural decomposition.
Sulphate is also discharged via agricultural runoff, being a constituent of agricultural
fertilisers and pesticides (Weston et al., 2004). At high concentrations, sulphate is
toxic to aquatic life, however the levels required for toxicity are incredibly high
(Stumm & Morgan, 2012).
1.5.3. Chemical Standards Report
The EA Chemical Standard report is a set of statutory standards at UK and European
level for surface water quality setting concentration limits (Environment Agency,
2011a). Chemical Standards for determinants in this project can be found in Table
1.5.

41
Table 1.5: EA Chemical Standards report for UK and EU river chemical concentrations (Environment Agency, 2011a).
Key: ammonia, NH3; European Union, EU; oxygen, O2;
Determinant Type of
Standard
Environmental
Medium
Legal Status
of standard
Standard Values Notes
Ammonia UK Standard
Freshwater Statutory Salmonid and cyprinid waters: < /= 0.025 mg NH3/l
Based on 95% of samples taken over a 12 month period Values for non-ionised ammonia may be exceeded in the form of minor peaks in the daytime
BOD UK Standard
Freshwater Statutory Salmonid Waters: < /= 3 mg O2/l Cyprinid Waters: < /= 6 mg O2/l
Based on 95% of samples taken over a 12 month period. These are guide values
Boron UK Standard
Surface Water Statutory Protection of sensitive freshwater aquatic life (e.g. salmonid fish): 2000 ug/l
Protection of other freshwater aquatic life (e.g. cyprinid fish): 2000 ug/l
Protection of saltwater life: 7000 ug/l
These values are for total boron and represent the annual average
COD EU Standard
Surface Water Intended for Abstraction for Drinking Water
Statutory No statutory value for surface water concentrations. 30 mg O2/l to be used as a guide for abstraction values

42
Table 1.5: EA Chemical Standards report for UK and EU river chemical concentrations (Environment Agency, 2011a).
Key: chlorine, Cl; Environmental Quality Standard, EQS; European Union, EU; nitrate, NO3; oxygen, O2; sulphate, SO4;
Determinant Type of
Standard
Environmental
Medium
Legal Status of
standard
Standard Values Notes
Chloride UK Non-statutory EQSs
Surface Water Non-Statutory Freshwater annual average:
250,000 ug/l
Total anions of 250,000 ug/l (annual average) also proposed. Total anion concentration 'normalised' to Cl- by Cl- = SO4-/1.5 = NO32-/1.8
Conductivity UK
Standard
Protection of Surface Waters Intended for the Abstraction of Drinking Water
Statutory Guide: 1000 uS/cm at 20°C Imperative: none set
In December 2007, the Directive through which these standards were established was repealed under the Water Framework Directive (2000/60/EC). Now values as guidance
DO UK
Standard
Freshwater Statutory Salmonid waters: 50% > /=
9 mg O2/l
Cyprinid waters: 50% > /= 7
mg O2/l
(1) When the oxygen concentration falls below 6 mg/l, the Environment Agency shall establish whether this is the result of chance, a natural phenomenon or pollution and shall adopt appropriate measures. The Environment Agency must prove that this situation will have no harmful consequences for the balanced development of the fish population
Nitrate UK Standard
Protection of Surface Waters Intended for the Abstraction of Drinking Water
Statutory 50mg NO3/l Compliance with these standards may be waived under exceptional meteorological or geographical conditions. Based on 95% of samples.

43
Table 1.5: EA Chemical Standards report for UK and EU river chemical concentrations (Environment Agency, 2011a).
Key: chlorine, Cl; Environmental Quality Standard, EQS; European Union, EU; nitrate, NO3; oxygen, O2; sulphate, SO4;
Determinant Type of
Standard
Environmental
Medium
Legal Status of
standard
Standard Values Notes
Nitrites EU Standard
Freshwater Statutory
Salmonid Waters: < /= 0.01 mg NO2/l Cyprinid Waters: < /= 0.03 mg NO2/l
Based on 95% of samples taken over a 12-month period. These refer to nitrites and are guide values
Ortho-
phosphorus
No Standard
N/A N/A N/A N/A
pH UK Standard
Freshwater Statutory Salmonid and cyprinid waters: 6-9
Based on 95% of samples taken over 12-month period.
Phosphorus EU Standard
Freshwater Non-Statutory No imperative or guide values are set.
Applies to total phosphorus
Sulphate UK Standard
Surface Water Intended for Abstraction for Drinking Water
Statutory 250 mg SO4/l
Compliance with this standard may be waived under exceptional meteorological or geographical conditions
Temperature UK Standard
Freshwater Statutory Salmonid waters: < /= 1.5°C increase < /= 21.5°C Cyprinid waters: < /= 3°C increase < /= 28°C
Thermal discharges must not cause the temperature downstream of the point of thermal discharge (at the edge of the mixing zone) to exceed the stated amount for times other than the breeding season or for waters that do not contain fish that need cold water to breed

44
1.6. Gaps in current studies
There have been a number of studies into the effects of sewage treatment effluents
on watercourses, specifically the UK based work by Jarvie and Neal. However, these
studies have only been based on river water samples and have not had access to FE
samples. The only study with FE sample access identified was Morrison et al., (2001)
who looked at FE discharges into wetlands in the Keiskamma River in South Africa.
To date, there are no studies into UK river water quality that have access to FE data.
It is believed that this is due to commercial sensitivity, with water companies not
wanting to release sensitive FE data for fear of prosecution from the regulator.
1.7. Aims and objectives
The aim of this study is to determine the effects that sewage treatment effluents
have upon the receiving watercourse by analysing both in-situ and chemical
determinants from 7 sewage treatment sites across the midlands area. The study
will look to address the following hypothesis:
1.7.1. Hypotheses
H0 - The discharge of sewage treatment effluent does have a significant effect upon
the receiving watercourse.
H1- The discharge of sewage treatment effluent does not have a significant effect
upon the receiving watercourse.

45
2. Methodology and Equipment
2.1. Commercial Sensitivity
Due to the commercial sensitivity of the water industry, site anonymity was
maintained to allow FE data to be collected and used. All site names have therefore
been removed from this study and replaced with site 1-7. Ensuring anonymity for
the sites met Severn Trent Waters criteria for allowing this project to take place. An
email confirming commercial sensitivity can be found in appendix 1.
2.2. Site Selection
All sites sampled were based in the Midlands region served by Severn Trent Water.
Site selection was made based upon a number of criteria to include, a mix of
technologies, size of treatment works, and access to the watercourse approximately
200 metres upstream and downstream of the FE sample point. Site treatment
technologies can be found in Table 2.1.
Characteristics for the 7 sampled sites vary dramatically. A mix of urban and rural
sites has been selected to provide contrast. The size of the receiving watercourse
also varies across sites with some sites discharging to small brooks and others to
large rivers. Full breakdown of site descriptions can be found in Table 2.2.
A site layout and sample point map is included for each site. Site 1 layout is
demonstrated in Figure 2.1 with a sample point map demonstrated in Figure 2.2.
Due to commercial sensitivity, only river course data is shown in sample point maps
to retain site anonymity. Site layouts and sample point maps for all sites can be
found in appendix 2 and 3.

46
Table 2.1: A table showing treatment methods employed at sampled STW.
Site
Number
Preliminary
Treatment
Primary
Treatment
Secondary
Treatment
Tertiary
Treatment
Consented
flow pass
forward
Population
Equivalent
(PE)
Notes
Site 1 Primary screening to 6 & 3mm
4 primary settlement tanks
4 rectangular Percolating Filter beds
4 Humus tanks and P-stripping
95 l/s 36,000
Site 2 Primary screening to 6mm
2 primary settlement tanks
4 circular Percolating Filter beds
4 Humus tanks 17 l/s 5,500
Site 3 Primary screening to 6 & 3mm
2 primary settlement tanks
2-lane ASP plant
7 Percolating Filter beds and 3-lane Humus tank, P-stripping
50 l/s 25,000 Percolating Filter works in place due to ASP not providing nitrification
Site 4 Primary screening to 6, 3 & 1mm
N/A 2-lane ASP plant
Membrane Bioreactor (MBR) plant
85 l/s 2,300
Site 5 Primary screening to 6 & 3mm
6 primary settlement tanks
Multi-lane ASP plant
15 final settlement tanks, P-stripping
225 l/s 400,000
Site 6 Primary screening to 6 & 3mm
3 primary settlement tanks
Multi – lane ASP plant
3 final settlement tanks, P-stripping
125 l/s 47,000
Site 7 Primary screening to 6mm
N/A 10 Percolating Filter beds
Nitrifying NSAF 95 l/s 22,000 NSAF provides nitrification and suspended solids removal
Key: Activated Sludge Process, ASP; Membrane Bioreactor, MBR; Nitrifying Surface Aerated Filter, NSAF;

47
Table 2.2: A table showing site descriptions for sampled STW.
Site
Number
Setting location Watercourse
characteristics
Influent Flows
to treatment
works
Sample Location
Other features
Site 1 Rural with high levels of agriculture and local industry
Small, fast flowing brook. Book regularly bursts its banks in high flow.
Residential and industrial
Upstream taken from the riverbank, downstream taken from road bridge
Dairy herd have direct access to brook between FE and downstream point. Agricultural runoff and surface water discharge evident downstream of FE point
Site 2 Very rural, located outside small town. High levels of agriculture in local area
Medium sized river Residential Upstream sample taken from road bridge, downstream taken from the riverbank
Flows can be seasonal due to high levels of tourism in the local area. Site is also prone to high flows during wet weather events and regularly discharges to storm
Site 3 Outskirts of a medium sized rural industrial town
Medium sized river that flows through the town itself before reaching the treatment works
Residential and industrial
Both upstream and downstream samples are taken from the riverbank. Upstream sample point is located in the valley with arable fields adjacent
River flows through the town itself before reaching the treatment works. Other industrial inputs are known and regulated upstream of STW
Site 4 Outskirts of medium sized rural town
Small, fast flowing river. Watercourse is classified as sensitive
Residential and industrial
Upstream sample taken from footbridge, downstream sample taken from the riverbank
Watercourse is sensitive with high EA interest and high recreational value
Key: Environment Agency, EA; Final Effluent, FE;
48
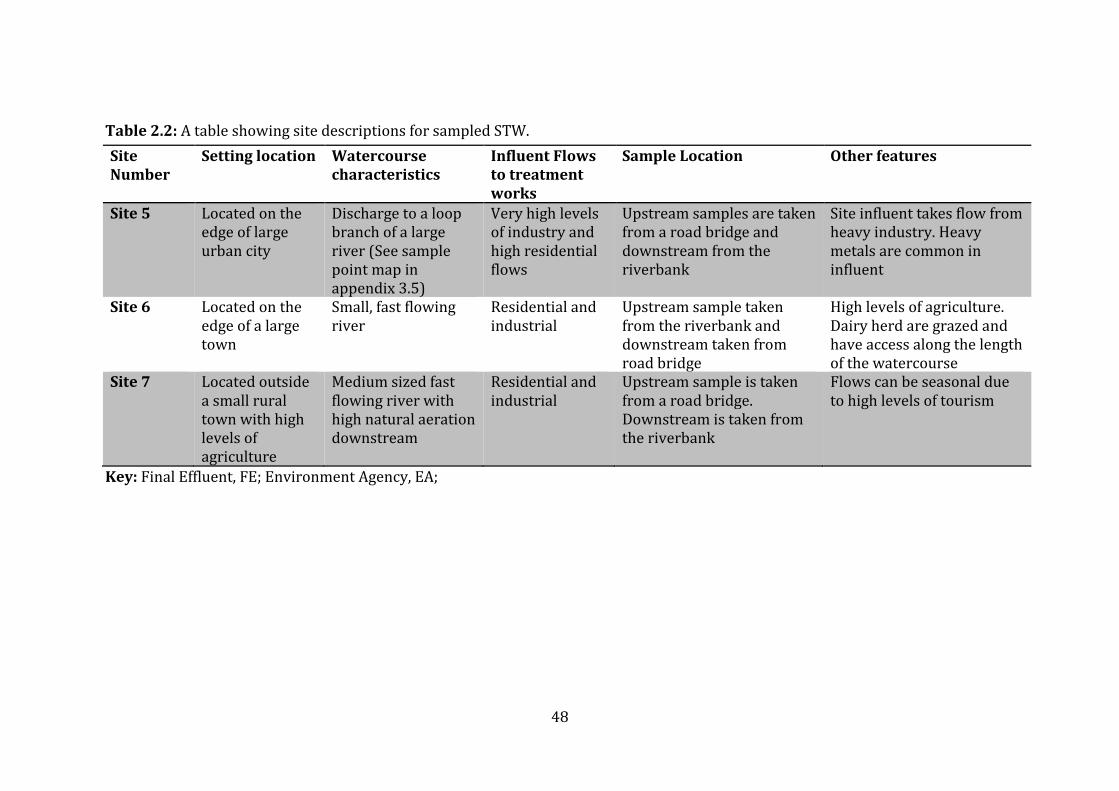
Table 2.2: A table showing site descriptions for sampled STW.
Key: Final Effluent, FE; Environment Agency, EA;
Site
Number
Setting location Watercourse
characteristics
Influent Flows
to treatment
works
Sample Location
Other features
Site 5 Located on the edge of large urban city
Discharge to a loop branch of a large river (See sample point map in appendix 3.5)
Very high levels of industry and high residential flows
Upstream samples are taken from a road bridge and downstream from the riverbank
Site influent takes flow from heavy industry. Heavy metals are common in influent
Site 6 Located on the edge of a large town
Small, fast flowing river
Residential and industrial
Upstream sample taken from the riverbank and downstream taken from road bridge
High levels of agriculture. Dairy herd are grazed and have access along the length of the watercourse
Site 7 Located outside a small rural town with high levels of agriculture
Medium sized fast flowing river with high natural aeration downstream
Residential and industrial
Upstream sample is taken from a road bridge. Downstream is taken from the riverbank
Flows can be seasonal due to high levels of tourism

49
Figure 2.1: Site diagram showing layout of Site 1.
Figure 2.2: River course and sample point map for Site 1 showing upstream, final effluent and downstream sample locations.
50
2.2.1. Sample locations
Three spot samples were taken at each site to provide an overview of the effect
sewage treatment effluent has upon a watercourse. An upstream sample was taken to
act as a reference of river water quality, a FE sample was taken to give a reference of
the inputs from the STW, and a downstream sample was taken to understand the
effects that the FE sample has upon the watercourse. A 200m radius from both FE and
storm outfalls was used with samples being taken as close to this 200m radius as
possible. This was to allow for the upstream sample to be representative of non-
sewage inputs and satisfactory dilution to occur downstream (Hunt et al., 2010).
2.3. Sampling Timescales
Sampling for this project took place during a 10-week period between November
2014 and January 2015. Sample collections during weeks 7 and 8 were slightly
amended due to the Christmas shut down of NLS Laboratories.
2.4. Sample Technique
To collect samples for analysis, a standardised sampling regime was used in line with
the EA standard operating procedures. Personal protective equipment was provided
by Severn Trent to be worn on-site as per site regulations. A full list of equipment is
found in appendix 4.
Two different sample bottles were used to store and transport water prior to analysis.
Due to analytical requirements, samples were collected in both PET 1L and MET
125ml bottles for each sample point to allow for a full range of analysis. A list of
analysis and bottle requirements can be found in appendix 5.
2.4.1. Bridge sampling technique
Samples are taken from the middle of the watercourse. A 1-litre food grade stainless
steel sampling can was attached to 10 metres of stainless steel chain and lowered into
the watercourse. Care was taken on both lowering and raising the sampling can to
prevent contact between the chain and the bridge as this may dislodge contaminants
51
into the sample can. Stainless steel chain was preferred to blue rope due to
contamination issues with water absorption of rope. The sample can was rinsed in
river water prior to every sample being taken to reduce the chance of cross
contamination. Analysis and bottling was completed at bridge level (Environment
Agency, 2014a).
2.4.2. Riverbank sampling technique
A safe access point was chosen to allow easy access to water level. A telescopic
sampling pole was be used and extended to its maximum 3m length to allow for reach
into the central stream of the watercourse. The sample can was rinsed in river water
prior to a sample being collected. Once collected, samples were then analysed and
bottles bankside (Environment Agency, 2014a).
2.4.3. Final Effluent sampling technique
To collect FE samples, site protocols for access to FE sample point were followed. The
sample container was rinsed in FE prior to a sample being collected. Analysis and
bottling was completed at FE point.
2.5. Sample Analysis
2.5.1. In-situ data collection
2.5.1.1. Temperature and DO
Temperature and DO readings were taken using a HACH (HQ30d) probe. The probe
was submerged 6-8cm into the sample and held in suspension until the reading had
stabilised using the inbuilt stabilisation (HACH, 2013). All readings were taken in
triplicate and strictly followed the EA Operational Standards 529_06 & 530_06
(Environment Agency 2010a; Environment Agency 2010b).

52
2.5.1.2. Conductivity and on-site pH
Conductivity and pH readings were taken using a Hanna Combo pH & EC HI98130
probe. The probe was submerged 6-8cm into the sample and held in suspension until
the reading had stabilised for 10 seconds (Hanna, 2005). All readings were taken in
triplicate and follow the EA Operational Standards 351_06 & 528_06 (Environment
Agency, 2010c; Environment Agency, 2014b). The Hanna Combo pH & EC was
calibrated before every sample day using pH 4 & 7 buffer solution
2.5.1.3. Flow
Flow measurements were taken from MCERT flow meters installed on the FE outfall.
These flow measurements are required for consented flow rates.
2.5.2. Laboratory Analysis
Samples were collected and bottled on-site before being transported to NLS. After
delivery to NLS, samples were stored in refrigerators to keep them in a dark cool
environment to inhibit photosynthesis thus preventing algal growth and
orthophosphate uptake (Jarvie et al., 1999). Analysis was completed within 2 days of
receipt. The following determinants have limited methodological information as the
analysis was conducted by NLS. Due to commercial sensitivity, detailed
methodological information is not available. However, the same laboratory was used
for all sample analysis and internal NLS and external quality assurances would have
ensured analysis consistency.
2.5.2.1. Ammonia
A Kone Discrete analyser was used to test for Ammonia. Ammonia reacts with
salicylate and dichloroisocyanurate in the presence of sodium nitroprusside to form a
blue colour, the intensity of which is proportional to the amount of ammonia present.
Sodium citrate is then added to mask possible interference from cations and the
colour produced was measured at 660nm (National Laboratory Service, 2015c).

53
2.5.2.2. Biological Oxygen Demand
Do was tested using robotic probe that self-cleans in deionised water. The BOD is
defined as the mass of DO required by a specified volume of liquid for the process of
biochemical oxidation over 5 days at 20oC in the dark (National Laboratory Service,
2015a).
2.5.2.3. Boron
An Inductively Coupled Plasma Optical Emission Spectrometer (ICPOES) was used to
test for Boron. Samples are digested in a mixture of concentrated nitric and
hydrochloric acid in an oven at 90oC for 16 hours, filtered and the metals
concentration determined by ICPOES (National Laboratory Service, 2015e).
2.5.2.4. Chemical Oxygen Demand
A Spectrophotometer was used to analyse for COD. Samples were oxidised by
refluxing with sulphuric acid and potassium dichromate with a silver salt to catalyse
the oxidation of alcohol and low molecular weight acids. Mercuric sulphate and excess
silver salt suppresses chloride interference and with it the effect due to ammonia. The
mixture was refluxed for two hours and the residual dichromate was determined
photometrically. The appearance of the green colour of Cr3+ is used for the
measurement. The amount of dichromate reduced is expressed in the form of
milligrams of oxygen consumed per litre of sample (National Laboratory Service,
2015b).
2.5.2.5. Chloride
A Kone Discrete analyser was used to test for chloride. Chloride reacts with mercuric
thiocyanate forming a mercuric chloride complex. Released thiocyanate reacts with
iron (III) forming a red ferric thiocyanate complex. The intensity of colour produced,
measured at 510nm, is proportional to the chloride concentration (National
Laboratory Service, 2015c).

54
2.5.2.6. Nitrate
Kone Discrete analyser was used to test for nitrate. Nitrate was reduced to nitrite by
hydrazine under alakaline conditions. The total nitrite is then treated with
sulphanilamide and N-1- naphthylethylene diamine dihydrochloride under acidic
conditions to form a pink azodye. The intensity of this dye is directly proportional to
the concentration of total oxidised nitrogen (National Laboratory Service, 2015c).
2.5.2.7. Nitrite
A Kone Discrete analyser was used to test for nitrite. Nitrite ions, when reacted with a
reagent containing sulphanilamide and N-(1-naphthyl)-ethylenediamine
dihydrochloride, in the presence of acid, produce a highly coloured azo dye that was
measured photometrically at 540nm (National Laboratory Service, 2015c).
2.5.2.8. Orthophosphate, Reactive as P
A Kone Discrete analyser was used to test for orthophosphate. Orthophosphate reacts
with ammonium molybdate and antimony potassium tartrate under acidic conditions
to form a complex which, when reduced with ascorbic acid produces an intense blue
colour, the absorbance of which is measured at 880nm (National Laboratory Service,
2015c).
2.5.2.9. pH Laboratory
An automated pH probe was used to test pH. The equipment is calibrated using buffer
solutions of known pH (National Laboratory Service, 2015d).
2.5.2.10. Phosphorus
An Inductively Coupled Plasma Optical Emission Spectrometer (ICPOES) was used to
test for phosphorus. Samples were digested in a mixture of concentrated nitric and
hydrochloric acid in an oven at 90oC for 16 hours, filtered and the metals
concentration determined by ICPOES (National Laboratory Service, 2015c).

55
2.5.2.11. Sulphate
A Dionex ICS-90 ion chromatograph was used to test for sulphate. Ions in a sample
were separated by being passed through a chromatography column containing a low
ion exchange capacity resin. The sample was eluted by using a weak solution of
sodium carbonate as a mobile phase. Eluent from the column was passed through a
continuous regeneration suppressor, where cations such as sodium and potassium
were replaced with hydrogen ions thus producing a low conductivity background. The
anions were detected using an electrical conductivity detector (National Laboratory
Service, 2015e).
2.6. Statistical analysis
Statistical analysis was completed using IBM SPSS V.22 statistics software. SPSS was
used to define normality with the dataset being defined as normally distributed.
Because of this, ANOVA was chosen as a comparison of means, and Tukey was used
for post-hoc analysis (Ennos, 2007; Dytham, 2010). Full mean results can be found in
appendix 6.
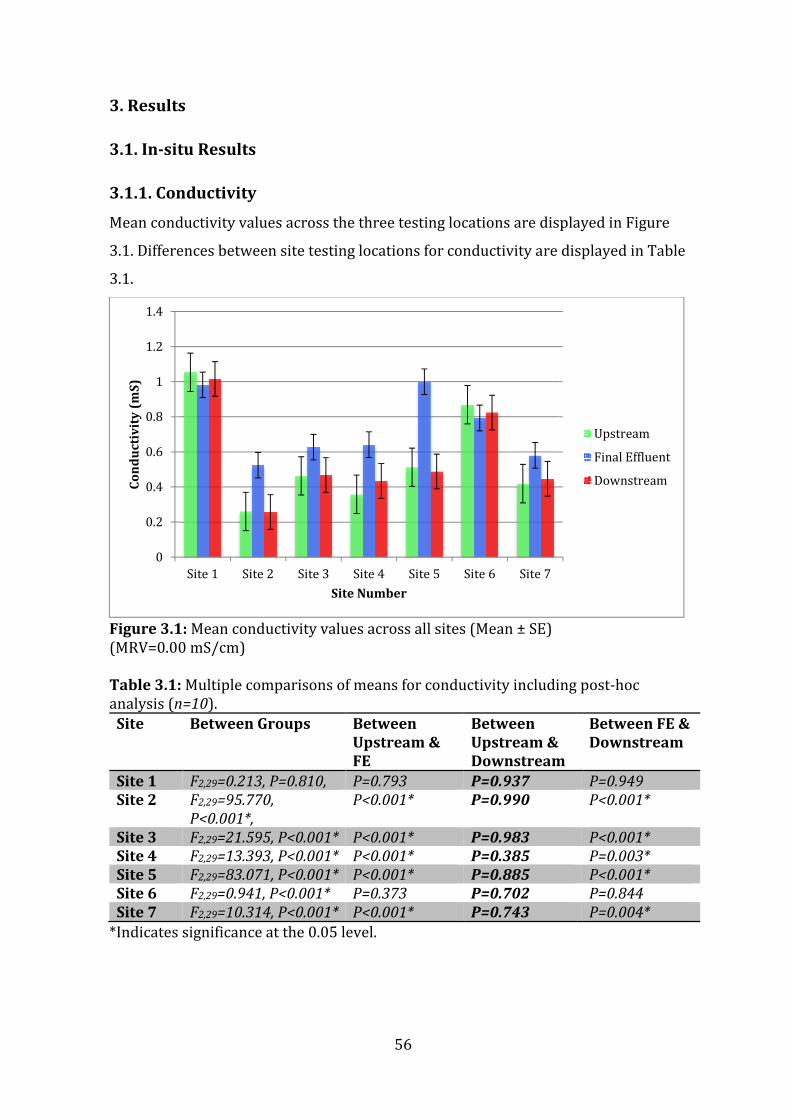
56
3. Results
3.1. In-situ Results
3.1.1. Conductivity
Mean conductivity values across the three testing locations are displayed in Figure
3.1. Differences between site testing locations for conductivity are displayed in Table
3.1.
Figure 3.1: Mean conductivity values across all sites (Mean ± SE) (MRV=0.00 mS/cm) Table 3.1: Multiple comparisons of means for conductivity including post-hoc analysis (n=10).
Site Between Groups Between
Upstream &
FE
Between
Upstream &
Downstream
Between FE &
Downstream
Site 1 F2,29=0.213, P=0.810, P=0.793 P=0.937 P=0.949
Site 2 F2,29=95.770,
P<0.001*,
P<0.001* P=0.990 P<0.001*
Site 3 F2,29=21.595, P<0.001* P<0.001* P=0.983 P<0.001*
Site 4 F2,29=13.393, P<0.001* P<0.001* P=0.385 P=0.003*
Site 5 F2,29=83.071, P<0.001* P<0.001* P=0.885 P<0.001*
Site 6 F2,29=0.941, P<0.001* P=0.373 P=0.702 P=0.844
Site 7 F2,29=10.314, P<0.001* P<0.001* P=0.743 P=0.004*
*Indicates significance at the 0.05 level.
0
0.2
0.4
0.6
0.8
1
1.2
1.4
Site 1 Site 2 Site 3 Site 4 Site 5 Site 6 Site 7
Co
nd
uc
tiv
ity
(m
S)
Site Number
Upstream
Final Effluent
Downstream

57
3.1.2. Dissolved Oxygen
Mean DO values across the three testing locations are displayed in Figure 3.2.
Differences between site testing locations for DO are displayed in Table 3.2.
Figure 3.2: Mean DO values across all sites (Mean ± SE)(MRV=0.20 mg/l). Table 3.2: Multiple comparisons of means for DO including post-hoc analysis (n=10).
Site Between Groups Between
Upstream &
FE
Between
Upstream &
Downstream
Between FE &
Downstream
Site 1 F2,29=57.946,
P<0.001*
P<0.001* P=0.980 P<0.001*
Site 2 F2,29=53.289,
P<0.001*
P<0.001* P=0.999 P<0.001*
Site 3 F2,29=45.466,
P<0.001*
P<0.001* P=0.379 P<0.001*
Site 4 F2,29=8.217, P=0.002* P=0.002* P=0.544 P=0.020*
Site 5 F2,29=187.841,
P<0.001*
P<0.001* P=0.408 P<0.001*
Site 6 F2,29=1.697, P=0.202 P=0.818 P=0.461 P=0.186
Site 7 F2,29=169.918,
P<0.001*
P<0.001* P=0.115 P<0.001*
* Indicates significance at the 0.05 level.
0
2
4
6
8
10
12
14
Site 1 Site 2 Site 3 Site 4 Site 5 Site 6 Site 7
Dis
solv
ed
Ox
yg
en
(m
g/
l)
Site Number
Upstream
Final Effluent
Downstream

58
3.1.3. pH on-site
Mean pH values across the three testing locations are displayed in Figure 3.3.
Differences between site testing locations for pH are displayed in Table 3.3.
Figure 3.3: Mean on-site pH values across all sites (Mean ± SE) (MRV=0.05 pH) Table 3.3: Multiple comparisons of means for pH, including post-hoc analysis (n=10).
Site Between Groups Between
Upstream &
FE
Between
Upstream &
Downstream
Between FE &
Downstream
Site 1 F2,29=15.986, P<0.001* P<0.001* P=0.515 P<0.001*
Site 2 F2,29=20.422, P<0.001* P<0.001* P=0.113 P<0.001*
Site 3 F2,29=60.671, P<0.001* P<0.001* P=0.379 P<0.001*
Site 4 F2,29=199.541,
P<0.001*
P<0.001* P<0.001* P<0.001*
Site 5 F2,29=143.106,
P<0.001*
P<0.001* P=0.969 P<0.001*
Site 6 F2,29=161.631,
P<0.001*
P<0.001* P=0.517 P<0.001*
Site 7 F2,29=180.301,
P<0.001*
P<0.001* P=0.115 P<0.001*
*Indicates significance at the 0.05 level.
6.4
6.6
6.8
7
7.2
7.4
7.6
7.8
8
8.2
8.4
8.6
Site 1 Site 2 Site 3 Site 4 Site 5 Site 6 Site 7
pH
on
-sit
e
Site Number
Upstream
Final Effluent
Downstream

59
3.1.4. Temperature
Mean temperature values across the three testing locations are displayed in Figure
3.4. Differences between site testing locations for temperature are displayed in Table
3.4.
Figure 3.4: Mean on-site temperature values across all sites (Mean ± SE). Table 3.4: Multiple comparisons of means for temperature, including post-hoc analysis (n=10).
Site Between Groups Between
Upstream &
FE
Between
Upstream &
Downstream
Between FE &
Downstream
Site 1 F2,29= 10.018, P=0.001 P=0.003* P=0.928 P<0.001*
Site 2 F2,29 = 3.721, P=0.037 P=0.093 P=0.942 P=0.047*
Site 3 F2,29= 23.623, P=0.00 P<0.001* P=0.688 P<0.010*
Site 4 F2,29 =23.090, P=0.00 P<0.001* P=0.994 P<0.001*
Site 5 F2,29 = 52.284, P=0.00 P<0.001* P=0.798 P<0.001*
Site 6 F2,29= 7.598, P=0.02 P=0.022* P=0.655 P=0.186
Site 7 F2,29=19.680, P=0.00 P<0.001* P=0.687 P<0.001*
* Indicates significance at the 0.05 level.
0
2
4
6
8
10
12
14
16
Site 1 Site 2 Site 3 Site 4 Site 5 Site 6 Site 7
Te
mp
era
ture
(oC
)
Site Number
Upstream
Final Effluent
Downstream

60
3.2. Laboratory Results
3.2.1. Ammonia
Mean ammonia concentrations across the three testing locations are displayed in
Figure 3.5. Differences between site testing locations for ammonia are displayed in
Table 3.5.
Figure 3.5: Mean ammonia concentrations across all sites (Mean ± SE) (MRV=0.19mg/l).
Negative error bars are present on sites 1 and 6 as although the mean value was low
for FE ammonia over the 10 sample weeks, the range was large; therefore negative
error bars were reported.
Table 3.5: Multiple comparisons of means for ammonia, including post-hoc analysis (n=10).
Site Between Groups Between
Upstream &
FE
Between
Upstream &
Downstream
Between FE &
Downstream
Site 1 F2,29=0.092, P=0.913 P=0.906 P=0.985 P=0.964
Site 2 F2,29=10.540,
P<0.001*
P<0.001* P=1.000 P<0.001*
Site 3 F2,29=7.508, P=0.003* P=0.006* P=1.000 P=0.006*
Site 4 F2,29=2.227, P=0.127 P=0.161 P=0.991 P=0.202
Site 5 F2,29=8.667, P<0.001* P=0.003* P=1.000 P=0.004*
Site 6 F2,29=0.828, P=0.448 P=0.479 P=0.991 P=0.556
Site 7 F2,29=32.820,
P<0.001*
P<0.001* P=0.795 P<0.001*
* Indicates significance at the 0.05 level.
-0.5
0
0.5
1
1.5
2
2.5
3
3.5
Site 1 Site 2 Site 3 Site 4 Site 5 Site 6 Site 7
Am
mo
nia
(m
g/
l)
Site Number
Upstream
Final Effluent
Downstream

61
3.2.2. Biological Oxygen Demand
Mean BOD concentrations across the three testing locations are displayed in Figure
3.6. Differences between site testing locations for BOD are displayed in Table 3.6.
Figure 3.6: Mean BOD concentrations across all sites (Mean ± SE) (MRV=1.0 mg/l). Table 3.6: Multiple comparisons of means for BOD including post-hoc analysis (n=10).
Site Between Groups Between
Upstream &
FE
Between
Upstream &
Downstream
Between FE &
Downstream
Site 1 F2,29=2.298, P=0.120. P=0.101 P=0.620 P=0.465
Site 2 F2,29=70.680, P<0.001* P<0.001* P=1.000 P<0.001*
Site 3 F2,29=11.053, P<0.001* P<0.001* P=1.000 P<0.001*
Site 4 F2,29=0.338, P=0.716 P=0.772 P=0.999 P=0.746
Site 5 F2,29=7.453, P=0.003* P=0.009* P=0.977 P=0.005*
Site 6 F2,29=5.000, P=0.014* P=0.019* P=0.931 P=0.044*
Site 7 F2,29= 224.393,
P<0.001*
P<0.001* P=0.347 P<0.001*
* Indicates significance at the 0.05 level.
0
1
2
3
4
5
6
7
8
9
Site 1 Site 2 Site 3 Site 4 Site 5 Site 6 Site 7
Bio
log
ica
l O
xy
ge
n D
em
an
d (
mg
/l)
Site Number
Upstream
Final Effluent
Downstream

62
3.2.3. Boron
Mean boron concentrations across the three testing locations are displayed in Figure
3.7. Differences between site testing locations for boron are displayed in Table 3.7.
Figure 3.7: Mean boron concentrations across all sites (Mean ± SE) (MRV=0.1mg/l). Table 3.7: Multiple comparisons of means for boron including post-hoc analysis (n=10).
Site Between Groups Between
Upstream &
FE
Between
Upstream &
Downstream
Between FE &
Downstream
Site 1 F2,29=1.000, P=0.381 P=0.449 P=1.000 P=0.449
Site 2 F2,29=0.959, P=0.396 P=0.478 P=0.450 P=0.999
Site 3 F2,29=0.777, P=0.470 P=0.958 P=0.468 P=0.638
Site 4 F2,29=0.000, P=1.000 P=1.000 P=1.000 P=1.000
Site 5 F2,29=6.684, P=0.004* P=0.010* P=1.000 P=0.010*
Site 6 F2,29=2.764, P=0.081 P=0.123 P=1.000 P=0.123
Site 7 F2,29=0.000, P=1.000 P=1.000 P=1.000 P=1.000
* Indicates significance at the 0.05 level.
0
0.02
0.04
0.06
0.08
0.1
0.12
0.14
0.16
Site 1 Site 2 Site 3 Site 4 Site 5 Site 6 Site 7
Bo
ron
(m
g/
l)
Site Number
Upstream
Final Effluent
Downstream

63
3.2.4. Chemical Oxygen Demand
Mean COD concentrations across the three testing locations are displayed in Figure
3.8. Differences between site testing locations for COD are displayed in Table 3.8.
Figure 3.8: Mean COD concentrations for across all sites (Mean ± SE) (MRV =10.0 mg/l). Table 3.8: Multiple comparisons of means of COD including post-hoc analysis (n=10).
* Indicates significance at the 0.05 level.
0
10
20
30
40
50
60
70
Site 1 Site 2 Site 3 Site 4 Site 5 Site 6 Site 7
Ch
em
ica
l O
xy
ge
n D
em
an
d (
mg
/l)
Site Number
Upstream
Final Effluent
Downstream
Site Between Groups Between
Upstream &
FE
Between
Upstream &
Downstream
Between FE &
Downstream
Site 1 F2,29=9.179, P<0.001* P<0.001* P=0.671 P=0.009*
Site 2 F2,29=19.940, P<0.001* P<0.001* P=0.798 P<0.001*
Site 3 F2,29=9.391, p<0.001* P<0.001* P=1.000 P=0.005*
Site 4 F2,29=2.121, P=0.139 P=0.121 P=0.704 P=0.440
Site 5 F2,29=0.653, P=0.529. P=0.606 P=0.999 P=0.574
Site 6 F2,29=2.665, P=0.088 P=0.074 P=0.648 P=0.357
Site 7 F2,29=39.037, P<0.001* P<0.001* P=0.637 P<0.001*

64
3.2.5. Chloride
Mean chloride concentrations across the three testing locations are displayed in
Figure 3.9. Differences between site testing locations for chloride are displayed in
Table 3.9.
Figure 3.9: Mean chloride concentrations across all sites (Mean ± SE) (MRV=0.9 mg/l). Table 3.9: Multiple comparisons of means for chloride including post-hoc analysis (n=10).
Site Between Groups Between
Upstream &
FE
Between
Upstream &
Downstream
Between FE &
Downstream
Site 1 F2,29=0.248, P<0.001* P=0.834 P=0.671 P=0.009*
Site 2 F2,29=47.696, P<0.001* P<0.001* P=0.958 P<0.001*
Site 3 F2,29=65.582, P<0.001* P<0.001* P=0.995 P<0.001*
Site 4 F2,29=3.273, P=0.053 P=0.057 P=0.879 P=0.149
Site 5 F2,29=103.825,
P<0.001*
P<0.001* P=0.999 P<0.001*
Site 6 F2,29=506.505,
P=0.300
P=0.336 P=0.990 P=0.407
Site 7 F2,29=25.031, P<0.001* P<0.001* P=0.868 P<0.001*
* Indicates significance at the 0.05 level.
0
20
40
60
80
100
120
140
Site 1 Site 2 Site 3 Site 4 Site 5 Site 6 Site 7
Ch
lori
de
(m
g/
l)
Site Number
Upstream
Final Effluent
Downstream

65
3.2.6. Nitrate
Mean nitrate concentrations across the three testing locations are displayed in Figure
3.10. Differences between site testing locations for nitrate are displayed in Table 3.10.
Figure 3.10: Mean nitrate concentrations across all sites (Mean ± SE) (MRV=0.006 mg/l). Table 3.10: Multiple comparisons of means for nitrate including post-hoc analysis (n=10).
Site Between Groups Between
Upstream &
FE
Between
Upstream &
Downstream
Between FE &
Downstream
Site 1 F2,29=9.346, P<0.001* P=0.002* P=0.930 P=0.004*
Site 2 F2,29=483.336,
P<0.001*
P<0.001* P=0.968 P<0.001*
Site 3 F2,29=61.948, P<0.001* P<0.001* P=0.991 P<0.001*
Site 4 F2,29=100.556,
P<0.001*
P<0.001* P=0.166 P<0.001*
Site 5 F2,29=68.903, P<0.001* P<0.001* P=1.000 P<0.001*
Site 6 F2,29=17.819, P<0.001* P<0.001* P=0.879 P<0.001*
Site 7 F2,29=126.566,
P<0.001*
P<0.001* P=0.658 P<0.001*
* Indicates significance at the 0.05 level.
0
2
4
6
8
10
12
14
16
18
Site 1 Site 2 Site 3 Site 4 Site 5 Site 6 Site 7
Nit
rate
(m
g/
l)
Site Number
Upstream
Final Effluent
Downstream

66
3.2.7. Nitrite
Mean nitrite concentrations across the three testing locations are displayed in Figure
3.11. Differences between site testing locations for nitrite are displayed in Table 3.11.
Figure 3.11: Mean nitrite concentrations across all sites (Mean ± SE) (MRV see appendix 7). Negative error bars are present on sites 2, 4, 6 and 7 as although the mean value was
low for upstream, FE and downstream nitrite concentrations over the 10 sample
weeks, the range was large; therefore negative error bars were reported.
Table 3.11: Multiple comparisons of means for nitrite including post-hoc analysis (n=10).
Site Between Groups Between
Upstream &
FE
Between
Upstream &
Downstream
Between FE &
Downstream
Site 1 F2,29=0.045, P=0.956 P=0.952 P=0.985 P=0.990
Site 2 F2,29=44.370, P<0.001* P<0.001* P=0.999 P<0.001*
Site 3 F2,29=21.925, P<0.001* P<0.001* P=0.999 P<0.001*
Site 4 F2,29=6.980, P=0.004 P=0.006* P=0.919 P=0.015*
Site 5 F2,29=9.897, P<0.001 P=0.002* P=0.993 P=0.002*
Site 6 F2,29=18.995, P<0.001* P<0.001* P=0.871 P<0.001*
Site 7 F2,29=126.556,
P<0.001*
P<0.001* P=0.740 P<0.001*
* Indicates significance at the 0.05 level.
-0.1
0
0.1
0.2
0.3
0.4
0.5
Site 1 Site 2 Site 3 Site 4 Site 5 Site 6 Site 7
Nit
rite
(m
g/
l)
Site Number
Upstream
Final Effluent
Downstream

67
3.2.8. Orthophosphate
Mean orthophosphate concentrations across the three testing locations are displayed
in Figure 3.12. Differences between site testing locations for orthophosphate are
displayed in Table 3.12.
Figure 3.12: Mean orthophosphate concentrations across all sites (Mean ± SE) (MRV=0.008 mg/l). Negative error bars are present on site 5 as although the mean value was low for FE
orthophosphate over the 10 sample weeks, the range was large; therefore negative
error bars were reported.
Table 3.12: Multiple comparisons of means for orthophosphate including post-hoc analysis (n=10).
Site Between Groups Between
Upstream &
FE
Between
Upstream &
Downstream
Between FE &
Downstream
Site 1 F2,29=13.095, P<0.001* P<0.001* P=0.802 P<0.001*
Site 2 F2,29=312.049,
P<0.001*
P<0.001* P=1.000 P<0.001*
Site 3 F2,29=167.751,
P<0.001*
P<0.001* P=0.998 P<0.001*
Site 4 F2,29=15.836, P<0.001* P<0.001* P=0.998 P<0.001*
Site 5 F2,29=2.320, P=0.118 P=0.154 P=0.994 P=0.185
Site 6 F2,29=44.977, P<0.001* P<0.001* P=0.737 P<0.001*
Site 7 F2,29=77.390, P<0.001* P<0.001* P=0.907 P<0.001*
* Indicates significance at the 0.05 level.
-0.5
0
0.5
1
1.5
2
2.5
Site 1 Site 2 Site 3 Site 4 Site 5 Site 6 Site 7
Ort
ho
ph
osp
ha
te (
mg
/l)
Site Number
Upstream
Final Effluent
Downstream

68
3.2.9. pH Laboratory
Mean pH concentrations across the three testing locations are displayed in Figure
3.13. Differences between site testing locations for pH are displayed in Table 3.13.
Figure 3.13: Mean concentrations for laboratory pH across all sites (Mean ± SE) (MRV=0.05 pH). Table 3.13: Multiple comparisons of means for pH Laboratory including post-hoc analysis (n=10).
Site Between Groups Between
Upstream &
FE
Between
Upstream &
Downstream
Between FE &
Downstream
Site 1 F2,29=5.823, P=0.008* P=0.014* P=0.978 P=0.022*
Site 2 F2,29=38.368, P<0.001* P<0.001* P=0.726 P<0.001*
Site 3 F2,29=89.139, P<0.001* P<0.001* P=0.999 P<0.001*
Site 4 F2,29=99.493, P<0.001* P<0.001* P=0.003* P<0.001*
Site 5 F2,29=414.636,
P<0.001*
P<0.001* P=0.979 P<0.001*
Site 6 F2,29=124,415,
P<0.001*
P<0.001* P=0.962 P<0.001*
Site 7 F2,29=199.507,
P<0.001*
P<0.001* P=0.188 P<0.001*
* Indicates significance at the 0.05 level.
6.4
6.6
6.8
7
7.2
7.4
7.6
7.8
8
8.2
8.4
Site 1 Site 2 Site 3 Site 4 Site 5 Site 6 Site 7
pH
La
b
Site Number
Upstream
Final Effluent
Downstream

69
3.2.10. Phosphorus
Mean phosphorus concentrations across the three testing locations are displayed in
Figure 3.14. Differences between site testing locations for phosphorus are displayed in
Table 3.14.
Figure 3.14: Mean phosphorus concentrations across all sites (Mean ± SE) (MRV=0.07 mg/l). Table 3.14: Multiple comparisons of means for phosphorus including post-hoc analysis (n=10).
Site Between Groups Between
Upstream &
FE
Between
Upstream &
Downstream
Between FE &
Downstream
Site 1 F2,29=13.822, P<0.001* P<0.001* P=0.724 P<0.001*
Site 2 F2,29=267.715,
P<0.001*
P<0.001* P=1.000 P<0.001*
Site 3 F2,29=206.568,
P<0.001*
P<0.001* P=0.984 P<0.001*
Site 4 F2,29=17.178, P<0.001* P<0.001* P=0.942 P<0.001*
Site 5 F2,29=10.152, P<0.001* P<0.001* P=0.960 P=0.002*
Site 6 F2,29=34.580, P<0.001* P<0.001* P=0.937 P<0.001*
Site 7 F2,29=97.023, P<0.001* P<0.001* P=0.682 P<0.001*
* Indicates significance at the 0.05 level.
0
0.5
1
1.5
2
2.5
3
Site 1 Site 2 Site 3 Site 4 Site 5 Site 6 Site 7
Ph
osp
ho
rus
(mg
/l)
Site Number
Upstream
Final Effluent
Downstream

70
3.2.11. Sulphate
Mean sulphate concentrations across the three testing locations are displayed in
Figure 3.15. Differences between site testing locations for sulphate are displayed in
Table 3.15.
Figure 3.15: Mean sulphate concentrations across all sites (Mean ± SE) (MRV=1.0 mg/l). Table 3.15: Multiple comparisons of means for sulphate including post-hoc analysis (n=10).
Site Between Groups Between
Upstream &
FE
Between
Upstream &
Downstream
Between FE &
Downstream
Site 1 F2,29=1.735, P=0.196 P=0.295 P=0.985 P=0.228
Site 2 F2,29=89.356, P<0.001* P<0.001* P=0.895 P<0.001*
Site 3 F2,29=42.831, P<0.001* P<0.001* P=0.997 P<0.001*
Site 4 F2,29=53.232, P<0.001* P<0.001* P=0.778 P<0.001*
Site 5 F2,29=265.445,
P<0.001*
P<0.001* P=1.000 P<0.001*
Site 6 F2,29=1.907, P=0.168 P=0.197 P=0.982 P=0.266
Site 7 F2,29=40.152, P<0.001* P<0.001* P=0.873 P<0.001*
* Indicates significance at the 0.05 level.
0
20
40
60
80
100
120
140
160
Site 1 Site 2 Site 3 Site 4 Site 5 Site 6 Site 7
Su
lph
ate
(m
g/
l)
Site Number
Upstream
Final Effluent
Downstream

71
4. Discussion
Overall, scientific literature posts a negative view of STW and their effects upon the
environment. The view that phosphate and nitrate discharges from STW are having a
dramatic and negative effect upon the UKs watercourses is well publicised in scientific
journals (Bowes et al., 2010; Jarvie et al., 2006; Neal et al., 2005; Neal et al., 2010). The
works of Jarvie (2002; 2006), Neal (2005; 2005a; 2008; 2008a; 2010) and Mainstone
(2002) have all been critical of the detrimental effects of sewage treatment effluents,
particularly in relation to phosphorus and nitrate and their eutrophic effects upon
watercourses.
The introduction of two key pieces of legislation, the WFD and UWWTD, has meant
that sewage treatment discharge is now more regulated than ever before. The scrutiny
that water companies are put under by regulators to ensure the quality and reliability
of effluents is high. The OSM and UWWTD sampling regime means that water
companies have to keep consistently high standards throughout the year to ensure
they avoid prosecution.
This study has built upon well-publicised works into the effects of sewage treatment
effluents on watercourse by adding another dimension to the analysis by integrating
FE data into the study. This allows us to analyse the discharge from treatment works
and examine whether these have a significant effect upon the receiving watercourse.
This data has not previously been available and therefore allows a new standpoint of
whether STW are in fact causing the significant detrimental effects that many people
believe. Analysis into the significant difference between upstream and downstream
river water samples has allowed understanding of whether FE does or does not have
an impact upon the receiving watercourse.
4.1. Study findings
From the analysis of river water and FE samples taken in this study, it has been
possible to gain an understanding of the effects that sewage treatment effluents have
upon their receiving watercourses. From the analysis, there are a number of notable
sample readings that will be explored in further detail.

72
4.1.1. Ammonia
Analysis showed that none of the sites have a significant difference in ammonia
concentrations between upstream and downstream samples, therefore demonstrating
that sewage treatment effluents are not having a significant effect upon riverine
ammonia concentrations. However, there are a number of high FE results that warrant
further investigation.
Site 5 shows high mean FE ammonia concentrations of 2.859 mg/l which is abnormal
for an ASP treatment that usually has high levels of nitrification (Tomlinson et al.,
2008). Further analysis of individual samples shown in Figure 4.1 demonstrates plant
malfunction from weeks 2-7 with a maximum spike of 7.67 mg/l. This was identified
during the study and fed back to Severn Trent who re-seeded the ASP between weeks
7-8. Reseeding had a dramatic reduction on FE ammonia concentrations with a drop
from 6.75mg/l in week 7 to 0.19 mg/l, the MRV, in week 8 as shown in Figure 4.1.
Throughout the sample period, riverine ammonia levels did not exceed the statutory
level of 0.025 mg NH3/l (Environment Agency, 2011a).
Figure 4.1: Weekly ammonia concentrations for Site 5 (Mean ± SE) (MRV=0.19mg/l).
-2
0
2
4
6
8
10
1 2 3 4 5 6 7 8 9 10
Am
mo
nia
(m
g/
l)
Sample Weeks
Upstream
Final Effluent
Downstream

73
Negative error bars are present in Figure 4.1 for weeks 1, 8 and 10 as although the
mean concentration was low for FE ammonia, the range was large; therefore negative
error bars were reported.
Site 7 also indicated high mean ammonia concentrations of 2.1 mg/l in FE. As
demonstrated in Figure 4.2, ammonia concentrations ranged from 0.984 mg/l to
4.16mg/l. This demonstrates insufficient levels of treatment from the on-site NSAF
tertiary ammonia treatment unit in relation to load and influent (Hu et al., 2011).
Throughout the sample period, Site 7 did not exceed its consent limits and mean
upstream and downstream concentrations of 0.19 mg/l and 0.245 mg/l respectively
are within statutory levels for riverine ammonia (Environment Agency, 2011a).
Figure 4.2: Weekly ammonia concentrations for Site 7 (Mean ± SE) (MRV=0.19mg/l).
4.1.2. Biological Oxygen Demand (BOD)
Analysis demonstrated that none of the sites have a significant difference in BOD
concentrations between upstream and downstream samples, therefore demonstrating
that sewage treatment effluents are not having a significant effect upon riverine BOD
concentrations. There are a number of outlying results that warrant further
investigation.
0
0.5
1
1.5
2
2.5
3
3.5
4
4.5
5
1 2 3 4 5 6 7 8 9 10
Am
mo
nia
(m
g/
l)
Sample Weeks
Upstream
Final Effluent
Downstream

74
Both Site 2 and 7 are demonstrating high FE BOD concentrations, 5.984 mg/l and
7.387 mg/l respectively. This demonstrates the inherent issue with the Percolating
Filter Beds at these sites. Percolating Filter Beds have an inherent issue with BOD
removal due to low residence times and bacteria availability to break down the
suspended organic matter inside the sewage (Boller & Guier, 1986; Grady et al., 2012).
Although FE samples taken may have seemed high, both sites were well inside
consented limits for BOD and background river samples for all were all below the
statutory level of 3mg/l (Environment Agency, 2011a).
4.1.3. Boron
Analysis showed that none of the sites have a significant difference in boron
concentrations between upstream and downstream samples, therefore demonstrating
that sewage treatment effluents are not having a significant effect upon riverine boron
concentrations. Site 2 is of interest however with upstream boron concentrations of
0.1295 mg/l. This demonstrates that an upstream industrial discharge is occurring
(Jarvie et al., 2006) which may alter background river concentrations upstream of the
STW. FE and downstream concentrations are 0.1 mg/l, the MRV, which demonstrates
the high assimilation factor that Site 2’s receiving watercourse achieves due to its high
flow (DeBruyn & Rasmussen, 2002).
4.1.4. Chemical Oxygen Demand (COD)
Analysis showed that none of the sites have a significant difference in COD
concentrations between upstream and downstream samples, therefore demonstrating
that sewage treatment effluents are not having a significant effect upon riverine COD
concentrations. Analysis has shown Site 1 to be demonstrating high levels of
background and FE COD. FE COD was recorded at 60.4 mg/l, which although within
consent, is high. Further investigation into individual samples shown in Figure 4.2
demonstrates that FE concentrations were fluctuating between 29mg/l and 111 mg/l
over the sample period. This fluctuation indicates that Site 1’s Percolating Filter Beds
cannot cope with changes in COD load in the influent, an inherent problem with
Percolating Filters (Boller & Guier, 1986; Grady et al., 2012).

75
Figure 4.3: Weekly COD concentrations for Site 1 (Mean ± SE) (MRV =10.0 mg/l).
Upstream and downstream COD concentrations are also high at 31.5mg/l and 37.6
mg/l respectively. This may be a result of high levels of agriculture in the vicinity
depositing high levels of organic matter into the watercourse via slurry and arable run
off (Vega et al., 1998; Sharpley et al., 2004). Between Site 1 FE and downstream
sample points, a dairy herd have access to the watercourse, thus having the possibility
to cause the downstream increase in COD.
4.1.5. Chloride
Analysis showed that none of the sites have a significant difference in chloride
concentrations between upstream and downstream samples, therefore demonstrating
that sewage treatment effluents are not having a significant effect upon riverine
chloride concentrations. Analysis has however identified Site 1 as having high FE and
background chloride concentrations. Site 1 has FE concentrations of 113.68 mg/l,
which is high in comparison to other treatment works. This is due to a mixture of
increased levels of road run off to foul sewers in addition to high local trade levels
affecting the influent (Kelly et al., 2010). It should be noted that chloride levels are
expected to be seasonal due to an increased usage of NaCl over the winter months as a
road de-icer (Amrhein et al., 1992; Kelly et al., 2007) .
0
20
40
60
80
100
120
140
1 2 3 4 5 6 7 8 9 10
Ch
em
ica
l O
xy
ge
n D
em
an
d (
mg
/l)
Sample Weeks

76
Upstream and downstream riverine levels of chloride are also high for Site 1 at 105.08
mg/l and 104.14 mg/l respectively. This is primarily as a result of road surface water
(Hunt et al., 2012) and agricultural run off (Kelly et al., 2010) which are both evident
actively discharging into the watercourse as shown in Figure 4.4.
Figure 4.4: Photograph of Site 1 downstream showing agricultural (A) and surface
water (B) discharge
4.1.6. Conductivity
Analysis showed that none of the sites have a significant difference in conductivity
concentrations between upstream and downstream samples, therefore demonstrating
that sewage treatment effluents are not having a significant effect upon riverine
conductivity concentrations. Analysis also demonstrated that all FE discharges were
within normal levels. Background concentrations however were high for Site 1 & 6
(Site 1: 1.054 mg/l & 1.010 mg/l; Site 6: 0.869 & 0.824 mg/l). This can be attributed to
the high levels of agricultural activity at both sites causing an increase in riverine
B
A

77
conductivity (Morrison et al., 2001). All sites were within EA guidance concentrations
(Environment Agency, 2011a).
4.1.7. Dissolved Oxygen
Analysis showed that none of the sites have a significant difference in DO
concentrations between upstream and downstream samples, therefore demonstrating
that sewage treatment effluents are not having a significant effect upon riverine DO
concentrations. All background samples had DO concentrations above 8.6mg 02/l, the
level required to sustain the first larval zoea stage of crustaceans, some of the most
sensitive aquatic organisms (Vaquer-Sunyer & Duarte, 2008) as well as the 9mg O2/l
statutory level for salmonid waters (Environment Agency, 2011a).
4.1.8. Nitrate
Analysis showed that none of the sites have a significant difference in nitrate
concentrations between upstream and downstream samples, therefore demonstrating
that sewage treatment effluents are not having a significant effect upon riverine
nitrate concentrations.
Although FE nitrate concentrations are all within normal parameters, background
concentrations at sites 1 and 6 show increased nitrate concentrations. This is likely
correlated to both sites having dairy herds in adjacent fields and with access to the
watercourse (Singleton et al., 2007) and poor agricultural practices being in place
(DEFRA, 2002; Mainstone & Parr, 2002). This is contrasted by other sites in high
agricultural areas for example sites 2 and 7, where good agricultural practices are
being followed and the ECSFDI is being implemented, leading to low riverine nitrate
concentrations (DEFRA, 2008). This demonstrates the effect the ECSFDI is having on
reducing riverine nitrate concentrations in areas where farmers are implementing the
strategy. Background nitrate levels for all sites were below statutory levels for nitrate
concentrations (Environment Agency, 2011a).

78
4.1.9. Nitrite
Analysis showed that none of the sites have a significant difference in nitrite
concentrations between upstream and downstream samples, therefore demonstrating
that sewage treatment effluents are not having a significant effect upon riverine
nitrite concentrations.
Although background levels were consistently low and below statutory levels
(Environment Agency, 2011a), both sites 3 and 7 displayed a high FE nitrite
concentration. This is primarily down to a failure of the Percolating Filter Beds at both
sites not providing sufficient nitrification (Boller & Guier, 1986). At site 3, Percolating
Filter Beds provide tertiary nitrification after the ASP. This obviously is unsuccessful
and is leading to increased FE concentrations. Site 7 uses a NSAF for tertiary
nitrification as well as filter beds and has already been identified by ammonia
concentrations to be working below standard.
4.1.10. Orthophosphate
Analysis showed that none of the sites have a significant difference in orthophosphate
concentrations between upstream and downstream samples, therefore demonstrating
that sewage treatment effluents are not having a significant effect upon riverine
orthophosphate concentrations.
Withstanding this, FE orthophosphate concentrations are particularly high at Site 2
with concentrations of 2.099 mg/l. This demonstrates a low level of treatment from
Site 2, a Percolating Filter Works. Low levels of orthophosphate removal are primarily
linked to the residence time of the sewage in the filter bed. A low residence time does
not allow for sufficient treatment to occur before the effluent passes out as FE (Boller
& Guier, 1986). Because of the low flows of Site 2, tertiary p-stripping would not be
cost effective considering the volume and assimilation factor of the receiving
watercourse. Even with high levels of orthophosphate in the FE, both upstream and
downstream samples are at MRV (0.08 mg/l) showing no significant effect from FE.

79
4.1.11. pH
Analysis of pH concentrations showed that for sites 1, 2, 3, 5, 6 and 7, there was not a
significant difference between upstream and downstream samples, therefore
demonstrating that sewage treatment effluents for these sites did not have a
significant effect upon riverine pH. However, for Site 4 there was a significant
difference between samples at P=0.003* with a decrease in pH from 7.808 upstream to
7.64 downstream with FE at pH 7.274. There are a number of possible reasons for this
decrease in riverine pH in addition to sewage effluents.
One cause of river acidification, a reduction in pH, is aquatic respiration and the
breakdown of organic matter. In eutrophic watercourses, as phytoplankton die and
sink, the organic matter they contain is reminerialized to CO2 by aquatic respiration.
This respiration consumes O2 and can lead to hypoxia and lower riverine pH levels
(Feely et al., 2010; Baldigo et al., 2001; Gergel et al., 2002).
Site 4 is shown to have a dramatically increased downstream nitrate (1.592mg/l
upstream; 3.475 mg/l downstream) and DO concentrations (downstream 10.031
mg/l) that could provide suitable nutrients and O2 for eutrophication to occur. This
may lead to algal blooms and acidification (Jarvie et al., 2006).
Another possible answer to a decrease in pH is NaCl pollution from surface water
runoff. During the sampling period (November to January) high amounts of NaCl were
applied to roads in the vicinity of site 4 due to its upland rural nature and the high
probability of ice forming on roads. The receiving watercourse for Site 4 runs parallel
with the main access road to the local town. This parallel stretch of river and road
runs approximately 125 metres from FE discharge point to the downstream sampling
point. Upstream the river moves into a rural setting and would not be subjected to
surface water discharge. The stretch of river between the FE and downstream sample
points would therefore take large concentrations of NaCl from road spray and run off
directly into the watercourse. NaCl has been shown to have acidifying effects on
surface waters (Löfgren, 2001; Hindar et al., 1995) and would therefore lower the pH
of the watercourse as the samples demonstrate. Use of NaCl is also shown to cause
increases in riverine chloride (Green et al., 2001). This is demonstrated at Site 4 with

80
downstream increases in chloride concentration (upstream: 34.14 mg/l; downstream
39.97 mg/l) which would also demonstrate the effects of NaCl runoff.
The critical aspect to understand whether Site 4 FE is causing a change to pH levels in
the watercourse is to understand the FE flow to pH correlation. As we can see in
Figure 4.5, there is non-correlation between increased flow and a decrease in riverine
pH that we would expect to see if FE pH was the significant contributor to
acidification, in fact Figure 4.5 demonstrates the opposite. This would lead to
concluding that an increase in nitrate concentrations from agriculture causing
eutrophication and NaCl run off from road salt would be the primary cause of a
decrease in Site 4 downstream pH. Mean flow for all sites can be found in appendix 8.
Figure 4.5: Marked scatter graph demonstrating flow vs. downstream pH for Site 4
with linear trend line.
4.1.12. Phosphorus
Analysis showed that none of the sites have a significant difference in phosphorus
concentrations between upstream and downstream samples, therefore demonstrating
that sewage treatment effluents are not having a significant effect upon riverine
phosphorus concentrations.
0.000
50.000
100.000
150.000
200.000
250.000
300.000
7.45 7.5 7.55 7.6 7.65 7.7 7.75 7.8 7.85 7.9
Flo
w (
l/s)
Downstream pH

81
The effect of p-stripping is shown dramatically in the sample analysis with the two
sites without p-stripping indicating notably increased FE phosphorus concentrations.
Sites 2 and 7 both do not implement p-stripping due to their PE and discharge flow
rates. As you can see in Figure 4.6, Sites 2 and 7 both show increased FE phosphorus
concentrations of 2.302 mg/l and 1.853 mg/l respectively. Figure 4.6 also
demonstrates the effect ASP treatment has upon phosphorus removal. Sites 4, 5 and 6
all implement ASP and have notably reduced phosphorus discharges.
Figure 4.6: FE phosphorus concentrations for all sites. (Mean ± SE)
(MRV=0.07 mg/l).
Phosphorus discharge from all sites was acceptable and within consented limits.
Although no statutory limit exists for phosphorus, all background levels were
considered low at levels less than 0.5 mg/l (Environment Agency, 2011a).
4.1.13. Sulphate
Analysis showed that none of the sites have a significant difference in sulphate
concentrations between upstream and downstream samples, therefore demonstrating
that sewage treatment effluents are not having a significant effect upon riverine
sulphate concentrations.
0
0.5
1
1.5
2
2.5
3
Site 1 Site 2 Site 3 Site 4 Site 5 Site 6 Site 7
Ph
osp
ho
rus
(mg
/l)
Site Number

82
A number of sites however did show elevated concentrations of sulphate both at
background concentrations and FE. Both sites 1 and 6 showed highly elevated
background levels of sulphate in comparison to the rest of the sites. This may be down
to a mixture of high levels of agriculture and high levels of trade discharge that occurs
to both receiving watercourses (Weston et al., 2004). The cumulative effect of this
causes background concentrations to increase. Both Site 1 and 6 suffer from poor
agricultural practices leading to large concentrations of leachate being discharged to
the watercourse, thus causing the increased concentrations.
Although being rural, both sites also have large trade influents that increase FE
sulphate levels. This is shown dramatically by site 5. Although background
concentrations are low (upstream: 37.12 mg/l; downstream: 37.10 mg/l) because of
the high amounts of heavy industry and trade in the catchment area, the influent and
therefore FE is high in sulphate (136.00 mg/l). This is a demonstration of how trade
influent can affect FE. All background samples were below the statutory limit of 250
mg SO4/l (Environment Agency, 2011a)
4.1.14. Temperature
Regulatory consents are also based upon temperature. It is understood that if FE is
less than 5oC, nitrification is inhibited during treatment. This means that an
exceptional circumstances clause is put into effect and consents are not enforced.
Analysis showed that none of the sites have a significant difference in temperature
between upstream and downstream samples, therefore demonstrating that sewage
treatment effluents are not having a significant effect upon riverine temperatures.
4.2. Further discussion
4.2.1. Difference between treatments
This study has used the 3 primary technologies that are implemented at medium and
large STW across the UK; ASP, Percolating Filter Bed and MBR. Each form of
technology has been seen to have its benefits and drawbacks and can be implemented
in different situations.

83
4.2.1.1. Activated Sludge Production (ASP)
ASP technology has become prevalent over the past 30 years and been shown to work
well in high flow environments providing high levels of treatment (DEFRA, 2012;
Metcalf et al., 1986; Cote et al., 1995). This is evident in Site 5 that discharges on
average in excess of 2000 l/s. All ASP sites in this study have demonstrated high levels
of ammonia, BOD, COD, phosphorus and orthophosphate treatment. They produce
high quality effluents often on both a medium and large scale, however there are some
drawbacks to ASP technology. Because of the aeration required, ASP plants are highly
energy intensive that leads to high running costs (Osada, 1991). They are also highly
sensitive and require high levels of maintenance and monitoring. This was shown
with the ammonia spike in Site 5. However once the ASP was reseeded, Site 5
produced low ammonia FE.
4.2.1.2. Membrane Bioreactor (MBR)
MBR technology is a new technology to the UK for wastewater treatment and Site 4 is
one of only 4 plants in the country. MBR demonstrates high levels of ammonia,
phosphorus and orthophosphate treatment from the ASP process as well as high
suspended-solids removal from the membrane process producing low BOD and COD
FE.
The MBR is energy efficient, has a low site footprint and is fully automated, controlling
flow levels and FE back-pulses to de-rag the membranes. This means it can be run
with lower manpower unlike ASP STW.
Although the MBR process produces a high quality effluent, it is both capital and
maintenance intensive. Zeeweed membranes require replacement every 12 years and
require regular cleaning with both citric and hydrochloric acid (Noble, 2006).
Therefore, MBR will only be suitable for a number of unique situations where FE
quality is critical.

84
4.2.1.3. Percolating Filter Works
Percolating Filter Works are the oldest form of technology used across the 3 sites
having been used since the early 1900s. Although technology has moved on, the basic
principle has stayed the same throughout (Metcalf et al., 1986; Boller & Guier, 1986).
As technology has moved on, ASP has replaced Percolating Filter Works as the
primary form of treatment for high PE environments; therefore Percolating Filter
Works are now mainly confined to small and medium sized STW. Percolating Filter
Works do have issues with levels of treatment. High BOD, COD, nitrite, phosphorus
and orthophosphate levels are common in FE due to lack of retention times inside the
filter bed (Boller & Guier, 1986; Grady et al., 2012). They are often used in tandem
with tertiary treatment for example NSAF to try and reduce phosphorus and nitrate
concentrations. Percolating Filter Works are a simple and low maintenance way of
serving low and medium PE areas. Because of the gravitational design of many works,
they use very small amounts of energy and are therefore highly cost effective forms of
treatment (Metcalf et al., 1986; Logan et al., 1987).
4.2.2. Regulation
Since 1991, the wastewater industry has come under higher levels of scrutiny
regarding the concentrations of many determinants in its FE. The introduction of the
WFD and UWWTD has set out provision for protection of surface waters and has
highlighted nitrate and phosphate discharges as primary causes of eutrophication
(DEFRA, 2014; European Commission 2012). The WFD aim of bringing surface waters
to ‘good ecological and chemical status’ by 2015 has been a driver for the UWWTD
and has resulted in tighter regulatory consents and the introduction of on-site p-
stripping for works with PE of 10,000+ (DEFRA, 2012).
There are high socioeconomic effects with complying with wastewater regulation.
From 1995 – 2010, £950 million was spent on effluent clean up in the UK alone (Neal
et al., 2010), demonstrating why reducing FE concentrations and working towards the
WFD objectives is critical.

85
Regulation has driven forward the wastewater industry demanding ever-higher levels
of treatment, this has worked in tandem with improvements in agricultural practices
to reduce riverine levels of phosphorus and nitrate and reduce the number of
eutrophic watercourses in the UK. The UK looks set to be succeeding with the WFD
aim of bringing all surface waters to ‘good ecological and chemical status’ by 2015
(Ulén & Weyhenmeyer, 2007; Foster et al., 2010).
4.2.3. Criticisms of other literature
There are a number of criticisms of the literature surrounding the effects of sewage
treatment effluents on watercourses, especially research based on UK watercourses.
Jarvie and Neal have compiled the majority of research into this field. Both have been
investigating the effects of phosphorus and nitrate discharges from both STW and
agricultural sources for a number of years. The on-going theme running through their
research suggests that both STW and agriculture have a large detrimental effect upon
watercourses and require large-scale investment to be brought up to standard. Their
analysis suggests large-scale capital investment in the UK’s wastewater infrastructure,
however this approach would have a number of knock on effects. Firstly, the money
water companies have is finite; an increase in infrastructure spending would directly
affect customer’s bills, which is currently a politically charged topic.
Jarvie and Neal also are not looking at the cost-effectiveness of tertiary p-stripping. P-
stripping is only cost effective on large scale works as it is inherently expensive.
Installing p-stripping on smaller works would have little effect upon riverine
phosphorus concentrations as demonstrated in this study, due to the assimilation
factor of the receiving watercourse. Money would be better invested improving
infrastructure and transferring flows away from small STW to larger STW where a
higher level of treatment can be achieved.
The work of Jarvie and Neal is also critically flawed. Without FE data, it is impossible
to determine whether STW effluent is at fault for any statistical change in riverine
concentrations. As their studies use only upstream and downstream data, their
dataset is exposed to external variables for example diffuse agricultural pollution or

86
trade discharges. Without visibility of FE data, it is impossible to demonstrate
whether it is the FE alone that is having a significant effect upon the watercourse.
4.3. Study Limitations
A primary limitation of this study was the sample collection period. Samples were
collected over a 3-month period from November to January. This may have allowed
seasonal bias to affect the dataset.
The number of upstream and downstream sample points that were used also limited
this study. The collection of 3 samples, upstream, FE and downstream gave a limited
dataset and allowed only a snapshot into whether sewage treatment effluents were
significantly affecting the entire receiving watercourse. Only one downstream sample
point at 200 metres made it difficult to make assumptions regarding the assimilation
of pollutants into the watercourse and their possible effects further downstream.
4.4. Recommendations for further research.
Although the effects of sewage treatment effluents on watercourses are a well-
documented, there are a number of areas for further research. The introduction of FE
data has allowed this study to see the specific effect that effluent have upon the
receiving watercourse. This approach should be taken forward and used on previous
geographical areas of study to see whether initial indications of detrimental sewage
treatment effects were indeed correct with the visibility of FE data. In addition to this,
future studies should look to increase the number of upstream and downstream
points. This will allow the assimilation factor of watercourses to be investigated with
relation to STW effluents.
This study should also be continued with further sample collection and analysis. This
study used a limited collection period of 3 months from November to January. To be
representative, future studies should look to collect samples over a 12 or 24-month
period to reduce seasonal bias.

87
This study has also highlighted the need for further research into the effects of MBR
technology on riverine pH. This study detected a significant difference between
upstream and downstream riverine pH concentrations for the MBR technology;
further researched should be completed to see if this pH change could be replicated in
other locations.

88
5. Conclusion This study set out to assess whether sewage treatment effluents had a significant
effect upon their receiving watercourse, with the purpose of investigating a number of
determinants associated with sewage treatment discharge and surface water
pollution. This study revealed that sewage treatment effluents do not have a
significant effect upon the receiving watercourse thus contradicting the popular
scientific standpoint.
Of the 98 statistical tests carried out in this study, only Site 4 pH was deemed to be
significantly different from analysis of upstream and downstream samples. A number
of factors have been discussed that could have caused this significant difference;
therefore it cannot be assumed that the significant difference is caused uniquely by
the STW FE. This allows us to accept the alternative hypothesis and reject the null
hypothesis of this study.
As mentioned, the results of this study have gone against current scientific literature
and open up the possibility of STW taking a step back from agriculture as the primary
cause of riverine eutrophication. The reduction in riverine determinant
concentrations shows that the WFD and associated UWWTD are having a significant
effect upon FE concentrations, especially phosphate and nitrate and that new
technology such as MBR and improvements in ASP technology are raising the bar for
treatment levels across the board.
89
References
Acreman, M. C., Adams, B., Birchall, P., & Connorton, B. (2000). Does groundwater
abstraction cause degradation of rivers and wetlands? Water and Environment
Journal, 14(3), 200-206.
Ainsworth, A. M., & Goulder, R. (2000). The effects of sewage-works effluent on
riverine extracellular aminopeptidase activity and microbial leucine assimilation.
Water Research, 34(9), 2551-2557.
Aitken, M. (2003). Impact of agricultural practices and river catchment characteristics
on river and bathing water quality. Water Science & Technology,
48(10), 217-224.
Al-Malack, M. H. (2007). Performance of an immersed membrane bioreactor
(IMBR). Desalination, 214(1), 112-127.
Allan, I. J., Vrana, B., Greenwood, R., Mills, G. A., Roig, B., & Gonzalez, C. (2006). A
“toolbox” for biological and chemical monitoring requirements for the European
Union's Water Framework Directive. Talanta, 69(2), 302-322.
Amisah, S., & Cowx, I. G. (2000). Impacts of abandoned mine and industrial discharges
on fish abundance and macroinvertebrate diversity of the upper River Don in South
Yorkshire, UK. Journal of Freshwater Ecology, 15(2), 237-250.
Amrhein, C., Strong, J. E., & Mosher, P. A. (1992). Effect of deicing salts on metal and
organic matter mobilization in roadside soils. Environmental Science & Technology,
26(4), 703-709.
Anderson, D. M., Glibert, P. M., & Burkholder, J. M. (2002). Harmful algal blooms and
eutrophication: nutrient sources, composition, and consequences. Estuaries, 25(4),
704-726.
90
Arheimer, B., Andersson, L., Larsson, M., Lindstrm, G., Olsson, J., & Pers, B. (2004).
Modelling diffuse nutrient flow in eutrophication control scenarios. Water Science &
Technology, 49(3), 37-45.
Auer, M. T., & Effler, S. W. (1989). Variability in photosynthesis: impact on DO
models. Journal of Environmental Engineering, 115(5), 944-963.
Baker, A., Inverarity, R., Charlton, M., & Richmond, S. (2003). Detecting river pollution
using fluorescence spectrophotometry: case studies from the Ouseburn, NE
England. Environmental Pollution, 124(1), 57-70.
Baldigo, B. P., & Lawrence, G. B. (2001). Effects of stream acidification and habitat on
fish populations of a North American river. Aquatic Sciences, 63(2), 196-222.
Beaton, J. D., & Nelson, W. L. (2005). Soil fertility and fertilizers: An introduction to
nutrient management (Vol. 515). Upper Saddle River, New Jersey, USA: Pearson
Prentice Hall.
Bergles, J. L., & Nelson, M. A. (1974). U.S. Patent No. 3,823,825. Washington, DC: U.S.
Patent and Trademark Office.
Boller, M., & Gujer, W. (1986). Nitrification in tertiary trickling filters followed by
deep-bed filters. Water research, 20(11), 1363-1373.
Bowes, M. J., Jarvie, H. P., Naden, P. S., Old, G. H., Scarlett, P. M., Roberts, C., & Collins, A.
L. (2014). Identifying priorities for nutrient mitigation using river concentration–flow
relationships: The Thames basin, UK. Journal of Hydrology, 517, 1-12.
Bowes, M. J., Neal, C., Jarvie, H. P., Smith, J. T., & Davies, H. N. (2010). Predicting
phosphorus concentrations in British rivers resulting from the introduction of
improved phosphorus removal from sewage effluent. Science of the Total
Environment, 408(19), 4239-4250.

91
Bowes, M. J., Smith, J. T., Jarvie, H. P., & Neal, C. (2008). Modelling of phosphorus inputs
to rivers from diffuse and point sources. Science of the Total Environment,
395(2), 125-138.
Brindle, K., & Stephenson, T. (1996). The application of membrane biological reactors
for the treatment of wastewaters. Biotechnology and Bioengineering,49(6), 601-610.
Broadhead, A. T., Horn, R., & Lerner, D. N. (2013). Captured streams and springs in
combined sewers: A review of the evidence, consequences and opportunities. Water
research, 47(13), 4752-4766.
Brouwer, R. (2008). The potential role of stated preference methods in the Water
Framework Directive to assess disproportionate costs. Journal of Environmental
Planning and Management, 51(5), 597-614.
Buer, T., & Cumin, J. (2010). MBR module design and operation. Desalination. 250(3),
1073-1077.
Chandler, D. M. (2014). The impact of sewer misconnection effluents on diatom
communities (Doctoral dissertation, University of Sheffield).
Chapman, D. V., (1996). Water Quality Assessments: A Guide to the use of Biota,
Sediments and Water in Environmental Monitoring. London: E and Fn Spon.
Chen, D., Hu, M., Guo, Y., & Dahlgren, R. A. (2014). Influence of legacy phosphorus, land
use, and climate change on anthropogenic phosphorus inputs and riverine export
dynamics. Biogeochemistry, 1-18.
Chitluri, N, R. (2015). Analysis of Water Quality Parameters and Assessment of Health
Effects. 1st ed. Saarbrücken: Lambert Academic Publishing

92
Ciardelli, G., & Ranieri, N. (2001). The treatment and reuse of wastewater in the textile
industry by means of ozonation and electroflocculation. Water research, 35(2), 567-
572.
Clair N. Sawyer, Perry L. McCarty, Gene F. Parkin (2003). Chemistry for
Environmental Engineering and Science (5th ed.). New York: McGraw-Hill.
Copertino, V.A., Molino, B. and Telesca, V., (1998). Spatial and Temporal Evolution of
Water Quality in Reservoirs, Physics and Chemistry of the Earth, 23(4), 475-478.
Coquery, M., Morin, A., Becue, A., & Lepot, B. (2005). Priority substances of the
European Water Framework Directive: analytical challenges in monitoring water
quality. TrAC Trends in Analytical Chemistry, 24(2), 117-127.
Correljé, A., François, D., & Verbeke, T. (2007). Integrating water management and
principles of policy: towards an EU framework? Journal of Cleaner Production,
15(16), 1499-1506.
Correll, D. L. (1998). The role of phosphorus in the eutrophication of receiving waters:
A review. Journal of Environmental Quality, 27(2), 261-266.
Cote, M., Grandjean, B., Lessard, P., & Thibault, J. (1995). Dynamic modelling of the
activated sludge process: improving prediction using neural networks. Water
Research, 29(4), 995-1004.
Côté, P., Buisson, H., Pound, C., & Arakaki, G. (1997). Immersed membrane activated
sludge for the reuse of municipal wastewater. Desalination, 113(2), 189-196.
Côté, P., Masini, M., & Mourato, D. (2004). Comparison of membrane options for water
reuse and reclamation. Desalination, 167, 1-11.
Cox, B. A. (2003). A review of dissolved oxygen modelling techniques for lowland
rivers. Science of the Total Environment, 314, 303-334.

93
Daniel, M. H., Montebelo, A. A., Bernardes, M. C., Ometto, J. P., De Camargo, P. B.,
Krusche, A. V., & Martinelli, L. A. (2002). Effects of urban sewage on dissolved oxygen,
dissolved inorganic and organic carbon, and electrical conductivity of small streams
along a gradient of urbanization in the Piracicaba river basin. Water, Air, and Soil
Pollution, 136(1-4), 189-206.
DeBruyn, A. M., & Rasmussen, J. B. (2002). Quantifying assimilation of sewage-derived
organic matter by riverine benthos. Ecological Applications, 12(2), 511-520.
DEFRA. (2002). Description of the methodology applied by the Secretary of State in
identifying additional Nitrate Vulnerable Zones in England [Online]. London. DEFRA.
Available at: http://archive.defra.gov.uk/environment/quality/water/ Default.aspx?
Menu=Menu&Module=More&Location=None&Completed=0&ProjectID=11498.
[Accessed on 10th December 2014].
DEFRA. (2002a). Sewage Treatment in the UK: UK implementation of the EC Waste
Water Treatment Directive [online]. London. DEFRA. Available at: http://www.fwr.
org/WQreg/Appendices/uwwtreport2.pdf. [Accessed on 10th December 2014]
DEFRA. (2008). England Catchment Sensitive Farming Delivery Initiative 2008-2015
(Online). DEFRA. London. Available at: http://archive.defra.gov.uk/foodfarm/
landmanage/water/csf/documents/state-aid-ecsfdi2008.pdf [Accessed 10th
December 2014]
DEFRA. (2008a). England Catchment Sensitive Farming Delivery Initiative Phase 1
Report: April2006 – March 2008. London (Online). DEFRA. Available at: http://
archive.defra.gov.uk/foodfarm/landmanage/water/csf/documents/ecsfdi-phase1-
report.pdf [Accessed on 10th December 2014].

94
DEFRA. (2008b). Research project final report: land use and practices with a high risk
of phosphorus loss to chemical and ecological impacts in rivers [Online]. London.
DEFRA. Available at: http://randd.defra.gov.uk/Default.aspx?Menu=Menu
&Module=More&Location=None&Completed=0&ProjectID=11498. [Accessed 1st
February 2015]
DEFRA. (2010). Environmental Permitting Guidance Water Discharge Activities
[Online]. DEFRA: London. Available at: http://archive.defra.gov.uk/environment
/policy/permits/documents/ep2010waterdischarge.pdf. [Accessed on 1st February
2015].
DEFRA. (2010a). River Water Indicator for Sustainable Development – 2009 Annual
Results. [Online] London. DEFRA. Available at: http://archive.defra.gov.uk/evidence
/statistics/environment/inlwater/download/pdf/20100907ns.pdf [Accessed on 10th
December 2014].
DEFRA. (2012). Waste water treatment in the United Kingdom – 2012 -
Implementation of the European Union Urban Waste Water Treatment Directive –
91/271/EEC (Online). DEFRA. London. Available at: https://www.gov.uk/
government/uploads/system/uploads/attachment_data/file/69592/pb13811-waste-
water-2012.pdf [Accessed on 10th December 2014].
DEFRA. (2012a). River Water Quality Indicator for Sustainable Development – 2009
annual results [Online]. DEFRA: London. Available at: http://archive.Defra.gov.uk
/evidence/statistics/environment/inlwater/download/pdf/20100907ns.pdf.
[Accessed on 10th February 2015].
DEFRA. (2014). Water Framework Directive implementation in England and Wales:
new and updated standards to protect the water environment (Online). DEFRA.
London. Available at: https://www.gov.uk/government/uploads/system/uploads
/attachment_data/file/307788/river-basin-planning-standards.pdf [Accessed 1st
February 2015].

95
DEFRA. (2015) About us [Online]. DEFRA: London. Available at: https://www.
gov.uk/government/organisations/department-for-environment-food-rural-
affairs/about. [Accessed on 1st February 2015].
Delisle, C.E. and Schmidt, J.W. (1977). The effects of sulphur on water and aquatic life
in Canada. In: Sulphur and its inorganic derivatives in the Canadian environment.
Associate Committee on Scientific Criteria for Environmental Quality, National
Research Council of Canada, Ottawa
Dosskey, M. G. (2002). Setting priorities for research on pollution reduction functions
of agricultural buffers. Environmental Management, 30(5), 0641-0650.
Durham Region. (2015). Sewage Treatment Process. [Digital Image] Durham Region.
Available at: http://www.durham.ca/extcontent.asp?nr=/departments/works/
sewer/sewageplant.htm [Accessed on 1st January 2015]
Dytham, C. (2010). Choosing and using statistics: A biologist’s guide. 3rd. London:
Willey-Blackwell.
Elhance, A. P. (1999). Hydropolitics in the Third World: Conflict and cooperation in
international river basins. US Institute of Peace Press.
Ennos, A. R. (2007). Statistical and data handling skills in biology. Pearson Education.
Environment Agency. (1998). The State of the Environment of England and Wales:
Fresh Waters. The Stationery Office, London, ISBN 0 11 310148 1.
Environment Agency. (2000). Aquatic eutrophication in England and Wales: a
management strategy. Bristol: Environment Agency, p. 32.

96
Environment Agency. (2002). The Influence of Variations in Flow on General Quality
Assessment of Rivers [Online]. Environment Agency: London. Available at: https://
www.gov.uk/government/uploads/system/uploads/attachment_data/file/290580/
se1-112-tr-e-e.pdf. [Accessed on 10th February 2015].
Environment Agency. (2010a). Taking field measurements: using a thermometer:
Operational Instruction 529_06. V.5. London: Environment Agency.
Environment Agency. (2010b). Taking field measurements: using a Pro ODO Hand
held Dissolved oxygen meter: Operational instruction 530_06. V.6. London:
Environment Agency.
Environment Agency. (2010c) Taking field measurements: Using a pH Meter:
Operational Instruction 531_06. V.6. Environment Agency. London: Environment
Agency.
Environment Agency. (2011). Selecting, using and maintaining lifejackets and
buoyancy aids: Operational Instruction 14_10. V.2. London: Environment Agency.
Environment Agency. (2011a). Chemical Standards [Online] Environment Agency:
London. Available at: http://evidence.environment-agency.gov.uk/Chemical
Standards/Home.aspx. [Accessed on 1st February 2015].
Environment Agency. (2012). Observatory monitoring framework – indicator data
sheet [Online]. London. Environment Agency. Available at:https://www.gov.uk/
government/uploads/system/uploads/attachment_data/file/160781/defra-stats-
observatory-indicators-da2-120224.pdf [Accessed on 10th December 2014].
Environment Agency. (2014a). Formal handling of surface waters: Operational
Instruction 15_04. V.7. London: Environment Agency.

97
Environment Agency. (2014b). Taking field measurements: conductivity and salinity
using a Pro 30 meter: Operational Instruction 113_07. V.6. London: Environment
Agency.
Environment Agency. (2014c) Taking field measurements: using a multi-parameter
meter: Operational Instruction 528_06. V.6. London: Environment Agency.
Environment Agency. (2015). About us [Online]. Environment Agency: London.
Available at: https://www.gov.uk/government/organisations/environment-
agency/about. [Accessed on 1st February 2015].
Europa. (1998). Council Directive 98/83/ec of 3 November 1998 on the quality of
water intended for human consumption [Online]. Europa: Brussels. Available at:
http://eur-lex.europa.eu/legal-content/EN/TXT/PDF/?uri=CELEX:31998L0083
&from=EN. [Accessed on 1st February 2015].
European Commission. (2012). Report from the commission to the European
Parliament and the Council: on the implementation of the Water Framework Directive
(2000/60/EC) [online]. Brussels. European Commission. Available at: http://eur-
lex.europa.eu/legal-content/EN/TXT/?uri=CELEX:52012DC0670 [Accessed on 10th
December 2014].
European Council. (1991). Council Directive of 21 May 1991 concerning urban waste
water treatment (91/271/EEC) (Online). Europa. Brussels. Available at: http://eur-
lex.europa.eu/legal-content/EN/TXT/?uri=CELEX:31991L0271 [Accessed on 10th
December 2014].
European Environment Agency. (2014). Biochemical Oxygen Demand in Rivers
[Online]. Copenhagen. Available at: http://www.eea.europa.eu/data-and-maps
/indicators/biochemical-oxygen-demand-in-rivers. [Accessed on 21st January 2015].

98
European Environment Agency. (2015) Nutrients in freshwater (CSI 020/WAT 003)
[Online]. European Enviromnent Agency: Copenhagen. Available at: http://www.
eea.europa.eu/data-and-maps/indicators/nutrients-in-freshwater/nutrients-in-
freshwater-assessment-published-6. [Accessed on 24th February 2015].
Farabegoli, G., Chiavola, A., & Rolle, E. (2009). The biological aerated filter (BAF) as
alternative treatment for domestic sewage. Optimization of plant performance.
Journal of hazardous materials, 171(1), 1126-1132.
Farhadian, M., Haddad, O. B., Seifollahi-Aghmiuni, S., & Loáiciga, H. A. (2014).
Assimilative Capacity and Flow Dilution for Water Quality Protection in Rivers.
Journal of Hazardous, Toxic, and Radioactive Waste.
Farmer, A. (2001). Reducing phosphate discharges: the role of the 1991 EC urban
wastewater treatment directive. Water Science & Technology, 44(1), 41-48.
Faulkner, H., Edmonds-Brown, V., & Green, A. (2000). Problems of quality designation
in diffusely polluted urban streams—the case of Pymme's Brook, north
London. Environmental Pollution, 109(1), 91-107.
Feely, R. A., Alin, S. R., Newton, J., Sabine, C. L., Warner, M., Devol, A., & Maloy, C.
(2010). The combined effects of ocean acidification, mixing, and respiration on pH and
carbonate saturation in an urbanized estuary. Estuarine, Coastal and Shelf
Science, 88(4), 442-449.
Field, A. (2013). Discovering Statistics using IBM SPSS Statistics. 4th. London: Sage
Publications LTD.
Figueras, M. J., Polo, F., Inza, I., & Guarro, J. (1997). Past, present and future
perspectives of the EU bathing water directive. Marine pollution bulletin, 34(3), 148-
156.

99
Figuerola, B., Maceda-Veiga, A., & De Sostoa, A. (2012). Assessing the effects of sewage
effluents in a Mediterranean creek: fish population features and biotic
indices. Hydrobiologia, 694(1), 75-86.
Foster, D., Wood, A., & Griffiths, M. (2010). The EC Water Framework Directive and its
implications for the Environmental Agency. In Freshwater Forum (Vol. 16, No. 1).
Foster, R. B., & Bates, J. M. (1978). Use of freshwater mussels to monitor point source
industrial discharges. Environmental Science & Technology, 12(8), 958-962.
Foy, R. H., Smith, R. V., Jordan, C., & Lennox, S. D. (1995). Upward trend in soluble
phosphorus loadings to Lough Neagh despite phosphorus reduction at sewage
treatment works. Water Research, 29(4), 1051-1063.
Furse, M. T., Hering, D., Brabec, K., Buffagni, A., Sandin, L., & Verdonschot, P. F. (Eds.).
(2009). The Ecological Status of European Rivers: Evaluation and Intercalibration of
Assessment Methods: Evaluation and Intercalibration of Assessment Methods (Vol.
188). Springer Science & Business Media.
Galloway, J. N., Townsend, A. R., Erisman, J. W., Bekunda, M., Cai, Z., Freney, J. R., &
Sutton, M. A. (2008). Transformation of the nitrogen cycle: recent trends, questions,
and potential solutions. Science, 320(5878), 889-892.
Gasperi, J., Garnaud, S., Rocher, V., & Moilleron, R. (2008). Priority pollutants in
wastewater and combined sewer overflow. Science of the Total Environment,407(1),
263-272.
GE Power & Water. (2014) Zee Weed Hollow-fibre Membranes [Digital Image] GE
Power & Water. Available at: http://www.gewater.com/products/zeeweed-500-
membrane.html [Accessed on 1st January 2015].
Georgiou, S., & Bateman, I. J. (2005). Revision of the EU Bathing Water Directive:
economic costs and benefits. Marine pollution bulletin, 50(4), 430-438.
100
Gerardi, M. H. (2005). Nitrification in the activated sludge process. John Wiley & Sons,
Inc.
Gergel, S. E., Turner, M. G., Miller, J. R., Melack, J. M., & Stanley, E. H. (2002). Landscape
indicators of human impacts to riverine systems. Aquatic Sciences, 64(2), 118-128.
Godwin, K. S., Hafner, S. D., & Buff, M. F. (2003). Long-term trends in sodium and
chloride in the Mohawk River, New York: the effect of fifty years of road-salt
application. Environmental pollution, 124(2), 273-281.
Gomes, R. L., Scrimshaw, M. D., & Lester, J. N. (2003). Determination of endocrine
disrupters in sewage treatment and receiving waters. TrAC Trends in Analytical
Chemistry, 22(10), 697-707.
Goodchild, R. G. (1998). EU policies for the reduction of nitrogen in water: the example
of the Nitrates Directive. Environmental pollution, 102(1), 737-740.
Gorecki, K., & Melcer, B. (2006). The effect of sewage treatment plants on nitrogen and
phosphorus loads transported by the Warta River in the Oborniki-Skwierzyna
Stretch. Polish Journal of Environmental Studies, 15(2), 271-275.
Goudreau, S. E., Neves, R. J., & Sheehan, R. J. (1993). Effects of wastewater treatment
plant effluents on freshwater mollusks in the upper Clinch River, Virginia, USA.
Hydrobiologia, 252(3), 211-230.
Grady Jr, C. L., Daigger, G. T., Love, N. G., & Filipe, C. D. (2012). Biological wastewater
treatment. CRC Press.
Green, J., & Damji, S. (2001). Chapter 3. Chemistry. Camberwell, Vic.: IBID.

101
HACH. (2013). HQd Portable Meter instruction manual [Online]. HACH: Colorado.
Available at: http://www.hach.com/hq30d-portable-ph-conductivity-optical-
dissolved-oxygen-do-orp-and-ise-multi-parameter-meter/product-downloads
?id=7640494072. [Accessed on 1st February 2015].
Hanna. (2005) Instruction Manual HI98129/HI98130 pH/EC/TDS/Temperature with
Only One Tester [Online].Rhode Island, USA. Available at: http://hannainst
.com/manuals/manHI_98129_98130.pdf [Accessed on 1st January 2015].
Hasegawa, S., & Hasegawa, T. (1977). U.S. Patent No. 4,055,490. Washington, DC: U.S.
Patent and Trademark Office.
Hayashi, M. (2004). Temperature-Electrical Conductivity Relation of Water for
Environmental Monitoring and Geophysical Data Inversion. In Environmental
Monitoring and Assessment.
Haygarth, P. M., Condron, L. M., Heathwaite, A. L., Turner, B. L., & Harris, G. P. (2005).
The phosphorus transfer continuum: linking source to impact with an
interdisciplinary and multi-scaled approach. Science of the Total Environment,
344(1), 5-14.
Hering, D., Borja, A., Carstensen, J., Carvalho, L., Elliott, M., Feld, C. K., & van de Bund,
W. (2010). The European Directive at the age of 10: a critical review of the
achievements with recommendations for the future. Science of the total
Environment, 408(19), 4007-4019.
Hester, E. T., & Doyle, M. W. (2011). Human Impacts to River Temperature and Their
Effects on Biological Processes: A Quantitative Synthesis1.
Hickey, C. W., & Vickers, M. L. (1994). Toxicity of ammonia to nine native New Zealand
freshwater invertebrate species. Archives of environmental contamination and
toxicology, 26(3), 292-298.

102
Hill, T., & Neal, C. (1997). Spatial and temporal variation in pH, alkalinity and
conductivity in surface runoff and groundwater for the Upper River Severn
catchment. Hydrology and Earth System Sciences Discussions, 1(3), 697-715.
Hills, F. J., Broadbent, F. E., & Fried, M. (1978). Timing and rate of fertilizer nitrogen for
sugarbeets related to nitrogen uptake and pollution potential. Journal of
Environmental Quality, 7(3), 368-372.
Hindar, A., Henriksen, A., Kaste, Ø., & Tørseth, K. (1995). Extreme acidification in small
catchments in south western Norway associated with a sea salt episode. Water, Air,
and Soil Pollution, 85(2), 547-552.
Holenda, B., Domokos, E., Redey, A., & Fazakas, J. (2008). Dissolved oxygen control of
the activated sludge wastewater treatment process using model predictive control.
Computers & Chemical Engineering, 32(6), 1270-1278.
Holt, M. S., Fox, K. K., Burford, M., Daniel, M., & Buckland, H. (1998). UK monitoring
study on the removal of linear alkylbenzene sulphonate in trickling filter type sewage
treatment plants. Contribution to GREAT-ER project# 2.Science of the total
environment, 210, 255-269.
Hu, B., Wheatley, A., Ishtchenko, V., & Huddersman, K. (2011). The effect of shock
loads on SAF bioreactors for sewage treatment works. Chemical Engineering
Journal, 166(1), 73-80.
Hunt, C. D., Mansfield, A. D., Mickelson, M. J., Albro, C. S., Geyer, W. R., & Roberts, P. J.
(2010). Plume tracking and dilution of effluent from the Boston sewage outfall.
Marine environmental research, 70(2), 150-161.
Hunt, M., Herron, E., Green, L. (2012). Chlorides in fresh water. The University of
Rhode Island: College of the Environment and Life Sciences.

103
Imai, A., Fukushima, T., Matsushige, K., Kim, Y. H., & Choi, K. (2002). Characterization
of dissolved organic matter in effluents from wastewater treatment plants. Water
Research, 36(4), 859-870.
James, C. P., Germain, E., & Judd, S. (2014). Micropollutant removal by advanced
oxidation of microfiltered secondary effluent for water reuse. Separation and
Purification Technology, 127, 77-83.
Jarvie, H. P., Haygarth, P. M., Neal, C., Butler, P., Smith, B., Naden, P. S., & Palmer-
Felgate, E. J. (2008a). Stream water chemistry and quality along an upland–lowland
rural land-use continuum, south west England. Journal of Hydrology, 350(3), 215-231.
Jarvie, H. P., Lycett, E., Neal, C., & Love, A. (2002). Patterns in nutrient concentrations
and biological quality indices across the upper Thames river basin, UK. Science of the
total environment, 282, 263-294.
Jarvie, H. P., Neal, C., & Withers, P. J. (2006). Sewage-effluent phosphorus: a greater
risk to river eutrophication than agricultural phosphorus? Science of the Total
Environment, 360(1), 246-253.
Jarvie, H. P., Neal, C., Williams, R. J., Neal, M., Wickham, H. D., Hill, L. K., & White, J.
(2002a). Phosphorus sources, speciation and dynamics in the lowland eutrophic River
Kennet, UK. Science of the Total Environment, 282, 175-203.
Jarvie, H. P., Neal, C., Withers, P. J., Robinson, A., & Salter, N. (2003). Nutrient water
quality of the Wye catchment, UK: exploring patterns and fluxes using the
Environment Agency data archives. Hydrology and Earth System Sciences
Discussions, 7(5), 722-743.
Jarvie, H. P., Withers, J. A., & Neal, C. (1999). Review of robust measurement of
phosphorus in river water: sampling, storage, fractionation and sensitivity.
Hydrology and Earth System Sciences, 6(1), 113-131.

104
Jarvie, H. P., Withers, P. J., Hodgkinson, R., Bates, A., Neal, M., Wickham, H. D., &
Armstrong, L. (2008). Influence of rural land use on streamwater nutrients and their
ecological significance. Journal of Hydrology, 350(3), 166-186.
Jordan, C., & Smith, R. V. (2005). Methods to predict the agricultural contribution to
catchment nitrate loads: designation of nitrate vulnerable zones in Northern
Ireland. Journal of hydrology, 304(1), 316-329.
Judd, S. (2004). A review of fouling of membrane bioreactors in sewage
treatment. Water Science & Technology, 49(2), 229-235.
Judd, S. (2010). The MBR book: principles and applications of membrane bioreactors
for water and wastewater treatment. Elsevier.
Juretschko, S., Loy, A., Lehner, A., & Wagner, M. (2002). The microbial community
composition of a nitrifying-denitrifying activated sludge from an industrial sewage
treatment plant analyzed by the full-cycle rRNA approach. Systematic and applied
microbiology, 25(1), 84-99.
Justić, D., Turner, R. E., & Rabalais, N. N. (2003). Climatic influences on riverine nitrate
flux: Implications for coastal marine eutrophication and hypoxia.
Estuaries, 26(1), 1-11.
Kallis, G., & Butler, D. (2001). The EU water framework directive: measures and
implications. Water policy, 3(2), 125-142.
Kelly, M. G. (1998). Use of community-based indices to monitor eutrophication in
European rivers. Environmental Conservation, 25(01), 22-29.
Kelly, M. G. (1998). Use of the trophic diatom index to monitor eutrophication in
rivers. Water research, 32(1), 236-242.

105
Kelly, V. R., Lovett, G. M., Weathers, K. C., Findlay, S. E., Strayer, D. L., Burns, D. J., &
Likens, G. E. (2007). Long-term sodium chloride retention in a rural watershed: legacy
effects of road salt on streamwater concentration.Environmental science &
technology, 42(2), 410-415.
Kelly, W. R., Panno, S. V., Hackley, K. C., Hwang, H. H., Martinsek, A. T., & Markus, M.
(2010). Using chloride and other ions to trace sewage and road salt in the Illinois
Waterway. Applied Geochemistry, 25(5), 661-673.
Kielland, K. (1994). Amino acid absorption by arctic plants: implications for plant
nutrition and nitrogen cycling. Ecology, 75(8), 2373-2383.
Kim, D. J., Lee, D. I., & Keller, J. (2006). Effect of temperature and free ammonia on
nitrification and nitrite accumulation in landfill leachate and analysis of its nitrifying
bacterial community by FISH. Bioresource technology,97(3), 459-468.
Kim, J., Park, C., Kim, T. H., Lee, M., Kim, S., Kim, S. W., & Lee, J. (2003). Effects of
various pretreatments for enhanced anaerobic digestion with waste activated
sludge. Journal of bioscience and bioengineering, 95(3), 271-275.
Kim, S., Eichhorn, P., Jensen, J. N., Weber, A. S., & Aga, D. S. (2005). Removal of
antibiotics in wastewater: effect of hydraulic and solid retention times on the fate of
tetracycline in the activated sludge process. Environmental science & technology,
39(15), 5816-5823.
Kleinman, P. J., Sharpley, A. N., McDowell, R. W., Flaten, D. N., Buda, A. R., Tao, L., & Zhu,
Q. (2011). Managing agricultural phosphorus for water quality protection: principles
for progress. Plant and soil, 349(1-2), 169-182.
Lam, H. M., Coschigano, K. T., Oliveira, I. C., Melo-Oliveira, R., & Coruzzi, G. M. (1996).
The molecular-genetics of nitrogen assimilation into amino acids in higher plants.
Annual review of plant biology, 47(1), 569-593.

106
Lau, J., Butler, D., & Schütze, M. (2002). Is combined sewer overflow spill frequency
/volume a good indicator of receiving water quality impact? Urban water, 4(2), 181-
189.
Lee, J., Ahn, W. Y., & Lee, C. H. (2001). Comparison of the filtration characteristics
between attached and suspended growth microorganisms in submerged membrane
bioreactor. Water Research, 35(10), 2435-2445.
Liu, J., Björnsson, L., & Mattiasson, B. (2000). Immobilised activated sludge based
biosensor for biochemical oxygen demand measurement. Biosensors and
Bioelectronics, 14(12), 883-893.
Liu, Y. (2003). Chemically reduced excess sludge production in the activated sludge
process. Chemosphere, 50(1), 1-7.
Löfgren, S. (2001). The chemical effects of deicing salt on soil and stream water of five
catchments in southeast Sweden. Water, Air, and Soil Pollution, 130(1-4), 863-868.
Logan, B. E., Hermanowicz, S. W., & Parker, D. S. (1987). Engineering implications of a
new trickling filter model. Journal (Water Pollution Control Federation), 1017-1028.
Logan, P., & Furse, M. (2002). Preparing for the European Water Framework
Directive—making the links between habitat and aquatic biota. Aquatic Conservation:
Marine and Freshwater Ecosystems, 12(4), 425-437.
Maciver, M. A., Sharabash, N. M., & Nelson, M. E. (2001). Prey-capture behavior in
gymnotid electric fish: motion analysis and effects of water conductivity. Journal of
experimental biology, 204(3), 543-557.
Mainstone, C. P., & Parr, W. (2002). Phosphorus in rivers—ecology and management.
Science of the Total Environment, 282, 25-47.
107
Mann, A. T., & Stephenson, T. (1997). Modelling biological aerated filters for
wastewater treatment. Water Research, 31(10), 2443-2448.
McIntyre, N. (2004). Analysis of uncertainty in river water quality modelling. Ph.D.
Thesis. Imperial College London.
Meffe, R., & de Bustamante, I. (2014). Emerging organic contaminants in surface water
and groundwater: A first overview of the situation in Italy. Science of The Total
Environment, 481, 280-295.
Melin, T., Jefferson, B., Bixio, D., Thoeye, C., De Wilde, W., De Koning, J., & Wintgens, T.
(2006). Membrane bioreactor technology for wastewater treatment and reuse.
Desalination, 187(1), 271-282.
Metcalf, L., Eddy, H. P., & Tchobanoglous, G. (1972). Wastewater engineering:
treatment, disposal, and reuse. McGraw-Hill.
Miranda, L. E., Hargreaves, J. A., & Raborn, S. W. (2001). Predicting and managing risk
of unsuitable dissolved oxygen in a eutrophic lake.Hydrobiologia, 457(1-3), 177-185.
Morrison, G., Fatoki, O. S., Persson, L., & Ekberg, A. (2001). Assessment of the impact of
point source pollution from the Keiskammahoek Sewage Treatment Plant on the
Keiskamma River-pH, electrical conductivity, oxygen-demanding substance (COD) and
nutrients. Water SA, 27(4), 475-480.
Nah, I. W., Kang, Y. W., Hwang, K. Y., & Song, W. K. (2000). Mechanical pretreatment of
waste activated sludge for anaerobic digestion process. Water research, 34(8), 2362-
2368.
National Laboratory Service. (2015). Anions methodology. Nottingham: National
Laboratory Service.

108
National Laboratory Service. (2015a). Biochemical Oxygen Demand methodology.
Nottingham: National Laboratory Service.
National Laboratory Service. (2015b). Chemical Oxygen Demand methodology.
Nottingham: National Laboratory Service.
National Laboratory Service. (2015c). Nutrients methodology. Nottingham: National
Laboratory Service.
National Laboratory Service. (2015d). pH methodology. Nottingham: National
Laboratory Service.
National Laboratory Service. (2015e). OES GPMix Aqua Regia methodology.
Nottingham: National Laboratory Service.
National Rivers Authority, (1994). The quality of rivers and canals in England and
Wales (1990 to 1992). Water Quality Series No. 19. HMSO, London, ISBN 0 11 886519
6
Natural England. (2012). Water Framework Directive [Online]. Natural England:
London. Available at: http://webarchive.nationalarchives.gov.uk/20140402193
014/http://www.naturalengland.org.uk/ourwork/water/waterdirective.aspx.
[Accessed on 1st February 2015].
Neal, C., & Jarvie, H. P. (2005). Agriculture, community, river eutrophication and the
Water Framework Directive. Hydrological Processes, 19(9), 1895-1901.
Neal, C., & Robson, A. J. (2000). A summary of river water quality data collected within
the Land–Ocean Interaction Study: core data for eastern UK Rivers draining to the
North Sea. Science of the Total Environment, 251, 585-665.

109
Neal, C., Davies, H., &, M. (2008). Water quality, nutrients and the water framework
directive in an agricultural region: The lower Humber Rivers, northern
England. Journal of hydrology, 350(3), 232-245.
Neal, C., Jarvie, H. P., Love, A., Neal, M., Wickham, H., & Harman, S. (2008a). Water
quality along a river continuum subject to point and diffuse sources. Journal of
Hydrology, 350(3), 154-165.
Neal, C., Jarvie, H. P., Neal, M., Hill, L., & Wickham, H. (2006). Nitrate concentrations in
river waters of the upper Thames and its tributaries. Science of the Total
Environment, 365(1), 15-32.
Neal, C., Jarvie, H. P., Neal, M., Love, A. J., Hill, L., & Wickham, H. (2005a). Water quality
of treated sewage effluent in a rural area of the upper Thames Basin, southern
England, and the impacts of such effluents on riverine phosphorus concentrations.
Journal of Hydrology, 304(1), 103-117.
Neal, C., Jarvie, H. P., Williams, R. J., Neal, M., Wickham, H., & Hill, L. (2002).
Phosphorus-calcium carbonate saturation relationships in a lowland chalk river
impacted by sewage inputs and phosphorus remediation: an assessment of
phosphorus self-cleansing mechanisms in natural waters. Science of the total
environment, 282, 295-310.
Neal, C., Jarvie, H. P., Williams, R., Love, A., Neal, M., Wickham, H., & Armstrong, L.
(2010). Declines in phosphorus concentration in the upper River Thames (UK): Links
to sewage effluent cleanup and extended end-member mixing analysis. Science of the
total environment, 408(6), 1315-1330.
Neal, C., Jarvie, H. P., Withers, P. J., Whitton, B. A., & Neal, M. (2010a). The strategic
significance of wastewater sources to pollutant phosphorus levels in English rivers
and to environmental management for rural, agricultural and urban catchments.
Science of the Total Environment, 408(7), 1485-1500.

110
Neal, C., Williams, R. J., Bowes, M. J., Harrass, M. C., Neal, M., Rowland, P., & Helen, P. J.
(2010b). Decreasing boron concentrations in UK Rivers: Insights into reductions in
detergent formulations since the 1990s and within-catchment storage issues.
Science of the total environment, 408(6), 1374-1385.
Nestler, A., Berglund, M., Accoe, F., Duta, S., Xue, D., Boeckx, P., Taylor, P., (2011).
Isotopes for improved management of nitrate pollution in aqueous resources: review
of surface water field studies. Environmental Science and Pollution Research 18 (4),
519e533
Newman, M. C., & Aplin, M. S. (1992). Enhancing toxicity data interpretation and
prediction of ecological risk with survival time modeling: an illustration using sodium
chloride toxicity to mosquitofish (Gambusia holbrooki). Aquatic toxicology,
23(2), 85-96.
Nixon, S. C., Gunby, A., Ashley, S. J., Lewis, S., & Naismith, I. (1995). Development and
testing of General Quality Assessment schemes: dissolved oxygen and ammonia in
estuaries. R&D Tech Project Record PR, 469, 15.
Noble, J. (2006). GE ZeeWeed MBR technology for pharmaceutical wastewater
treatment. Membrane Technology, 2006(9), 7-9.
Norfolk County Council. (2010). The General Quality Assessment Scheme –
Methodologies for the Classification of River and Estuary Quality [Online]. Norfolk
County Council: Norfolk. Available at: http://www.norfolk.gov.uk/view/ncc1049
38. [Accessed on 10th February 2015].
O'Riordan, T., Bentham, G., Burt, T. P., Heathwaite, A. L., & Trudgill, S. T. (1993). The
politics of nitrate in the UK. Nitrate: processes, patterns and management. 403-416.

111
Oliveira, M. A., & Goulder, R. (2006). The effects of sewage-treatment-works effluent
on epilithic bacterial and algal communities of three streams in Northern England.
Hydrobiologia, 568(1), 29-42.
Osada, T., Haga, K., & Harada, Y. (1991). Removal of nitrogen and phosphorus from
swine wastewater by the activated sludge units with the intermittent aeration
process. Water Research, 25(11), 1377-1388.
Osborn, S., & Cook, H. F. (1997). Nitrate vulnerable zones and nitrate sensitive areas: a
policy and technical analysis of groundwater source protection in England and
Wales. Journal of Environmental Planning and Management, 40(2), 217-234.
Petts, G. E. (1996). Water allocation to protect river ecosystems. Regulated rivers:
research & management, 12(4-5), 353-365.
Pipeline. (2003). Explaining the Activated Sludge Process. Pipeline. Vol 14(2)
Pitocchelli, J. (2001). Survey of Biodiversity - Introduction, Microbes I [Digital Image].
Saint Anselm College: New Hampshire. Available at: http://www.anselm.
edu/homepage/jpitocch/genbi101/diversity1microbes1.html. [Accessed on 1st
February 2015].
Purcell, P. (2003). Design of Water Resources Systems. London: Thomas Telford
Publishing.
Pure Water Gazette. (2014) Texas City Struggles Under Invasion of Water Filter Flies
[Digital Image]. Pure Water Gazette: Texas. Available at: http://Purewatergazette.
net/blog/wp-content/uploads/2013/06/trickling-filter-600-x-450.jpg. [Accessed on
1st February 2015].
Randall, D. J., & Tsui, T. K. N. (2002). Ammonia toxicity in fish. Marine pollution
bulletin, 45(1), 17-23.

112
Rattan, R. K., Datta, S. P., Chhonkar, P. K., Suribabu, K., & Singh, A. K. (2005). Long-term
impact of irrigation with sewage effluents on heavy metal content in soils, crops and
groundwater—a case study. Agriculture, Ecosystems & Environment,
109(3), 310-322.
Reid, E., Liu, X., & Judd, S. J. (2006). Effect of high salinity on activated sludge
characteristics and membrane permeability in an immersed membrane bioreactor.
Journal of Membrane Science, 283(1), 164-171.
Ricci, M., Kourtchev, I., & Emons, H. (2012). Chemical water monitoring under the
Water Framework Directive with Certified Reference Materials. TrAC Trends in
Analytical Chemistry, 36, 47-57.
Richards, R. A. (2000). Selectable traits to increase crop photosynthesis and yield of
grain crops. Journal of Experimental Botany, 51(suppl 1), 447-458.
Richardson, A. E. (2001). Prospects for using soil microorganisms to improve the
acquisition of phosphorus by plants. Functional Plant Biology, 28(9), 897-906.
Rivett, M. O., Ellis, P. A., & Mackay, R. (2011). Urban groundwater baseflow influence
upon inorganic river-water quality: The River Tame headwaters catchment in the City
of Birmingham, UK. Journal of Hydrology, 400(1), 206-222.
RPA. (2003). Water Framework Directive – Indicative Costs of Agricultural Measures
[Online]. DEFRA: London. Available at: http://webarchive.nationalarchives.gov.uk/
20070101182450/http://www.defra.gov.uk/corporate/consult/waterframe3/agricri
a-full.pdf. [Accessed on 1st February 2015].
Ruiz, G., Jeison, D., & Chamy, R. (2003). Nitrification with high nitrite accumulation for
the treatment of wastewater with high ammonia concentration. Water Research,
37(6), 1371-1377.

113
San Diego-McGlone, M. L., Azanza, R. V., Villanoy, C. L., & Jacinto, G. S. (2008).
Eutrophic waters, algal bloom and fish kill in fish farming areas in Bolinao,
Pangasinan, Philippines. Marine pollution bulletin, 57(6), 295-301.
Sánchez, E., Colmenarejo, M. F., Vicente, J., Rubio, A., García, M. G., Travieso, L., & Borja,
R. (2007). Use of the water quality index and dissolved oxygen deficit as simple
indicators of watersheds pollution. Ecological Indicators, 7(2), 315-328.
Schurr, J. M., & Ruchti, J. (1977). Dynamics of O2 and CO2 exchange, photosynthesis,
and respiration in rivers from time-delayed correlations with ideal sunlight.
Limnology and Oceanography, 22(2), 208-225.
Seghezzo, L., Zeeman, G., Van Lier, J. B., Hamelers, H. V. M., & Lettinga, G. (1998). A
review: the anaerobic treatment of sewage in UASB and EGSB reactors. Bioresource
Technology, 65(3), 175-190.
Seybold, C. A., Mersie, W., Huang, J., & McNamee, C. (2002). Soil redox, pH,
temperature, and water-table patterns of a freshwater tidal wetland. Wetlands,
22(1), 149-158.
Shammas, N. K. (1986). Interactions of temperature, pH, and biomass on the
nitrification process. Journal (Water Pollution Control Federation), 52-59.
Sharpley, A. N., Chapra, S. C., Wedepohl, R., Sims, J. T., Daniel, T. C., & Reddy, K. R.
(1994). Managing agricultural phosphorus for protection of surface waters: Issues and
options. Journal of Environmental Quality, 23(3), 437-451.
Shubham. (2015). Conventional sewage treatment plant. [Digital Image]. Shubham.
Available at: http://www.shubhaminc.com/conventional-sewage-treatment-plant-
414977.html [Accessed on 1st January 2015]
Simonsen, J. F., & Harremoës, P. (1978). Oxygen and pH fluctuations in rivers.Water
Research, 12(7), 477-489.

114
Singh, K. P., Mohan, D., Sinha, S., & Dalwani, R. (2004). Impact assessment of treated/
untreated wastewater toxicants discharged by sewage treatment plants on health,
agricultural, and environmental quality in the wastewater disposal area.
Chemosphere, 55(2), 227-255.
Singleton, M. J., Esser, B. K., Moran, J. E., Hudson, G. B., McNab, W. W., & Harter, T.
(2007). Saturated zone denitrification: potential for natural attenuation of nitrate
contamination in shallow groundwater under dairy operations. Environmental
science & technology, 41(3), 759-765.
Sliva, L., & Williams, D. D. (2001). Buffer zone versus whole catchment approaches to
studying land use impact on river water quality. Water research,35(14), 3462-3472.
Smith, K. A., Jackson, D. R., & Withers, P. J. A. (2001). Nutrient losses by surface run-off
following the application of organic manures to arable land. 2. Phosphorus.
Environmental Pollution, 112(1), 53-60.
Smith, V. H., Tilman, G. D., & Nekola, J. C. (1999). Eutrophication: impacts of excess
nutrient inputs on freshwater, marine, and terrestrial ecosystems.Environmental
pollution, 100(1), 179-196.
Sollfrank, U., & Gujer, W. (1991). Characterisation of domestic wastewater for
mathematical modelling of the activated sludge process. Water Science &
Technology, 23(4-6), 1057-1066.
Spanjers, H., Vanrolleghem, P., Olsson, G., & Dold, P. (1998). Respirometry in control of
the activated sludge process: Principles. International Association on Water Quality.
Stamm, C., Jarvie, H. P., & Scott, T. (2013). What’s more important for managing
phosphorus: loads, concentrations or both? Environmental science & technology,
48(1), 23-24.

115
Sterner, C. S. (2008). Waste and city form: Reconsidering the medieval strategy.
Journal of Green Building, 3(3), 67-78.
Stott, L. D., Berelson, W., Douglas, R. and Gorsline, D., (2000). Increased dissolved
oxygen in Pacific intermediate waters due to lower rates of carbon oxidation in
sediments, Nature, 407(6802), 367-370.
Stumm, W., & Morgan, J. J. (2012). Aquatic chemistry: chemical equilibria and rates in
natural waters (Vol. 126). John Wiley & Sons.
Suarez, J., & Puertas, J. (2005). Determination of COD, BOD, and suspended solids loads
during combined sewer overflow (CSO) events in some combined catchments in
Spain. Ecological Engineering, 24(3), 199-217.
Swain, T, M. (2015) Photograph of multiple ASP lanes from Severn Trent sewage
treatment works [Photograph].
Tilak, K. S., Veeraiah, K., & Raju, J. M. P. (2007). Effects of ammonia, nitrite and nitrate
on hemoglobin content and oxygen consumption of freshwater fish, Cyprinus carpio
(Linnaeus). Journal of Environmental Biology, 28(1), 45-47.
Tomlinson, T. G., Boon, A. G., & Trotman, C. N. A. (1966). Inhibition of nitrification in
the activated sludge process of sewage disposal. Journal of Applied Bacteriology,
29(2), 266-291.
Tsai, C. F. (1973). Water quality and fish life below sewage outfalls. Transactions of the
American Fisheries Society, 102(2), 281-292.
Ulén, B. M., & Weyhenmeyer, G. A. (2007). Adapting regional eutrophication targets for
surface waters—influence of the EU Water Framework Directive, national policy and
climate change. Environmental Science & Policy, 10(7), 734-742.

116
Van Grinsven, H. J. M., Ten Berge, H. F. M., Dalgaard, T., Fraters, B., Durand, P., Hart, A.,
& Willems, W. J. (2012). Management, regulation and environmental impacts of
nitrogen fertilization in northwestern Europe under the Nitrates Directive: a
benchmark study. Biogeosciences, 9, 5143-5160.
Vaquer-Sunyer, R., & Duarte, C. M. (2008). Thresholds of hypoxia for marine
biodiversity. Proceedings of the National Academy of Sciences, 105(40), 15452-15457.
Vega, M., Pardo, R., Barrado, E., & Debán, L. (1998). Assessment of seasonal and
polluting effects on the quality of river water by exploratory data analysis. Water
research, 32(12), 3581-3592.
Velz, C. J. (1948). A basic law for the performance of biological filters. Sewage Works
Journal, 607-617.
Verrecht, B., Judd, S., Guglielmi, G., Brepols, C., & Mulder, J. W. (2008). An aeration
energy model for an immersed membrane bioreactor. Water research,42(19), 4761-
4770.
Vinten, A. J. A., & Dunn, S. M. (2001). Assessing the effects of land use on temporal
change in well water quality in a designated nitrate vulnerable zone. Science of the
total environment, 265(1), 253-268.
Vörösmarty, C. J., McIntyre, P. B., Gessner, M. O., Dudgeon, D., Prusevich, A., Green, P., &
Davies, P. M. (2010). Global threats to human water security and river biodiversity.
Nature, 467(7315), 555-561.
Wade, A. J., Whitehead, P. G., Hornberger, G. M., Jarvie, H. P., & Flynn, N. (2002). On
modelling the impacts of phosphorus stripping at sewage works on in-stream
phosphorus and macrophyte/epiphyte dynamics: a case study for the River
Kennet. Science of the total environment, 282, 395-415.

117
Wagner, M., Rath, G., Koops, H. P., Flood, J., & Amann, R. (1996). In situ analysis of
nitrifying bacteria in sewage treatment plants. Water Science and Technology, 34(1),
237-244.
Wakelin, S. A., Colloff, M. J., & Kookana, R. S. (2008). Effect of wastewater treatment
plant effluent on microbial function and community structure in the sediment of a
freshwater stream with variable seasonal flow. Applied and environmental
microbiology, 74(9), 2659-2668.
Wakida, F. T., & Lerner, D. N. (2005). Non-agricultural sources of groundwater nitrate:
a review and case study. Water research, 39(1), 3-16.Water quality/diffuse/nitrate
/documents/nvz_methodology.pdf [Accessed on 22nd February 2015].
Water Monitoring Association (2008). The Waste Water Industry and its Regulator, a
laboratory perspective [Online]. Available at: http://nw-ss.co.uk/docs/51.pdf.
[Accessed on 1st February 2015].
Weinthal, E., Parag, Y., Vengosh, A., Muti, A., & Kloppmann, W. (2005). The EU drinking
water directive: the boron standard and scientific uncertainty. European
Environment, 15(1), 1-12.
Weston, D.P., You, J., and Lydy, M.J., (2004). Distribution and Toxicity of Sediment-
Associated Pesticides in Agriculture-Dominant Water Bodies of California’s Central
Valley. Environmental Science and Technology, 38(10), pp. 2752-2759.
Whitehead, P. G., Wilby, R. L., Battarbee, R. W., Kernan, M. and Wade, A. J., (2009). A
review of the potential impacts of climate change on surface water quality,
Hydrological Sciences Journal, 54, 101-123.
Wilcock, R. J., Nagels, J. W., McBride, G. B., Collier, K. J., Wilson, B. T., & Huser, B. A.
(1998). Characterisation of lowland streams using a single-station diurnal curve
analysis model with continuous monitoring data for dissolved oxygen and
temperature. New Zealand Journal of Marine and Freshwater Research, 32(1), 67-79.

118
Williams, E. M., & Eddy, F. B. (1986). Chloride uptake in freshwater teleosts and its
relationship to nitrite uptake and toxicity. Journal of Comparative Physiology
B, 156(6), 867-872.
Withers, P. J. A., & Jarvie, H. P. (2008). Delivery and cycling of phosphorus in rivers: A
review. Science of the total environment, 400(1), 379-395.
Withers, P. J., & Lord, E. I. (2002). Agricultural nutrient inputs to rivers and ground
waters in the UK: policy, environmental management and research needs. Science of
the Total Environment, 282, 9-24.
Woombs, M., & Laybourn-Parry, J. (1986). The role of nematodes in low rate
percolating filter sewage treatment works. Water Research, 20(6), 781-787.
Worrall, F., Spencer, E., & Burt, T. P. (2009). The effectiveness of nitrate vulnerable
zones for limiting surface water nitrate concentrations. Journal of Hydrology,
370(1), 21-28.
Wright, J. F., Sutcliffe, D. W., & Furse, M. T. (2000). Assessing the biological quality of
freshwaters. RIVPACS and other techniques. Freshwater Biological Association,
Ambleside, England.
Yang, W., Cicek, N., & Ilg, J. (2006). State-of-the-art of membrane bioreactors:
Worldwide research and commercial applications in North America. Journal of
Membrane Science, 270(1), 201-211.
Young, K., Morse, G. K., Scrimshaw, M. D., Kinniburgh, J. H., MacLeod, C. L., & Lester, J.
N. (1999). The relation between phosphorus and eutrophication in the Thames
catchment, UK. Science of the total environment, 228(2), 157-183.

119
Appendix
Appendix 1: Email from Gail Pluckrose, Waste Water Service Delivery Manager confirming commercial sensitivity for the project.

120
Appendix 2: Site layout diagrams
Appendix 2.1: Site diagram showing layout of Site 1.
Appendix 2.2: Site diagram showing layout of Site 2.
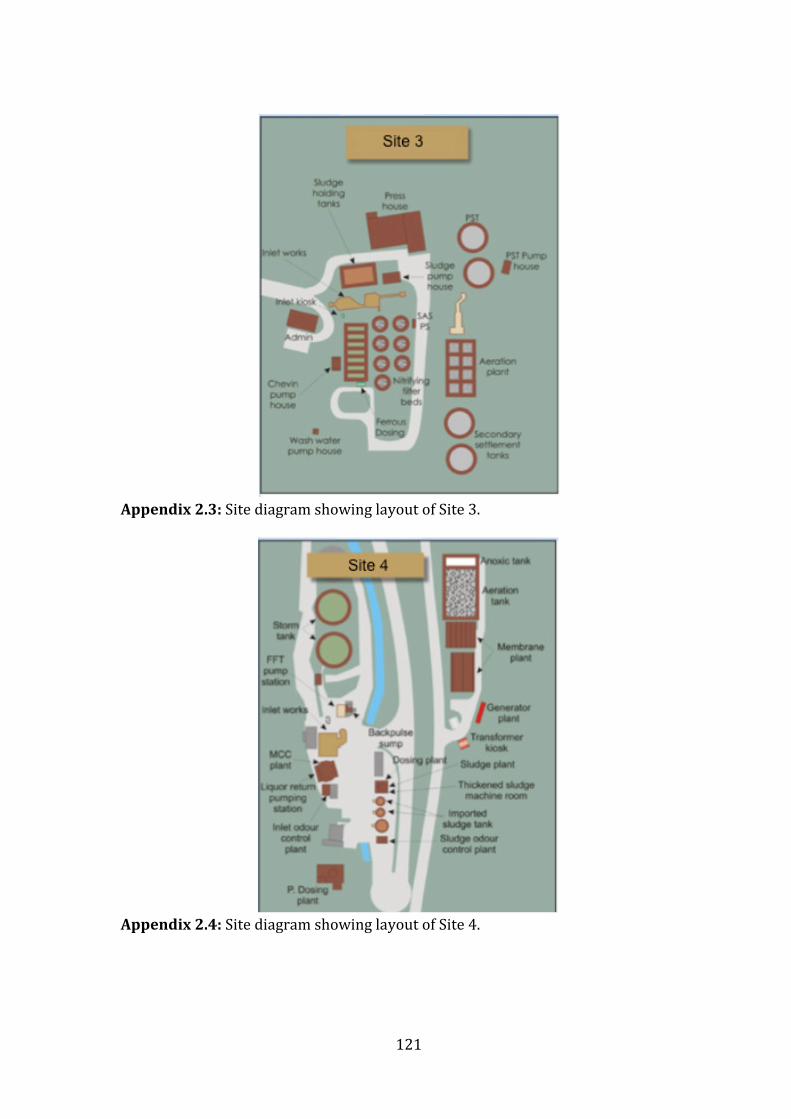
121
Appendix 2.3: Site diagram showing layout of Site 3.
Appendix 2.4: Site diagram showing layout of Site 4.

122
Appendix 2.5.1: Site diagram showing primary treatment at Site 5.
Appendix 2.5.2: Site diagram showing secondary treatment at Site 5.
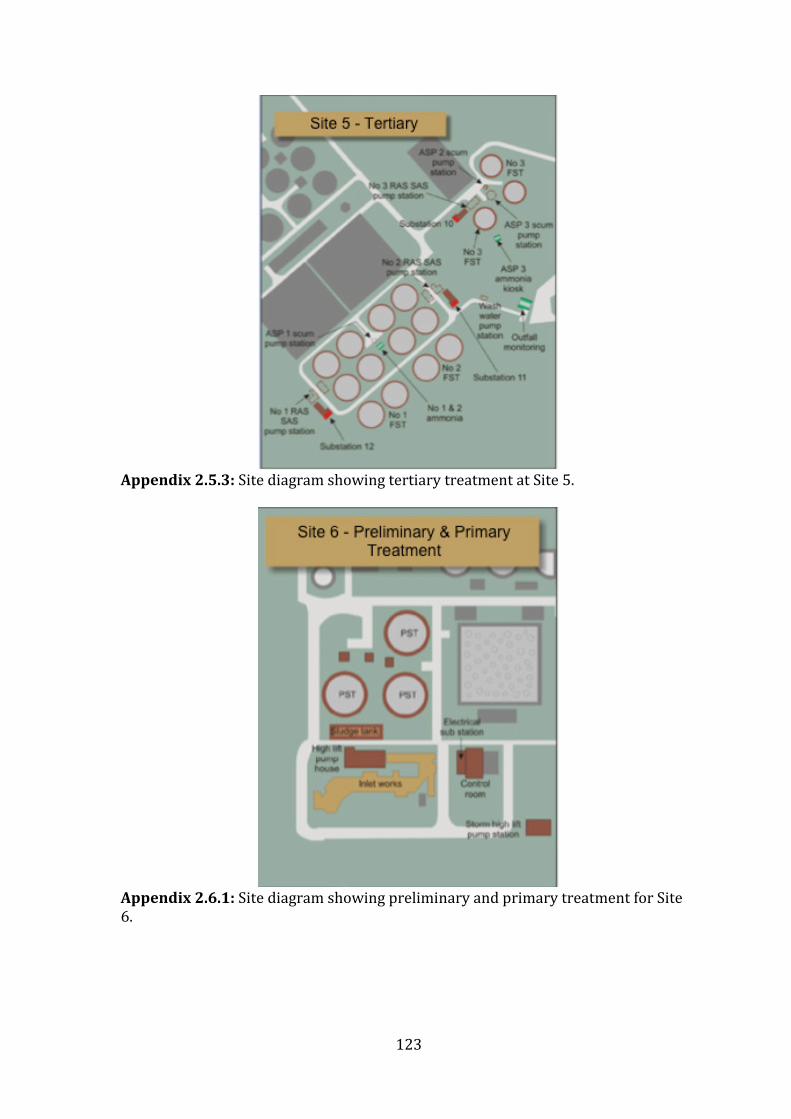
123
Appendix 2.5.3: Site diagram showing tertiary treatment at Site 5.
Appendix 2.6.1: Site diagram showing preliminary and primary treatment for Site 6.

124
Appendix 2.6.2: Site diagram showing secondary and tertiary treatment for Site 6.
Appendix 2.7: Site diagram showing layout of Site 7.

125
Appendix 3: Sample point maps
Appendix 3.1: River course and sample point map for Site 1 showing upstream, final effluent and downstream sample locations.
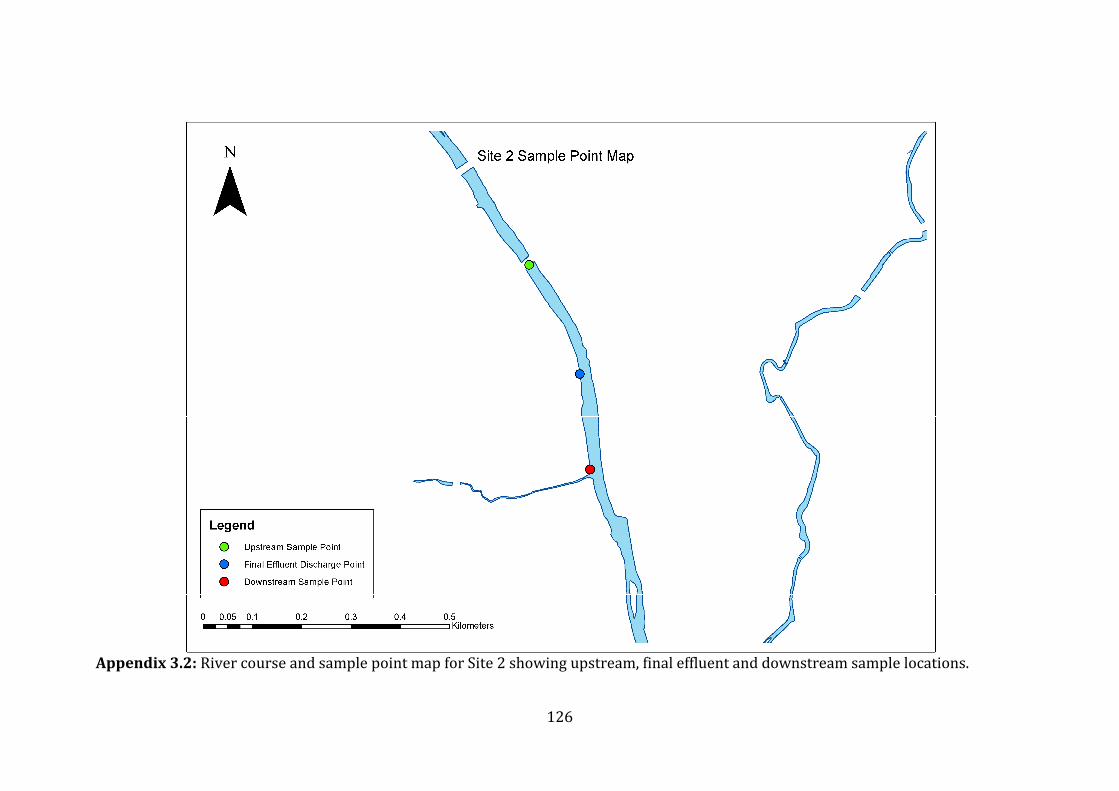
126
Appendix 3.2: River course and sample point map for Site 2 showing upstream, final effluent and downstream sample locations.

127
Appendix 3.3: River course and sample point map for Site 3 showing upstream, final effluent and downstream sample locations.

128
Appendix 3.4: River course and sample point map for Site 4 showing upstream, final effluent and downstream sample locations.

129
Appendix 3.5: River course and sample point diagram for site 5 showing upstream, final effluent and downstream sample locations
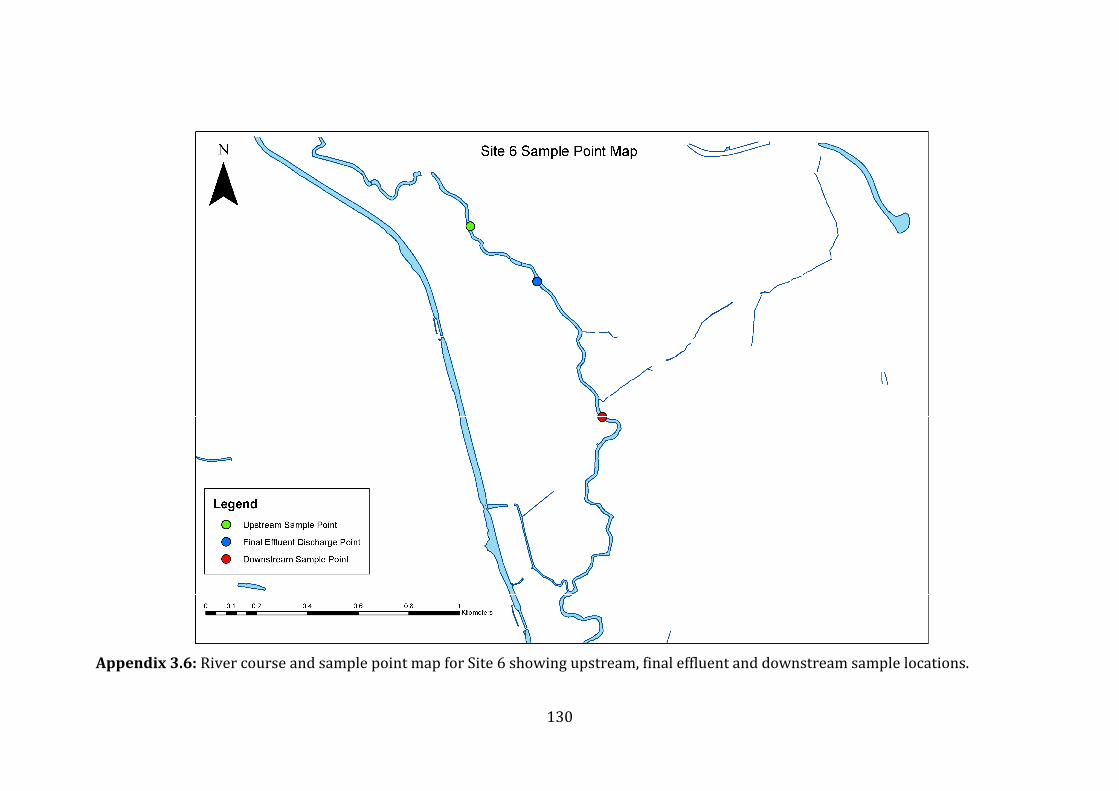
130
Appendix 3.6: River course and sample point map for Site 6 showing upstream, final effluent and downstream sample locations.
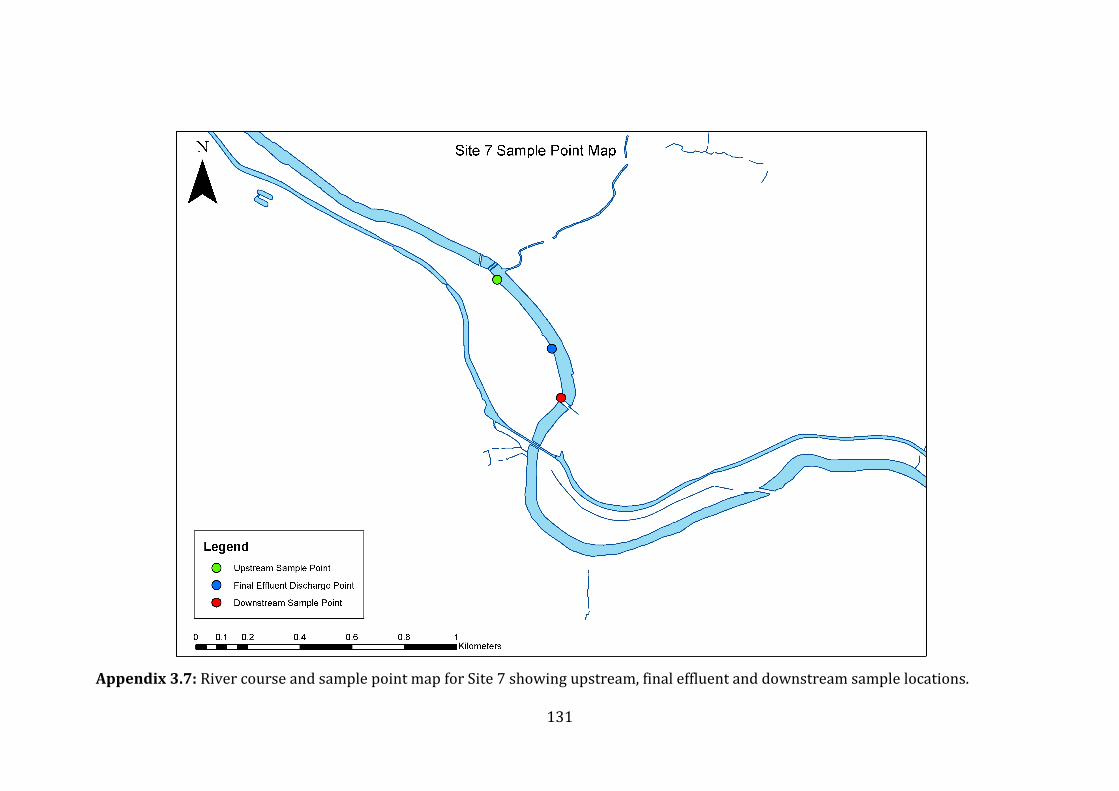
131
Appendix 3.7: River course and sample point map for Site 7 showing upstream, final effluent and downstream sample locations.

132
Appendix 4: Equipment list.
Equipment Source of equipment
PPE: Severn Trent Water
Challenger 2 life jacket
Eye protection
Hard Hat
High Visibility Jacket
Latex examination gloves
Severn Trent “Blues” work trousers
Severn Trent Soft-Shell jacket
Steel Toe-cap work boots
Yellow road line marking spray paint
Sample Collection: Severn Trent Water
10m stainless steel chain
1L food grade stainless steel sample can
Sample collection pot 70cl
Telescopic sample pole 3 metres
Sample Analysis: NTU Brackenhurst Labs
De-ionised water
HACH (HQ30d) probe
Hanna Combo pH & EC HI98130
pH buffer solutions
Bottles: NLS Laboratory
GEN Bottle (1L Clear PET)
MET Bottle (125ml Polypropylene)
Key: Personal Protective Equipment, PPE;
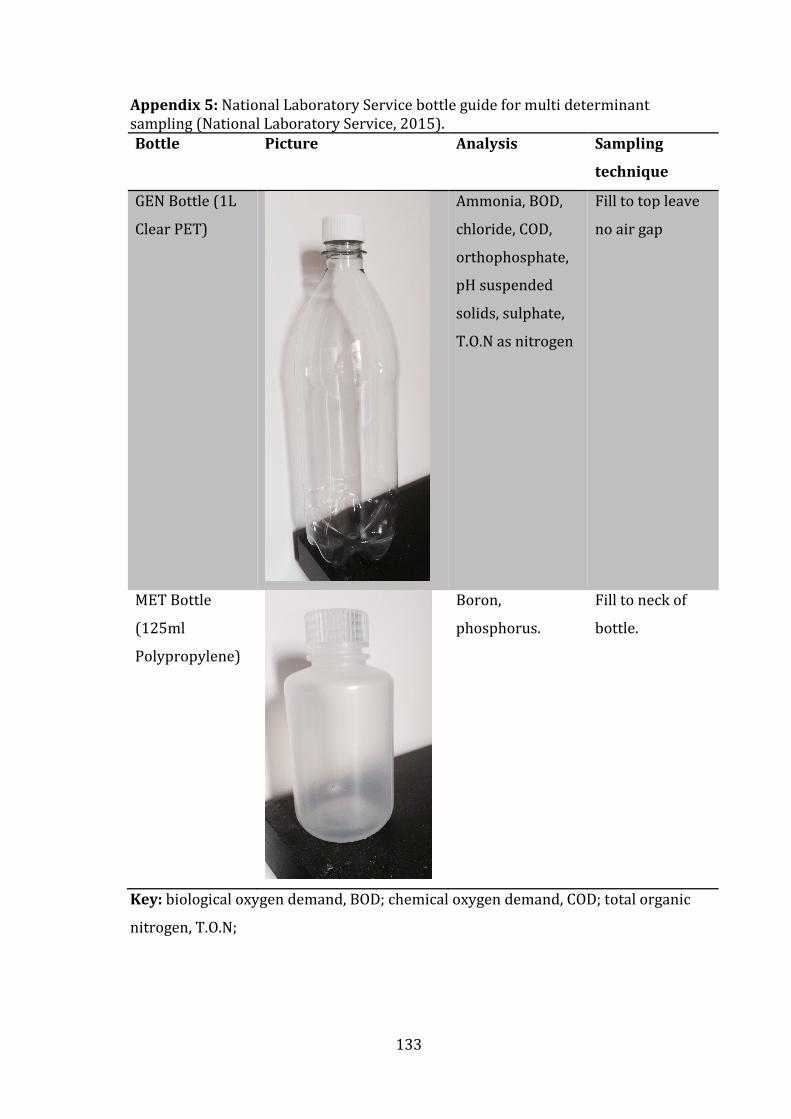
133
Appendix 5: National Laboratory Service bottle guide for multi determinant sampling (National Laboratory Service, 2015).
Bottle Picture Analysis Sampling
technique
GEN Bottle (1L
Clear PET)
Ammonia, BOD,
chloride, COD,
orthophosphate,
pH suspended
solids, sulphate,
T.O.N as nitrogen
Fill to top leave
no air gap
MET Bottle
(125ml
Polypropylene)
Boron,
phosphorus.
Fill to neck of
bottle.
Key: biological oxygen demand, BOD; chemical oxygen demand, COD; total organic
nitrogen, T.O.N;

134
Appendix 6.1: Mean values for upstream samples (n=10)
Key: Degree Celsius, oC; Milligram per litre, mg/l; Millisiemens, mS;
In situ Results - Upstream Laboratory Results - Upstream
DO
(mg/l)
Conductivity
(mS)
pH – on site
(pH Units)
Temperature
(oC)
Ammonia
(NH3) (mg/l)
BOD
(mg/l)
Boron
(B) (mg/l)
COD
(mg/l)
Site 1 10.160
1.054
7.856
8.650
0.253
1.972
0.100
31.500
Site 2 11.116
0.260
8.012
8.280
0.190
1.104
0.126
20.400
Site 3 11.371
0.463
8.225
7.570
0.190
1.180
0.100
16.500
Site 4 10.406
0.358
7.949
8.830
0.190
1.177
0.100
23.200
Site 5 11.143
0.512
8.215
8.050
0.190
1.405
0.100
19.600
Site 6 9.846
0.869
7.905
8.860
0.229
1.710
0.100
29.200
Site 7 11.300
0.419
8.256
7.810
0.190
1.103
0.100
15.000

135
Appendix 6.2: Mean values for upstream samples (n=10)
Key: Milligram per litre, mg/l;
Laboratory Results - Upstream
Chloride
(Cl-) (mg/l)
Nitrate
(NO3-) (mg/l)
Nitrite
(NO2-) (mg/l)
Ortho-P
(PO43-) (mg/l)
pH – Lab
(pH Units)
Phosphorus
(P) (mg/l)
Sulphate
(SO42-) (mg/l)
Site 1 105.080
5.811
0.077
0.306
7.827
0.373
123.360
Site 2 14.240
1.673
0.006
0.080
7.895
0.072
21.340
Site 3 26.320
3.225
0.016
0.085
8.074
0.101
35.210
Site 4 34.140
1.592
0.006
0.080
7.808
0.073
19.520
Site 5 27.160
3.489
0.019
0.088
8.068
0.121
37.120
Site 6 71.540
9.344
0.083
0.262
7.791
0.330
100.450
Site 7 20.300
2.761
0.008
0.080
8.123
0.071
27.400

136
Appendix 6.3: Mean values for final effluent samples (n=10)
In situ Results – Final Effluent Laboratory Results – Final Effluent
DO
(mg/l)
Conductivity
(mS)
pH – on site
(pH Units)
Temperature
(oC)
Ammonia
(NH3) (mg/l)
BOD
(mg/l)
Boron
(B) (mg/l)
COD
(mg/l)
Site 1 5.342
0.982
7.669
11.850
0.290
3.779
0.114
60.400
Site 2 7.941
0.524
7.653
9.600
0.865
5.984
0.101
38.700
Site 3 8.534
0.627
7.513
11.380
0.924
2.425
0.103
27.100
Site 4 9.039
0.641
7.180
11.600
0.715
1.084
0.100
14.800
Site 5 5.476
1.000
7.225
13.400
2.859
2.133
0.116
23.300
Site 6 9.640
0.793
7.295
11.210
0.190
1.129
0.120
20.500
Site 7 5.639
0.580
7.399
11.510
2.100
7.387
0.100
41.500
Key: Degree Celsius, oC; Milligram per litre, mg/l; Millisiemens, mS;

137
Appendix 6.4: Mean values for final effluent samples (n=10)
Key: Milligram per litre, mg/l;
Laboratory Results – Final Effluent
Chloride
(Cl-) (mg/l)
Nitrate
(NO3-) (mg/l)
Nitrite
(NO2-) (mg/l)
Ortho-P
(PO43-) (mg/l)
pH – Lab
(pH Units)
Phosphorus
(P) (mg/l)
Sulphate
(SO42-) (mg/l)
Site 1 113.680
11.905
0.066
0.983
7.659
1.207
98.250
Site 2 41.860
12.281
0.236
2.099
7.522
2.302
37.780
Site 3 75.120
14.123
0.384
1.208
7.274
1.308
55.480
Site 4 63.220
14.785
0.182
0.363
7.176
0.363
47.760
Site 5 81.080
11.347
0.065
0.156
7.175
0.293
136.000
Site 6 84.440
15.313
0.019
0.750
7.221
0.788
87.380
Site 7 58.450
8.220
0.376
1.404
7.288
1.853
49.050

138
Appendix 6.5: Mean values for downstream samples (n=10)
Key: Degree Celsius, oC; Milligram per litre, mg/l; Millisiemens, mS;
In Situ Results - Downstream Laboratory Results - Downstream
DO
(mg/l)
Conductivity
(mS)
pH – on site
(pH Units)
Temperature
(oC)
Ammonia
(NH3) (mg/l)
BOD
(mg/l)
Boron
(B) (mg/l)
COD
(mg/l)
Site 1 10.259
1.016
7.905
8.330
0.267
2.767
0.100
37.600
Site 2 11.131
0.257
8.180
8.080
0.190
1.098
0.100
18.100
Site 3 11.155
0.468
8.130
8.070
0.190
1.193
0.114
17.800
Site 4 10.031
0.434
7.738
8.880
0.226
1.183
0.100
19.900
Site 5 11.600
0.488
8.199
7.650
0.209
1.359
0.100
19.400
Site 6 10.255
0.824
7.863
8.130
0.225
1.638
0.100
25.800
Site 7 10.805
0.447
8.154
8.340
0.254
1.571
0.100
18.000

139
Appendix 6.6: Mean values for downstream samples (n=10)
Key: Milligram per litre, mg/l
Laboratory Results - Downstream
Chloride
(Cl-) (mg/l)
Nitrate
(NO3-) (mg/l)
Nitrite
(NO2-) (mg/l)
Ortho-P
(PO43-) (mg/l)
pH – Lab
(pH Units)
Phosphorus
(P) (mg/l)
Sulphate
(SO42-) (mg/l)
Site 1 104.140
6.376
0.071
0.397
7.816
0.504
126.040
Site 2 15.140
1.769
0.007
0.080
7.859
0.070
20.690
Site 3 26.780
3.366
0.019
0.090
8.071
0.113
35.410
Site 4 39.970
3.475
0.026
0.083
7.640
0.091
21.590
Site 5 27.380
3.494
0.020
0.092
8.075
0.133
37.100
Site 6 72.780
9.838
0.077
0.304
7.780
0.352
99.110
Site 7 23.350
3.099
0.031
0.131
8.040
0.191
28.750

140
Appendix 7: Minimum-reporting values (MRV) for determinants analysed by National Laboratory Service (National Laboratory Service, 2015).
Key: Milligrams per litre, mg/l; Millisiemens per centimetre, mS/cm
Determinant Units Minimum reporting
value (MRV)
Ammonia mg/l 0.19
Biological Oxygen Demand
(BOD) 5 Day AUT
mg/l 1
Boron mg/l 0.1
Chemical Oxygen Demand mg/l 10
Chloride mg/l 0.9
Conductivity mS/cm
0.00
DO mg/l 0.20
Nitrate mg/l 0.006
Nitrite mg/l Calculated as TON (MRV
0.29mg/l) less Nitrite.
Orthophosphate (As
reactive P)
mg/l 0.08
pH pH Units 0.05
Phosphorus mg/l 0.07
Sulphate at SO4 mg/l 1

141
Appendix 8: Mean final effluent flow levels across all sites.
1.000
10.000
100.000
1000.000
10000.000
Site 1 Site 2 Site 3 Site 4 Site 5 Site 6 Site 7
Flo
w (
l/s
)
Sample Weeks
Week 1
Week 2
Week 3
Week 4
Week 5
Week 6
Week 7
Week 8
Week 9
Week 10