the effects of microcrustaceans on succession and diversity of an algal microcosm community
TRANSCRIPT

Oecologia (Berlin) (1986) 68:308-314 Oecologia �9 Springer-Verlag 1986
The effects of microcrustaceans on succession and diversity of an algal microcosm community
Rebecca L. Peer Biology Department, University of Oregon, Eugene, OR 97403, USA
Summary. The effects of herbivorous microcrustaceans on algal succession and diversity were studied in replicated 200 ml freshwater microcosms. Three different experiments were conducted. Two experiments used laboratory micro- cosms in growth chambers. Rotenone was used to kill the microcrustaceans in one-half of the cultures. Diversity (/4') and succession were monitored over a 60 day period. The third experiment used similar microcosms, but they were kept out of doors. In this experiment, microcrustaceans be- came extinct in some cultures because of a mechanical dis- turbance. In all three experiments, succession from a com- munity dominated by green algae to one dominated by blue-green algae was significantly slower when microcrusta- ceans were present. Diversity was higher in grazed cultures at some times during succession, but not at all times. The dynamics of diversity during succession appear to be gov- erned principally by the change in the relative frequency of green and blue-green algae, rather than by the dynamics of individual species. Nutrient recycling by the microcrusta- ceans may favor green algae, partially mitigating mortality on green algae due to grazing pressure.
Predation is accorded an important role in determining community diversity by both theorists and field ecologists. Generally, differential mortality of a dominant prey species, or nonselective predation on all prey species is considered to be the causal mechanism increasing diversity (Slobodkin 1961; Paine 1966; Harper 1969; CasweU 1978). However, in many communities, the role of predators is more compli- cated. The immediate effect of predation is the death of individuals, but prey diversity may also be affected indirect- ly by changes in the physical environment due to the activi- ties of the predators.
Most field tests of the predation hypothesis have fo- cused on the effects of mortality on the prey community. The results have been mixed. Floristic diversity may be maintained by grazing (Harper 1977, Chapter 14) or by fun- gal predators (McCauley and Cook 1980). Starfish, fish, gastropods, sea urchins and other marine predators may increase the diversity of sessile inter- and subtidal communi- ties (Paine 1966; Dayton 1971 ; Sousa 1979), but may either reduce or increase the diversity of algal patches (Paine and Vadas 1969; Day 1977; Lubchenco 1978; Robles 1982).
Present address: Division of Environmental Studies, University of California, Davis, CA 95616, USA
Predaceous fish reduce insect diversity (Campbell and Denno 1978) and mosquitos reduce the number of proto- zoan species in pitcher plant leaves (Addicott 1974).
The secondary effects of predators have been noted in a few systems. Digging by predatory rays in soft-bottom communities results in a rapid succession of species on the disturbed sediments (van Blaricom 1982). The initial impact is the removal of dominant competitors but this sets off a series of events which van Blaricom suggests are more related to temporal changes in the quality of resources than to competition. The secondary effects of grazers in terrestri- al plant communities include local stimulation of plant growth around dung and urine patches and physical distur- bances by hoof marks or burrowing and digging (Harper 1977, pp. 449-456).
In freshwater algae communities, the importance of mi- crocrustaceans in recycling nitrogen and phosphorus is widely recognized (Barlows and Bishop 1965; Lehman 1980; Axler et al. 1981). More importantly, they excrete these nutrients in a form immediately usable by algae (Leh- man and Scavia 1982). While some theorists and modelers of algae succession have recognized the multiple roles of microcrustacean grazers (O'Brien 1974; DePinto etal. 1976; Nillsen 1978), the effects of selective grazing and gut passage have received more attention than has nutrient re- generation in field and laboratory studies of phytoplankton diversity (Porter 1977; McCauley and Briand 1978; Lynch and Shapiro 1981; Crumpton and Wetzel 1982; Lampert and Taylor 1985). However, Tilman (1982) has hypothe- sized a pos ter ior i that increased nitrogen recycling by zoop- lankton was responsible for a decrease in blue-green algae in Lake Trummen.
Predator exclusion studies have been used to gather evi- dence to support the idea that predation is a major factor in determining community diversity. Quinn and Dunham (1983) have argued that because of the possibility of several interacting causal mechanisms influencing prey species dis- tributions, predator exclusion studies are chiefly a means of directly measuring the effects of predators on prey spe- cies. Some of these other causal mechanisms can be elimi- nated or at least minimized by using microcosms, but deter- mining the exact mechanism by which grazers influence prey species is still problematic. Unfortunately, in aquatic systems the multiple roles that predators may play are oc- curring nearly simultaneously and out of the range of vision of the human observer. It is impossible to isolate the two variables of interest here - grazing mortality and excretion
309
of nutrients. By excluding the microcrustacean grazers from some aquatic communities and examining the subsequent changes in algal composition and diversity, it is possible to use knowledge of microcrustacean feeding preferences to draw some inferences about the dual role of microcrusta- cean herbivores in algal communities.
Three experiments on the effects of a multispecies com- munity of benthic microcrustaceans on diversity and succes- sion of algae are described here. Two involve laboratory experiments using replicated algal microcosms in which mi- crocrustaceans have been excluded from half of the cultures. The third study was conducted under natural conditions and uses microcosms in some of which microcrustaceans had become extinct after mechanical disturbances.
The specific hypotheses tested are: (1) that green algae will be numerically dominant in
cultures containing microcrustaceans, blue-green algae in those that do not (after Tilman 1982);
(2) that diversity will be higher in grazed than in un- grazed cultures as a consequence of both feeding activity and nutrient recycling.
Each of these hypotheses was tested several times during a 60 day successional phase of algal community develop- ment.
Experimental design and methods
Laboratory experiments
Two series of algal cultures were set up in the same manner but at different times and under slightly different condi- tions. Each system consisted of twelve 200 ml cultures kept in growth chambers for a period of 60 days. The light source was a 9 inch circular fluorescent lamp 45 cm above the algal cultures. The photoperiod was kept at 16:8 L :D for the duration of the experiment. Room temperatures fluctuated between 22 and 24 ~ C. The growth chamber tem- peratures fluctuated between 22 and 28 degrees. Cultures were initiated by adding 10 ml of inoculum to 200 ml of distilled water. The inoculum came from an outdoor con- crete tank that contains standing water' year round (average depth less than 30 cm). The inoculum community was 63% green algae, 12% diatoms and 25% blue-greens (percent- ages are by numbers of cells, coenobia or filaments). The inoculum was well-stirred to assure that each culture re- ceived approximately the same proportion of algae. Two grains of rice were the nutrient base of each culture. An organic nutrient source was used instead of one of the more commonly used inorganic media in order to generate a nat- ural successional pattern. Conversion of the rice grains into nutrients resembles the breakdown of organic detritus that occurs in natural systems. This process could affect the successional pattern of the algae.
The cultures were examined daily until microcrustaceans began to appear. Cultures were then randomly assigned to either the grazer or ungrazed treatment. In the latter treatment, microcrustaceans were eliminated by adding 5% rotenone powder. Rotenone is a plant-produced insecticide that is toxic to fish and many crustaceans but not to algae (Smith 1940). It breaks down in a few days when exposed to oxygen and light. Many bacteria are capable of trans- forming it to various metabolites (Sariaslani and Rosuzza 1983). The microcrustaceans are so sensitive to rotenone that the entire population of grazers in a culture could be
killed by dipping the moistened tip of a capillary tube in the rotenone and stirring the culture with it. A second dose of rotenone was added a week later when more eggs had hatched and grazers were again found in some of the jars.
One set of twelve cultures was started in mid-April (Se- ries 1), a second set in mid-May (Series 2). A cool-white lamp was used in Series 1, but a warm-white in Series 2.
Protozoan, metazoan and algal species were identified in each culture after 14 days. Algal diversity of each culture was determined from 2-ml samples at 40 and 60 days in Series 1, and at 25, 40 and 60 days in Series 2. Samples were taken by randomly scraping the bottom and sides of the flask without shaking. Approximately 1,000 individuals (cells, coenobia, filaments) were counted from each sample at 160 x magnification after the samples had been sonicated for 5 s to break up clumps of filamentous algae. Whenever possible, identification was to species according to the tax- onomic classification system used in Edmondson (1959) and Prescott (1954). In most cases, genera could be determined except for some diatoms, which could not be identified to this level. However, as diatoms were much less abundant than other algae and in most cultures either only one species occurred or was very much more abundant, the results were not significantly affected by treating diatoms as one species.
Initially, the numbers of microcrustaceans were esti- mated by inspecting each culture every two days and count- ing the number of animals visible without magnification. When densities greater than 20 per flask were reached it was no longer possible to estimate densities in this manner. At this point, grazer densities were estimated every 14 days by stirring the flask and withdrawing ten 2 ml samples. Individual animals could be counted in the pipette. The samples were saved and returned to the flask after all had been counted. The ungrazed samples were also stirred, ten 2 ml samples removed and then returned as a control for effects from handling.
Calculation of algal diversity and statistical methods
Community diversity was measured by an estimation of the Shannon-Wiener index,
S
(1) H ' = - ~ P l ln(pl) where pi=relative frequency of species i in a sample, and S = the number of species in the sample. This index is sensitive to changes in the number of species and in equitability of species. While it is often desirable to calculate these separately, in the sampling scheme used in this study the two are confounded. Since a fixed number of individuals is counted, as species become increasingly rare the probability of including them in the sample decreases. Thus a community may seem to have few species with high equitability when actually it may have many rare species and low equitability. Algal communities are characterized by a few dominant species and many rare species (Sager and Hasler 1969); thus, as sample size in- creases and more species are discovered, H" changes very little. This is a consequence of the offsetting effects of in- creasing the number of species while decreasing the equita- bility.
Diversity in these communities was expected to be pri- marily determined by processes occurring at two levels: (1) the successional change from a community dominated by green algae (Division Chlorophyta to one dominated by blue-green algae (Division Cyanophyta), and (2) changes
310
in the numbers of or the relative abundances of species because of succession and grazing. The Shannon-Wiener index can be par t i t ioned hierarchically (Pielou 1977), so that the relative contr ibut ions of different taxonomic levels to overall diversity can be determined. Part i t ioning diversity gives
(2) H ' = H ' ( D ) + H ' ( S ) .
H ' (D), the division diversity, is given by
- ~ qs In (qs),
where qs = propor t ion of all individuals in division j. H' (S) is the weighted mean of the species diversity in each divi- sion:
sj - Z qs ZPis ln(po) ,
where S s = n u m b e r of species in division j and P~s = relative frequency of species i in division j . The sum of division diversity and the average species diversity gives the same value as calculated in (1).
By par t i t ioning diversity hierarchically, it can be deter- mined how much overall diversity is a function of the equi- tabil i ty of the taxonomic divisions as opposed to the equita- bility of species. Since there are three times as many species of green algae as blue-green in these cultures, the contr ibu- t ion of these two taxonomic divisions to H ' is asymmetric. Thus when green algae are numerically dominant , H ' ( D ) will be low but H ' (S) may be relatively high simply because more species are represented in the sample. When neither division dominates , H'(D) will be high but H'(S) may be low. It is easy to see that two communit ies could have similar H ' values, but very dissimilar H'(D) and H'(S) values. This hierarchical analysis imparts much more infor- mat ion about the communit ies being measured than do sim- ple species counts or H ' values.
Differences in diversity between treatments were ana- lyzed by the nonparametr ic Wilcoxon test. Frequencies of blue-green algae were analyzed by t-tests after arcsine trans- format ion of the data. In the following analyses, the average number of species per sample is given for descriptive pur- poses but not analyzed.
Results
Description of algal communities
The major i ty of the species in these communit ies are in the division Chlorophyta (Table 1). The pr imary pat tern of algal succession in all cultures was a change from a com- muni ty dominated by green algae and diatoms to one domi- nated by blue-green algae (Tables 2 and 3), a pat tern typical of the seasonal succession found in many temperate lakes. This pat tern was apparent in both grazed and ungrazed systems, but the rate at which the blue-greens achieved dominance was much faster in the ungrazed communities. Scenedesmus quadricauda was the most abundan t species in the early successional assemblage; a Phormidium species was the most abundant in the late successional group.
In general, the d ia tom and green algae populat ions con- sisted predominant ly of small individuals. F o r example, most Scenedesmus spp. individuals were approximate ly 5 gm long (measured along longest dimension). Based on
Table 1. Common algae in the communities. Genera or species names are given where known
Chlorophyta
Scenedesmaceae
Hydrodictyaceae Desmidiaceae Oocystaceae
Oedogoniaceae
Seenedesmus qua&ieauda, Seenedesmus sp.
Pediastrum boryanum Cosmarium sp. Ankistrodesmus sp., Chlorella sp.,
and very small coccoid alga, probably Palmelloeoeeus
Oedogonium sp.
Chrysophyta
Diatoms, probably Fragilariaceae
Cyanophyta
Oscillatoriaceae Phormidium sp. Nostocaceae Rivulariaceae Gloeotrichia sp.
Table 2. Average frequencies of major algal families represented in communities from Series t at 40 and 60 days. Frequencies do not always sum to 100% because rare species are not included in this list. (Rare species are those which occurred with less than 1% frequency and were represented in only a few cultures or in only one time period)
Microcrustaceans Microcrustaceans present removed
Age (days) : 40 60 40 60
Scenedesmaceae 50% 29% 17% 8% Hydrodictyaceae 6 4 2 1 Oocystaceae 9 8 5 6 Diatoms 15 11 16 9 Oscillatoriaceae 15 43 49 68 Nostocaceae 3 3 7 5 Rivulariaceae 1 2 3 2
Table 3. Average frequencies of major algal families represented in communities from Series 2 at 25, 40 and 60 days. Frequencies less than 1% but greater than 0 are indicated by < 1
Microcrustaceans Microcrustaceans present removed
Age (days): 25 40 60 25 40 60
Scenedesmaceae 72% 48% 21% 43% 17% 10% Hydrodictyaceae 6 3 1 4 1 1 Oocystaceae 13 19 20 3 2 1 Diatoms 1 2 2 t 2 12 4 Oscillatoriaceae 6 28 50 28 47 64 Nostocaceae < 1 < 1 5 8 17 16 Rivulariaceae < 1 < 1 1 2 3 5
size constraints alone, all species of green algae except for Pediastrum boryanum were edible. The fi lamentous blue- green algae varied considerably in length, but most were probably too large to be eaten. Al though some segments of Phormidium were small enough to be eaten (prior to
bJ -.I 13. :E
(I)
(/3 OC b.l N
0C
I J_ O
OC bJ nn
Z
40
50
20
I0 FI 15 25
AGE ( D A Y S )
4 0
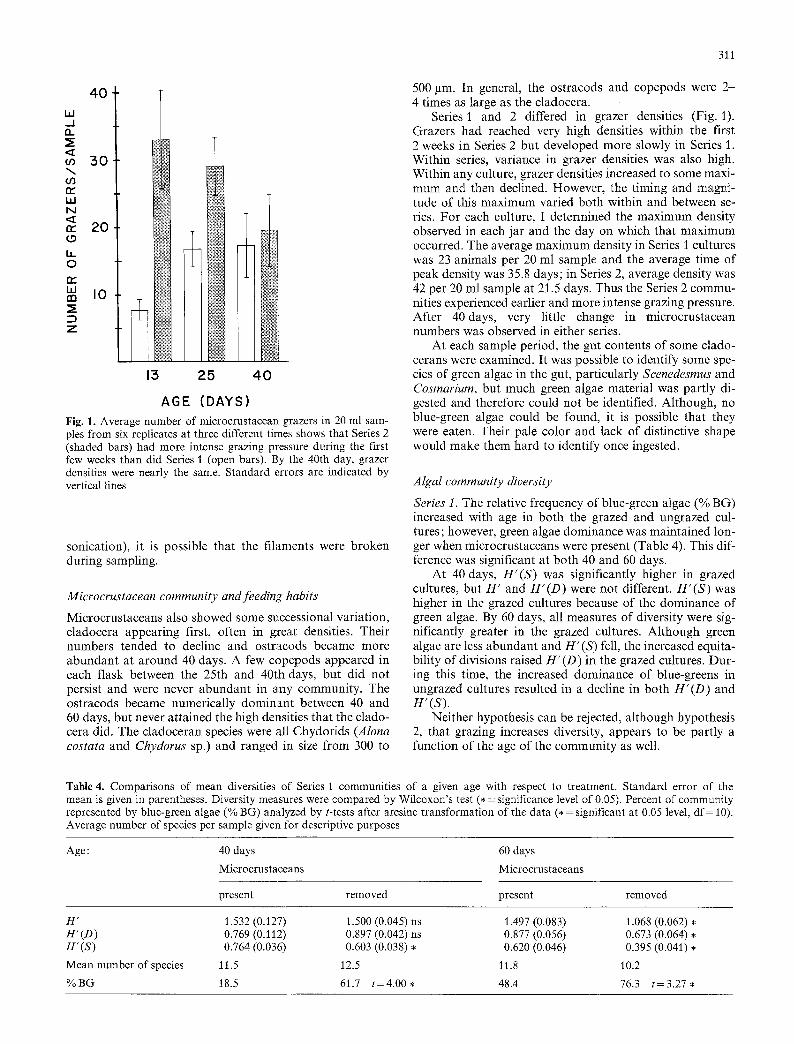
Fig. 1. Average number of microcrustacean grazers in 20 ml sam- ples from six replicates at three different times shows that Series 2 (shaded bars) had more intense grazing pressure during the first few weeks than did Series 1 (open bars). 13y the 40th day, grazer densities were nearly the same. Standard errors are indicated by vertical lines
sonication), it is possible that the filaments were broken during sampling.
Microcrustacean community and feeding habits
Microcrustaceans also showed some successional variation, cladocera appearing first, often in great densities. Their numbers tended to decline and ostracods became more abundant at around 40 days. A few copepods appeared in each flask between the 25th and 40th days, but did not persist and were never abundant in any community. The ostracods became numerically dominant between 40 and 60 days, but never attained the high densities that the clado- cera did. The cladoceran species were all Chydorids (Alona costata and Chydorus sp.) and ranged in size from 300 to
311
500 ~tm. In general, the ostracods and copepods were 2- 4 times as large as the cladocera.
Series 1 and 2 differed in grazer densities (Fig. 1). Grazers had reached very high densities within the first 2 weeks in Series 2 but developed more slowly in Series 1. Within series, variance in grazer densities was also high. Within any culture, grazer densities increased to some maxi- mum and then declined. However, the timing and magni- tude of this maximum varied both within and between se- ries. For each culture, I determined the maximum density observed in each jar and the day on which that maximum occurred. The average maximum density in Series I cultures was 23 animals per 20 ml sample and the average time of peak density was 35.8 days; in Series 2, average density was 42 per 20 ml sample at 21.5 days. Thus the Series 2 commu- nities experienced earlier and more intense grazing pressure. After 40days, very little change in microcrustacean numbers was observed in either series.
At each sample period, the gut contents of some clado- cerans were examined. It was possible to identify some spe- cies of green algae in the gut, particularly Scenedesmus and Cosmarium, but much green algae material was partly di- gested and therefore could not be identified. Although, no blue-green algae could be found, it is possible that they were eaten. Their pale color and lack of distinctive shape would make them hard to identify once ingested.
Algal community diversity
Series 1. The relative frequency of blue-green algae (% BG) increased with age in both the grazed and ungrazed cul- tures; however, green algae dominance was maintained lon- ger when microcrustaceans were present (Table 4). This dif- ference was significant at both 40 and 60 days.
At 40 days, H'(S) was significantly higher in grazed cultures, but H ' and H'(D) were not different. H'(S) was higher in the grazed cultures because of the dominance of green algae. By 60 days, all measures of diversity were sig- nificantly greater in the grazed cultures. Although green algae are less abundant and H ' (S) fell, the increased equita- bility of divisions raised H ' (D) in the grazed cultures. Dur- ing this time, the increased dominance of blue-greens in ungrazed cultures resulted in a decline in both H'(D) and H'(s).
Neither hypothesis can be rejected, although hypothesis 2, that grazing increases diversity, appears to be partly a function of the age of the community as well.
Table 4. Comparisons of mean diversities of Series t communities of a given age with respect to treatment. Standard error of the mean is given in parentheses. Diversity measures were compared by Wilcoxon's test (* = significance level of 0.05). Percent of community represented by blue-green algae (% BG) analyzed by t-tests after arcsine transformation of the data (, = significant at 0.05 level, dr= 10). Average number of species per sample given for descriptive purposes
Age : 40 days 60 days
Microcrustaceans Microcrustaceans
present removed present removed
H ' 1.532 (0.127) 1.500 (0.045) ns 1.497 (0.083) 1.068 (0.062) �9 H'(D) 0.769 (0.112) 0.897 (0.042) ns 0.877 (0.056) 0.673 (0.064) �9 H'(S) 0.764 (0.036) 0.603 (0.038) �9 0.620 (0.046) 0.395 (0.041) �9
Mean number of species 11.5 12.5 11.8 10.2
%BG 18.5 61.7 t=4 .00 , 48.4 76.3 t=3 .27 ,

312
Table 5. Diversity and percent blue-green means for Series 2. Ex- planation of symbols and test methods same as for Table 4
Microcrustaceans
present removed
Age: 25 days
H' 0.981 (0.146) 1.510 (0.085) �9 H'(D) 0.295 (0.052) 0.912 (0.048) �9 H'(S) 0.687 (0.105) 0.598 (0.049) ns
Mean number 8.7 11.8 of species
%BG 5.7 36.5 t=5 .29 ,
Age: 40 days
H' 1.306 (0.033) 1.462 (0.028) * H'(D) 0.678 (0.034) 0.799 (0.054) �9 H'(S) 0.629 (0.046) 0.663 (0.050) ns
Mean number 10.2 12.3 of species
%BG 27.8 67.4 t= 10.69 �9
Age: 60 days
H' 1.259 (0.061) 1.098 (0.088) ns H'(D) 0.752 (0.014) 0.464 (0.099) * H'(S) 0.507 (0.057) 0.633 (0.033) ns
Mean number 9.0 9.0 of species
%BG 61.3 86.1 t=3 .18 ,
Series 2. Again, this series showed the expected pattern of prolonged green algae dominance when microcrustaceans were present (Table 5), and the difference was significant even at 25 days. However, the pattern for diversities was slightly different from that seen in Series 1. The ungrazed cultures were more diverse than the grazed cultures at 25 days, largely because o f the more even distribution be- tween divisions (H'(D)). As succession progressed, the un- grazed cultures were increasingly blue-green dominated and diversity declined relative to the grazed cultures.
Since the growth environment of this series differed somewhat from that in Series 1, the two can not be statisti- cally compared. With that qualifier in mind, it is worth noting that the grazed cultures in Series 2 were not as di- verse as those in Series I although the ungrazed cultures had very similar H ' values. This may reflect the differences in the intensity of grazing pressure in the Series 2 cultures. However, the ungrazed cultures in the two Series also be- haved somewhat differently if H ' (D) and H ' (S) are com- pared, indicating that at least some of the differences in the two series are the result of varying environments.
Again, hypothesis 1 cannot be rejected. Hypothesis 2, however, is rejected at 25 days, but not for older communi- ties. These results, in conjunction with the previous experi- ment, suggest that the effects of grazing on diversity depend on the successional state of the community and conse- quently vary over time.
Confirmation of laboratory results in an outdoor system
In June ~981 and again in June of 1982, replicated 400 ml microcosms were set up using the same methods described
for the laboratory systems except that these were kept out of doors and no rotenone was added. The algae species were the same as those found in the laboratory cultures, although there were a few more rare species. The cladoceran species were also the same, but copepods and ostracods were quite rare during the first three months of the study. These cultures were open to the air and hence to windborne colonizers, but a screen covering prevented entry of large debris. Between July and September, the cultures were sub- jected to periodic mechanical disturbances. The disturbance method was to shake each jar to thoroughly mix the con- tents, and then equally divide the culture. One-half was filtered to remove all algae and associated fauna and the filtered liquid was returned to the culture remaining in the original container. During the course of this study, micro- crustaceans became extinct in 9 out of 28 cultures. Based on laboratory results, I predicted that the relative frequency of blue-green algae should be greater in the cultures without microcrustaceans.
The mean relative frequency of blue-green algae in 3- month-old cultures without microcrustaceans was 34.1%(s.e.=6.4, n=9) , while in the others it was 6.0% (s.c. = 1.2, n = 19). After arcsine transformation of the data, these two percentages were significantly different (t = 5.98, P < 0.001).
As predicted, extinction of microcrustaceans in these cultures is correlated with increased relative frequency of blue-green algae. Although these cultures were older than the laboratory cultures at the time the above comparison was made, the percentage of blue-green algae was much lower than that found in the laboratory studies. Since the growth conditions were much more similar to those found in natural communities, these results suggest that micro- crustaceans may have less impact on the successional pro- cess in natural communities. Diversity (H' ) did not differ significantly in grazed and ungrazed cultures, but H'(D) was higher in ungrazed cultures while H'(S) was higher in grazed (Peer 1983).
Discussion
Predator exclusion is commonly used to establish the effects of grazing on the prey community. Differences in communi- ties with and without predators are usually attributed to the mortality of prey species that result from predation. In some cases this is an insufficient explanation of predator effects. In the algal microcosms described here, the exclu- sion of grazers accelerated the normal decline in dominance of green algae, and this in turn affected diversity. There are several possible explanations for these results.
Generally, when predators are excluded we expect to see an increase in edible species at the expense of inedible ones. I f grazing alone is to account for the maintainance of the green algae, then we must believe that microcrusta- ceans prefer to eat blue-green algae. This premise is not supported either by the literature or by the observations of gut contents made in this study. Chydorids are predomi- nantly bottom-feeders and gather algae, bacteria and detri- tus by scraping (Fryer 1969). They are regarded as general- ists but are probably somewhat size-selective (Neill 1975) in that they cannot mechanically handle particles beyond a certain size. Although many species of blue-greens are noxious and avoided by microcrustaceans, more probably algae are rejected because they are too large to be handled
313
or because they are sheathed or enclosed in a gelatinous matrix (McNaught et al. 1980). The ostracods can handle larger particles than the Chydorids but are also likely to prefer green algae. In one study, ostracods chose some blue- greens over others but generally preferred green algae such as Ankistrodesmus or Scenedesmus (Mills and Wyatt 1974).
Thus, green algae are more likely to be preferred food items based on preference studies and size constraints. This presents a paradox, however, in that we must explain why a preferred food item is maintained by grazing. There are two possible explanations for this phenomenon. One is that all algae are grazed but that some green algae survive gut passage; some species with gelatinous matrices are known to do this (Porter 1975) but species of this type are rare in these communities. Some of the species with spines (Scen- edesmus quadricauda) or tough cell walls (Cosmarium sp.) might be more resistant to grazing than species such as Ankistrodesmus. However, it seems unlikely that all the green algae are more resistant to grazing than the blue- greens, particularly since two of the b!tue-green species are sheathed.
The most likely possibility is that the grazers are regen- erating nutrients necessary for the persistence of green al- gae. The growth rates of green algae and blue-green algae are optimal at different N: P ratios (Rhee and Gotham 1980), and this has been suggested as an important determi- nant of dominance during succession (Tilman 1982; Tilman et al. 1982). Obviously microcrustaceans are not the only source of nutrients given the bacterial and protozoan com- munity in both systems. But, if the microcrustaceans change the ratio of nutrients in a way favorable to green algae, nutrient regeneration may slow the rate of succession by prolonging the period of favorable growth for green algae.
Nutrient recycling and grazing are not the only activities of animals which affect plants. Physical disturbance of the substrate by animals could be potentially important for the survival of many plant species. In the cultures used in this study, the sides and bottoms of the culture vessel were kept clean by the activity of the grazers, while mats of algae adhered to the glass in the ungrazed cultures. The mechani- cal mixing and scraping by grazers could be important in redistributing nutrients and could affect the diversity and composition of the algae community.
These explanations are not mutually exclusive and iden- tifying one as the operative mechanism in a particular sys- tem may not be possible. The hierarchical H ' analysis scheme used in this study strongly suggests that the dynam- ics of succession and of diversity are driven primarily by gross changes at the division level (gree, n algae to blue-green algae) rather than by individual species dynamics. This sug- gests that attempts to find causal mechanisms should be focused at this level. However, Lehman and Sandgren (1985) argue that species-specific responses to grazing and nutrient limitation are responsible for the dynamics of phy- toplankton. This difference in conclusions is largely due to the differences in scale between the two studies (e.g., Allen and Starr 1982). Their study of a temperate lake used short-term experiments (3-4 days) during a period in the spring when the phytoplankton community was dominated primarily by diatoms. If the microcosm communities used in this study were sampled more frequently over a shorter time period, it might be possible to show species-specific responses to the presence of grazers. Determining the cause of that response, however, is still problematic as green algae
show differential uptake of nutrients and thus will respond differently to nutrient regeneration as well as to grazing pressure.
The design of this study maximized the contribution of nutrients from microcrustacean recycling by using small, closed microcosms. This situation is rarely or only tran- siently found in nature. Comparable natural communities are phytotelmata or puddles, but even these are open to airborne nutrients. In communities which receive significant input of nutrients from other sources, the relative contribu- tion of microcrustaceans is diminished and, therefore, un- likely to be detected. However, autochthonous nutrient in- put may be seasonal in many temperate lakes, and during periods of low nutrient input from other sources, zooplank- ton can contribute significant amounts of nutrients (Leh- man 1980). The euphotic zone of oligotrophic seas may be a nearly closed system, and the main nutrient source is believed to be animal excretion and bacterial reminerali- zation (Goldman etal. 1979; McCarthy and Goldman 1979; Jackson 1980). Very localized recycling by epilithic algae of nutrients regenerated by grazing snails has been found in lakes (Cuker 1983). The subject is just beginning to be studied in terrestrial communities (McNaughton 1983), but the possible secondary effects of grazers has long been recognized (Harper 1977).
The importance of nutrient recycling by animals in a community will depend strongly on physical factors which affect the transport of nutrient in a particular community. The problem of sorting out the pattern imposed by preda- tion on prey species from that imposed by differential use of nutrients is particularly difficult in aquatic communities. It might be easier to deal with in terrestrial communities. The patchiness of dung or urine deposits makes compara- tive studies of sites possible. Furthermore, it is possible to manipulate both nutrient excretion and grazing in some field situations. While there is reason to believe and some evidence for the generality of nutrient recycling as a factor in community structure, the relative importance remains to be determined for most communities.
In summary, the presence of microcrustaceans in fresh- water microcosms resulted in the maintenance of green al- gae for a longer period of time than in microcosms without them. The most likely mechanism is that nutrient recycling by the microcrustaceans produces nutrient ratios that favor green algae temporarily. This in turn affected diversity, largely by maintaining the equitability of green and blue- green algae. Changes at the species level cannot be inter- preted solely as the result of grazing preferences, but are also the result of nutrient recycling by the microcrustaceans.
Acknowledgements. This paper is based on a portion of my doctoral dissertation at the University of Oregon. I would like to thank E. Byron, T. Foin and J. Quinn for their comments and criticisms of this paper. Valuable criticisms of earlier drafts of this paper were made by W. Bradshaw, S. Cook and P. Frank. Laboratory assistance by Chris Van Winkle and Mel Mann was much appre- ciated. R. Castenholz helped with identification of blue-green algae species. Financial support was provided by NIH Grant TM-T-32- 07257 and by a Sigma Xi Grant-in-aid-of-Research.
References
Addicott JF (1974) Predation and prey community structure: an experimental study of the effect of mosquito larvae on the pro- tozoan community of pitcher plants. Ecology 55:475-492
314
Allen TFH, Starr TB (1982) Hierarchy: Perspectives for Ecological Complexity. University of Chicago Press, Chicago, p 310
Axler RP, Redfield GW, Goldman CR (1981) The importance of regenerated nitrogen to phytoplankton productivity in a sub- alpine lake. Ecology 62:345-354
Barlow JP, Bishop JW (1965) Phosphate regeneration by zooplank- ton in Cayuga Lake. Limnol Oceanogr 10 (suppl):R15-R25
Blaricom GR van (1982) Experimental analysis of structural regu- lation in a marine sand community exposed to oceanic swell. Ecol Monogr 52:283-305
Campbell BC, Denno RF (1978) The structure of the aquatic insect communities associated with intertidal pools on a New Jersey salt marsh. Ecol Entomol 3:181-187
Caswell H (1978) Predator-mediated coexistence: a nonequilibrium model. Am Nat 112:122154
Crumpton WG, Wetzel RG (1982) Effects of differential growth and mortality in the seasonal succession of phytoplankton pop- ulation in Lawrence Lake, Michigan. Ecology 63:1729-1739
Cuker BE (1983) Grazing and nutrient interactions in controlling the activity and composition of the epilithic algal community of an arctic lake. Limnol Oceanogr 28:133-141
Day RW (1977) Two contrasting effects of predation on species richness in coral reef habitats. Mar Biol 44 : 1 5
Dayton PK (1971) Competition, disturbance and community orga- nization: the provision and subsequent utilization of space in a rocky intertidal community. Ecol Monogr 41:351-389
DePinto JV, Bierman VJ, Verhoff FH (1976) Seasonal phytoplank- ton succession as a function of species competition for phospho- rous and nitrogen. In: Canale RP (ed) Modeling Biochemical Processes in Aquatic Ecosystems, Ann Arbor Science Publishers Inc., Ann Arbor, Michigan, pp 141-170
Edmondson WT (1959) Freshwater Biology. John Wiley and Sons, Inc, New York
Fryer G (1968) Evolution and adaptive radiation in the Chydoridae (Crustacea: Cladocera): a study in comparative functional mor- phology and ecology. Philo Trans Royal Soc (B) 254:221-386
Goldman JC, McCarthy JJ, Peavey DG (1979) Growth rate influ- ence on the chemical composition of phytoplankton in oceanic waters. Nature 279: 21 ~215
Harper JL (1969) The role of predation in vegetational diversity. In: Diversity and Stability in Ecological Systems. Brookhaven Symp in Biology 22:48 62
Harper JL (1977) Population Biology of Plants. Academic Press, London
Jackson GA (1980) Phytoplankton growth and zooplankton graz- ing in oligotrophic oceans. Nature 284:439-441
Lamberti GA, Resh VH (1983) Stream periphyton and insect herbi- vores: an experimental study of grazing by a caddisfly popula- tion. Ecology 64:1124-1135
Lampert W, Taylor BE (1985) Zooplankton grazing in a eutrophic lake: implications of diel vertical migration. Ecology 66:68-82
Lehman JT (1980) Nutrient recycling as an interface between algae and grazers in freshwater communities. In: Kerfoot WC (ed) Evolution and Ecology of Zooplankton Communities. Special sysmposium volume 3, Am Soc Limnol Oceanogr, University Press of New England, Hanover, NH and London, England, pp 251-263
Lehman JT, Sandgren CD (1985) Species-specific rates of growth and grazing loss among freshwater algae. Limnol Oceanogr 30: 34-46
Lehman JT, Scavia D (1982) Microscale patchiness of nutrients in plankton communities. Science 216:72%730
Lubchenco J (1978) Plant species diversity in a marine intertidal community: importance of herbivore food preference and algal competitive abilities. Am Nat 112 : 23-39
Lynch M, Shapiro J (1981) Predation, enrichment, and phyto- plankton community structure. Limnol Oceauogr 26:86,102
McCarthy J J, Goldman JC (1979) Nitrogenous nutrition of marine phytoplankton in nutrient depleted waters. Science 203 : 670-672
McCauley E, Briand F (1979) Zooplankton grazing and phyto- plankton species richness : field tests of the predation hypothe- sis. Limnol Oceanogr 24: 243-252
McCauley KJ, Cook SA (1980) Phellinus weirii infestion of two mountain hemlock forests in the Oregon Cascades. Forest Sci 26 : 23-29
McNaught DC, Greismer D, Kennedy M (1980) Resource charac- teristics modifying selective grazing by copepods. In: Kerfoot WC (ed) Evolution and Ecology of Zooplankton Communities. Special symposium volume 3, Am Soc Limnol Oceanogr, Uni- versity Press of New England, Hanover, NH and London, Eng- land, pp 292-298
McNaughton SJ (i983) Serengeti grassland ecology: the role of composite environmental factors and contingency in commun- ity organization. Ecol Monogr 53:291-320
Mills DH, Wyatt JT (1974) Ostracod reactions to nontoxic and toxic algae. Oecologia (Berl) 17:171-177
Neill WE (1975) Resource partitioning by competing microcrusta- ceans in stable laboratory microecosystems. Verh Int Verein Limnol 19 : 2885-2890
Nilssen JP (1978) Eutrophication, minute algae and inefficient grazers. Mem Ist Ital Idrobiol 36:121-138
O'Brien WJ (1974) The dynamics of nutrient limitation of phyto- plankton algae: a model reconsidered. Ecology 55:134-141
Paine RT (1966) Food web complexity and species diversity. Am Nat 100:65-75
Paine RT, Vadas RL (1969) The effects of grazing by sea urchins Strongyloeentrus spp., on benthic algal populations. Limnol Oceanogr 14:710-719
Peer RL (1983) Disturbance, grazing and succession: an experi- mental approach to community analysis. PhD dissertation, University of Oregon
Pielou EC (1977) Introduction to Mathematical Ecology. John Wi- ley & Sons, Inc., New York
Porter KG (1975) Viable gut passage of gelatinous green algae ingested by Daphnia. Verh Int Verein Limnol 19:2840-2850
Porter KG (1977) The plant-animal interface in freshwater ecosys- tems. Am Sci 65:159-170
Prescott GW (1954) How to Know the Freshwater Algae. Wm C Brown, Dubuque
Quinn JF, Dunham AE (1983) On hypothesis testing in ecology and evolution. Am Nat 122:602-617
Rhee G, Gotham IJ (1980) Optimum N:P ratios and coexistence of planktonic algae. J Phycol 16:486-489
Robles C (1982) Disturbance and predation in an assemblage of herbivorous Diptera and algae on rocky shores. Oecologia (Berl) 54: 23-31
Sager PE, Hasler AD (1969) Species diversity in lacustrine phyto- plankton. I. The components of the index of diversity from Shannon's formula. Am Nat 103:51 59
Sariaslani FS, Rosazza JP (1983) Microbial transformations of nat- ural antitumor agents: products of rotenone and dihydroroten- one transformation by Cunninghamella blakesleeana. Appl En- viron Microbiol 45:61 6-621
Slobodkin LB (1961) Growth and Regulation of Animal Popula- tions. Holt, Rinehart and Winston, New York
Smith MW (1940) Copper sulphate and rotenone as fish poisons. Trans Am Fish Soc 69:141-157
Sonsa WP (1979) Experimental investigation of disturbance and ecological succession in a rocky intertidal algal community. Ecol Monogr 49 : 227-254
Tilman D (1982) Resource Competition and Community Structure. Princeton University Press, Princeton
Tilman D, Kilham SS, Kilham P (1982) Phytoplankton community eclogy: the role of limiting nutrients. Ann Rev Ecol Syst 13 : 349-372
Received July 25, 1985