the effects of 3d printed molds on metal castings · the effects of 3d printed molds on ......
TRANSCRIPT
THE EFFECTS OF 3D PRINTED MOLDS ON METAL
CASTINGS
Dean Snelling1, Heather Blount
2, Charles Forman
2, Kelly Ramsburg
2, Andrew Wentzel
2,
Christopher Williams1, Alan Druschitz
2
1 Design, Research, and Education for Additive Manufacturing Systems Laboratory; Department
of Mechanical Engineering 2
Department of Material Science
Virginia Tech, Blacksburg, VA
ABSTRACT
Additive manufacture of sand molds via binder jetting enables the casting of complex metal
geometries. Various material systems have been created for 3D printing of sand molds;
however, a formal study of the materials’ effects on cast products has not yet been conducted. In
this paper the authors investigate potential differences in material properties (microstructure,
porosity, mechanical strength) of A356 – T6 castings resulting from two different commercially
available 3D printing media. In addition, the material properties of cast products from traditional
“no-bake” silica sand is used as a basis for comparison of castings produced by the 3D printed
molds.
Keywords: Binder Jetting, Indirect 3D Printing, Metal Casting, Sand Casting
1. EFFECTS OF MOLDING MATERIALS ON CASTINGS
1.1. Additive Manufacturing of Sand Molds for Metal Casting
Additive Manufacturing (AM) has enabled the direct production of molds without the need
for a pattern. Specifically, the binder jetting 3D Printing (3DP) process has been used to directly
fabricate sand molds and core boxes by selectively jetting binder into a powder bed of foundry
sand [1].
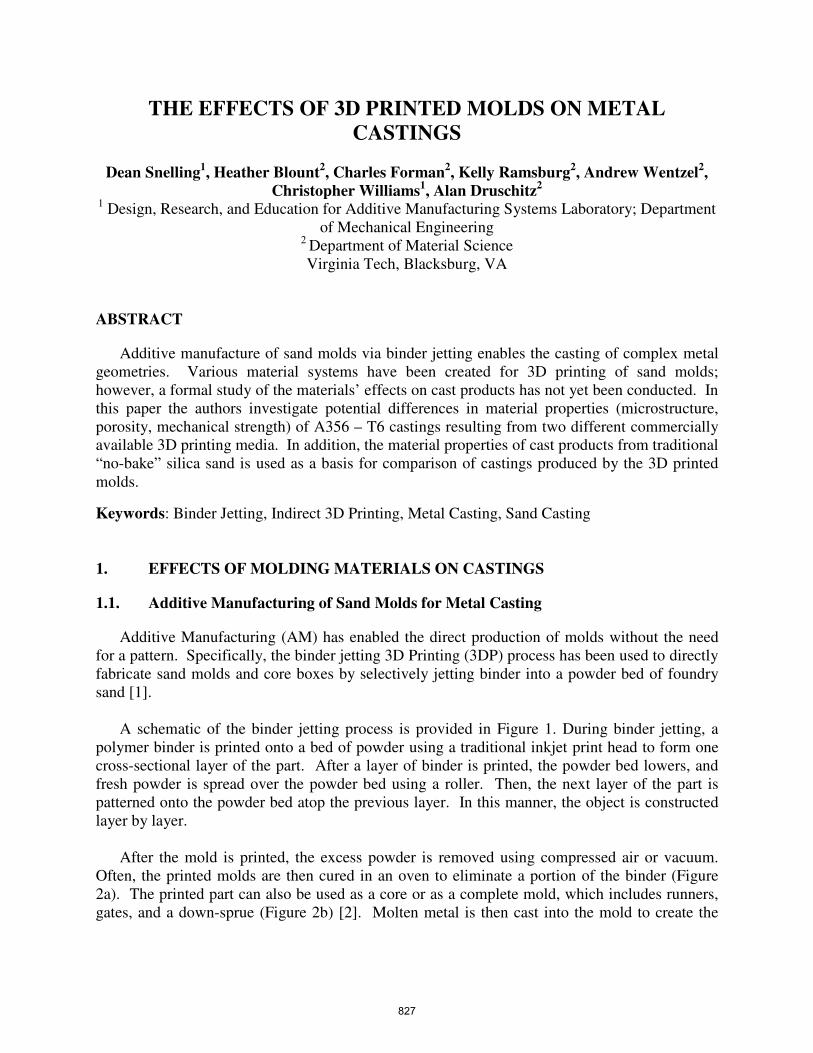
A schematic of the binder jetting process is provided in Figure 1. During binder jetting, a
polymer binder is printed onto a bed of powder using a traditional inkjet print head to form one
cross-sectional layer of the part. After a layer of binder is printed, the powder bed lowers, and
fresh powder is spread over the powder bed using a roller. Then, the next layer of the part is
patterned onto the powder bed atop the previous layer. In this manner, the object is constructed
layer by layer.
After the mold is printed, the excess powder is removed using compressed air or vacuum.
Often, the printed molds are then cured in an oven to eliminate a portion of the binder (Figure
2a). The printed part can also be used as a core or as a complete mold, which includes runners,
gates, and a down-sprue (Figure 2b) [2]. Molten metal is then cast into the mold to create the
827
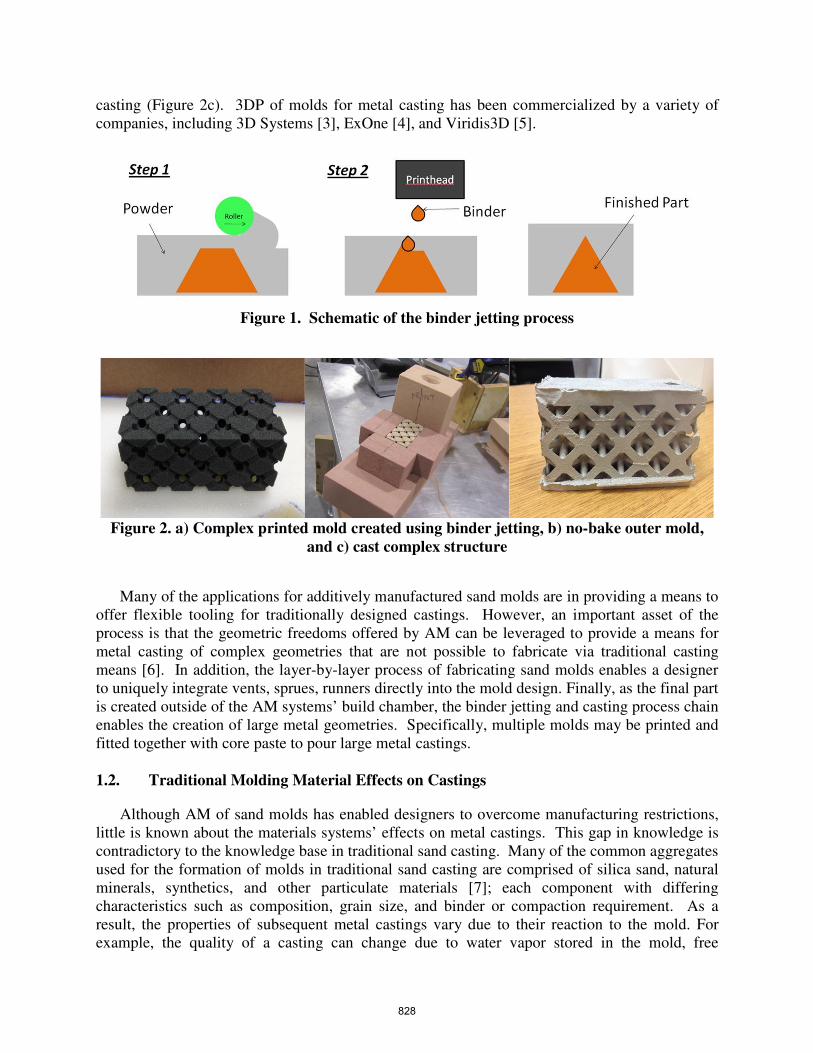
casting (Figure 2c). 3DP of molds for metal casting has been commercialized by a variety of
companies, including 3D Systems [3], ExOne [4], and Viridis3D [5].
Figure 1. Schematic of the binder jetting process
Figure 2. a) Complex printed mold created using binder jetting, b) no-bake outer mold,
and c) cast complex structure
Many of the applications for additively manufactured sand molds are in providing a means to
offer flexible tooling for traditionally designed castings. However, an important asset of the
process is that the geometric freedoms offered by AM can be leveraged to provide a means for
metal casting of complex geometries that are not possible to fabricate via traditional casting
means [6]. In addition, the layer-by-layer process of fabricating sand molds enables a designer
to uniquely integrate vents, sprues, runners directly into the mold design. Finally, as the final part
is created outside of the AM systems’ build chamber, the binder jetting and casting process chain
enables the creation of large metal geometries. Specifically, multiple molds may be printed and
fitted together with core paste to pour large metal castings.
1.2. Traditional Molding Material Effects on Castings
Although AM of sand molds has enabled designers to overcome manufacturing restrictions,
little is known about the materials systems’ effects on metal castings. This gap in knowledge is
contradictory to the knowledge base in traditional sand casting. Many of the common aggregates
used for the formation of molds in traditional sand casting are comprised of silica sand, natural
minerals, synthetics, and other particulate materials [7]; each component with differing
characteristics such as composition, grain size, and binder or compaction requirement. As a
result, the properties of subsequent metal castings vary due to their reaction to the mold. For
example, the quality of a casting can change due to water vapor stored in the mold, free
828
hydrogen, and organics as the metal flows and solidifies [7]. These reactions inherently affect
the final cast product and can produce defects such as porosity, oxidation, carbon formation, and
surface roughness [7].
1.3. Prior Research in 3DP of Sand Molds
This existing understanding of sand molds on metal casting cannot be directly applied to AM
sand materials systems as they are the working materials are dissimilar. There is limited
literature that explores the effects of 3D printable mold material on castings. Instead, most of
prior research is focused in studying the molds produced by ZCast® [8–10]. For example,
McKenna et al. performed tests on ZCast®, to determine the effects of temperature and curing
time on permeability and compressive strength of the mold. A mathematical model was used to
determine an optimal curing time and temperature for both permeability and compressive
strength [11]. In previous work, the authors investigated the binder content of ZCast® material
system and found it had a significantly higher binder content (up to 8% binder) than traditional
no-bake foundry sand [2]. The higher binder content of the ZCast® printed molds causes molds
to generate more gas during casting, which can cause defects in the final parts [2]. A new curing
cycle with higher temperatures for a shorter duration produced more consistent cast structures
with fewer gas defects [2]. In addition, Gill & Kaplas compared castings printed with ZCast®
and Investment casting using starch and plaster, including dimensional tolerances, hardness
values, surface roughness, production cost, and shrinkage [12]. Experiments were also run at
different shell thicknesses. It was determined that starch based investment casting produced
higher hardness values and slightly better surface roughness, where ZCast produced better
dimensional tolerances all from a recommended shell thickness range of 12-2mm [12]. It was
also concluded there is optimal settings in terms of time and shell thickness to minimize cost
based on individual builds [12].
1.4. Overview of Work
In order to ensure quality cast parts, the effects of final cast material properties needs to be
studied using different molding materials. The primary goal of this work is to compare two
commercially available 3D printing 3DP powders: ViriCast™ (produced by Viridis3Da) and
ZCast® (produced by 3D Systemsb). Additionally, this work compares these two 3DP powders
on the basis of the handleability of the resultant printed molds and the properties of the cast
metal parts they produce. The 3DP powders will also be compared to traditional no-bake
foundry sand in order to determine whether 3D printed molds can produce metal parts of
comparable quality to traditional casting approaches.
An explanation of multiple tests utilized to characterize both 3DP sands and no-bake sand
and material properties will be presented in Section 2. These tests include sieve analysis, tensile
testing, surface roughness, density, hardness, porosity, microstructure, and compression tests.
The results of these tests are presented and statistically analyzed in Section 3 Finally, in
conclusion, an overview and future work is given in Section 4.
a http://www.viridis3d.com/metalcasting.htm b http://www.zcorp.com/en/Products/3D-Printers/Spectrum-Z510/spage.aspx
829
2. EXPERIMENTAL PROCEDURE
2.1. Characterization of 3D Printing Powder
Functionally, the two sands investigated in this paper are similar. They are both processed via
a binder jetting AM process, and are both designed for receiving molten metal for sand casting
applications. The only stated performance difference is in their maximum casting temperatures:
ViriCast™ can be cast at 2650°F (1454.4 °C) and can be used to cast ferrous and non-ferrous
alloys; ZCast® has a maximum cast temperature at 2000°F (1093.3 °C) and can only be used for
casting non-ferrous alloys. Further differences between the two powders are identified by further
characterization experiments, including sieve analysis and tensile testing of cured sand samples.
Sieve Analysis
Standard sieve tests according to AFS 1105-00-S [13] and AFS 1106-00-S [13] were
previously performed on ZCast® powder and no-bake sand to determine particle size distribution
[2]. A sieve test was performed on the ViriCast™ powder following the same standard
procedure.
Tensile Testing
The mechanical strength of the molds was characterized via tensile testing. Tensile testing
was previously performed on ZCast® powder and no-bake foundry sand according to AFS 3342-
00-S to determine handleability of the material [2]. Five equivalent dog-bone shaped specimens
were printed using a 3D Systems Spectrum Z510 3D printer with ViriCast™ powder and 3D
Systems zb56 binder; the dog-bones were then cured at 400 °F (204.4 °C) for five hours [2].
Tensile testing was performed using a tensile testing machine to determine the mold fracture
strength. Collected data and modes of fracture for ViriCast™ molds were compared with
ZCast®, as well as no-bake foundry sand molds.
2.2. Characterization of Cast A356 Cylinders
The primary goal of this research was to compare the properties of metal cast in (i)
ViriCast™ molds, (ii) ZCast® molds, and (iii) no-bake foundry sand molds. The two 3D printed
sands are treated as the experimental group; chemically bonded silica sand, also known as no-
bake sand, is treated as the control, since there exists published information about its casting
properties [14]. The binder ratio in the no-bake sand was 4:1 of Phenoset RB to APR-015
hardener/catalyst, which accounted for approximately 1.6% of the sand mixture [2]. A Palmer
M50XLD continuous sand mixer was used to mix the silica sand and binder to create the no-bake
sand [2].
To make the 3DP molds, hollow cylinders (inner diameter one inch, wall thickness of 1 inch,
and length of 4 inches) were designed using CAD. This specific inner diameter was chosen
given the ability to machine to typical specimen sizes for ASTM compression tests given in
ASTM E9-09 [15]. Six cylindrical molds where then printed in both ViriCast™ and ZCast®
powders at their individual manufacturer’s process parameter specifications (Table 1). The
printed mold can is illustrated in Figure 3a and the manufacturer’s process parameters in Table 1.
830
The resultant printed molds were then post-processed according to their manufacturer’s
specifications: ViriCast™ molds were cured at 400°F (204.4°C) for five hours, and ZCast®
molds were cured at 600 °F (316 °C) for one hour. Then, no-bake foundry sand was used to
create the down-sprue, runners and gates. In order to create the no-bake molds, one inch diameter
dowel rods were used to create four cylindrical molds in no-bake foundry sand.
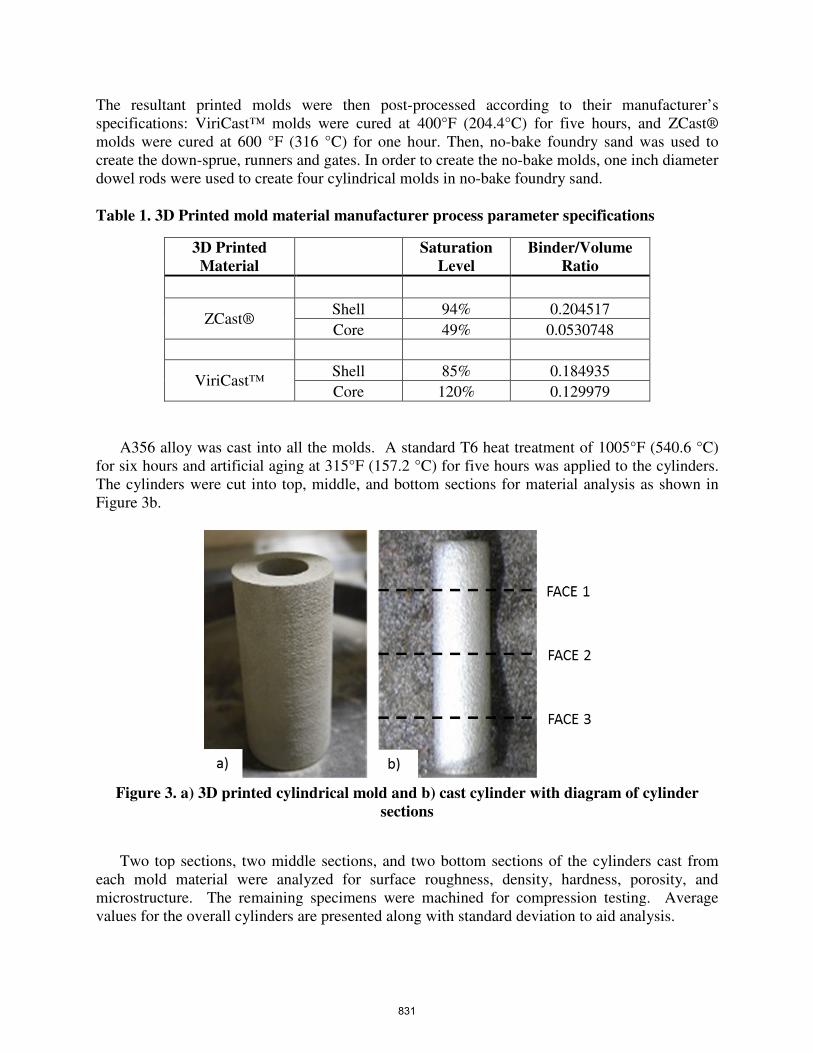
Table 1. 3D Printed mold material manufacturer process parameter specifications
3D Printed
Material Saturation
Level
Binder/Volume
Ratio
ZCast® Shell 94% 0.204517
Core 49% 0.0530748
ViriCast™ Shell 85% 0.184935
Core 120% 0.129979
A356 alloy was cast into all the molds. A standard T6 heat treatment of 1005°F (540.6 °C)
for six hours and artificial aging at 315°F (157.2 °C) for five hours was applied to the cylinders.
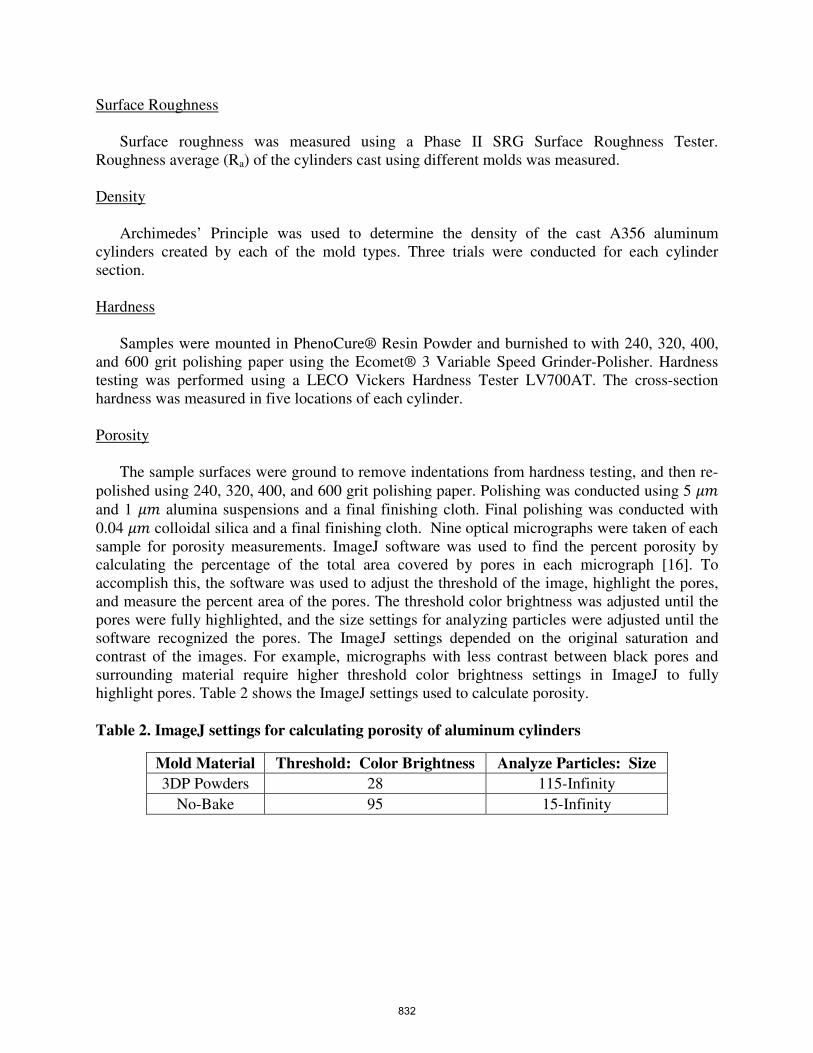
The cylinders were cut into top, middle, and bottom sections for material analysis as shown in
Figure 3b.
Figure 3. a) 3D printed cylindrical mold and b) cast cylinder with diagram of cylinder
sections
Two top sections, two middle sections, and two bottom sections of the cylinders cast from
each mold material were analyzed for surface roughness, density, hardness, porosity, and
microstructure. The remaining specimens were machined for compression testing. Average
values for the overall cylinders are presented along with standard deviation to aid analysis.
831
Surface Roughness
Surface roughness was measured using a Phase II SRG Surface Roughness Tester.
Roughness average (Ra) of the cylinders cast using different molds was measured.
Density
Archimedes’ Principle was used to determine the density of the cast A356 aluminum
cylinders created by each of the mold types. Three trials were conducted for each cylinder
section.
Hardness
Samples were mounted in PhenoCure® Resin Powder and burnished to with 240, 320, 400,
and 600 grit polishing paper using the Ecomet® 3 Variable Speed Grinder-Polisher. Hardness
testing was performed using a LECO Vickers Hardness Tester LV700AT. The cross-section
hardness was measured in five locations of each cylinder.
Porosity
The sample surfaces were ground to remove indentations from hardness testing, and then re-
polished using 240, 320, 400, and 600 grit polishing paper. Polishing was conducted using 5 ��
and 1 �� alumina suspensions and a final finishing cloth. Final polishing was conducted with
0.04 �� colloidal silica and a final finishing cloth. Nine optical micrographs were taken of each
sample for porosity measurements. ImageJ software was used to find the percent porosity by
calculating the percentage of the total area covered by pores in each micrograph [16]. To
accomplish this, the software was used to adjust the threshold of the image, highlight the pores,
and measure the percent area of the pores. The threshold color brightness was adjusted until the
pores were fully highlighted, and the size settings for analyzing particles were adjusted until the
software recognized the pores. The ImageJ settings depended on the original saturation and
contrast of the images. For example, micrographs with less contrast between black pores and
surrounding material require higher threshold color brightness settings in ImageJ to fully
highlight pores. Table 2 shows the ImageJ settings used to calculate porosity.
Table 2. ImageJ settings for calculating porosity of aluminum cylinders
Mold Material Threshold: Color Brightness Analyze Particles: Size
3DP Powders 28 115-Infinity
No-Bake 95 15-Infinity
832
Microstructure
Next, the microstructure of the aluminum samples were revealed by etching with Weck’s
reagent [17], [18] , which contains 100 mL water, 4 g KMnO4, and 1 g NaOH. The sample
surfaces were submerged in Weck’s reagent [17], [18] and agitated for 20 seconds. After rinsing
with water and alcohol, the samples were blown dry. Optical microscopy was performed to
characterize the microstructure and determine the dendrite arm spacing in each sample.
Compression Testing
Compression specimens were machined to a diameter of ½ in. and length of 1 in. according
to ASTM standard E9-09 [15]. Compression tests were conducted using an MTS Insight
Electromechanical 150 kN Standard Length Testing System to measure the compressive yield
strength. The strain rate was fixed at 0.005 in./min. Compressive yield strengths were found
using a 0.02% offset from the elastic region of the stress-strain curve. Compression tests were
not performed on the cylinders cast using no-bake foundry sand since the compression behavior
cast T6-A356 aluminum is published information [14].
3. RESULTS AND DISCUSSION
3.1. Properties of 3D Printing Powder
Sieve Analysis
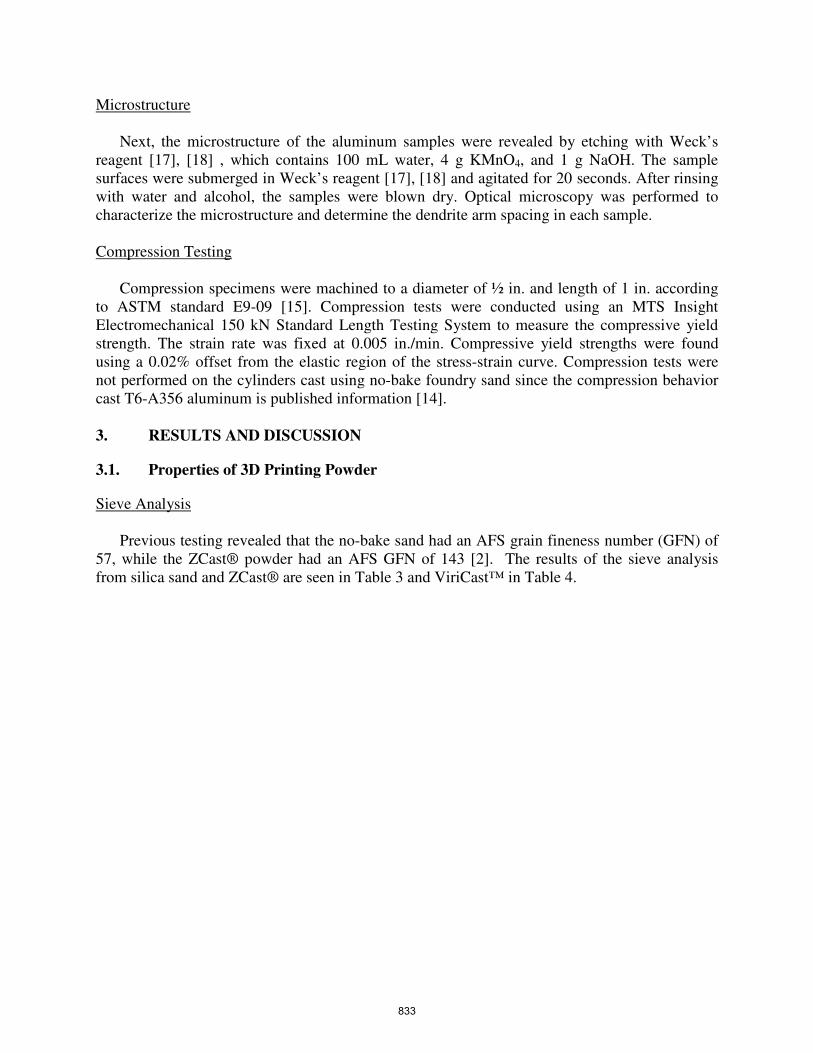
Previous testing revealed that the no-bake sand had an AFS grain fineness number (GFN) of
57, while the ZCast® powder had an AFS GFN of 143 [2]. The results of the sieve analysis
from silica sand and ZCast® are seen in Table 3 and ViriCast™ in Table 4.
833
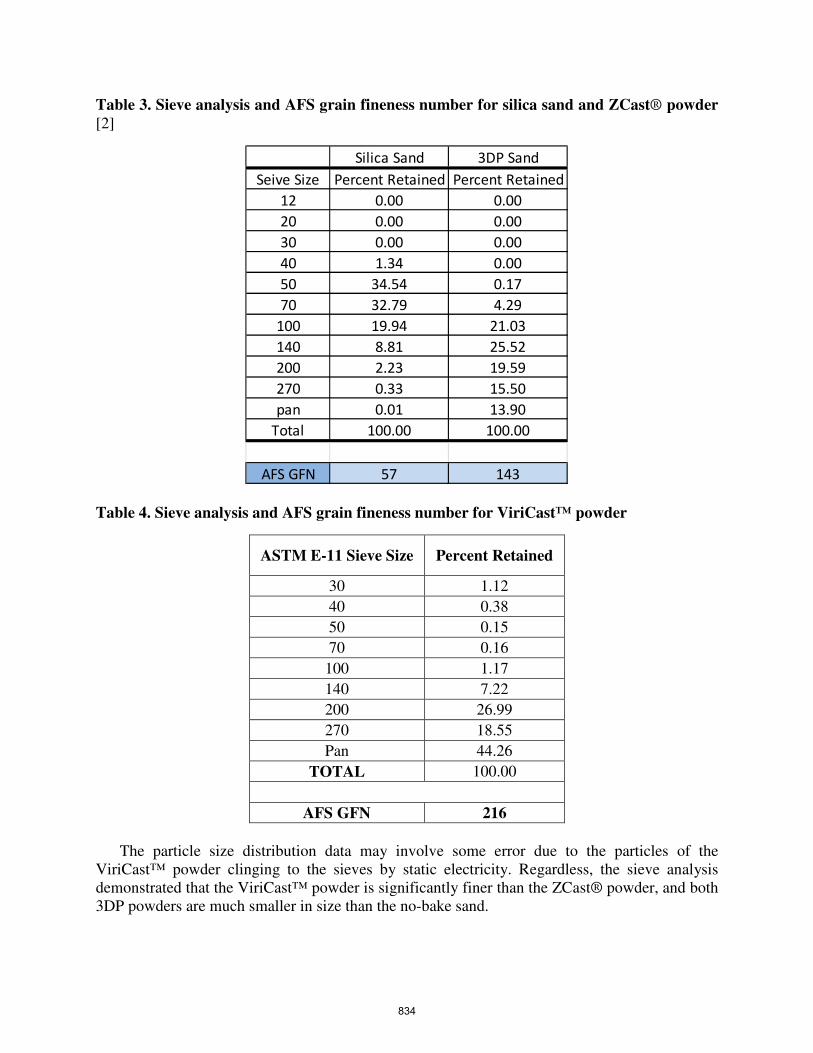
Table 3. Sieve analysis and AFS grain fineness number for silica sand and ZCast® powder
[2]
Table 4. Sieve analysis and AFS grain fineness number for ViriCast™ powder
ASTM E-11 Sieve Size Percent Retained
30 1.12
40 0.38
50 0.15
70 0.16
100 1.17
140 7.22
200 26.99
270 18.55
Pan 44.26
TOTAL 100.00
AFS GFN 216
The particle size distribution data may involve some error due to the particles of the
ViriCast™ powder clinging to the sieves by static electricity. Regardless, the sieve analysis
demonstrated that the ViriCast™ powder is significantly finer than the ZCast® powder, and both
3DP powders are much smaller in size than the no-bake sand.
Silica Sand 3DP Sand
Seive Size Percent Retained Percent Retained
12 0.00 0.00
20 0.00 0.00
30 0.00 0.00
40 1.34 0.00
50 34.54 0.17
70 32.79 4.29
100 19.94 21.03
140 8.81 25.52
200 2.23 19.59
270 0.33 15.50
pan 0.01 13.90
Total 100.00 100.00
AFS GFN 57 143
834

Tensile Testing
Dog bone shaped specimens were produced from the mold materials and tested following the
experimental plan (Section 2.1). The results of tensile testing are reported in Table 5.
Table 5. Tensile strengths of the different mold materials
Mold Material Mean σ SD Wilcoxon Comparison
(MPa) (MPa) p-Value
No-Bake 0.56 0.09 X --------
ViriCast™ 0.16 0.03 0.0081 X
ZCast® 0.06 0.02 0.0369 0.0282
Statistical software (JMP 10.0.2) was used to investigate potential significant difference in
the tensile strengths of the two printed mold materials. Non-parametric Wilcoxon tests were
performed on the data using a level of significance (α) of 0.05 after confirming the data was not
normal. The p-values from the comparisons are displayed in Table 5. The no-bake molds were
significantly stronger than the two 3DP materials. Additionally, the ViriCast™ material was
significantly stronger than the ZCast®. While ViriCast™ was weaker than the traditional no-
bake foundry sand, it would make a more durable and handleable mold than the ZCast® 3DP
powder.
3.2. Properties of Cast A356 Cylinders
Cylindrical specimens cast from the two 3DP mold materials were compared to sand casted
A356-T6 alloy cylinders of the same size. The metal specimens cast in no-bake molds were
prepared using a different A356 melt than the metal samples cast using 3DP molds. The same
T6 heat treatment was performed on the metal specimens produced with both the 3DP and no-
bake sand molds. Compositional analysis performed on the two different melts using a Bruker
Q4 Tasman Advanced CCD-Based Optical Emission Spectrometer showed that both melts were
in the range of standard A356 alloy chemistry values.
Surface Roughness
The results of the surface roughness testing are reported in Table 6. After confirming the
data followed a normal distribution, a student’s t-Test with a level of significance (α) of 0.05 was
used to determine if the surface roughnesses of the cylindrical specimens cast using different
mold materials were significantly different.
835
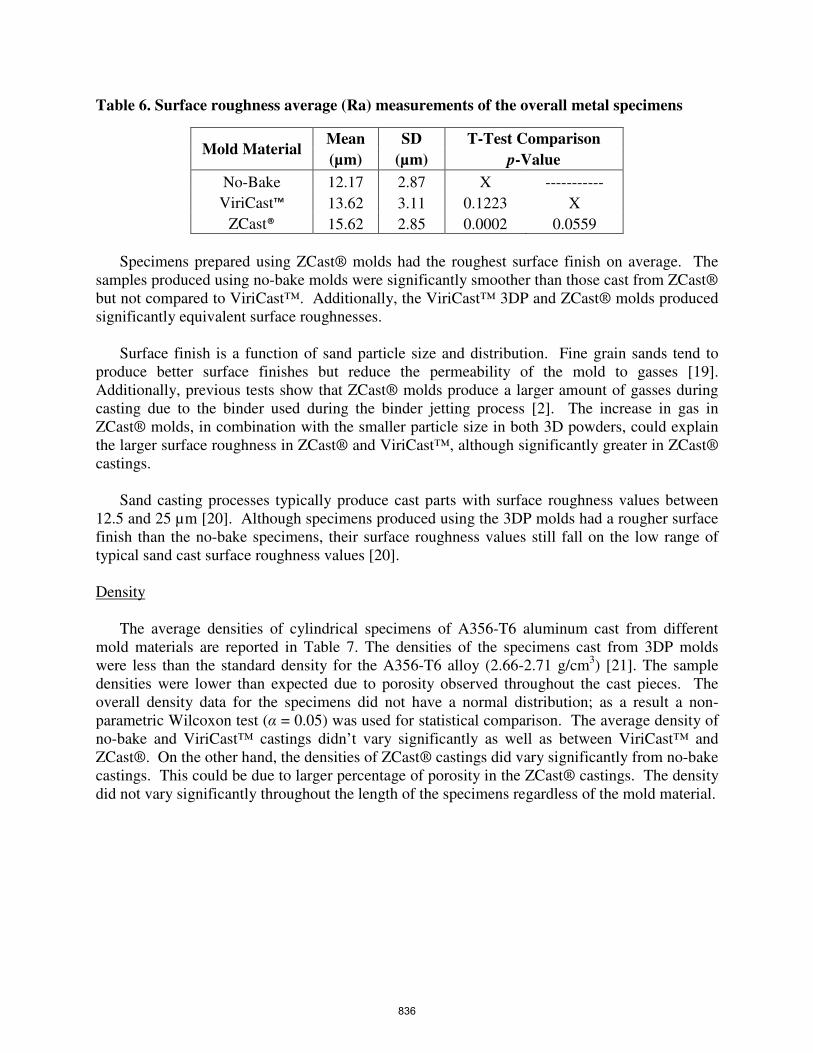
Table 6. Surface roughness average (Ra) measurements of the overall metal specimens
Mold Material Mean SD T-Test Comparison
(µm) (µm) p-Value
No-Bake 12.17 2.87 X -----------
ViriCast™ 13.62 3.11 0.1223 X
ZCast® 15.62 2.85 0.0002 0.0559
Specimens prepared using ZCast® molds had the roughest surface finish on average. The
samples produced using no-bake molds were significantly smoother than those cast from ZCast®
but not compared to ViriCast™. Additionally, the ViriCast™ 3DP and ZCast® molds produced
significantly equivalent surface roughnesses.
Surface finish is a function of sand particle size and distribution. Fine grain sands tend to
produce better surface finishes but reduce the permeability of the mold to gasses [19].
Additionally, previous tests show that ZCast® molds produce a larger amount of gasses during
casting due to the binder used during the binder jetting process [2]. The increase in gas in
ZCast® molds, in combination with the smaller particle size in both 3D powders, could explain
the larger surface roughness in ZCast® and ViriCast™, although significantly greater in ZCast®
castings.
Sand casting processes typically produce cast parts with surface roughness values between
12.5 and 25 µm [20]. Although specimens produced using the 3DP molds had a rougher surface
finish than the no-bake specimens, their surface roughness values still fall on the low range of
typical sand cast surface roughness values [20].
Density
The average densities of cylindrical specimens of A356-T6 aluminum cast from different
mold materials are reported in Table 7. The densities of the specimens cast from 3DP molds
were less than the standard density for the A356-T6 alloy (2.66-2.71 g/cm3) [21]. The sample
densities were lower than expected due to porosity observed throughout the cast pieces. The
overall density data for the specimens did not have a normal distribution; as a result a non-
parametric Wilcoxon test (α = 0.05) was used for statistical comparison. The average density of
no-bake and ViriCast™ castings didn’t vary significantly as well as between ViriCast™ and
ZCast®. On the other hand, the densities of ZCast® castings did vary significantly from no-bake
castings. This could be due to larger percentage of porosity in the ZCast® castings. The density
did not vary significantly throughout the length of the specimens regardless of the mold material.
836
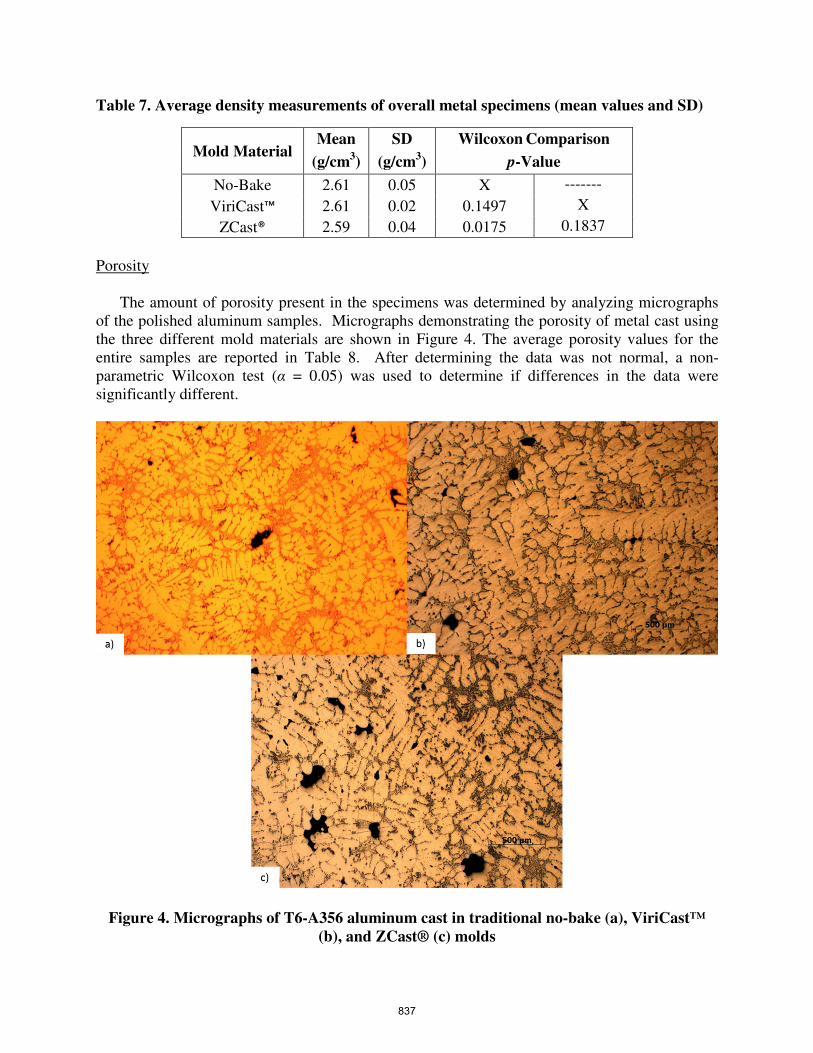
Table 7. Average density measurements of overall metal specimens (mean values and SD)
Mold Material Mean SD Wilcoxon
Comparison
(g/cm3) (g/cm
3) p-Value
No-Bake 2.61 0.05 X -------
ViriCast™ 2.61 0.02 0.1497 X
ZCast® 2.59 0.04 0.0175 0.1837
Porosity
The amount of porosity present in the specimens was determined by analyzing micrographs
of the polished aluminum samples. Micrographs demonstrating the porosity of metal cast using
the three different mold materials are shown in Figure 4. The average porosity values for the
entire samples are reported in Table 8. After determining the data was not normal, a non-
parametric Wilcoxon test (α = 0.05) was used to determine if differences in the data were
significantly different.
Figure 4. Micrographs of T6-A356 aluminum cast in traditional no-bake (a), ViriCast™
(b), and ZCast® (c) molds
837
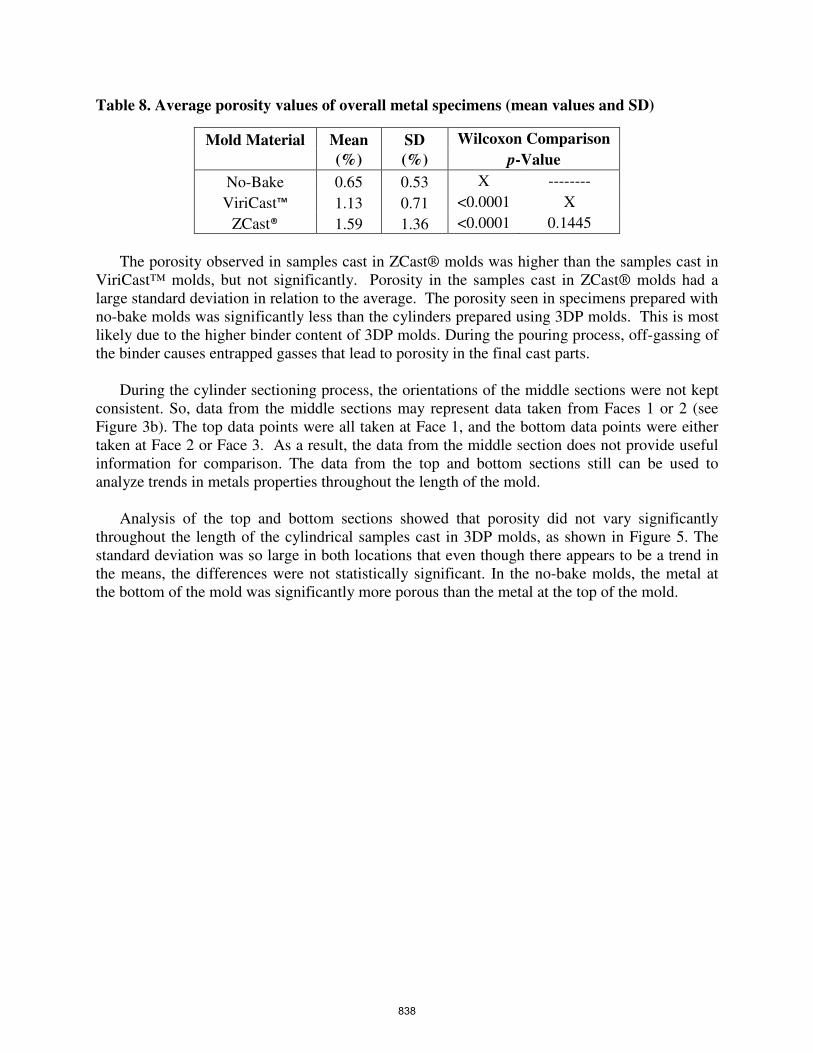
Table 8. Average porosity values of overall metal specimens (mean values and SD)
Mold Material Mean SD Wilcoxon Comparison
(%) (%) p-Value
No-Bake 0.65 0.53 X --------
ViriCast™ 1.13 0.71 <0.0001 X
ZCast® 1.59 1.36 <0.0001 0.1445
The porosity observed in samples cast in ZCast® molds was higher than the samples cast in
ViriCast™ molds, but not significantly. Porosity in the samples cast in ZCast® molds had a
large standard deviation in relation to the average. The porosity seen in specimens prepared with
no-bake molds was significantly less than the cylinders prepared using 3DP molds. This is most
likely due to the higher binder content of 3DP molds. During the pouring process, off-gassing of
the binder causes entrapped gasses that lead to porosity in the final cast parts.
During the cylinder sectioning process, the orientations of the middle sections were not kept
consistent. So, data from the middle sections may represent data taken from Faces 1 or 2 (see
Figure 3b). The top data points were all taken at Face 1, and the bottom data points were either
taken at Face 2 or Face 3. As a result, the data from the middle section does not provide useful
information for comparison. The data from the top and bottom sections still can be used to
analyze trends in metals properties throughout the length of the mold.
Analysis of the top and bottom sections showed that porosity did not vary significantly
throughout the length of the cylindrical samples cast in 3DP molds, as shown in Figure 5. The
standard deviation was so large in both locations that even though there appears to be a trend in
the means, the differences were not statistically significant. In the no-bake molds, the metal at
the bottom of the mold was significantly more porous than the metal at the top of the mold.
838
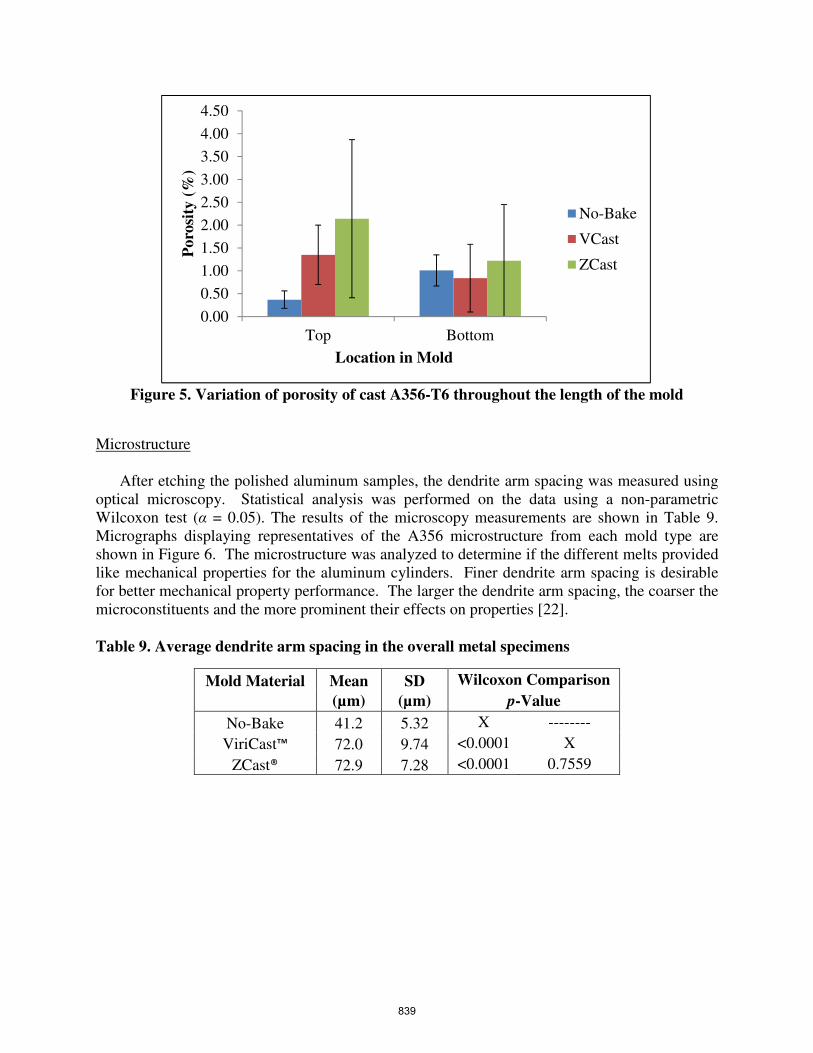
Figure 5. Variation of porosity of cast A356-T6 throughout the length of the mold
Microstructure
After etching the polished aluminum samples, the dendrite arm spacing was measured using
optical microscopy. Statistical analysis was performed on the data using a non-parametric
Wilcoxon test (α = 0.05). The results of the microscopy measurements are shown in Table 9.
Micrographs displaying representatives of the A356 microstructure from each mold type are
shown in Figure 6. The microstructure was analyzed to determine if the different melts provided
like mechanical properties for the aluminum cylinders. Finer dendrite arm spacing is desirable
for better mechanical property performance. The larger the dendrite arm spacing, the coarser the
microconstituents and the more prominent their effects on properties [22].
Table 9. Average dendrite arm spacing in the overall metal specimens
Mold Material Mean SD Wilcoxon Comparison
(µm) (µm) p-Value
No-Bake 41.2 5.32 X --------
ViriCast™ 72.0 9.74 <0.0001 X
ZCast® 72.9 7.28 <0.0001 0.7559
0.00
0.50
1.00
1.50
2.00
2.50
3.00
3.50
4.00
4.50
Top Bottom
Poro
sity
(%
)
Location in Mold
No-Bake
VCast
ZCast
839
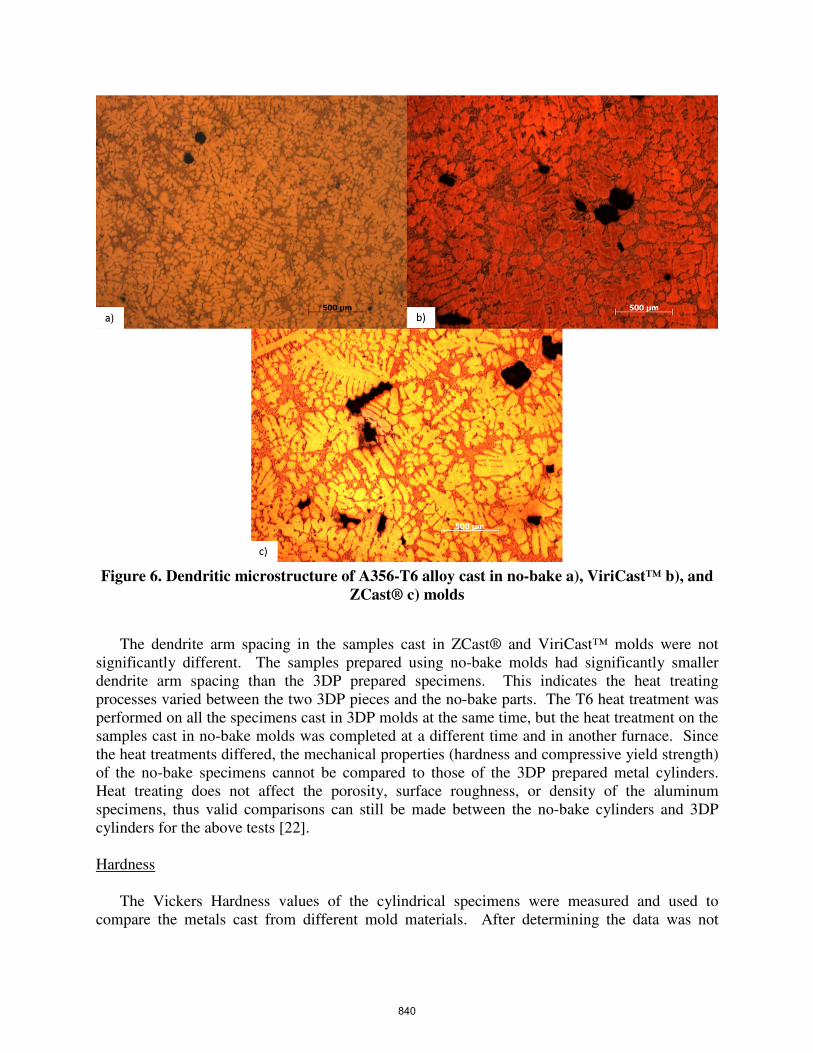
Figure 6. Dendritic microstructure of A356-T6 alloy cast in no-bake a), ViriCast™ b), and
ZCast® c) molds
The dendrite arm spacing in the samples cast in ZCast® and ViriCast™ molds were not
significantly different. The samples prepared using no-bake molds had significantly smaller
dendrite arm spacing than the 3DP prepared specimens. This indicates the heat treating
processes varied between the two 3DP pieces and the no-bake parts. The T6 heat treatment was
performed on all the specimens cast in 3DP molds at the same time, but the heat treatment on the
samples cast in no-bake molds was completed at a different time and in another furnace. Since
the heat treatments differed, the mechanical properties (hardness and compressive yield strength)
of the no-bake specimens cannot be compared to those of the 3DP prepared metal cylinders.
Heat treating does not affect the porosity, surface roughness, or density of the aluminum
specimens, thus valid comparisons can still be made between the no-bake cylinders and 3DP
cylinders for the above tests [22].
Hardness
The Vickers Hardness values of the cylindrical specimens were measured and used to
compare the metals cast from different mold materials. After determining the data was not
840
normal, a non-parametric Wilcoxon test (α = 0.05) was used to determine if differences in the
data were significantly different. The results of the hardness testing are reported in Table 10.
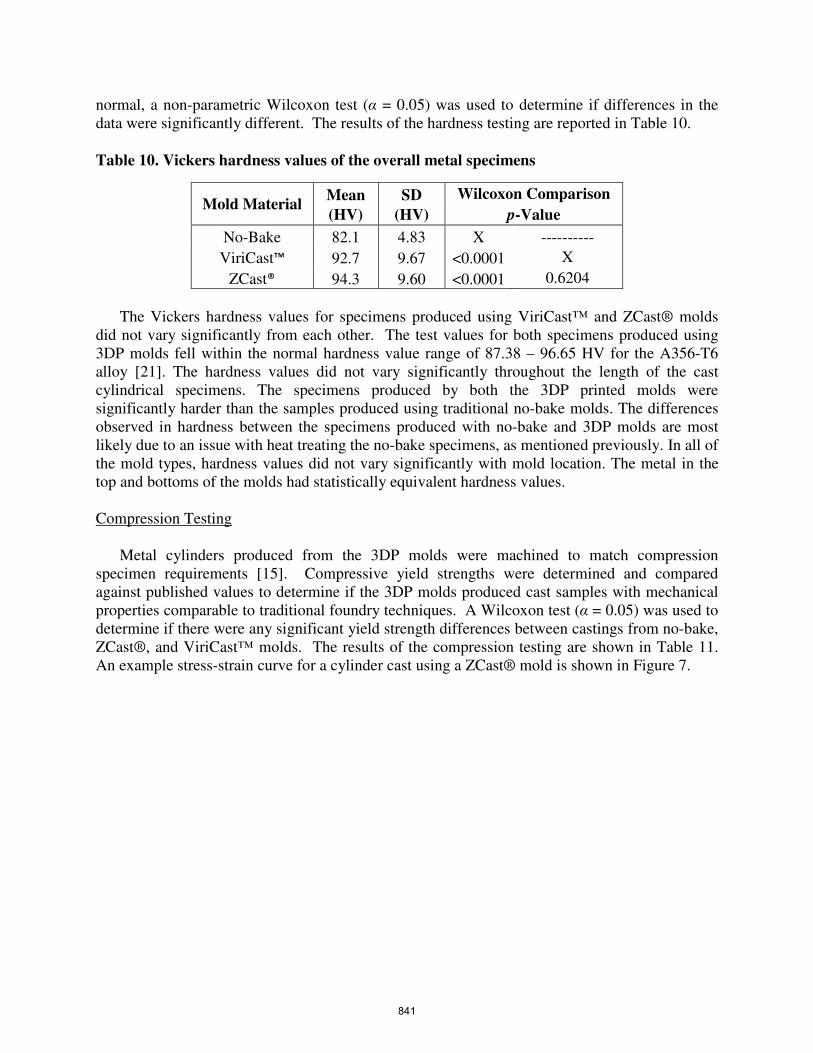
Table 10. Vickers hardness values of the overall metal specimens
Mold Material Mean SD Wilcoxon Comparison
(HV) (HV) p-Value
No-Bake 82.1 4.83 X ----------
ViriCast™ 92.7 9.67 <0.0001 X
ZCast® 94.3 9.60 <0.0001 0.6204
The Vickers hardness values for specimens produced using ViriCast™ and ZCast® molds
did not vary significantly from each other. The test values for both specimens produced using
3DP molds fell within the normal hardness value range of 87.38 – 96.65 HV for the A356-T6
alloy [21]. The hardness values did not vary significantly throughout the length of the cast
cylindrical specimens. The specimens produced by both the 3DP printed molds were
significantly harder than the samples produced using traditional no-bake molds. The differences
observed in hardness between the specimens produced with no-bake and 3DP molds are most
likely due to an issue with heat treating the no-bake specimens, as mentioned previously. In all of
the mold types, hardness values did not vary significantly with mold location. The metal in the
top and bottoms of the molds had statistically equivalent hardness values.
Compression Testing
Metal cylinders produced from the 3DP molds were machined to match compression
specimen requirements [15]. Compressive yield strengths were determined and compared
against published values to determine if the 3DP molds produced cast samples with mechanical
properties comparable to traditional foundry techniques. A Wilcoxon test (α = 0.05) was used to
determine if there were any significant yield strength differences between castings from no-bake,
ZCast®, and ViriCast™ molds. The results of the compression testing are shown in Table 11.
An example stress-strain curve for a cylinder cast using a ZCast® mold is shown in Figure 7.
841
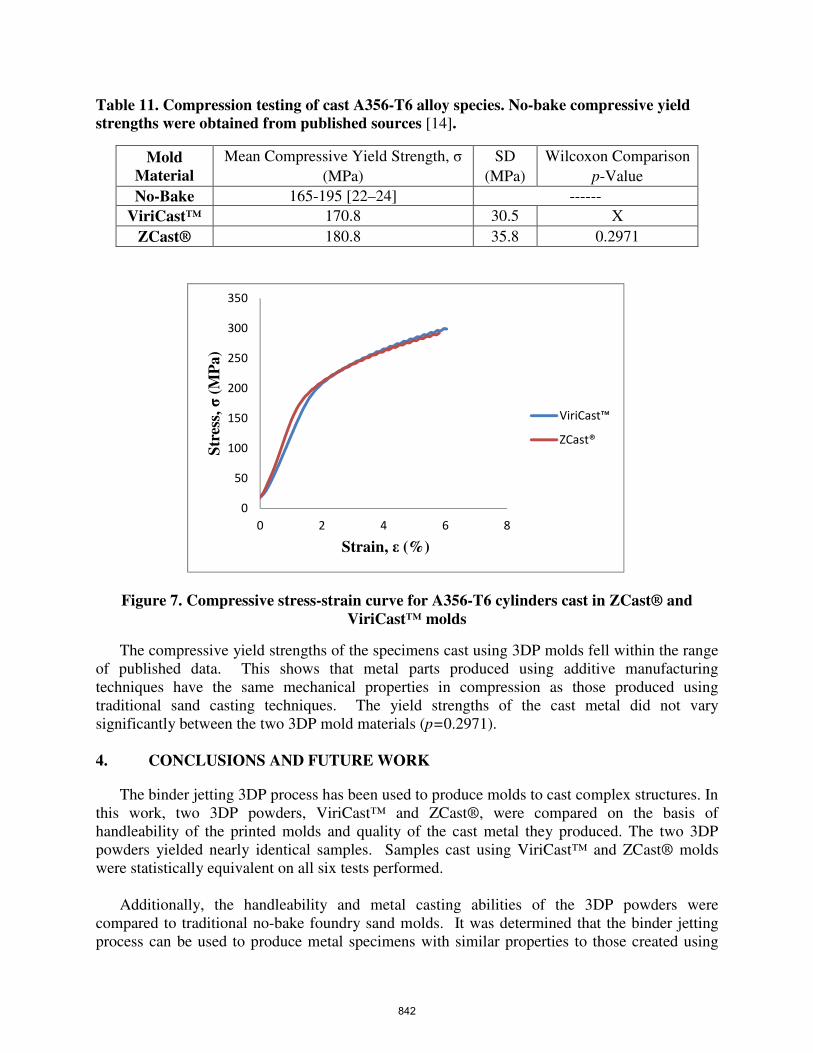
Table 11. Compression testing of cast A356-T6 alloy species. No-bake compressive yield
strengths were obtained from published sources [14].
Mold
Material
Mean Compressive Yield Strength, σ SD Wilcoxon Comparison
(MPa) (MPa) p-Value
No-Bake 165-195 [22–24] ------
ViriCast™ 170.8 30.5 X
ZCast® 180.8 35.8 0.2971
Figure 7. Compressive stress-strain curve for A356-T6 cylinders cast in ZCast® and
ViriCast™ molds
The compressive yield strengths of the specimens cast using 3DP molds fell within the range
of published data. This shows that metal parts produced using additive manufacturing
techniques have the same mechanical properties in compression as those produced using
traditional sand casting techniques. The yield strengths of the cast metal did not vary
significantly between the two 3DP mold materials (p=0.2971).
4. CONCLUSIONS AND FUTURE WORK
The binder jetting 3DP process has been used to produce molds to cast complex structures. In
this work, two 3DP powders, ViriCast™ and ZCast®, were compared on the basis of
handleability of the printed molds and quality of the cast metal they produced. The two 3DP
powders yielded nearly identical samples. Samples cast using ViriCast™ and ZCast® molds
were statistically equivalent on all six tests performed.
Additionally, the handleability and metal casting abilities of the 3DP powders were
compared to traditional no-bake foundry sand molds. It was determined that the binder jetting
process can be used to produce metal specimens with similar properties to those created using
0
50
100
150
200
250
300
350
0 2 4 6 8
Str
ess,
σ(M
Pa)
Strain, ε (%)
ViriCast™
ZCast®
842
traditional sand casting techniques. Both the ViriCast™ and ZCast® 3DP molds produced cast
metal parts with the same mechanical performance and hardness as traditionally prepared A356-
T6. However, ZCast® molds produced cast A356-T6 with greater surface roughness and
decreased density than the samples prepared with no-bake molds. Furthermore, the no-bake
molds had a significantly higher tensile strength than the 3DP molds, which made them more
handleable, while produced castings with less porosity and smaller dendrite arm spacing.
As technology advances, modeling, including flow modeling and solidification, will yield
higher quality castings by minimizing porosity resulting in desired microstructure. Due to the
freedom of design provided by Additive Manufacturing, the molder has the ability to overcome
the manufacturing constraints of traditional mold making in order to generate optimal complex
castings. Continued work with these molding materials, in addition to others, will provide the
ability to enhance existing lightweight, stiff cellular structures with designed mesostructure [6].
843
REFERENCES
[1] P. R. Beely, Foundry Technology. Butterworth-Heinemann, 2001.
[2] D. A. Snelling, V. Tech, R. Kay, A. Druschitz, and C. B. Williams, “Mitigating Gas
Defects in Castings Produced from 3D Printed Molds,” in 117th Metalcasting Congress,
2012.
[3] 3D Systems, “Solutions: Metal Casting.” [Online]. Available:
http://www.zcorp.com/en/Solutions/Castings-Patterns-Molds/spage.aspx.
[4] ExOne, “ExOne: Digital Part Materialization.” [Online]. Available:
http://www.exone.com/materialization/what-is-digital-part-materialization/sand.
[5] Viridis3D, “Metal Casting.” [Online]. Available:
http://www.viridis3d.com/metalcasting.htm.
[6] N. A. Meisel, C. B. Williams, and A. Druschitz, “Lightweight Metal Cellular Structures
via Indirect 3D Printing and Casting,” in SFF Symposium, 2012.
[7] J. Campbell, Castings, 2nd ed. Butterworth-Heinemann Limited, 2003.
[8] M. Chhabra and R. Singh, “Obtaining desired surface roughness of castings produced
using ZCast direct metal casting process through Taguchi’s experimental approach,”
Rapid Prototyping Journal, vol. 18, pp. 458–471, 2012.
[9] E. Bassoli, A. Gatto, L. Iuliano, and M. G. Violante, “3D printing technique applied to
rapid casting,” Rapid Prototyping Journal, vol. 13, no. 3, pp. 148–155, 2007.
[10] S. S. Gill and M. Kaplas, “Efficacy of powder-based three-dimensional printing (3DP)
technologies for rapid casting of light alloys,” The International Journal of Advanced
Manufacturing Technology, vol. 52, no. 1–4, pp. 53–64, May 2010.
[11] N. Mckenna, S. Singamneni, O. Diegel, D. Singh, T. Neitzert, J. S. George, A. R.
Choudhury, and P. Yarlagadda, “QUT Digital Repository : Direct Metal casting through
3D printing : A critical analysis of the mould characteristics,” in Global Congress on
Manufacturing and Management, 2008, pp. 12–14.
[12] S. S. Gill and M. Kaplas, “Comparative Study of 3D Printing Technologies for Rapid
Casting of Aluminium Alloy,” Materials and Manufacturing Processes, vol. 24, no. 12,
pp. 1405–1411, Dec. 2009.
[13] American Foundry Society, Mold and Core Test Handbook, 3rd ed. Des Plaines:
American Foundry Society, 2004.
844
[14] ASM International, Metals Handbook: Properties and Selection: Nonferrous Alloys and
Pure Metals, 10th ed., vol. 2. ASM International, 1990.
[15] ASTM International, Standard Test Methods of Compression Testing of Metallica
Materials at Room Temperature. ASTM Standard E9-09, 2009.
[16] National Institutes of Health, “ImageJ: Image Processing and Analysis in Java.” [Online].
Available: http://rsb.info.nih.gov/ij.
[17] G. Vander Voort, “Metallography and Microstructure of Aluminum and Alloys.” [Online].
Available: http://www.vacaero.com/Metallography-with-George-Vander-
Voort/Metallography-with-George-Vander-Voort/metallography-and-microstructure-of-
aluminum-and-alloys.html.
[18] G. Vander Voort, “Metallographic Etching of Aluminum and its Alloys.” [Online].
Available:
http://www.georgevandervoort.com/met_papers/Aluminum/AlEtchExperiment.pdf.
[19] U. C. Nwaogu and N. S. Tiedje, “Foundry Coating Technology: A Review,” Materials
Sciences and Applications, vol. 02, no. 08, pp. 1143–1160, 2011.
[20] L. J. Star Inc., “Surface Finish Charts.” [Online]. Available:
http://www.ljstar.com/design/surface_charts.aspx.
[21] Granta Design Limited, “CES EduPack.” 2013.
[22] J. G. Kaufman and E. L. Rooy, Aluminum Alloy Castings: Properties, Processes, and
Application. ASM International, 2004.
[23] MatWeb, “MatWeb: Material Property Data.” [Online]. Available:
http://www.matweb.com.
[24] J. R. Davies, Aluminum and Aluminum Alloys. ASM International, 1993.
845