the effect of temperature on fluidized bed behaviour
TRANSCRIPT

This article was downloaded by: [Moskow State Univ Bibliote]On: 12 November 2013, At: 10:39Publisher: Taylor & FrancisInforma Ltd Registered in England and Wales Registered Number: 1072954 Registered office: Mortimer House,37-41 Mortimer Street, London W1T 3JH, UK
Chemical Engineering CommunicationsPublication details, including instructions for authors and subscription information:http://www.tandfonline.com/loi/gcec20
THE EFFECT OF TEMPERATURE ON FLUIDIZED BEDBEHAVIOURJ.S.M. BOTTERILL a , Y. TEOMAN a , Y. TEOMAN a & K.R. YÜREGIR aa Department of Chemical Engineering , The University of Birmingham , Birmingham, B152TT, UKPublished online: 02 Apr 2007.
To cite this article: J.S.M. BOTTERILL , Y. TEOMAN , Y. TEOMAN & K.R. YÜREGIR (1982) THE EFFECT OF TEMPERATURE ONFLUIDIZED BED BEHAVIOUR, Chemical Engineering Communications, 15:1-4, 227-238
To link to this article: http://dx.doi.org/10.1080/00986448208911072
PLEASE SCROLL DOWN FOR ARTICLE
Taylor & Francis makes every effort to ensure the accuracy of all the information (the “Content”) containedin the publications on our platform. However, Taylor & Francis, our agents, and our licensors make norepresentations or warranties whatsoever as to the accuracy, completeness, or suitability for any purpose of theContent. Any opinions and views expressed in this publication are the opinions and views of the authors, andare not the views of or endorsed by Taylor & Francis. The accuracy of the Content should not be relied upon andshould be independently verified with primary sources of information. Taylor and Francis shall not be liable forany losses, actions, claims, proceedings, demands, costs, expenses, damages, and other liabilities whatsoeveror howsoever caused arising directly or indirectly in connection with, in relation to or arising out of the use ofthe Content.
This article may be used for research, teaching, and private study purposes. Any substantial or systematicreproduction, redistribution, reselling, loan, sub-licensing, systematic supply, or distribution in anyform to anyone is expressly forbidden. Terms & Conditions of access and use can be found at http://www.tandfonline.com/page/terms-and-conditions

Chem. Eng. Commun. Vol. 15, pp. 227-238 0 Gordon and Breach, Science Publishers, Inc., 1982 0098-6445/82/1501-0227%06.50/0 Printed in the U.S.A.
THE EFFECT O F TEMPERATURE ON FLUIDIZED BED BEHAVIOUR
J.S.M. BOTTERILL, Y. TEOMAN and K.R. YUREGIR
Department of Chemical Engineering. The University of Birmingham
Birmingham BI5 21T. UK (Received July IS. 1981; in Jinal form December 17. 1981)
Most published correlations for the minimum fluidizing gas velocity have been derived from tests under ambient conditions and increasing discrepancy is found in their application over wider ranges of operating conditions. Up to 1000°C the Ergun equation is reliable but it requires a knowledge of the particle shape factor and bed voidage for its application. Bed voidage is found to vary with temperature for laminar gas flow conditions.
Paralleling changes in gas flow conditions with operating temperature are changes in bed-to-surface heat transfer coefficients. There is a distinct transition from the interphase gas convective to the particle convec- tive component of heat transfer being the dominant mechanism as the operating temperature increases and Red reduces through 12.5 at Ar - 26000. This is thought to be a consequence of change in bed bubbling behavior.
1. INTRODUCTION
Although many of the applications of fluidization involve high temperature opera- tions, most of the available design correlations are based on experimental work car- ried out under ambient temperature conditions. Increasing the temperature of opera- tion reduces the operating Reynolds Number through the consequent changes in the gas thermophysical properties. This may be sufficient to change the flow conditions from turbulent, through transitional to laminar depending upon the particle size and the range of operating temperatures. Little has been done to test the published corre- lations in the practically important situation of higher temperature operation, but Desai et ol.,' for example, reported a marked discrepancy between measured min- imum fluidizing velocities, Urn,, using values of the physical properties appropriate to the temperature of operation.
el dart^ classified powders according t o their fluidization characteristics and di- vided them into four categories. In the studies reported we have concen- trated on the behaviour of his Group "B" and "D" type materials. The former are those of intermediate particle size and density. Beds of these bubble as soon as the minimum fluidizing velocity is exceeded and vertical bubble coalescence occurs in them. The latter are large, denser particles giving beds characterized by more unsta- ble fluidization; bubbles tend to coalesce crosswise and are then less effective in gen- erating solids mixing.
2. EXPERIMENTAL EQUIPMENT AND PROCEDURE
The experimental beds were contained within a 188 mm diameter stainless steel cylin- der. Lower operating temperatures (<250°C) were obtained by heating the fluidizing
Dow
nloa
ded
by [
Mos
kow
Sta
te U
niv
Bib
liote
] at
10:
39 1
2 N
ovem
ber
2013

228 J.S.M. BOTTERILL, Y. TEOMAN AND K.R. Y ~ R E G I R
air electrically. Intermediate temperatures were obtained by burning propane at a gas burner inserted into the air supply pipework just before it joined the plenum chamber beneath the distributor. Higher temperatures (>700°C) were obtained by burning propane directly within the bed. Either of two stainless steel distributor plates having 0.5 and 1.0 mm diameter holes drilled on a 6 mm square pitch were used to introduce the fluidizing gas according to the required gas flow rates. Flows were measured using rotameters and an orifice plate which were calibrated against dry gas meters. Packed and fluidized bed pressure drops were measured using a water manometer connected t o a 5 mm 0 . D stainless steel tube inserted down to the level of the distrib- utor. Either of two slow response differential probes made out of 1.5 mm 0 . D stain- less steel tubes with taps 14 and 23 mm apart vertically were used for the estimation of bed voidages following Doichev and ~ o i c h e v . ~
Bed temperature was monitored using Chromel/Alumel thermocouples and bed- to-surface heat transfer coefficients were measured by following the rate of change of temperature of small'spheres (about 9.5 mm diameter) when they were immersed in the bed. Different metals were used for the spheres including gold (in order to have a surface of known low emissivity) all of which had Biot numbers less than 3 X 10-'so that thermocouples inserted into them indicated their surface temperatures. The E M F developed between the couple within a sphere and one inserted into the bed in- dicated the bed-to-surface temperature difference directly. This was recorded on a potentiometer with a logarithmic scale so that the slope of the trace gave a direct measure of the bed-to-surface heat transfer coefficient. Jigs were used so that the heat transfer spheres could be positioned accurately as desired within the bed.
When the bed was heated by burning propane within the air, the gas thermophysi- cal properties were estimated on the assumption that the fluidizing gas was a mixture of air and complete combustion products of the introduced propane. The properties of the bed materials are summarized in Table I.
In all the experiments, the bed was first vigorously fluidized and brought up to the required uniform temperature. The minimum fluidizing velocity was determined in the usual way from plots of bed pressure drop against superficial gas ve~oc i ty .~ Thus,
TABLE I
Properties of particles used in fluidization studies
Mean Particle Diameter Size Range Density Shape Factora
Material (urn) (um) (kdm') (-) .. . .. . . - .
Sand 380 3 10-475 2600 Sand 460 353-600 2670 Sand 530 500-699 2580 Sand 660 475-880 2600 Sand 780 532-880 2600 Sand 890 880-1 130 2540 Sand 1280 699-1400 2670 Sand 2320 1620-3040 2610 Coal Ash 820 2 10-4000 1590 Alumina 370 250-500 3640 Alumina 980 800- 1040 3960 Alumina 1150 1040-1210 3960 Glass Ballotini 1040 1200-850 2820
'as described in text
Dow
nloa
ded
by [
Mos
kow
Sta
te U
niv
Bib
liote
] at
10:
39 1
2 N
ovem
ber
2013

FLUIDIZED BED BEHAVIOUR 229
when the bed was at the required temperature it was slumped and a series of bed pres- sure drop readings taken as the gas flow rate was increased. After reaching the fully fluidized condition, the bed's temperature uniformity was checked before repeating the series of measurements as the gas flow rate was decreased. Measurements were discounted if there was more than 10°C variation in bed temperature throughout the series. Apart from the experiments with the ash of wide size distribution, when there was a tendency for segregation to occur, the transition between the fixed and packed bed condition was always distinct although instabilities in the gas flow under certain conditions (see below) could affect the packed bed condition.
* 3. RESULTS AND DISCUSSION
3.1 Variation in Umr and e,r
The minimum fluidizing velocity, Umf, decreased with increasing temperature for smaller. Group "B" particles because of the consequent increase in gas viscosity (Figure 1). However, the reduction was not as large as the viscosity increase would lead one to expect. This was because the voidage a t minimum fluidization was also varying.4 For larger Group "D" particles there was an increase in minimum fluidiz- ing velocity with increasing temperature because the gas flow is in the turbulent or transitional regime and the gas density is then an important factor (Figure 2). At higher temperatures still, the minimum fluidizing velocity begins to reduce as the flow condition changes and the gas viscosity again becomes the significant factor.
Some hysteresis effects were noted in the measured pressure drops between increas- ing and decreasing gas flow at the point of fluidization and the onset of fixed bed conditions. These occurred in the case of tests with the 2320 e m sand when unstable combustion was occurring at the burner (Figure 2) and with finer particle measure- ments at lower gas flow rates after the rig had been modified and the air was supplied by a Rootes blower that had difficulty delivering the low flow rate then required against the necessary back-pressure. The effect was tracked back to the consequence of pulsations affecting the degree of compaction of the packed bed.
A summary of the typical range of minimum fluidization voidage variations ob- served is given in Figure 3. Thus, emf increased with increasing temperature for smaller particles (Group "B"), but remained constant for large particles (Group "D"). Under transitional flow conditions, the voidage against gas velocity plots did not give a linear plot on log/log paper and there were distinct but reproducible dis- con t inu i t i e~ .~ With these measurements, tm/could not be found by direct extrapola- tion back to U/Umf = 1 but was taken to be that value measured at the closest opera- ble velocity to Umf (at higher temperatures in particular, bed temperature could not be maintained close to Umf because there was insufficient combustion oxygen in the fluid- izing air to burn the propane).
Estimation of the minimum fluidizing velocity as the gas flow rate through the packed bed with voidage emf which will produce a pressure drop equal to that of the bed per unit area,' leads to the form:
This makes very apparent the sensitivity of the minimum fluidization velocity to the
Dow
nloa
ded
by [
Mos
kow
Sta
te U
niv
Bib
liote
] at
10:
39 1
2 N
ovem
ber
2013

230 J.S.M. BOTTERILL, Y. TEOMAN AND K.R. YUREGIR
- WIA decreasing
200 -
150 U mmk
I 011 L I I U,,=105 mmls I Remf=0.513
- WIA
200 -
, 150 U mmls
FIGURE I Typical pressure drop-gas velocity measurements; narrow size distribution sand, dp=460 pm.
bed voidage. In the laminar flow regime (Rem/ < 1) there would be an error of 38% in the prediction of Ud if there is an error of 10% in the estimate of emf. The corre- sponding value for the turbulent flow regime (Remf > 1000) is 15%. Apart from the problem of estimating emf, there is the additional difficulty of estimating the shape factor. d. There is no simple way that it can be done for a mixture of particles o r even . ,
for single irregular ~ e r i n e k ' ' argues that the morphological shape factor cannot be used because similarly shaped particles behave differently according to the - - flow regime: Therefore, shape factors have been derived to fit the Ergun equation fol- lowing other w ~ r k e r s ~ ~ l l ~ ' ~ Table I. Variations in I$ between measurements with a par- ticular bed were negligible. Measured values of Um/have been found to be in excellent agreement with the predictions of Eq. 1 over a range of temperatures when using the
Dow
nloa
ded
by [
Mos
kow
Sta
te U
niv
Bib
liote
] at
10:
39 1
2 N
ovem
ber
2013

FLUIDIZED BED BEHAVIOUR 23 1
FIGURE 2 Typical pressure drop-gas velocity measurements; fora bed of large particles: d, = 2320 urn narrow size distribution sand.
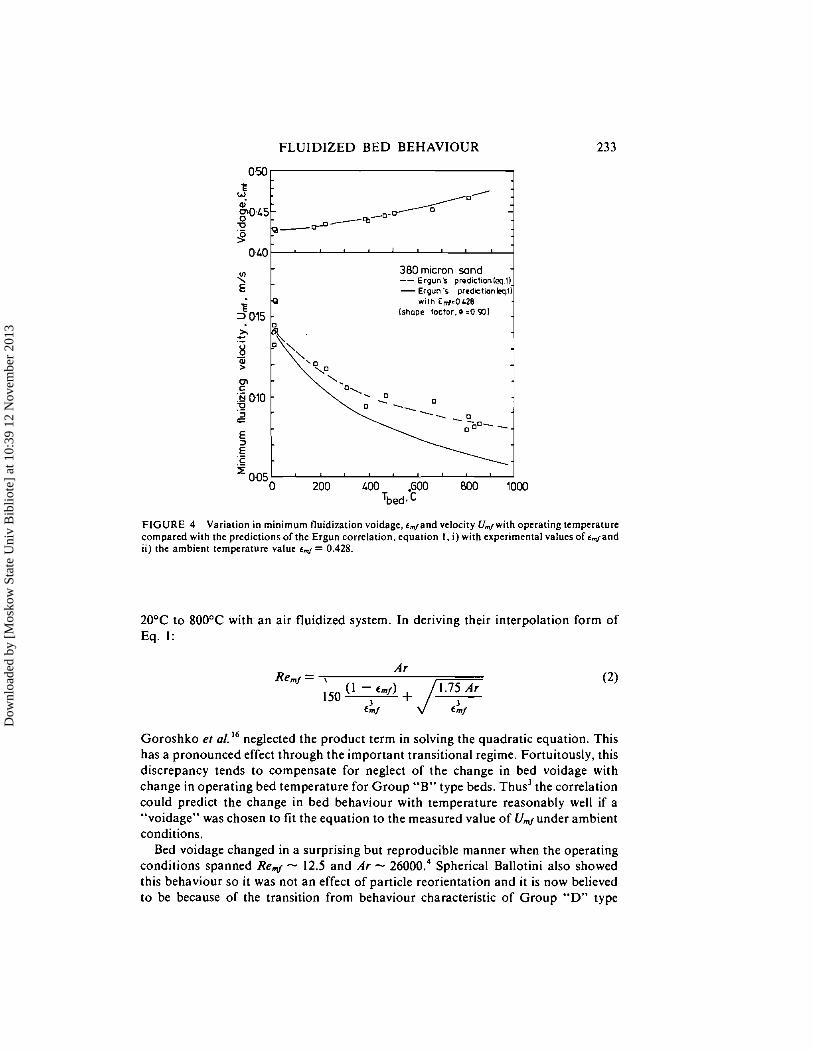
measured values of €,,,I and a typical series of measurements is shown in Figure 4. Predictions made using only the ambient temperature voidage are also shown.
Many correlations have been suggested for the prediction of Urn/. We have tested more than 50 of them. Whereas sometimes the fit is good over a limited range of experimental conditions, no correlation was consistently good over the full range of our tests. Of published results for Group "B" materials covering a range of operating
Dow
nloa
ded
by [
Mos
kow
Sta
te U
niv
Bib
liote
] at
10:
39 1
2 N
ovem
ber
2013

232 J.S.M. BOTTERILL, Y. TEOMAN AND K.R. YOREGIR
050
0 . ~ 8 -
0 4 6
O.LL
0-L2-.
- 0 . ~ 8 E
W P6 8 0 4 L
0
Vd" t 2320micron s a n d ' i
o.l.0. 0 - - . - % y *
/-I I
250 500 750 0 250 500 750
380 micron s a n d , - -/*'* k
FIGURE 3 Variation in minimum fluidization voidage with increasing bed temperature for beds of var- ious mean particle diameter sand.
I
780 micron s a n d
1;
5 DLO 0 250 500 750 0 250 500 750
- L6O micron s a n d
- a/*<-
-
- 1280 micron s a n d - -
/*::la >*-*-- -- -
O , L ~ 3
.: 0.L6
2 DLL
0.L2
temperature^'."^" there are consistent trends which could be accounted for by change in e,,,/with temperature. It is not surprising that attempts to average out the effect of voidage and shape, such as the correlation of Wen and YU" should have only limited applicability.
Many practical fluidized bed applications encompass the transitional range of flow conditions. Typically, the Archimedes number falls within the range 10' to lo6 and there is approximately a 20-fold increase in Ar as the temperature increases from
- 890 micron s a n d .'- .* ' -
- 530 micron s a n d
-
- /* -,/a Y *
'0,L2+' -- -
Dow
nloa
ded
by [
Mos
kow
Sta
te U
niv
Bib
liote
] at
10:
39 1
2 N
ovem
ber
2013
FLUIDIZED BED BEHAVIOUR
380 micron sand
FIGURE 4 Variation in minimum fluidization voidage, *./and velocity U./with operating temperature compared wilh the predictions of the Ergun correlation, equalion I , i) with experimental values of r,,,,and ii) :he ambient temperature value r d = 0.428.
20°C to 800°C with an air fluidized system. In deriving their interpolation form of Eq. 1:
Goroshko er neglected the product term in solving the quadratic equation. This has a pronounced effect through the important transitional regime. Fortuitously, this discrepancy tends to compensate for neglect of the change in bed voidage with change in operating bed temperature for Group "B" type beds. ~ h u s ' the correlation could predict the change in bed behaviour with temperature reasonably well if a "voidage" was chosen to fit the equation to the measured value of UMunder ambient conditions.
Bed voidage changed in a surprising but reproducible manner when the operating conditions spanned Red - 12.5 and Ar - 26000.4 Spherical Ballotini also showed this behaviour so it was not an effect of particle reorientation and it is now believed to be because of the transition from behaviour characteristic of Group "D" type
Dow
nloa
ded
by [
Mos
kow
Sta
te U
niv
Bib
liote
] at
10:
39 1
2 N
ovem
ber
2013

234 J.S.M. BOTTERILL, Y. TEOMAN AND K.R. YUREGIR
material to "B" as the operating temperature increases and Re,, reduces. A corre- sponding change in bed-to-surface heat transfer occurs as outlined below.
3.2 Heat Transfer Behaviour
With beds of larger mean particle diameter, Group "D" type materials, the bubbles within the bed are less effective in generating particle mixing and the interstitial gas flow is turbulent or transitional in character. The interphase gas convective compo- nent of heat transfer, h,,, is then more important than the particle convective compo- nent, hPc, which dominates with beds of "A" and "B" type materials.'So it is that the maximum in the bed-to-surface heat transfer coefficient as a function of gas flow rate becomes less pronounced and may disappear altogether if the bed is operated at temperatures where the radiative component is significant because, with more bub- bles opening up a sight of the core of the bed, radiant transfer will be enhanced. The simple Zabrodsky equation:"
h,, ... = 35.8&* k y d F 3 6
where the dimensional constant is given for SI units, predicts the maximum bed-to-
700
600
Y
' 9 0
5
8 L
LOO
300 0 200 LOO 600 800 1000
Thd ,.C
FIGURE 5 Variations in maximum bed-to-surface heat transfer coefficient, h,.., with operating temperature compared with predictions o f the zabrodskyl' correlation. Eq. 3. for beds o f sand o f different particle sizes.
Dow
nloa
ded
by [
Mos
kow
Sta
te U
niv
Bib
liote
] at
10:
39 1
2 N
ovem
ber
2013

FLUIDIZED BED BEHAVIOUR 235
surface heat transfer coefficient and its dependence on temperature through the change in gas thermal conductivity very well for Geldart's Group "B" materials (Figure 5). When radiant transfer begins to become significant above 600°C the meas- ured value lies increasingly above the Zabrodsky prediction except with the experi- ments with the gold transfer surface of low emissivity for which the close correspond- ence continues. Empirical correlations derived for Group "DM materials in earlier studiesi8 predicted the maximum coefficients with beds of alumina closely (Figure 6). The assumption in deriving these correlations was that the particle convective and in- terphase gas convective components are additive and that the heat transfer coefficient at U4 is a measure of the interphase gas convective component. Thus:
for the gas convective component was based on the heat transfer coefficient to the quiescent bed and:
for the maximum particle convective component was obtained by difference. (Al-
450 - . a0 - .
Y N 8 B .E 3350- D
B . 0
L . 300 - 0
8 ---- ___. -. __ -- ..a-
250 - / - - 5 ..-ff 980 m u o n Alumlm
,/H o Gold Copper probe probe - Zobrodsky's
200- predictlo" ieq. 31 -- Denloye and
Botterdl '5 predictionleq.1.51
FIGURE 6 Variation in maximum bed-to-surface heat transfer coefficient, h,... with operating temper- ature compared with predictions o f the Zabrodskyl' correlation. Eq. 3, and the Denloye and Botterili correlations," Eqs. 4 and 5 . for alumina of mean diameter 980 pm.
Dow
nloa
ded
by [
Mos
kow
Sta
te U
niv
Bib
liote
] at
10:
39 1
2 N
ovem
ber
2013

236 J.S.M. BOTTERILL, Y. TEOMAN AND K.R. YUREGIR
though the bed in the quiescent state is not then mobile, the assumption that hmf is a measure of h,, is not strictly valid because there will be some conductive heat transfer through the gas between particle and surface augmenting hgc).
As noted above, there is an apparent transition between behaviour characteristics of "D" type materials to that of Group "9" where the particle convective component with its stronger temperature dependence becomes important. Previously, we re- ported the occurence of this from experiments with sand of mean diameter 1280 pm with which the transition temperature corresponding to ReM - 12.5 and A r - 26000 is 425°C. With 980 pm alumina the cprresponding temperature is 600°C (Figure 6). Incidentally, the ineffectiveness of stirring generated by the bubbles in "D" type beds was observed visually while starting combustion within this alumina bed. A layer of red hot particles formed above the stagnant, otherwise, cold bed and, even when the bed was vigorously fluidized, the hot material was not being mixed into the bed as happens quickly with "A" and "9" type beds.
The difference between the measured heat transfer coefficients to the oxidised copper and gold spheres is, to a first approximation, a measure of the radiant com- ponent of heat transfer. This did not exceed 14% of the total coefficient over the range of temperatures investigated.
Many fundamental models have been proposed to predict h,, and h,, but these cannot generally be applied for predictive purposes because the limiting conditions and thermal properties of the bed adjacent to the heat transfer surface are unknown.
Predictions based on some of the more frequently quoted empirical correlations have been tested against our experimental measurementss and we find that they give much scatter between themselves and, as with the correlations for Umf, d o not fit our tests over their full range. Each reflects the fluidization conditions and especially the solids mixing patterns specific to the equipment in which the experimental data was derived. Mostly, too, they were derived from data gathered at temperatures close to ambient. Some attempt to allow for the variation in coefficient with fluidizing gas ve- locity. This requires parameters descriptive of the bed condition which are dependent on Umf and vary with ern/; a factor in turn dependent on temperature for "9" type beds as we have described above. We recommended the correlations in Eqs. 3-5 which give reasonable predictions and are very easy to use.
Ambient condition tests will underestimate the attainable coefficients at higher op- erating temperatures and pressures because of the effect of temperature on gas ther- mal conductivity, the transition between "Dm and "B" type behaviour and the effect of pressure on the magnitude of the interphase gas convective component with "D" type materials.
CONCLUSIONS
1. For beds of particles of Geldart's Group "B", the voidage at minimum fluidiza- tion varies with operating temperature. We cannot susgest why this change should occur but neglect of i t accounts for the unreliability of correlations for the prediction of urn/.
2. Given appropriate values for em/ and @, the Ergun equation predicts Umf over the range of temperatures used in these tests well.
Dow
nloa
ded
by [
Mos
kow
Sta
te U
niv
Bib
liote
] at
10:
39 1
2 N
ovem
ber
2013

FLUIDIZED BED BEHAVIOUR 237
3. Transition between behaviour characteristic of material of Group "B" and "D" types is associated with change in operating conditions through Remf - 12.5 a t Ar - 26000.
4. Maximum bed-to-surface heat transfer coefficients increase with increasing bed operating temperature with Group "B" materials because of the increase in gas thermal conductivity; the limiting factor in the particle convective component of heat transfer. The proportion of heat transfer attributable to radiation increased above bed temperatures of 600°C but did not exceed 14% of the maximum bed-to-surface transfer at 950°C.
5. We recommend the use of simple empirical correlations (Eq. 3 for Group "B" materials and Eqs. 4 and 5 for Group "D" beds) and advocate a rule of thumb esti- mate of the radiative component as being as reliable as use of the many more compli- cated published correlations and models.
NOMENCLATURE
Ar = d' (" - Archimedes number r :
Rern/ = urn/ P, 4 PC
mean particle diameter (m)
acceleration due to gravity (m/s2)
interphase gas convective heat transfer coefficient (w/m2K)
maximum bed-to-surface heat transfer coefficient ( w / m 2 ~ )
maximum particle convective heat transfer coefficient (w/m2K)
thermal conductivity of gas (W/mK)
bed temperature (OC)
fluidizing gas velocity (m/s)
minimum fluidizing gas velocity (m/s)
bed weight per unit cross-sectional area (kg/m2)
bed pressure drop (mm H20)
bed voidage at minimum fluidization (-)
absolute viscosity of gas ( ~ s / m ' )
density of gas (kg/m3)
density of particles (kg/m3)
REFERENCES
1 . Desai, A. , Kikukawa, H., and Pulsifer, A. H . , Powder Technology, 16, 143 (1977). 2. Geldart, D., Powder Technology, 7, 285 (1973).
Dow
nloa
ded
by [
Mos
kow
Sta
te U
niv
Bib
liote
] at
10:
39 1
2 N
ovem
ber
2013

238 J.S.M. BOTTERILL, Y. TEOMAN AND K.R. YUREGlR
3. Botterill, J.S.M., and Teoman, Y., 1980 in "Fluidization," Grace, J.R., and Matscn, J.M. (ed), 93, Plenum Pub. Corp. N.Y.
4. Botterill, J.S.M., Teoman, Y., and Yuregir, K.R., Powder Technology, 31, 101 (1982). 5. Botterill, J.S.M., Teoman, Y., and Yuregir, K.R.. A.1.Ch.E. Symp. Series, 77, No 208, 330 (1981). 6. Doichev, K., and Boichev, G. , Powder Technology, 17, 91 (1977). 7. Ergun, S., Chem. Ens. Prog., 48, 89 (1952). A
8. Krumbein, W.C., Journol of Sedimentary Petrology, 11, 64 (No 2, 1941). 9. Standish, N., and McGregor, G., Chem. Eng. Sci., 33, 618 (1978).
10. Berdnek, J.. British Chem. Eng., 3, 385 (1958). I I . Saxena, S.C., and Vogel, G.J., Transactions of I. Chem. E., 55, 184 (1977). 12. Pata, J., and Hartman, M., Ind. Eng. Chem. Process Des. Dev., 17, 231 (1978). 13. Monteiro, J.L.F., and Saddy, M., Private Communication, (1979). 14. Doheim. M.A.. and Collinge, C.N.. Powder Technology. 21. 289 (1978). IS. Wen, C.Y., and Yu, Y.H., A.I.Ch.E. Journal, 12, 619 (1965). 16. Goroshko, V.D.. Rozenbaum, R.B., and Todes, O.H., Irvesriya Vuzov. Neffi Gar, 1, 125 (1958). 17. Zabrodsky. S.S., "Hydrodynamics and Heat Transfer in Fluidized Beds," M.I.T. Press. Mass. (1966). 18. Denloye. A.O.O., and Botterill. J.S.M.. Powder Technology, 19, 197 (1978).
Dow
nloa
ded
by [
Mos
kow
Sta
te U
niv
Bib
liote
] at
10:
39 1
2 N
ovem
ber
2013