the effect of silica nanoparticle-modified surfaces on cell morphology, cytoskeletal organization...
TRANSCRIPT
lable at ScienceDirect
Biomaterials 29 (2008) 3836–3846
Contents lists avai
Biomaterials
journal homepage: www.elsevier .com/locate/biomater ia ls
The effect of silica nanoparticle-modified surfaces on cell morphology,cytoskeletal organization and function
Anna M. Lipski a, Christopher J. Pino b, Frederick R. Haselton b, I.-Wei Chen a, V. Prasad Shastri a,b,*
a Department of Materials Science and Engineering, University of Pennsylvania, Philadelphia, PA 19104, USAb Department of Biomedical Engineering, Vanderbilt University, Nashville, TN 37235, USA
a r t i c l e i n f o
Article history:Received 10 March 2008Accepted 7 June 2008Available online 7 July 2008
Keywords:Focal adhesionsF-actin fibersNanoroughnessEndothelial cellsPreosteoblastsNano-mechanotransduction
* Corresponding author. Department of BiomedicalCenter, Station B #351631, Vanderbilt University, Nash615 322 8005; fax: þ1 615 343 7919.
E-mail addresses: [email protected], pShastri).
0142-9612/$ – see front matter � 2008 Elsevier Ltd.doi:10.1016/j.biomaterials.2008.06.002
a b s t r a c t
Chemical and morphological characteristics of a biomaterial surface are thought to play an importantrole in determining cellular differentiation and apoptosis. In this report, we investigate the effect ofnanoparticle (NP) assemblies arranged on a flat substrate on cytoskeletal organization, proliferation andmetabolic activity on two cell types, Bovine aortic endothelial cells (BAECs) and mouse calvarial pre-osteoblasts (MC3T3-E1). To vary roughness without altering chemistry, glass substrates were coated withmonodispersed silica nanoparticles of 50, 100 and 300 nm in diameter. The impact of surface roughnessat the nanoscale on cell morphology was studied by quantifying cell spreading, shape, cytoskeletalF-actin alignment, and recruitment of focal adhesion complexes (FAC) using image analysis. Metabolicactivity was followed using a thiazolyl blue tetrazolium bromide assay. In the two cell types tested,surface roughness introduced by nanoparticles had cell type specific effects on cell morphology andmetabolism. While BAEC on NP-modified substrates exhibited smaller cell areas and fewer focal adhesioncomplexes compared to BAEC grown on glass, MC3T3-E1 cells in contrast exhibited larger cell areas onNP-modified surfaces and an increased number of FACs, in comparison to unmodified glass. However,both cell types on 50 nm NP had the highest proliferation rates (comparable to glass control) whereascells grown on 300 nm NP exhibited inhibited proliferation. Interestingly, for both cell types surfaceroughness promoted the formation of long, thick F-actin fibers, which aligned with the long axis of eachcell. These findings are consistent with our earlier result that osteogenic differentiation of humanmesenchymal progenitor cells is enhanced on NP-modified surfaces. Our finding that nanoroughness, asimparted by nanoparticle assemblies, effects cellular processes in a cell specific manner, can have farreaching consequences on the development of ‘‘smart’’ biomaterials especially for directing stem celldifferentiation.
� 2008 Elsevier Ltd. All rights reserved.
1. Introduction
It is well established that a biomaterial’s surface characteristicscan alter cell behavior at many levels. Biological processes, such asdifferentiation, growth, and apoptosis, are arbitrated by cell shapeand cytoskeletal organization directly determined by cell/surfaceinteraction [1,2]. For example, DNA synthesis in a cell is closelycoupled with cell spreading (i.e., shape of cell) on a surface [3]. Theinteraction of cells with a given material surface is dependent uponboth surface texture (topography) and chemistry [4]. Micron sizedfeatures such as channels and ridges have been used to alter cellshape and alignment [5]. Many strategies have been explored to
Engineering, 5824 Stevensonville, TN 37235, USA. Tel.: þ1
[email protected] (V.P.
All rights reserved.
create micro and nanoscale topography on surfaces, such as litho-graphy, chemical and plasma etching, grit blasting and plasmaspraying, among others [6–9]. However, many chemical and topo-graphical modification techniques are material specific, and areincompatible with cells and biological substrates. A new paradigmfor nanoscale engineering of a biomaterial surface was recentlyreported [10]. In this paradigm, an assembly of silica nanoparticles(NP) is used to impart well-defined texture and roughness toa surface, which is varied by controlling the size of the NP. Fur-thermore, through a priori modification of the NP, both chemistryand topography (texture, roughness) of a biomaterial surface canbe modified in a single step. An important attribute of NP-basedsurface modification is that the surface modification occurs inde-pendent of the bulk properties of the biomaterial and is equallysuitable for modifying metal and polymer substrates [10]. Theutility of silica NP in surface modification lies in the easewith which silica surfaces can be modified to bear a wide range offunctional groups and biological moieties.
A.M. Lipski et al. / Biomaterials 29 (2008) 3836–3846 3837
It has been shown that NP-modified surfaces can dramaticallyenhance the differentiation of human marrow derived mesenchy-mal progenitor cells towards an osteogenic lineage in the presenceof soluble signaling molecules [10]. NP-modified surfaces, there-fore, present a new paradigm for probing the effects of surface-bound information on cell shape and function, as the effects oftexture and chemistry can be decoupled [10]. Secondary advan-tages of this strategy include control over surface roughness andsurface area, ease of modification of non-planar macro-surfaces,and coating conditions that are compatible with biological sub-strates and proteins. In this paper we analyze the effects of silica NPassemblies on cell morphology through quantification of cellspreading, F-actin alignment and area of focal adhesions, in addi-tional to functional metrics namely, proliferation and metabolicactivity.
2. Materials and methods
2.1. Silica nanoparticle (NP) synthesis and characterization
Using the Stober process, monodispersed silica NPs of three distinct mean di-ameters (50, 100 and 300 nm) were synthesized by varying the ratios of tetrae-thylorthosilicate (TEOS), ammonium hydroxide, and deionized water. All ethanol(EtOH) used for NP production was 200-proof (Fisher Scientific, Springfield, NJ, USA).
For NP synthesis, two solutions were prepared: one containing TEOS (Sigma-Aldrich, St. Louis, MO, USA) and EtOH, and the other composed of ammonium hy-droxide, deionized water, and EtOH. Specifically, for the 50 nm NP, 4.2 g of TEOS wasmixed with EtOH to a total volume of 50 ml. Next, a solution comprised of 2.5 g ofammonium hydroxide and 1.2 g of deionized water was made in EtOH (50 ml totalvolume). The ammonium–water–EtOH solution was slowly added to the TEOS–EtOHsolution with stirring and the final mixture was further stirred overnight to allow forNP coarsening. The aforementioned procedure was also used to create the 100 and300 nm NPs and the corresponding amounts of TEOS, ammonium hydroxide, anddeionized water are listed in Table 1. NP size and polydispersity were determinedusing dynamic laser light scattering (ZetaSizer 3000HS; Malvern Instruments Ltd.,Malvern, UK). For each of the three different desired NP diameters, the reported lightscattering values are the average � standard deviation (SD) as shown in Table 1 andare representative of 10 different silica NP batches that were made. Additionally, foreach batch of silica NP, the value that is calculated by the light scattering technique isin itself an average of 10 separate measurements.
2.2. Preparation of NP-modified glass substrates
The conditions for modifying surfaces with NP assemblies were optimized in anearlier study [10]. First, glass slides (Fisher Scientific, Springfield, NJ, USA) weremanually cut using a diamond tip pen into squares approximately 1 cm2, and ul-trasonically cleaned for 5 min in hexane, acetone, ethanol, and deionized water,respectively, and oven-dried at 60 �C for 24 h prior to use. Before NP deposition,substrates were removed from the oven and allowed to cool for at least 1 h. SilicaNPs were assembled via spin coating (Cost Effective Equipment, Brewer Science, Inc.,Rolla, MO, USA). Specifically, 100 ml of the NP suspension was pipetted onto thesurface, and the sample was spun at 2000 rpm for 20 s. This was repeated 10 timesfor each sample, allowing 1–2 min drying periods between depositions. Lastly, thesilica NP-modified samples were heat treated at 80 �C for 2 h. The non-NP-modifiedglass slides were subjected to the same treatments and were used as experimentalcontrols. Twenty four hours prior to cell seeding all experimental surfaces weresterilized by treatment with 70% ethanol for 20 min followed by overnight drying ina sterile laminar flow hood.
Table 1Reaction conditions for the preparation of silica NPs of various sizes
Desiredsize (nm)
TEOS (g) Ammoniumhydroxide (g)
Deionizedwater (g)
Average NP size(nm) as measuredvia laser lightscattering
Averagepolydispersityindex (PDI)
50 4.167 2.5 1.2 52.0 � 2.96 0.06 � 0.03100 4.167 3.26 1.94 107.3 � 6.3 0.02 � 0.02300 4.167 7.1 5.5 299.3 � 7.7 0.06 � 0.20
The corresponding sizes were measured via light scattering and values are themean � standard deviation.
2.3. Characterization of NP-modified glass surfaces
Representative NP-modified glass substrates were characterized using scanningelectron microscopy (SEM) and atomic force microscopy (AFM) and these data havebeen previously reported [10]. SEM images were obtained on a JEOL 6300FV mi-croscope at an accelerating voltage of 10 kV and at a vacuum pressure of3 � 10�6 torr. Additionally, during SEM, elemental composition of all surfaces waselucidated by energy dispersive X-ray spectroscopy (EDX/EDS).
AFM was used for the topographical contour mapping and roughness analysis ofNP-modified surfaces. Surfaces were mapped in the tapping mode using a Multi-mode AFM (Digital Instruments, Santa Barbara, CA, USA) equipped with a pre-fabricated cantilever. A scan rate of 0.4–0.5 Hz was used, and all images wereacquired at 512 sample points/line scan for maximum resolution. Images werecaptured and analyzed using Nanoscope� III software package provided by themanufacturer. All AFM images were obtained using the same cantilever and iden-tical scanning conditions.
Surface roughness measurements, reported as the root-mean-square roughness(Rq) were carried out on images of randomly selected 1 �1 mm regions. The Rq valuesreported represent an average of six measurements (three samples; two locationsper sample that were at least several millimeters apart). Statistical differences be-tween NP-modified surfaces and control surfaces were analyzed using paired t-testsin Excel, values are reported as the mean � SD, and p < 0.05 was consideredsignificant.
2.4. Cell culture
Culture media, trypsin, penicillin-streptomycin, and sodium bicarbonate werepurchased from Invitrogen Corporation (Carlsbad, CA, USA). Fetal bovine serumwas from HyClone (Logan, UT, USA). All other chemicals and products were fromSigma-Aldrich (St. Louis, MO, USA) unless otherwise stated. All cells were culturedin a humidified, constant temperature (37 �C) environment containing 5% carbondioxide (CO2).
Bovine aortic endothelial cells (BAEC) were harvested as previously described[11] provided by the laboratory of Keith Gooch, Ph.D. (Department of BiomedicalEngineering, The Ohio State University, Columbus, OH, USA) and were cultured inDulbecco’s Modified Eagle Medium (DMEM), supplemented with 10% fetal bovineserum (FBS), and 1% penicillin-streptomycin (P/S), at 37 �C in a 5% CO2. The absenceof fibroblast contamination was verified visually. BAECs used in this study werebetween passages 3–9. Mouse calvarial preosteoblasts (MC3T3-E1) were purchasedfrom ATCC (Manassas, VA, USA) and were cultured in alpha minimum essentialmedium (a-MEM) supplemented with 10% FBS, 1% P/S.
For all cell experiments in this study, cells were seeded on the sterilized NP-modified substrates, glass (Gl) and tissue culture polystyrene (TCPS) at an initialdensity of 3000 cells/cm2, and were maintained in standard cell culture conditions(37 �C, 5% CO2). In these studies both glass and TCPS served as positive controls.
2.5. Cell proliferation assay
BAEC and MC3T3 cells were seeded onto silica NP-modified, glass and TCPSsurfaces and incubated over a 7-day period under standard cell culture conditions(37 �C, 5% CO2). Media was replaced every other day of culture, and at the prescribedtime points (24, 48, 96 and 168 h), and substrates were gently washed twice withPBS, then fixed with 4% paraformaldehyde (10 min), followed by another PBS wash(three times). Nuclei were stained using DAPI mounting medium from Vector Lab-oratories (Burlingame, CA, USA). Samples were stored in the dark at 4 �C untilimaged.
The DAPI stained nuclei of cells were visualized with a Zeiss Axioplan2microscope and the number of cells in a 3 � 3 mm grid at 100� magnificationwere counted manually. Two samples per surface and cell type were set asidefor cell proliferation measurements, and the reported values are the mean � SD.
2.6. Metabolic activity assay
Cell metabolic activity was assessed by thiazolyl blue tetrazolium bromide assay(MTT reagent, Sigma-Aldrich) [12]. BAEC and MC3T3 were seeded on unmodifiedglass, silica NP-modified glass substrates and TCPS surfaces, and on designated timepoints (24, 48, 96, 168 h post seeding) the MTT assay was performed. Specifically,cultures were removed from the incubator and into the sterile laminar flow hoodwhere the substrates were placed into new 12-well TCPS plates (one sample/well),and MTT solution (5 mg/ml made in RPMI-1640 without phenol red) was asepticallyadded to each well. Immediately after MTT addition, samples were incubated for anadditional 4 h. Following the incubation period, MTT solution was gently aspiratedfrom each well, and formazan crystals were dissolved by the addition of 1 ml/well of0.1 N HCl (prepared in anhydrous isopropanol). The absorbance of each sample wasmeasured at 570 nm using a BioSpec-1601 spectrophotometer (Shimadzu Corpo-ration, Columbia, MD, USA). MTT experiments were carried out on three separateoccasions, and in triplicate for each substrate tested (TCPS, glass (GL), 50, 100, and300 nm silica NP-modified surfaces) and cell types (BAEC and MC3T3-E1). All valuesare reported as the mean � SD.
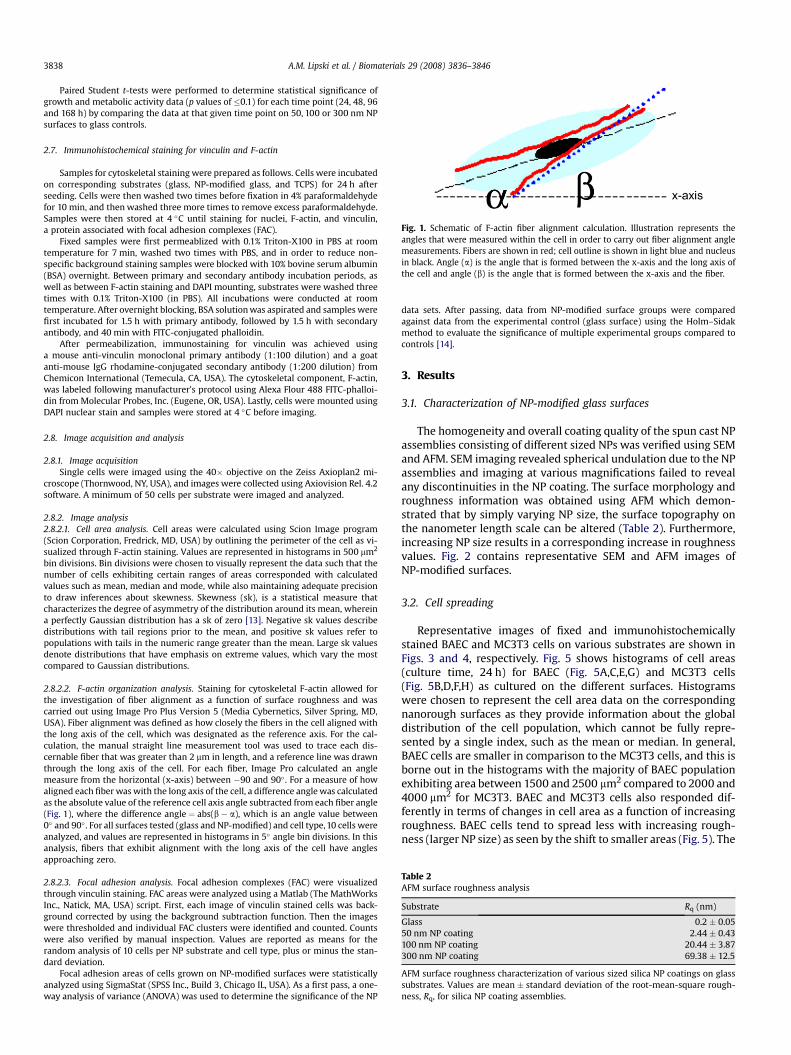
Fig. 1. Schematic of F-actin fiber alignment calculation. Illustration represents theangles that were measured within the cell in order to carry out fiber alignment anglemeasurements. Fibers are shown in red; cell outline is shown in light blue and nucleusin black. Angle (a) is the angle that is formed between the x-axis and the long axis ofthe cell and angle (b) is the angle that is formed between the x-axis and the fiber.
Table 2AFM surface roughness analysis
Substrate Rq (nm)
Glass 0.2 � 0.0550 nm NP coating 2.44 � 0.43100 nm NP coating 20.44 � 3.87300 nm NP coating 69.38 � 12.5
AFM surface roughness characterization of various sized silica NP coatings on glasssubstrates. Values are mean � standard deviation of the root-mean-square rough-ness, Rq, for silica NP coating assemblies.
A.M. Lipski et al. / Biomaterials 29 (2008) 3836–38463838
Paired Student t-tests were performed to determine statistical significance ofgrowth and metabolic activity data (p values of �0.1) for each time point (24, 48, 96and 168 h) by comparing the data at that given time point on 50, 100 or 300 nm NPsurfaces to glass controls.
2.7. Immunohistochemical staining for vinculin and F-actin
Samples for cytoskeletal staining were prepared as follows. Cells were incubatedon corresponding substrates (glass, NP-modified glass, and TCPS) for 24 h afterseeding. Cells were then washed two times before fixation in 4% paraformaldehydefor 10 min, and then washed three more times to remove excess paraformaldehyde.Samples were then stored at 4 �C until staining for nuclei, F-actin, and vinculin,a protein associated with focal adhesion complexes (FAC).
Fixed samples were first permeablized with 0.1% Triton-X100 in PBS at roomtemperature for 7 min, washed two times with PBS, and in order to reduce non-specific background staining samples were blocked with 10% bovine serum albumin(BSA) overnight. Between primary and secondary antibody incubation periods, aswell as between F-actin staining and DAPI mounting, substrates were washed threetimes with 0.1% Triton-X100 (in PBS). All incubations were conducted at roomtemperature. After overnight blocking, BSA solution was aspirated and samples werefirst incubated for 1.5 h with primary antibody, followed by 1.5 h with secondaryantibody, and 40 min with FITC-conjugated phalloidin.
After permeabilization, immunostaining for vinculin was achieved usinga mouse anti-vinculin monoclonal primary antibody (1:100 dilution) and a goatanti-mouse IgG rhodamine-conjugated secondary antibody (1:200 dilution) fromChemicon International (Temecula, CA, USA). The cytoskeletal component, F-actin,was labeled following manufacturer’s protocol using Alexa Flour 488 FITC-phalloi-din from Molecular Probes, Inc. (Eugene, OR, USA). Lastly, cells were mounted usingDAPI nuclear stain and samples were stored at 4 �C before imaging.
2.8. Image acquisition and analysis
2.8.1. Image acquisitionSingle cells were imaged using the 40� objective on the Zeiss Axioplan2 mi-
croscope (Thornwood, NY, USA), and images were collected using Axiovision Rel. 4.2software. A minimum of 50 cells per substrate were imaged and analyzed.
2.8.2. Image analysis2.8.2.1. Cell area analysis. Cell areas were calculated using Scion Image program(Scion Corporation, Fredrick, MD, USA) by outlining the perimeter of the cell as vi-sualized through F-actin staining. Values are represented in histograms in 500 mm2
bin divisions. Bin divisions were chosen to visually represent the data such that thenumber of cells exhibiting certain ranges of areas corresponded with calculatedvalues such as mean, median and mode, while also maintaining adequate precisionto draw inferences about skewness. Skewness (sk), is a statistical measure thatcharacterizes the degree of asymmetry of the distribution around its mean, whereina perfectly Gaussian distribution has a sk of zero [13]. Negative sk values describedistributions with tail regions prior to the mean, and positive sk values refer topopulations with tails in the numeric range greater than the mean. Large sk valuesdenote distributions that have emphasis on extreme values, which vary the mostcompared to Gaussian distributions.
2.8.2.2. F-actin organization analysis. Staining for cytoskeletal F-actin allowed forthe investigation of fiber alignment as a function of surface roughness and wascarried out using Image Pro Plus Version 5 (Media Cybernetics, Silver Spring, MD,USA). Fiber alignment was defined as how closely the fibers in the cell aligned withthe long axis of the cell, which was designated as the reference axis. For the cal-culation, the manual straight line measurement tool was used to trace each dis-cernable fiber that was greater than 2 mm in length, and a reference line was drawnthrough the long axis of the cell. For each fiber, Image Pro calculated an anglemeasure from the horizontal (x-axis) between �90 and 90� . For a measure of howaligned each fiber was with the long axis of the cell, a difference angle was calculatedas the absolute value of the reference cell axis angle subtracted from each fiber angle(Fig. 1), where the difference angle ¼ abs(b � a), which is an angle value between0� and 90� . For all surfaces tested (glass and NP-modified) and cell type, 10 cells wereanalyzed, and values are represented in histograms in 5� angle bin divisions. In thisanalysis, fibers that exhibit alignment with the long axis of the cell have anglesapproaching zero.
2.8.2.3. Focal adhesion analysis. Focal adhesion complexes (FAC) were visualizedthrough vinculin staining. FAC areas were analyzed using a Matlab (The MathWorksInc., Natick, MA, USA) script. First, each image of vinculin stained cells was back-ground corrected by using the background subtraction function. Then the imageswere thresholded and individual FAC clusters were identified and counted. Countswere also verified by manual inspection. Values are reported as means for therandom analysis of 10 cells per NP substrate and cell type, plus or minus the stan-dard deviation.
Focal adhesion areas of cells grown on NP-modified surfaces were statisticallyanalyzed using SigmaStat (SPSS Inc., Build 3, Chicago IL, USA). As a first pass, a one-way analysis of variance (ANOVA) was used to determine the significance of the NP
data sets. After passing, data from NP-modified surface groups were comparedagainst data from the experimental control (glass surface) using the Holm–Sidakmethod to evaluate the significance of multiple experimental groups compared tocontrols [14].
3. Results
3.1. Characterization of NP-modified glass surfaces
The homogeneity and overall coating quality of the spun cast NPassemblies consisting of different sized NPs was verified using SEMand AFM. SEM imaging revealed spherical undulation due to the NPassemblies and imaging at various magnifications failed to revealany discontinuities in the NP coating. The surface morphology androughness information was obtained using AFM which demon-strated that by simply varying NP size, the surface topography onthe nanometer length scale can be altered (Table 2). Furthermore,increasing NP size results in a corresponding increase in roughnessvalues. Fig. 2 contains representative SEM and AFM images ofNP-modified surfaces.
3.2. Cell spreading
Representative images of fixed and immunohistochemicallystained BAEC and MC3T3 cells on various substrates are shown inFigs. 3 and 4, respectively. Fig. 5 shows histograms of cell areas(culture time, 24 h) for BAEC (Fig. 5A,C,E,G) and MC3T3 cells(Fig. 5B,D,F,H) as cultured on the different surfaces. Histogramswere chosen to represent the cell area data on the correspondingnanorough surfaces as they provide information about the globaldistribution of the cell population, which cannot be fully repre-sented by a single index, such as the mean or median. In general,BAEC cells are smaller in comparison to the MC3T3 cells, and this isborne out in the histograms with the majority of BAEC populationexhibiting area between 1500 and 2500 mm2 compared to 2000 and4000 mm2 for MC3T3. BAEC and MC3T3 cells also responded dif-ferently in terms of changes in cell area as a function of increasingroughness. BAEC cells tend to spread less with increasing rough-ness (larger NP size) as seen by the shift to smaller areas (Fig. 5). The
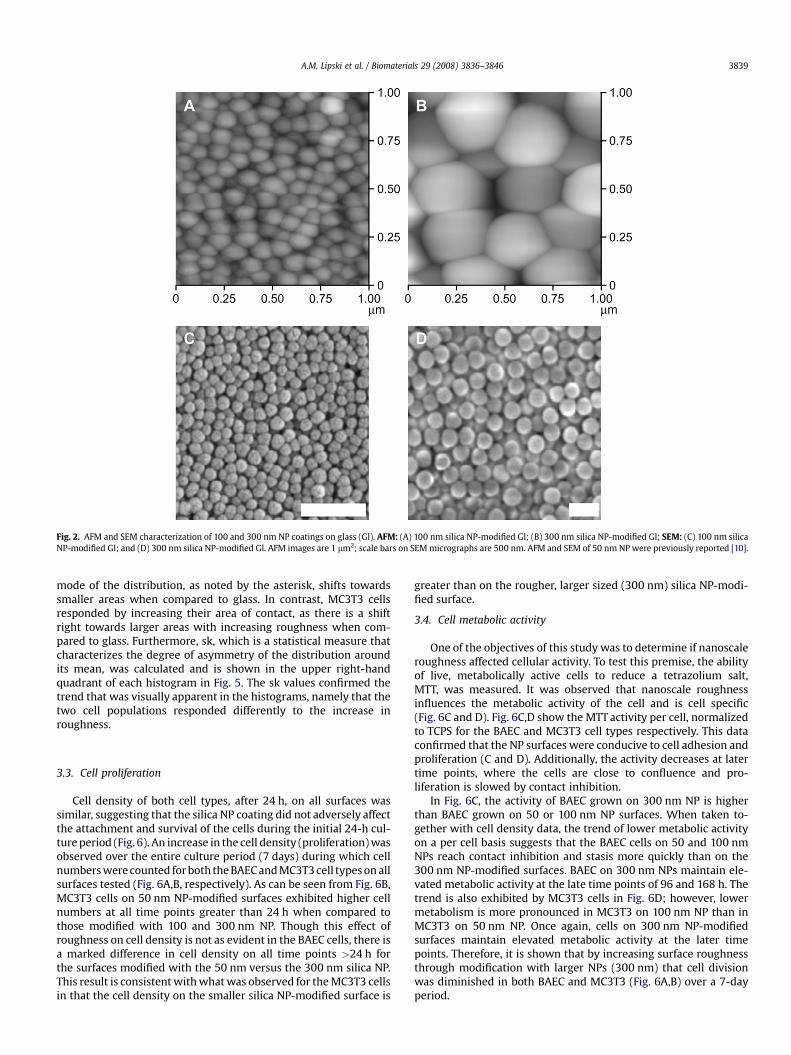
Fig. 2. AFM and SEM characterization of 100 and 300 nm NP coatings on glass (Gl). AFM: (A) 100 nm silica NP-modified Gl; (B) 300 nm silica NP-modified Gl; SEM: (C) 100 nm silicaNP-modified Gl; and (D) 300 nm silica NP-modified Gl. AFM images are 1 mm2; scale bars on SEM micrographs are 500 nm. AFM and SEM of 50 nm NP were previously reported [10].
A.M. Lipski et al. / Biomaterials 29 (2008) 3836–3846 3839
mode of the distribution, as noted by the asterisk, shifts towardssmaller areas when compared to glass. In contrast, MC3T3 cellsresponded by increasing their area of contact, as there is a shiftright towards larger areas with increasing roughness when com-pared to glass. Furthermore, sk, which is a statistical measure thatcharacterizes the degree of asymmetry of the distribution aroundits mean, was calculated and is shown in the upper right-handquadrant of each histogram in Fig. 5. The sk values confirmed thetrend that was visually apparent in the histograms, namely that thetwo cell populations responded differently to the increase inroughness.
3.3. Cell proliferation
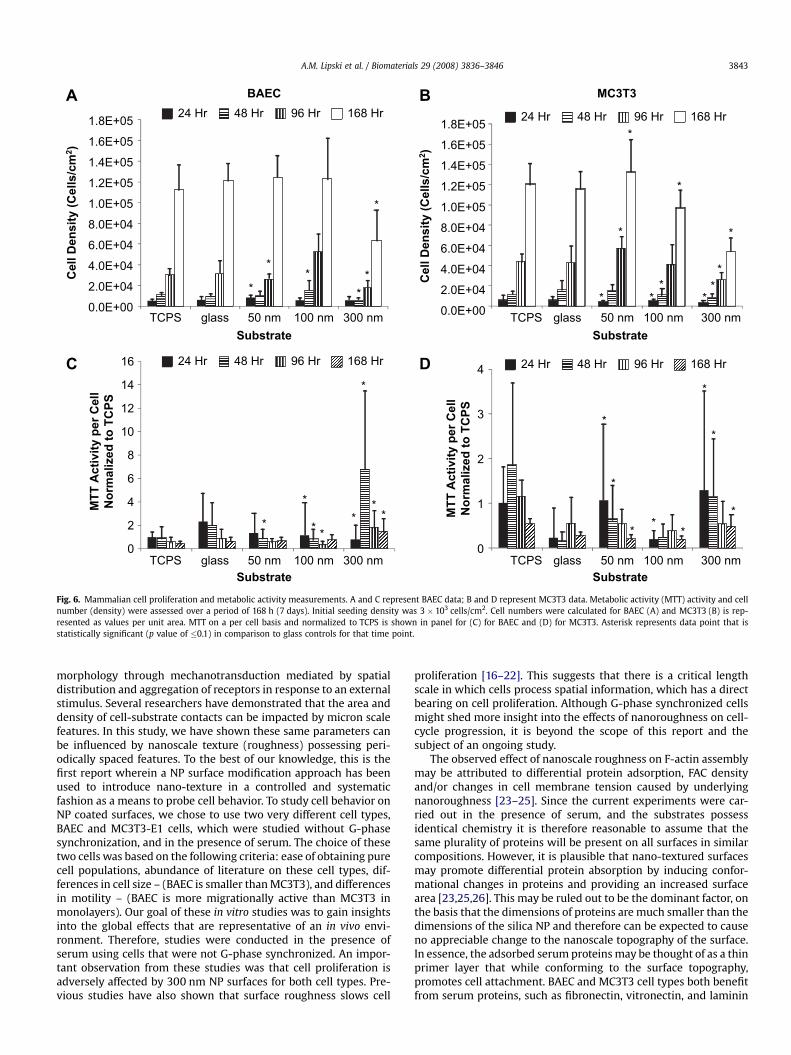
Cell density of both cell types, after 24 h, on all surfaces wassimilar, suggesting that the silica NP coating did not adversely affectthe attachment and survival of the cells during the initial 24-h cul-ture period (Fig. 6). An increase in the cell density (proliferation) wasobserved over the entire culture period (7 days) during which cellnumbers were counted for both the BAEC and MC3T3 cell types on allsurfaces tested (Fig. 6A,B, respectively). As can be seen from Fig. 6B,MC3T3 cells on 50 nm NP-modified surfaces exhibited higher cellnumbers at all time points greater than 24 h when compared tothose modified with 100 and 300 nm NP. Though this effect ofroughness on cell density is not as evident in the BAEC cells, there isa marked difference in cell density on all time points >24 h forthe surfaces modified with the 50 nm versus the 300 nm silica NP.This result is consistent with what was observed for the MC3T3 cellsin that the cell density on the smaller silica NP-modified surface is
greater than on the rougher, larger sized (300 nm) silica NP-modi-fied surface.
3.4. Cell metabolic activity
One of the objectives of this study was to determine if nanoscaleroughness affected cellular activity. To test this premise, the abilityof live, metabolically active cells to reduce a tetrazolium salt,MTT, was measured. It was observed that nanoscale roughnessinfluences the metabolic activity of the cell and is cell specific(Fig. 6C and D). Fig. 6C,D show the MTT activity per cell, normalizedto TCPS for the BAEC and MC3T3 cell types respectively. This dataconfirmed that the NP surfaces were conducive to cell adhesion andproliferation (C and D). Additionally, the activity decreases at latertime points, where the cells are close to confluence and pro-liferation is slowed by contact inhibition.
In Fig. 6C, the activity of BAEC grown on 300 nm NP is higherthan BAEC grown on 50 or 100 nm NP surfaces. When taken to-gether with cell density data, the trend of lower metabolic activityon a per cell basis suggests that the BAEC cells on 50 and 100 nmNPs reach contact inhibition and stasis more quickly than on the300 nm NP-modified surfaces. BAEC on 300 nm NPs maintain ele-vated metabolic activity at the late time points of 96 and 168 h. Thetrend is also exhibited by MC3T3 cells in Fig. 6D; however, lowermetabolism is more pronounced in MC3T3 on 100 nm NP than inMC3T3 on 50 nm NP. Once again, cells on 300 nm NP-modifiedsurfaces maintain elevated metabolic activity at the later timepoints. Therefore, it is shown that by increasing surface roughnessthrough modification with larger NPs (300 nm) that cell divisionwas diminished in both BAEC and MC3T3 (Fig. 6A,B) over a 7-dayperiod.
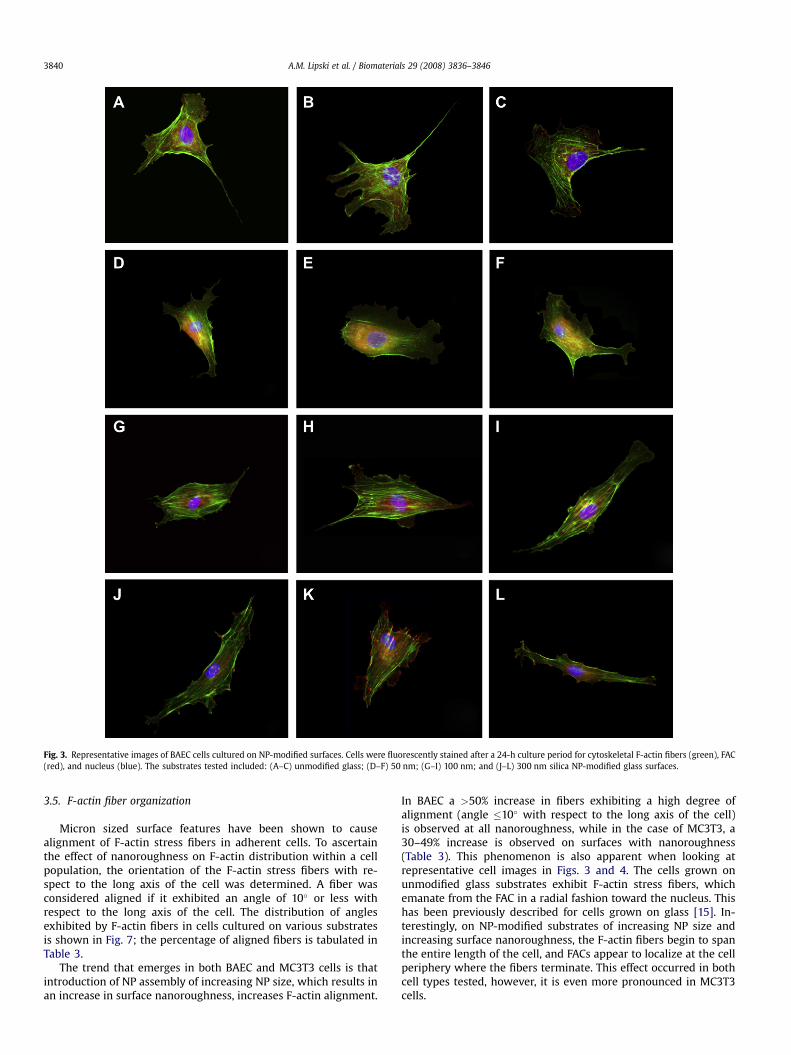
Fig. 3. Representative images of BAEC cells cultured on NP-modified surfaces. Cells were fluorescently stained after a 24-h culture period for cytoskeletal F-actin fibers (green), FAC(red), and nucleus (blue). The substrates tested included: (A–C) unmodified glass; (D–F) 50 nm; (G–I) 100 nm; and (J–L) 300 nm silica NP-modified glass surfaces.
A.M. Lipski et al. / Biomaterials 29 (2008) 3836–38463840
3.5. F-actin fiber organization
Micron sized surface features have been shown to causealignment of F-actin stress fibers in adherent cells. To ascertainthe effect of nanoroughness on F-actin distribution within a cellpopulation, the orientation of the F-actin stress fibers with re-spect to the long axis of the cell was determined. A fiber wasconsidered aligned if it exhibited an angle of 10� or less withrespect to the long axis of the cell. The distribution of anglesexhibited by F-actin fibers in cells cultured on various substratesis shown in Fig. 7; the percentage of aligned fibers is tabulated inTable 3.
The trend that emerges in both BAEC and MC3T3 cells is thatintroduction of NP assembly of increasing NP size, which results inan increase in surface nanoroughness, increases F-actin alignment.
In BAEC a >50% increase in fibers exhibiting a high degree ofalignment (angle �10� with respect to the long axis of the cell)is observed at all nanoroughness, while in the case of MC3T3, a30–49% increase is observed on surfaces with nanoroughness(Table 3). This phenomenon is also apparent when looking atrepresentative cell images in Figs. 3 and 4. The cells grown onunmodified glass substrates exhibit F-actin stress fibers, whichemanate from the FAC in a radial fashion toward the nucleus. Thishas been previously described for cells grown on glass [15]. In-terestingly, on NP-modified substrates of increasing NP size andincreasing surface nanoroughness, the F-actin fibers begin to spanthe entire length of the cell, and FACs appear to localize at the cellperiphery where the fibers terminate. This effect occurred in bothcell types tested, however, it is even more pronounced in MC3T3cells.
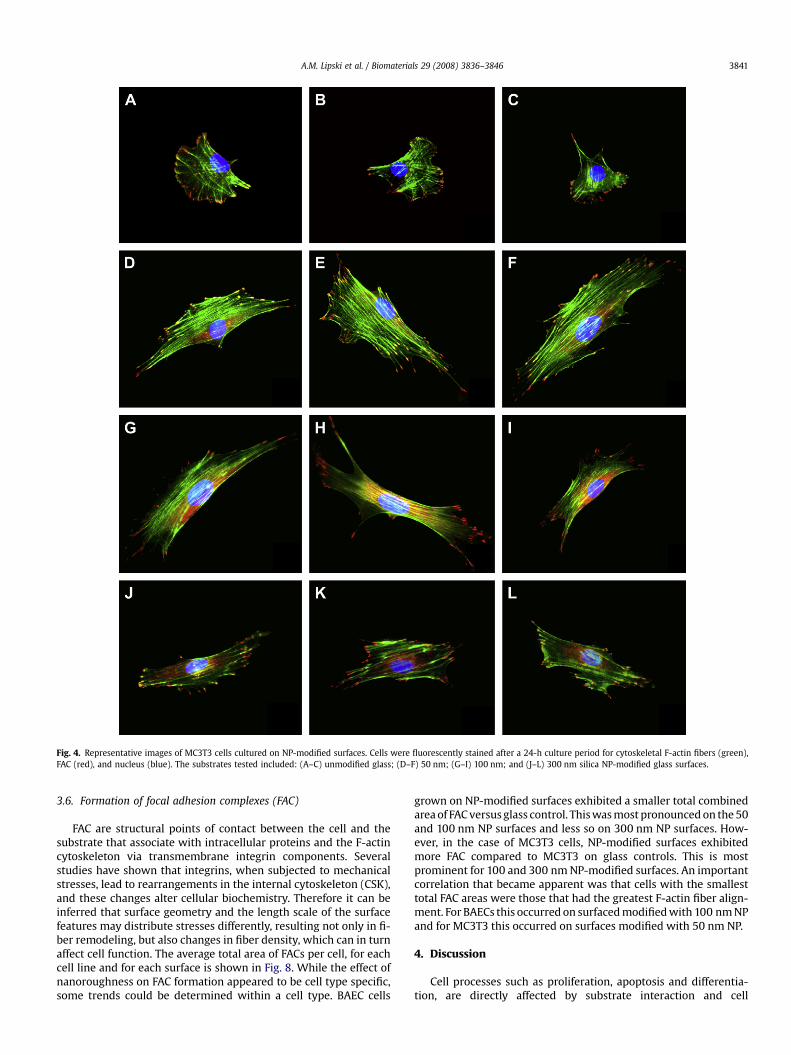
Fig. 4. Representative images of MC3T3 cells cultured on NP-modified surfaces. Cells were fluorescently stained after a 24-h culture period for cytoskeletal F-actin fibers (green),FAC (red), and nucleus (blue). The substrates tested included: (A–C) unmodified glass; (D–F) 50 nm; (G–I) 100 nm; and (J–L) 300 nm silica NP-modified glass surfaces.
A.M. Lipski et al. / Biomaterials 29 (2008) 3836–3846 3841
3.6. Formation of focal adhesion complexes (FAC)
FAC are structural points of contact between the cell and thesubstrate that associate with intracellular proteins and the F-actincytoskeleton via transmembrane integrin components. Severalstudies have shown that integrins, when subjected to mechanicalstresses, lead to rearrangements in the internal cytoskeleton (CSK),and these changes alter cellular biochemistry. Therefore it can beinferred that surface geometry and the length scale of the surfacefeatures may distribute stresses differently, resulting not only in fi-ber remodeling, but also changes in fiber density, which can in turnaffect cell function. The average total area of FACs per cell, for eachcell line and for each surface is shown in Fig. 8. While the effect ofnanoroughness on FAC formation appeared to be cell type specific,some trends could be determined within a cell type. BAEC cells
grown on NP-modified surfaces exhibited a smaller total combinedarea of FAC versus glass control. This was most pronounced on the 50and 100 nm NP surfaces and less so on 300 nm NP surfaces. How-ever, in the case of MC3T3 cells, NP-modified surfaces exhibitedmore FAC compared to MC3T3 on glass controls. This is mostprominent for 100 and 300 nm NP-modified surfaces. An importantcorrelation that became apparent was that cells with the smallesttotal FAC areas were those that had the greatest F-actin fiber align-ment. For BAECs this occurred on surfaced modified with 100 nm NPand for MC3T3 this occurred on surfaces modified with 50 nm NP.
4. Discussion
Cell processes such as proliferation, apoptosis and differentia-tion, are directly affected by substrate interaction and cell
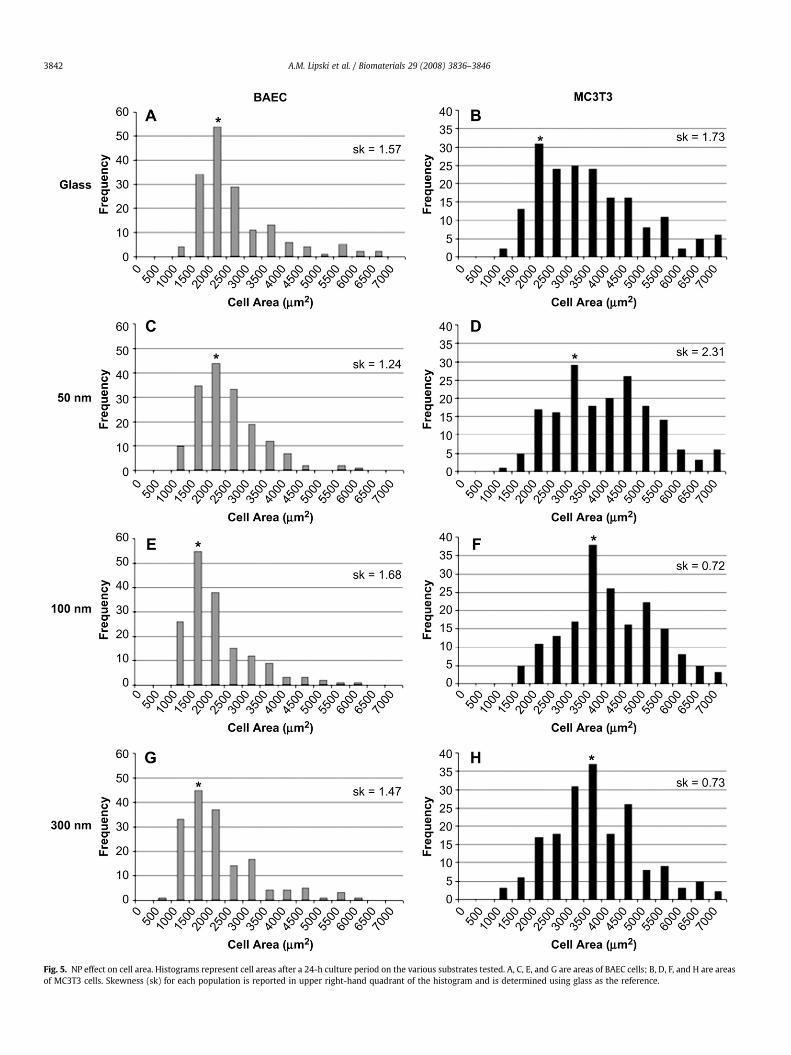
Fig. 5. NP effect on cell area. Histograms represent cell areas after a 24-h culture period on the various substrates tested. A, C, E, and G are areas of BAEC cells; B, D, F, and H are areasof MC3T3 cells. Skewness (sk) for each population is reported in upper right-hand quadrant of the histogram and is determined using glass as the reference.
A.M. Lipski et al. / Biomaterials 29 (2008) 3836–38463842
BAECA B
C D
MC3T3
0
2
4
6
8
10
12
14
16
MT
T A
ctivity p
er C
ell
No
rm
alized
to
T
CP
S
**
*
** *
0.0E+00
2.0E+04
4.0E+04
6.0E+04
8.0E+04
1.0E+05
1.2E+05
1.4E+05
1.6E+05
1.8E+05
TCPS glass 50 nm 100 nm 300 nm
Ce
ll D
en
sity
(C
ells
/c
m2)
Substrate
24 Hr 48 Hr 96 Hr 168 Hr
0.0E+00
2.0E+04
4.0E+04
6.0E+04
8.0E+04
1.0E+05
1.2E+05
1.4E+05
1.6E+05
1.8E+05
TCPS glass 50 nm 100 nm 300 nm
Ce
ll D
en
sity
(C
ells
/c
m2)
Substrate
TCPS glass 50 nm 100 nm 300 nmSubstrate
TCPS glass 50 nm 100 nm 300 nmSubstrate
0
1
2
3
4
MT
T A
ctivity p
er C
ell
No
rm
alized
to
T
CP
S
*
*
*
* *** *
*
*
*
** *
*
*
*
*
*
*
**
*
*
24 Hr 48 Hr 96 Hr 168 Hr
24 Hr 48 Hr 96 Hr 168 Hr 24 Hr 48 Hr 96 Hr 168 Hr
*
*
Fig. 6. Mammalian cell proliferation and metabolic activity measurements. A and C represent BAEC data; B and D represent MC3T3 data. Metabolic activity (MTT) activity and cellnumber (density) were assessed over a period of 168 h (7 days). Initial seeding density was 3 � 103 cells/cm2. Cell numbers were calculated for BAEC (A) and MC3T3 (B) is rep-resented as values per unit area. MTT on a per cell basis and normalized to TCPS is shown in panel for (C) for BAEC and (D) for MC3T3. Asterisk represents data point that isstatistically significant (p value of �0.1) in comparison to glass controls for that time point.
A.M. Lipski et al. / Biomaterials 29 (2008) 3836–3846 3843
morphology through mechanotransduction mediated by spatialdistribution and aggregation of receptors in response to an externalstimulus. Several researchers have demonstrated that the area anddensity of cell-substrate contacts can be impacted by micron scalefeatures. In this study, we have shown these same parameters canbe influenced by nanoscale texture (roughness) possessing peri-odically spaced features. To the best of our knowledge, this is thefirst report wherein a NP surface modification approach has beenused to introduce nano-texture in a controlled and systematicfashion as a means to probe cell behavior. To study cell behavior onNP coated surfaces, we chose to use two very different cell types,BAEC and MC3T3-E1 cells, which were studied without G-phasesynchronization, and in the presence of serum. The choice of thesetwo cells was based on the following criteria: ease of obtaining purecell populations, abundance of literature on these cell types, dif-ferences in cell size – (BAEC is smaller than MC3T3), and differencesin motility – (BAEC is more migrationally active than MC3T3 inmonolayers). Our goal of these in vitro studies was to gain insightsinto the global effects that are representative of an in vivo envi-ronment. Therefore, studies were conducted in the presence ofserum using cells that were not G-phase synchronized. An impor-tant observation from these studies was that cell proliferation isadversely affected by 300 nm NP surfaces for both cell types. Pre-vious studies have also shown that surface roughness slows cell
proliferation [16–22]. This suggests that there is a critical lengthscale in which cells process spatial information, which has a directbearing on cell proliferation. Although G-phase synchronized cellsmight shed more insight into the effects of nanoroughness on cell-cycle progression, it is beyond the scope of this report and thesubject of an ongoing study.
The observed effect of nanoscale roughness on F-actin assemblymay be attributed to differential protein adsorption, FAC densityand/or changes in cell membrane tension caused by underlyingnanoroughness [23–25]. Since the current experiments were car-ried out in the presence of serum, and the substrates possessidentical chemistry it is therefore reasonable to assume that thesame plurality of proteins will be present on all surfaces in similarcompositions. However, it is plausible that nano-textured surfacesmay promote differential protein absorption by inducing confor-mational changes in proteins and providing an increased surfacearea [23,25,26]. This may be ruled out to be the dominant factor, onthe basis that the dimensions of proteins are much smaller than thedimensions of the silica NP and therefore can be expected to causeno appreciable change to the nanoscale topography of the surface.In essence, the adsorbed serum proteins may be thought of as a thinprimer layer that while conforming to the surface topography,promotes cell attachment. BAEC and MC3T3 cell types both benefitfrom serum proteins, such as fibronectin, vitronectin, and laminin
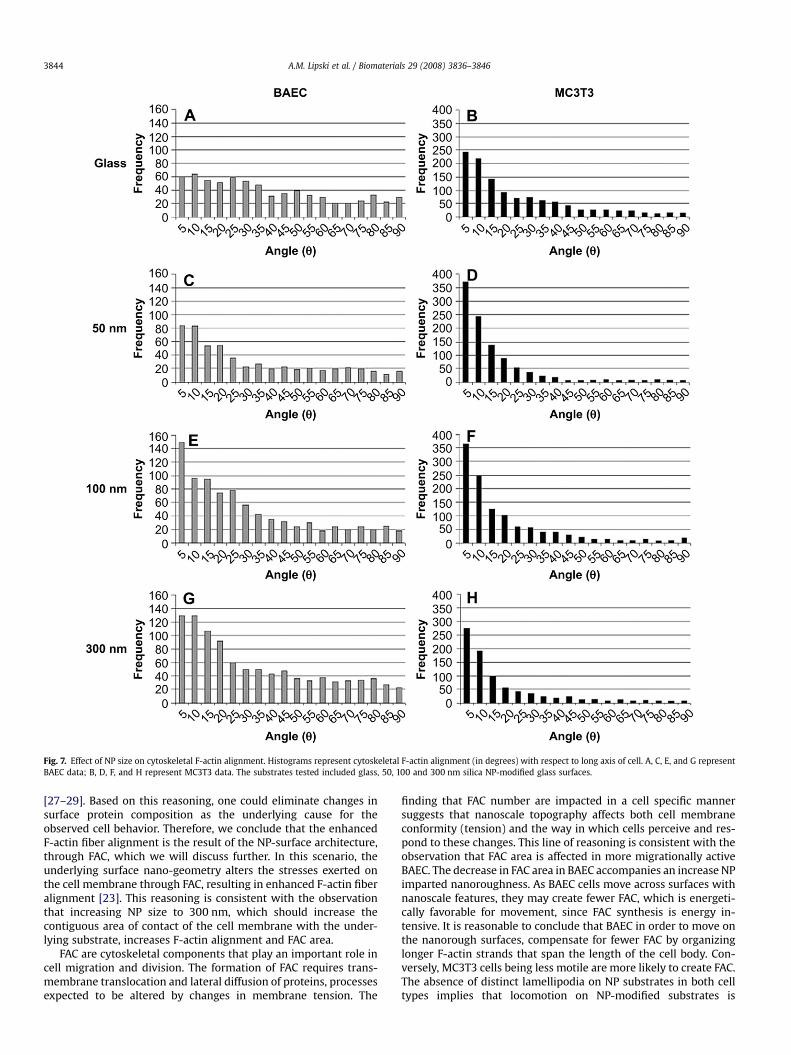
Fig. 7. Effect of NP size on cytoskeletal F-actin alignment. Histograms represent cytoskeletal F-actin alignment (in degrees) with respect to long axis of cell. A, C, E, and G representBAEC data; B, D, F, and H represent MC3T3 data. The substrates tested included glass, 50, 100 and 300 nm silica NP-modified glass surfaces.
A.M. Lipski et al. / Biomaterials 29 (2008) 3836–38463844
[27–29]. Based on this reasoning, one could eliminate changes insurface protein composition as the underlying cause for theobserved cell behavior. Therefore, we conclude that the enhancedF-actin fiber alignment is the result of the NP-surface architecture,through FAC, which we will discuss further. In this scenario, theunderlying surface nano-geometry alters the stresses exerted onthe cell membrane through FAC, resulting in enhanced F-actin fiberalignment [23]. This reasoning is consistent with the observationthat increasing NP size to 300 nm, which should increase thecontiguous area of contact of the cell membrane with the under-lying substrate, increases F-actin alignment and FAC area.
FAC are cytoskeletal components that play an important role incell migration and division. The formation of FAC requires trans-membrane translocation and lateral diffusion of proteins, processesexpected to be altered by changes in membrane tension. The
finding that FAC number are impacted in a cell specific mannersuggests that nanoscale topography affects both cell membraneconformity (tension) and the way in which cells perceive and res-pond to these changes. This line of reasoning is consistent with theobservation that FAC area is affected in more migrationally activeBAEC. The decrease in FAC area in BAEC accompanies an increase NPimparted nanoroughness. As BAEC cells move across surfaces withnanoscale features, they may create fewer FAC, which is energeti-cally favorable for movement, since FAC synthesis is energy in-tensive. It is reasonable to conclude that BAEC in order to move onthe nanorough surfaces, compensate for fewer FAC by organizinglonger F-actin strands that span the length of the cell body. Con-versely, MC3T3 cells being less motile are more likely to create FAC.The absence of distinct lamellipodia on NP substrates in both celltypes implies that locomotion on NP-modified substrates is
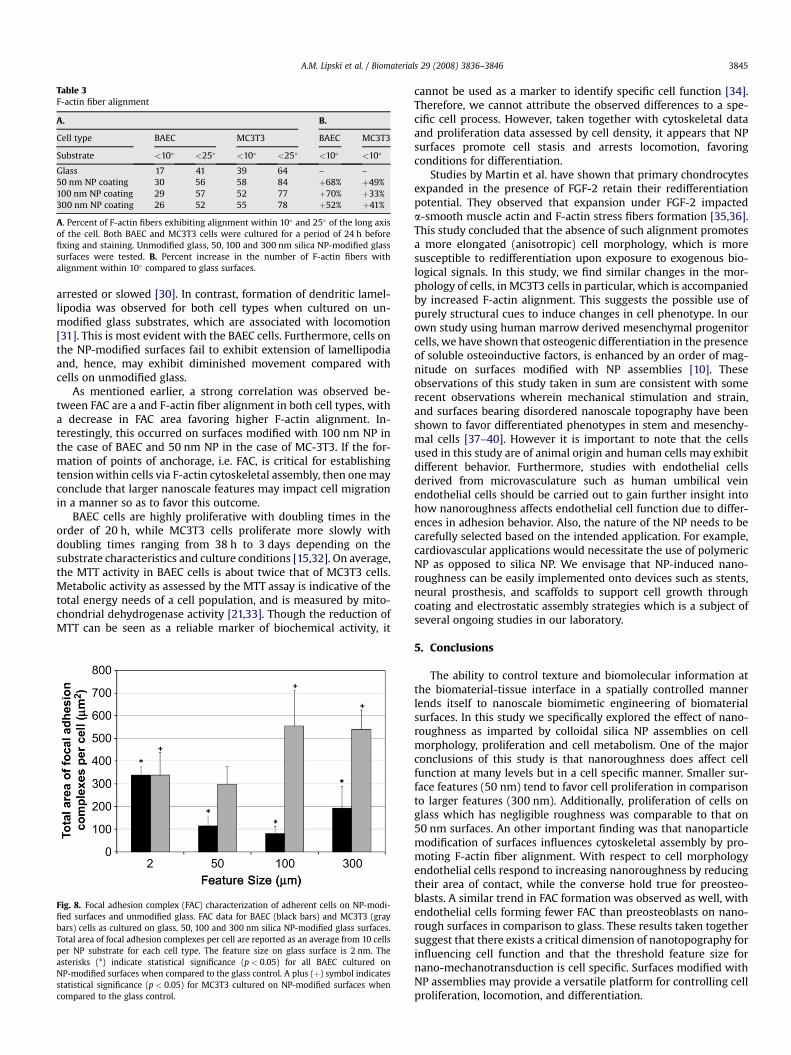
Table 3F-actin fiber alignment
A. B.
Cell type BAEC MC3T3 BAEC MC3T3
Substrate <10� <25� <10� <25� <10� <10�
Glass 17 41 39 64 – –50 nm NP coating 30 56 58 84 þ68% þ49%100 nm NP coating 29 57 52 77 þ70% þ33%300 nm NP coating 26 52 55 78 þ52% þ41%
A. Percent of F-actin fibers exhibiting alignment within 10� and 25� of the long axisof the cell. Both BAEC and MC3T3 cells were cultured for a period of 24 h beforefixing and staining. Unmodified glass, 50, 100 and 300 nm silica NP-modified glasssurfaces were tested. B. Percent increase in the number of F-actin fibers withalignment within 10� compared to glass surfaces.
A.M. Lipski et al. / Biomaterials 29 (2008) 3836–3846 3845
arrested or slowed [30]. In contrast, formation of dendritic lamel-lipodia was observed for both cell types when cultured on un-modified glass substrates, which are associated with locomotion[31]. This is most evident with the BAEC cells. Furthermore, cells onthe NP-modified surfaces fail to exhibit extension of lamellipodiaand, hence, may exhibit diminished movement compared withcells on unmodified glass.
As mentioned earlier, a strong correlation was observed be-tween FAC are a and F-actin fiber alignment in both cell types, witha decrease in FAC area favoring higher F-actin alignment. In-terestingly, this occurred on surfaces modified with 100 nm NP inthe case of BAEC and 50 nm NP in the case of MC-3T3. If the for-mation of points of anchorage, i.e. FAC, is critical for establishingtension within cells via F-actin cytoskeletal assembly, then one mayconclude that larger nanoscale features may impact cell migrationin a manner so as to favor this outcome.
BAEC cells are highly proliferative with doubling times in theorder of 20 h, while MC3T3 cells proliferate more slowly withdoubling times ranging from 38 h to 3 days depending on thesubstrate characteristics and culture conditions [15,32]. On average,the MTT activity in BAEC cells is about twice that of MC3T3 cells.Metabolic activity as assessed by the MTT assay is indicative of thetotal energy needs of a cell population, and is measured by mito-chondrial dehydrogenase activity [21,33]. Though the reduction ofMTT can be seen as a reliable marker of biochemical activity, it
Fig. 8. Focal adhesion complex (FAC) characterization of adherent cells on NP-modi-fied surfaces and unmodified glass. FAC data for BAEC (black bars) and MC3T3 (graybars) cells as cultured on glass, 50, 100 and 300 nm silica NP-modified glass surfaces.Total area of focal adhesion complexes per cell are reported as an average from 10 cellsper NP substrate for each cell type. The feature size on glass surface is 2 nm. Theasterisks (*) indicate statistical significance (p < 0.05) for all BAEC cultured onNP-modified surfaces when compared to the glass control. A plus (þ) symbol indicatesstatistical significance (p < 0.05) for MC3T3 cultured on NP-modified surfaces whencompared to the glass control.
cannot be used as a marker to identify specific cell function [34].Therefore, we cannot attribute the observed differences to a spe-cific cell process. However, taken together with cytoskeletal dataand proliferation data assessed by cell density, it appears that NPsurfaces promote cell stasis and arrests locomotion, favoringconditions for differentiation.
Studies by Martin et al. have shown that primary chondrocytesexpanded in the presence of FGF-2 retain their redifferentiationpotential. They observed that expansion under FGF-2 impacteda-smooth muscle actin and F-actin stress fibers formation [35,36].This study concluded that the absence of such alignment promotesa more elongated (anisotropic) cell morphology, which is moresusceptible to redifferentiation upon exposure to exogenous bio-logical signals. In this study, we find similar changes in the mor-phology of cells, in MC3T3 cells in particular, which is accompaniedby increased F-actin alignment. This suggests the possible use ofpurely structural cues to induce changes in cell phenotype. In ourown study using human marrow derived mesenchymal progenitorcells, we have shown that osteogenic differentiation in the presenceof soluble osteoinductive factors, is enhanced by an order of mag-nitude on surfaces modified with NP assemblies [10]. Theseobservations of this study taken in sum are consistent with somerecent observations wherein mechanical stimulation and strain,and surfaces bearing disordered nanoscale topography have beenshown to favor differentiated phenotypes in stem and mesenchy-mal cells [37–40]. However it is important to note that the cellsused in this study are of animal origin and human cells may exhibitdifferent behavior. Furthermore, studies with endothelial cellsderived from microvasculature such as human umbilical veinendothelial cells should be carried out to gain further insight intohow nanoroughness affects endothelial cell function due to differ-ences in adhesion behavior. Also, the nature of the NP needs to becarefully selected based on the intended application. For example,cardiovascular applications would necessitate the use of polymericNP as opposed to silica NP. We envisage that NP-induced nano-roughness can be easily implemented onto devices such as stents,neural prosthesis, and scaffolds to support cell growth throughcoating and electrostatic assembly strategies which is a subject ofseveral ongoing studies in our laboratory.
5. Conclusions
The ability to control texture and biomolecular information atthe biomaterial-tissue interface in a spatially controlled mannerlends itself to nanoscale biomimetic engineering of biomaterialsurfaces. In this study we specifically explored the effect of nano-roughness as imparted by colloidal silica NP assemblies on cellmorphology, proliferation and cell metabolism. One of the majorconclusions of this study is that nanoroughness does affect cellfunction at many levels but in a cell specific manner. Smaller sur-face features (50 nm) tend to favor cell proliferation in comparisonto larger features (300 nm). Additionally, proliferation of cells onglass which has negligible roughness was comparable to that on50 nm surfaces. An other important finding was that nanoparticlemodification of surfaces influences cytoskeletal assembly by pro-moting F-actin fiber alignment. With respect to cell morphologyendothelial cells respond to increasing nanoroughness by reducingtheir area of contact, while the converse hold true for preosteo-blasts. A similar trend in FAC formation was observed as well, withendothelial cells forming fewer FAC than preosteoblasts on nano-rough surfaces in comparison to glass. These results taken togethersuggest that there exists a critical dimension of nanotopography forinfluencing cell function and that the threshold feature size fornano-mechanotransduction is cell specific. Surfaces modified withNP assemblies may provide a versatile platform for controlling cellproliferation, locomotion, and differentiation.
A.M. Lipski et al. / Biomaterials 29 (2008) 3836–38463846
Acknowledgment
This work was supported in part by National Institutes of Health(R24 AI-47739-03) sub-award to VPS, an NSF IGERT Fellowship andan Ada I. Pressman Memorial Scholarship given by the Society ofWomen Engineers to AML, The Nanotechnology Institute, throughthe Ben-Franklin Technology Partners of Northeastern Pennsylva-nia, and graduate fellowship to CJP through National Institute ofHealth Vascular Training Grant (NIH HL 0775).
References
[1] Boudreau N, Bissell MJ. Extracellular matrix signaling: integration of form andfunction in normal and malignant cells. Curr Opin Cell Biol 1998;10(5):640–6.
[2] Schwartz MA, Ginsberg MH. Networks and crosstalk: integrin signallingspreads. Nat Cell Biol 2002;4(4):E65–8.
[3] Folkman J, Moscona A. Role of cell shape in growth control. Nature 1978;273(5661):345–9.
[4] Jayagopal A, Shastri VP. Nanoengineering of biomaterial surfaces. In:Kumar CS, editor. Nanotechnologies for the life sciences: cell, organ, and tissueengineering. Weinheim: Wiley-VCH; 2008. p. 461–505.
[5] Ohara PT, Buck RC. Contact guidance in vitro. A light, transmission, andscanning electron microscopic study. Exp Cell Res 1979;121(2):235–49.
[6] Flemming RG, Murphy CJ, Abrams GA, Goodman SL, Nealey PF. Effects ofsynthetic micro- and nano-structured surfaces on cell behavior. Biomaterials1999;20(6):573–88.
[7] Itala A, Ylanen HO, Yrjans J, Heino T, Hentunen T, Hupa M, et al. Character-ization of microrough bioactive glass surface: surface reactions and osteoblastresponses in vitro. J Biomed Mater Res 2002;62(3):404–11.
[8] Nitschke M, Schmack G, Janke A, Simon F, Pleul D, Werner C. Low pressureplasma treatment of poly(3-hydroxybutyrate): toward tailored polymer sur-faces for tissue engineering scaffolds. J Biomed Mater Res 2002;59(4):632–8.
[9] Wu MH, Park C, Whitesides GM. Generation of submicrometer structures byphotolithography using arrays of spherical microlenses. J Colloid Interface Sci2003;265(2):304–9.
[10] Lipski AM, Jaquiery C, Choi H, Eberli D, Stevens M, Martin I, et al. Nanoscaleengineering of biomaterial surfaces. Adv Mater 2007;19(4):553–7.
[11] Bourke BM, Roche WR, Appleberg M. Endothelial cell harvest for seedingvascular prostheses: the influence of technique on cell function, viability, andnumber. J Vasc Surg 1986 Sep;4(3):257–63.
[12] MossmanT. Rapid colorimetric assay forcellular growth and survival: applicationto proliferation and cytotoxicity assays. J Immunological Met 1983;(65):55–63.
[13] Mandrekar SJ, Mandrekar JN. Are our data symmetric? Stat Methods Med Res2003 Dec;12(6):505–13.
[14] Ludbrook J. Multiple comparison procedures updated. Clin Exp PharmacolPhysiol 1998 Dec;25(12):1032–7.
[15] Augustin-Voss HG, Voss AK, Pauli BU. Senescence of aortic endothelial cells inculture: effects of basic fibroblast growth factor expression on cell phenotype,migration, and proliferation. J Cell Physiol 1993;157(2):279–88.
[16] Anselme K, Linez P, Bigerelle M, Le Maguer D, Le Maguer A, Hardouin P, et al.The relative influence of the topography and chemistry of TiAl6V4 surfaces onosteoblastic cell behaviour. Biomaterials 2000;21(15):1567–77.
[17] Boyan BD, Hummert TW, Dean DD, Schwartz Z. Role of material surfaces inregulating bone and cartilage cell response. Biomaterials 1996;17(2):137–46.
[18] Ingber DE. Tensegrity II. How structural networks influence cellular in-formation processing networks. J Cell Sci 2003;116(Pt 8):1397–408.
[19] Kieswetter K, Schwartz Z, Hummert TW, Cochran DL, Simpson J, Dean DD, et al.Surface roughness modulates the local production of growth factors andcytokines by osteoblast-like MG-63 cells. J Biomed Mater Res 1996;32(1):55–63.
[20] Lincks J, Boyan BD, Blanchard CR, Lohmann CH, Liu Y, Cochran DL, et al.Response of MG63 osteoblast-like cells to titanium and titanium alloy is
dependent on surface roughness and composition. Biomaterials 1998;19(23):2219–32.
[21] Maniotis AJ, Bojanowski K, Ingber DE. Mechanical continuity and reversiblechromosome disassembly within intact genomes removed from living cells.J Cell Biochem 1997;65(1):114–30.
[22] Martin JY, Schwartz Z, Hummert TW, Schraub DM, Simpson J, Lankford Jr J,et al. Effect of titanium surface roughness on proliferation, differentiation, andprotein synthesis of human osteoblast-like cells (MG63). J Biomed Mater Res1995 Mar;29(3).
[23] Curtis AS, Gadegaard N, Dalby MJ, Riehle MO, Wilkinson CD, Aitchison G. Cellsreact to nanoscale order and symmetry in their surroundings. IEEE TransNanobiosci 2004;3(1):61–5.
[24] Webster TJ, Ergun C, Doremus RH, Siegel RW, Bizios R. Specific proteinsmediate enhanced osteoblast adhesion on nanophase ceramics. J BiomedMater Res 2000;51(3):475–83.
[25] Webster TJ, Schadler LS, Siegel RW, Bizios R. Mechanisms of enhanced osteo-blast adhesion on nanophase alumina involve vitronectin. Tissue Eng 2001;7(3):291–301.
[26] Burridge K, Chrzanowska-Wodnicka M. Focal adhesions, contractility, andsignaling. Annu Rev Cell Dev Biol 1996;12:463–518.
[27] Norris WD, Steele JG, Johnson G, Underwood PA. Serum enhancementof human endothelial cell attachment to and spreading on collagens I andIV does not require serum fibronectin or vitronectin. J Cell Sci 1990;95(Pt 2):255–62.
[28] Steele JG, Johnson G, McFarland C, Dalton BA, Gengenbach TR, Chatelier RC,et al. Roles of serum vitronectin and fibronectin in initial attachment ofhuman vein endothelial cells and dermal fibroblasts on oxygen- and nitrogen-containing surfaces made by radiofrequency plasmas. J Biomater Sci Polym Ed1994;6(6):511–32.
[29] Steele JG, Johnson G, Underwood PA. Role of serum vitronectin and fibronectinin adhesion of fibroblasts following seeding onto tissue culture polystyrene.J Biomed Mater Res 1992;26(7):861–84.
[30] Eisenbarth E, Linez P, Biehl V, Velten D, Breme J, Hildebrand HF. Cell orien-tation and cytoskeleton organisation on ground titanium surfaces. Biomol Eng2002;19(2-6):233–7.
[31] Small JV, Rottner K, Kaverina I, Anderson KI. Assembling an actin cytoskeletonfor cell attachment and movement. Biochim Biophys Acta 1998;1404(3):271–81.
[32] Kennedy SB, Washburn NR, Simon Jr CG, Amis EJ. Combinatorial screen of theeffect of surface energy on fibronectin-mediated osteoblast adhesion,spreading and proliferation. Biomaterials 2006;27(20):3817–24.
[33] Bassell GJ, Powers CM, Taneja KL, Singer RH. Single mRNAs visualized byultrastructural in situ hybridization are principally localized at actin filamentintersections in fibroblasts. J Cell Biol 1994;126(4):863–76.
[34] van Kooten TG, Whitesides JF, von Recum A. Influence of silicone (PDMS)surface texture on human skin fibroblast proliferation as determined by cellcycle analysis. J Biomed Mater Res 1998;43(1):1–14.
[35] Martin I, Suetterlin R, Baschong W, Heberer M, Vunjak-Novakovic G, Freed LE.Enhanced cartilage tissue engineering by sequential exposure of chondrocytesto FGF-2 during 2D expansion and BMP-2 during 3D cultivation. J CellBiochem 2001;83(1):121–8.
[36] Martin I, Vunjak-Novakovic G, Yang J, Langer R, Freed LE. Mammalian chon-drocytes expanded in the presence of fibroblast growth factor 2 maintain theability to differentiate and regenerate three-dimensional cartilaginous tissue.Exp Cell Res 1999;253(2):681–8.
[37] Dalby MJ, Gadegaard N, Tare R, Andar A, Riehle MO, Herzyk P, et al. The controlof human mesenchymal cell differentiation using nanoscale symmetry anddisorder. Nat Mater 2007;6(12):997–1003.
[38] Engler AJ, Rehfeldt F, Sen S, Discher DE. Microtissue elasticity: measurementsby atomic force microscopy and its influence on cell differentiation. MethodsCell Biol 2007;83:521–45.
[39] Engler AJ, Sweeney HL, Discher DE, Schwarzbauer JE. Extracellular matrixelasticity directs stem cell differentiation. J Musculoskelet Neuronal Interact2007;7(4):335.
[40] Kurpinski K, Chu J, Hashi C, Li S. Anisotropic mechanosensing by mesenchymalstem cells. Proc Natl Acad Sci U S A 2006;103(44):16095–100.