the effect of sea-ice loss on beluga whales (delphinapterus leucas) in west greenland
TRANSCRIPT
The effect of sea-ice loss on beluga whales (Delphinapterusleucas) in West Greenlandpor_142 198..208
M.P. Heide-Jørgensen,1 K.L. Laidre,1,3 D. Borchers,2 T.A. Marques,2 H. Stern3 & M. Simon1
1 Greenland Institute of Natural Resources, Box 570, DK-3900 Nuuk, Greenland
2 Research Unit for Wildlife Population Assessment, Centre for Research into Ecological and Environmental Modelling, University of St. Andrews,
St. Andrews, Fife KY16 9LZ, UK
3 Polar Science Center, Applied Physics Laboratory, University of Washington, Box 355640, Seattle, WA 98105, USA
Abstract
An aerial survey was conducted to estimate the abundance of belugas (Delphi-napterus leucas) on their wintering ground in West Greenland in March–April2006 and 2008. The survey was conducted as a double platform aerial linetransect survey, and sampled approximately 17% of the total survey area of ca.125 000 km2. The abundance of belugas was 10 595 (95% confidence interval4904–24 650). The largest abundance was found at the northern part of StoreHellefiske Bank, at the eastern edge of the Baffin Bay pack ice, a pattern similarto that found in eight systematic surveys conducted since 1981. A clear rela-tionship between decreasing sea-ice cover and increasing offshore distance ofbeluga sightings was established from all previous surveys, suggesting thatbelugas expand their distribution westward as new areas on the banks of WestGreenland open up earlier in spring with reduced sea-ice coverage or earlyannual ice recession. This is in contrast to the relatively confined distribution ofbelugas near the coast in limited open areas in the early 1980s, when sea-icecover was greater. However, the effects of the changes in coastal availability ofbelugas can also be observed with the correlation between catches from thelocal Inuit hunt and sea-ice cover, where the catches increased significantlywith increasing sea-ice coverage during the period 1954–2006. These results,based on nearly 30 years of dedicated survey effort, are among the firstavailable evidence showing a shift in distribution of an Arctic cetacean inresponse to changes in sea-ice coverage.
KeywordsBeluga; climate change; line transect; sea ice;
West Greenland.
CorrespondanceMads Peter Heide-Jørgensen, Greenland
Institute of Natural Resources, Box 570,
DK-3900 Nuuk, Greenland. E-mail:
doi:10.1111/j.1751-8369.2009.00142.x
The beluga or white whale (Delphinapterus leucas) is amedium-sized odontocete whale that lives year-round inArctic waters. A large population that summers in theeastern Canadian High Arctic migrates eastward in fall,and overwinters either in the North Water Polynya orin the loose pack ice along West Greenland (Heide-Jørgensen et al. 2003). Belugas arrive in the northernpart of West Greenland in early October and move southalong the coast, arriving in Disko Bay in December. Theyremain scattered on the shallow banks along the WestGreenland coast during winter, where they feed andbenefit from the rich marine production in the area. Thenorthward spring migration begins sometime in April orMay. Belugas leave the areas south of Disko Island andmove north in the coastal open water along Uummannaq
and Upernavik. They are believed to cross Baffin Baysomewhere at the latitude of Upernavik (about 73°N),and they arrive at the ice edge in Lancaster Sound inCanada in May and June.
Beluga whales are one of the three cetacean speciesthat occupy Arctic waters essentially year-round.However, little is known about the effects of climatechange on this species, as there are few data sets in whicha single population has been systematically monitoredover a sufficiently long enough time period to detectchanges in abundance, distribution or behaviour, andcorrelate changes with changes in the environment. Thebeluga is believed to be a relatively flexible species in thatit preys upon a large number of different species and canoccupy a wide variety of different habitat types, ranging
Polar Research 29 2010 198–208 © 2009 the authors, journal compilation © 2009 Blackwell Publishing Ltd198
from High Arctic ice-covered waters to sub-Arctic estuar-ies. Because this whale is a relative generalist and is notassumed to be highly vulnerable to climate change(Laidre et al. 2008), it has been suggested that belugasmay be able to occupy new areas and exploit new eco-systems as sea-ice loss opens new regions within theirrange.
The winter occurrence of belugas in West Greenlandhas been used to index the population trends in the stockhunted from villages along the coast. The area in WestGreenland used by belugas during winter is typicallycovered with pack ice from January to May. Seasonalsea-ice cover in Baffin Bay has essentially confined thiswintering population to a relatively defined region, facili-tating a surveying effort that covered about 50 000 km2
between 1981 and 1999. The abundance of belugas wassurveyed eight times between 1981 and 1999 to providean index of the population size on the banks offWest Greenland (Heide-Jørgensen et al. 1993; Heide-Jørgensen & Reeves 1996; Heide-Jørgensen & Acquarone2002). In order to address important questions aboutthe effect of habitat changes on cetacean populations itis necessary to have long time series. The aerial surveysconducted off West Greenland since 1981 constitute theonly time series of winter habitat use by Arctic ceta-ceans that extends sufficiently far back in time toinclude a period when sea ice was not declining in theArctic. Detailed information on catches of belugas inWest Greenland covering the period back to 1954 isavailable.
It is well known that the effects and speed of climatechange are amplified in the Arctic, and that sea ice,because of the ice–albedo feedback, is an important factorin the Arctic amplification of global warming (e.g., Serreze& Francis 2006). The West Greenland area is a particularlysensitive climate area in the Arctic because of the compet-ing effects of the advection of warm, saline Atlantic waterto the West Greenland banks, and the simultaneousoutflow through Davis Strait of cold, low-saline water ofpolar origin. During the period 1952–2001 the extent ofsea ice in West Greenland increased slightly by 2.8% perdecade (Stern & Heide-Jørgensen 2003), but after 2001 adramatic decline in sea ice has been observed along WestGreenland (Comiso 2006; Greenland Institute of NaturalResources unpubl. data). It is therefore important to notonly obtain an updated estimate of beluga abundance, butalso to examine the impacts of changes in sea ice onmeasures of beluga abundance and distribution. This studyreports on the results from aerial surveys of the belugawintering grounds in West Greenland conducted in Marchand April 2006, and in April 2008, together with anexamination of changes in beluga distribution with respectto changes in sea-ice cover during the past 30 years.
Methods
Field methods
A visual aerial line-transect survey was conducted inWest Greenland between 21 March and 19 April 2006.The survey had two independent observation platformson each side of the survey plane (DeHavilland Twin Otterwith four bubble windows), with a target altitude of213 m a.s.l. and speed of 168 km h–1. Data on sightings(species and numbers), inclinometer readings of declina-tion angles to sightings and sighting conditions (sea stateand visibility) were continuously recorded on four taperecorders, together with time-stamp signals on positionfrom a Garmin 100 GPS device (Garmin International,Olathe, KS, USA). Following the design and stratificationused in previous surveys (see Heide-Jørgensen & Reeves1996) the survey covered 14 strata with east–westtransects systematically placed from south to north,beginning at Maniitsoq (65°30′N), and reaching NorthernUpernavik (74°N) in West Greenland. Additionaltransects sampled Disko Bay, Vaigat and Uummannaq(Fig. 1). The survey was abandoned if sea states increasedto more than 3 or if horizontal visibility was reduced toless than 1 km.
In April 2008 a supplementary survey systematicallycovered the area east of 56°W, and between 67 and 70°N.The survey used the same aircraft, four observers andsame survey procedures as in the 2006 survey, but is notused for abundance estimation. Sightings of belugas wererecorded on an sDVR-ms combined video, still image,GPS device and four audio channel recording system (RedHen Systems, Fort Collins, CO, USA).
Information on sea-ice conditions
Data on sea-ice conditions in Baffin Bay were derived frommonthly gridded sea-ice concentrations, measured bypassive microwave sensors from the scanning multichan-nel microwave radiometer (SMMR, 1978–1987) and thespecial sensor microwave imager (SSMI, on various satel-lites since 1987). This data set was augmented by the SSMIfrom the F13 satellite (from May 1995 to the present).Both data sets are derived using the bootstrap algorithmfor sea-ice concentration (Comiso 1995), and are availablefrom the National Snow and Ice Data Center. Sea-ice datafrom March 2008 were obtained from the SSMI F15 NearReal Time daily products (NASA Team algorithm).
Each sea-ice concentration grid for the Northern Hemi-sphere is 304 ¥ 448 pixels, and is mapped to a polarstereographic projection (true at 70°N) with a nominalpixel size of 25 ¥ 25 km. The “medium area” (boundaries:65–70°N, and from the west coast of Greenland to 58°W)along West Greenland defined in Stern & Heide-
The effect of sea-ice loss on beluga whalesM.P. Heide-Jørgensen et al.
Polar Research 29 2010 198–208 © 2009 the authors, journal compilation © 2009 Blackwell Publishing Ltd 199
Jørgensen (2003) was used for the estimation of theannual sea-ice extension in the beluga habitat in WestGreenland. The sea-ice concentration in March, typicallythe month with the largest concentration, was used tocompute an area-weighted average over all pixels toget the mean winter sea-ice concentration. Thus, themonthly estimates of ice concentration involved spatialand temporal averaging.
Sighting data
Declination angles (q) were converted to perpendiculardistances (r) using the formula:
r2 2 2213 180 213= [ ] −( )sin * .θ π
A total of 119 beluga sightings were recorded. Five ofthose did not have a recorded declination angle, and twolacked information on cluster size. These were excludedfrom the analysis to avoid bias from sightings with
missing information, resulting in 112 sightings to be usedin further analysis. Beaufort sea state 0 was assigned to 13sightings without an associated Beaufort value, as thegeneral sea-state condition was known during the track-line upon which they were obtained.
Detection function model selection
Detection probability was estimated using the “pointindependence” method with independent observer con-figuration (Laake & Borchers 2004; Borchers et al. 2006),implemented in DISTANCE 5.0 (Thomas et al. 2006). Thismethod involved estimating a multiple covariate distancesampling model (mcds model) for combined platformdetections assuming certain detection at distance zero,and a mark–recapture distance sampling model (mrdsmodel) for each of the independent observers using alogistic detection function model. The intercept of themrds model was used to estimate detection probability at
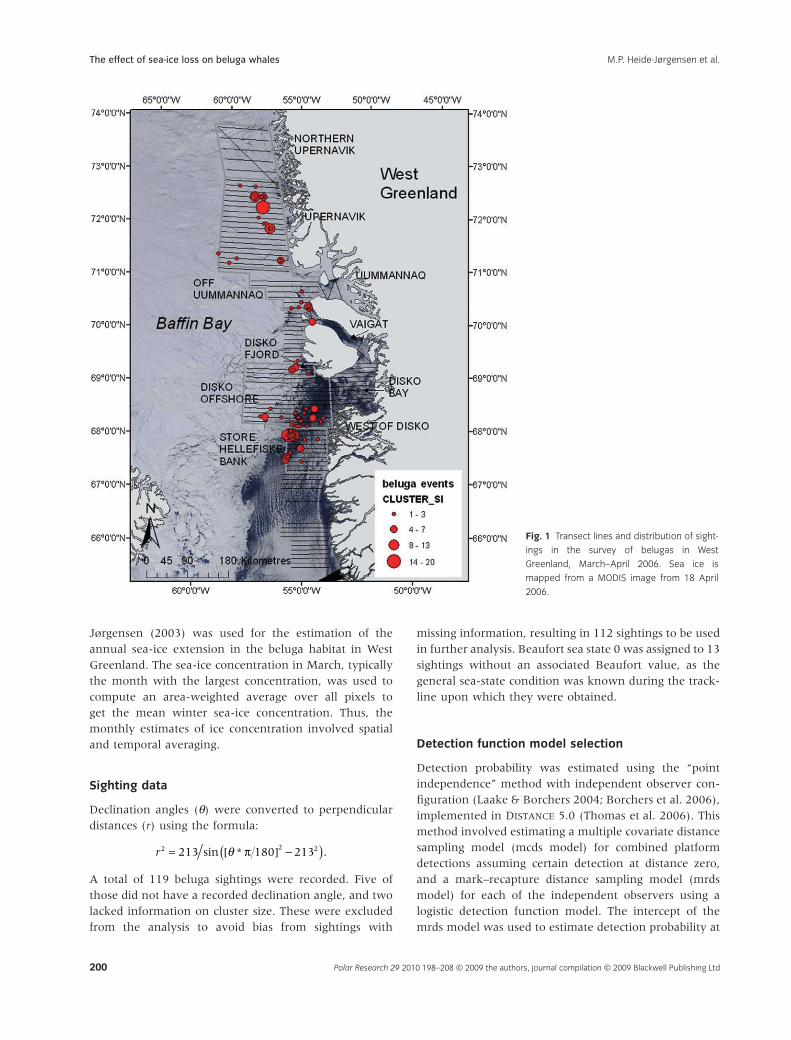
Fig. 1 Transect lines and distribution of sight-
ings in the survey of belugas in West
Greenland, March–April 2006. Sea ice is
mapped from a MODIS image from 18 April
2006.
The effect of sea-ice loss on beluga whales M.P. Heide-Jørgensen et al.
Polar Research 29 2010 198–208 © 2009 the authors, journal compilation © 2009 Blackwell Publishing Ltd200
distance zero, whereas the mcds model was used to esti-mate detection function shape (see Laake & Borchers2004 and Borchers et al. 2006 for further details). Modelswere chosen on the basis of Akaike’s information criterion(AIC). Forward selection was used to choose betweenmodels based on AIC values. First, half-normal andhazard-rate key functions were tested with no covariates.
A regression of log of pod size on log of detectionfunction was used to estimate an unbiased mean pod sizefor each stratum (Ê[s]). The estimates for pod abundanceand density by stratum were multiplied by the mean podsize by stratum to obtain estimates of individual abun-dance and density by stratum. Total pod abundance anddensity estimates were also multiplied by the total meanpod size to obtain total individual abundance and densityestimates.
Pod density and abundance were estimated as follows,corrected for availability bias following Laake et al.(1997) and Pollock et al (2006):
ˆˆ ˆ
Np a
podii
n
=( )=
∑ 1
01
and
ˆˆ
,DN
Apod =
where A is the total area, n is the number of detections, p̂i
is the estimated probability of detecting pod i and â(0) isthe estimated proportion of time animals are available fordetection. Time at surface was calculated as themean of the correction factors from two previous surveys,to correct for availability bias (Heide-Jørgensen &Acquarone 2002; Innes et al. 2002). To include the popu-lation variance on the surfacing time, an estimate of thecoefficient of variation was set to 0.09, or slightly lessthan the coefficient of variation (cv, standard error inproportion to the mean) reported for a small sample(n = 4) of narwhals (Monodon monoceros) (cv = 0.13).This was equal to an instantaneous correction factorâ(0) = 0.43 (cv = 0.09).
Assuming independence between components, the cvof the abundance and density estimates were estimated asfollows:
c v N c v c v c vN E s apodˆ .ˆ ˆ ˆ( ) = + +( ) ( )
2 20
2
The 95 and 90% confidence intervals (CIs) were calcu-lated following the derivation of Burnham et al. (1987, inBuckland et al. 2001: 77).
Interannual comparison of beluga locations
In the region between 67 and 70°N beluga abundance hasbeen surveyed systematically with the same east–west
transect lines in 1981, 1982, 1990, 1991, 1993, 1994,1998 and 1999, allowing for comparison of the distribu-tion of whales in this area (Heide-Jørgensen et al. 1993;Heide-Jørgensen & Reeves 1996; Heide-Jørgensen &Acquarone 2002). Surveys after 1990 relied on GPS, thesurveys in 1981 and 1982 used the GNS 500 global navi-gational system device (Garmin International), and thesurvey in 1990 used a 3000 Omega navigational systemdevice (Litton Industries, acquired in 2001 by NorthrupGrumman, Los Angeles, CA, USA). Surveys in 1981 and1982 of Baffin Bay and Davis Strait found no belugas westof 56°W in late March (Heide-Jørgensen et al. 1993), solater surveys were restricted to 56°W. The comparisonbetween years with surveys was constrained to a subsetof longitudes that were surveyed in all years, whichextended to 56°W, and were located between 67 and70°N.
The mean longitude of beluga sightings (in decimaldegrees) in each survey year within the restricted areawas calculated. In each year the mean longitude wasexamined with respect to sea-ice concentration in the“medium area” (see above), which has been shown to becorrelated with the sea-ice conditions in the surveyedarea (see Heide-Jørgensen & Laidre 2004).
Results
Distribution of belugas
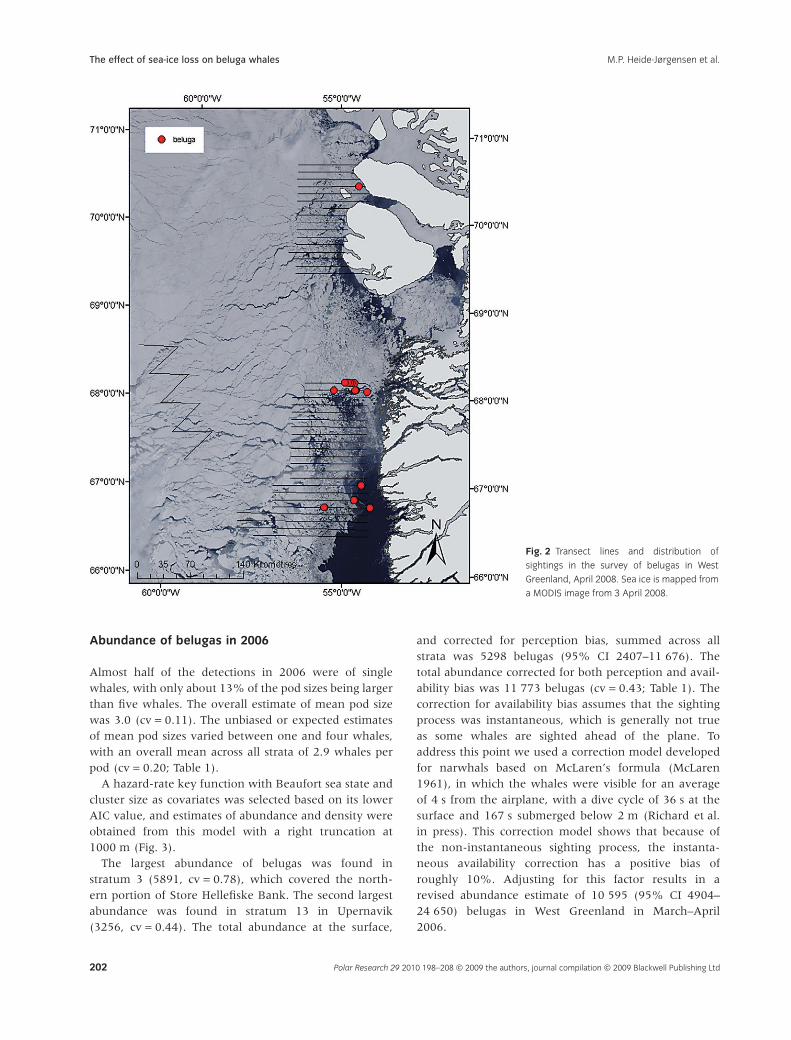
The surveys were conducted between 21 March and 19April 2006, and between 3 and 12 April 2008, beginningin the southern strata (Figs. 1, 2). Because of inclementweather conditions most work was completed between 7and 24 April 2006 (Table 1).
In 2006 belugas were primarily found in coastal areasalong West Greenland and over shallow water (<200 mdeep). No belugas were found south of 67°N or north of73°N, and none were detected in Disko Bay and in Uum-mannaq. Belugas were seen in the highest densities atthe northern edge of Store Hellefiske Bank, just west ofDisko Island, in the northern opening of Vaigat and offUpernavik. At the northern edge of Store HellefiskeBank, belugas were observed at the western end of thetransect indicating that whales may have been presenteven further west in this area. Few whales were seen inopen water, and they seemed to be closely associatedwith the eastern margin of the pack ice that covers mostof Baffin Bay and Davis Strait (Fig. 1). In 2008 thebelugas were more restricted in their offshore distribu-tion because of the wider distribution of pack ice, andmost sightings were made in open water close to thecoast (Fig. 2).
The effect of sea-ice loss on beluga whalesM.P. Heide-Jørgensen et al.
Polar Research 29 2010 198–208 © 2009 the authors, journal compilation © 2009 Blackwell Publishing Ltd 201
Abundance of belugas in 2006
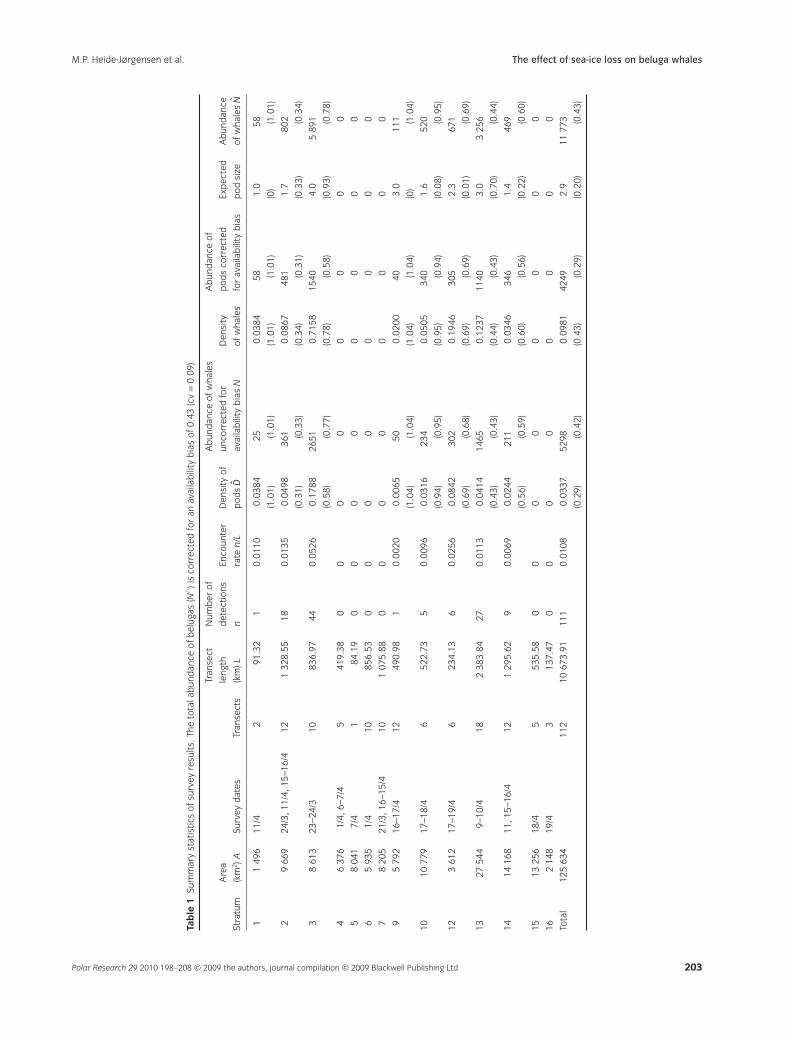
Almost half of the detections in 2006 were of singlewhales, with only about 13% of the pod sizes being largerthan five whales. The overall estimate of mean pod sizewas 3.0 (cv = 0.11). The unbiased or expected estimatesof mean pod sizes varied between one and four whales,with an overall mean across all strata of 2.9 whales perpod (cv = 0.20; Table 1).
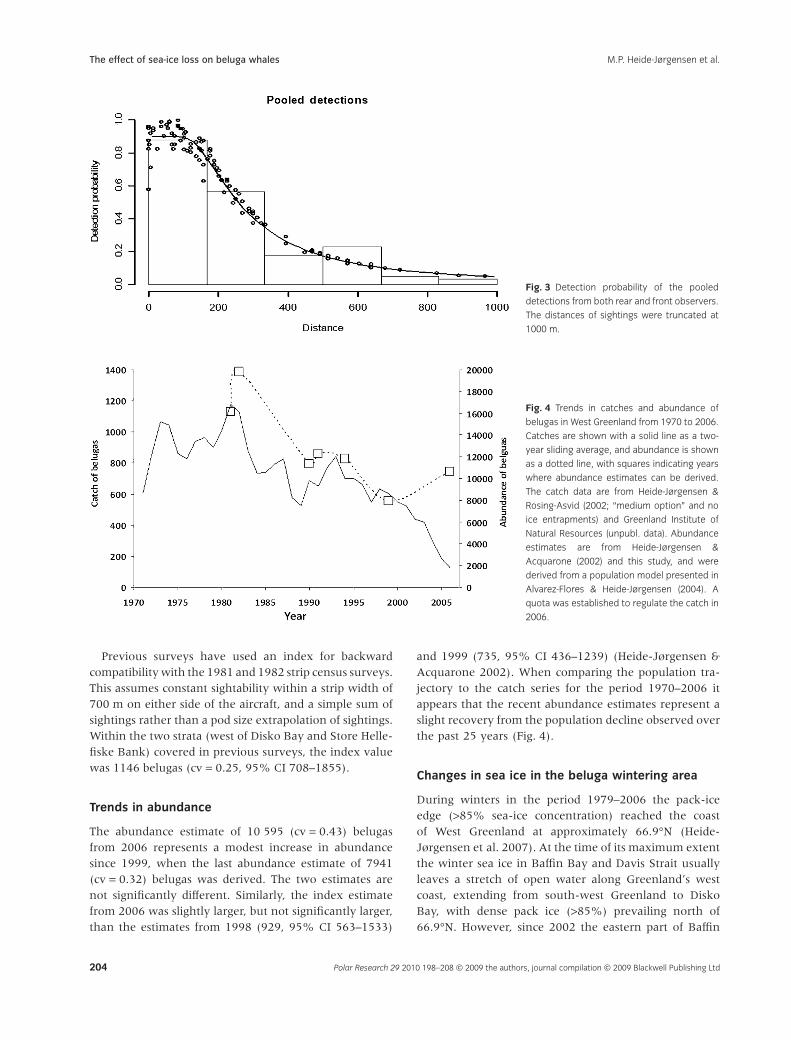
A hazard-rate key function with Beaufort sea state andcluster size as covariates was selected based on its lowerAIC value, and estimates of abundance and density wereobtained from this model with a right truncation at1000 m (Fig. 3).
The largest abundance of belugas was found instratum 3 (5891, cv = 0.78), which covered the north-ern portion of Store Hellefiske Bank. The second largestabundance was found in stratum 13 in Upernavik(3256, cv = 0.44). The total abundance at the surface,
and corrected for perception bias, summed across allstrata was 5298 belugas (95% CI 2407–11 676). Thetotal abundance corrected for both perception and avail-ability bias was 11 773 belugas (cv = 0.43; Table 1). Thecorrection for availability bias assumes that the sightingprocess was instantaneous, which is generally not trueas some whales are sighted ahead of the plane. Toaddress this point we used a correction model developedfor narwhals based on McLaren’s formula (McLaren1961), in which the whales were visible for an averageof 4 s from the airplane, with a dive cycle of 36 s at thesurface and 167 s submerged below 2 m (Richard et al.in press). This correction model shows that because ofthe non-instantaneous sighting process, the instanta-neous availability correction has a positive bias ofroughly 10%. Adjusting for this factor results in arevised abundance estimate of 10 595 (95% CI 4904–24 650) belugas in West Greenland in March–April2006.
Fig. 2 Transect lines and distribution of
sightings in the survey of belugas in West
Greenland, April 2008. Sea ice is mapped from
a MODIS image from 3 April 2008.
The effect of sea-ice loss on beluga whales M.P. Heide-Jørgensen et al.
Polar Research 29 2010 198–208 © 2009 the authors, journal compilation © 2009 Blackwell Publishing Ltd202
Tab
le1
Sum
mar
yst
atis
tics
ofsu
rvey
resu
lts.T
heto
tala
bun
dan
ceof
bel
ugas
(N�
)is
corr
ecte
dfo
ran
avai
lab
ility
bia
sof
0.43
(cv
=0.
09).
Stra
tum
Are
a
(km
2 )ASu
rvey
dat
esTr
anse
cts
Tran
sect
leng
th
(km
)L
Num
ber
of
det
ectio
ns
n
Enco
unte
r
rate
n/L
Den
sity
of
pod
sD̂
Ab
und
ance
ofw
hale
s
unco
rrec
ted
for
avai
lab
ility
bia
sN
Den
sity
ofw
hale
s
Ab
und
ance
of
pod
sco
rrec
ted
for
avai
lab
ility
bia
s
Exp
ecte
d
pod
size
Ab
und
ance
ofw
hale
sN̂
11
496
11/4
291
.32
10.
0110
0.03
8425
0.03
8458
1.0
58
(1.0
1)(1
.01)
(1.0
1)(1
.01)
(0)
(1.0
1)
29
669
24/3
,11/
4,15
–16/
412
132
8.55
180.
0135
0.04
9836
10.
0867
481
1.7
802
(0.3
1)(0
.33)
(0.3
4)(0
.31)
(0.3
3)(0
.34)
38
613
23–2
4/3
1083
6.97
440.
0526
0.17
8826
510.
7158
1540
4.0
589
1
(0.5
8)(0
.77)
(0.7
8)(0
.58)
(0.9
3)(0
.78)
46
376
1/4,
6–7/
45
419.
380
00
00
00
0
58
041
7/4
184
.19
00
00
00
00
65
935
1/4
1085
6.53
00
00
00
00
78
205
21/3
,16–
15/4
101
075.
880
00
00
00
0
95
792
16–1
7/4
1249
0.98
10.
0020
0.00
6550
0.02
0040
3.0
111
(1.0
4)(1
.04)
(1.0
4)(1
.04)
(0)
(1.0
4)
1010
779
17–1
8/4
652
2.73
50.
0096
0.03
1623
40.
0505
340
1.6
520
(0.9
4)(0
.95)
(0.9
5)(0
.94)
(0.0
8)(0
.95)
123
612
17–1
9/4
623
4.13
60.
0256
0.08
4230
20.
1946
305
2.3
671
(0.6
9)(0
.68)
(0.6
9)(0
.69)
(0.0
1)(0
.69)
1327
544
9–10
/418
238
3.84
270.
0113
0.04
1414
650.
1237
1140
3.0
325
6
(0.4
3)(0
.43)
(0.4
4)(0
.43)
(0.7
0)(0
.44)
1414
168
11,1
5–16
/412
129
5.62
90.
0069
0.02
4421
10.
0346
346
1.4
469
(0.5
6)(0
.59)
(0.6
0)(0
.56)
(0.2
2)(0
.60)
1513
256
18/4
553
5.58
00
00
00
00
162
148
19/4
313
7.47
00
00
00
00
Tota
l12
563
411
210
673.
9111
10.
0108
0.03
3752
980.
0981
4249
2.9
1177
3
(0.2
9)(0
.42)
(0.4
3)(0
.29)
(0.2
0)(0
.43)
The effect of sea-ice loss on beluga whalesM.P. Heide-Jørgensen et al.
Polar Research 29 2010 198–208 © 2009 the authors, journal compilation © 2009 Blackwell Publishing Ltd 203
Previous surveys have used an index for backwardcompatibility with the 1981 and 1982 strip census surveys.This assumes constant sightability within a strip width of700 m on either side of the aircraft, and a simple sum ofsightings rather than a pod size extrapolation of sightings.Within the two strata (west of Disko Bay and Store Helle-fiske Bank) covered in previous surveys, the index valuewas 1146 belugas (cv = 0.25, 95% CI 708–1855).
Trends in abundance
The abundance estimate of 10 595 (cv = 0.43) belugasfrom 2006 represents a modest increase in abundancesince 1999, when the last abundance estimate of 7941(cv = 0.32) belugas was derived. The two estimates arenot significantly different. Similarly, the index estimatefrom 2006 was slightly larger, but not significantly larger,than the estimates from 1998 (929, 95% CI 563–1533)
and 1999 (735, 95% CI 436–1239) (Heide-Jørgensen &Acquarone 2002). When comparing the population tra-jectory to the catch series for the period 1970–2006 itappears that the recent abundance estimates represent aslight recovery from the population decline observed overthe past 25 years (Fig. 4).
Changes in sea ice in the beluga wintering area
During winters in the period 1979–2006 the pack-iceedge (>85% sea-ice concentration) reached the coastof West Greenland at approximately 66.9°N (Heide-Jørgensen et al. 2007). At the time of its maximum extentthe winter sea ice in Baffin Bay and Davis Strait usuallyleaves a stretch of open water along Greenland’s westcoast, extending from south-west Greenland to DiskoBay, with dense pack ice (>85%) prevailing north of66.9°N. However, since 2002 the eastern part of Baffin
Fig. 3 Detection probability of the pooled
detections from both rear and front observers.
The distances of sightings were truncated at
1000 m.
Fig. 4 Trends in catches and abundance of
belugas in West Greenland from 1970 to 2006.
Catches are shown with a solid line as a two-
year sliding average, and abundance is shown
as a dotted line, with squares indicating years
where abundance estimates can be derived.
The catch data are from Heide-Jørgensen &
Rosing-Asvid (2002; “medium option” and no
ice entrapments) and Greenland Institute of
Natural Resources (unpubl. data). Abundance
estimates are from Heide-Jørgensen &
Acquarone (2002) and this study, and were
derived from a population model presented in
Alvarez-Flores & Heide-Jørgensen (2004). A
quota was established to regulate the catch in
2006.
The effect of sea-ice loss on beluga whales M.P. Heide-Jørgensen et al.
Polar Research 29 2010 198–208 © 2009 the authors, journal compilation © 2009 Blackwell Publishing Ltd204
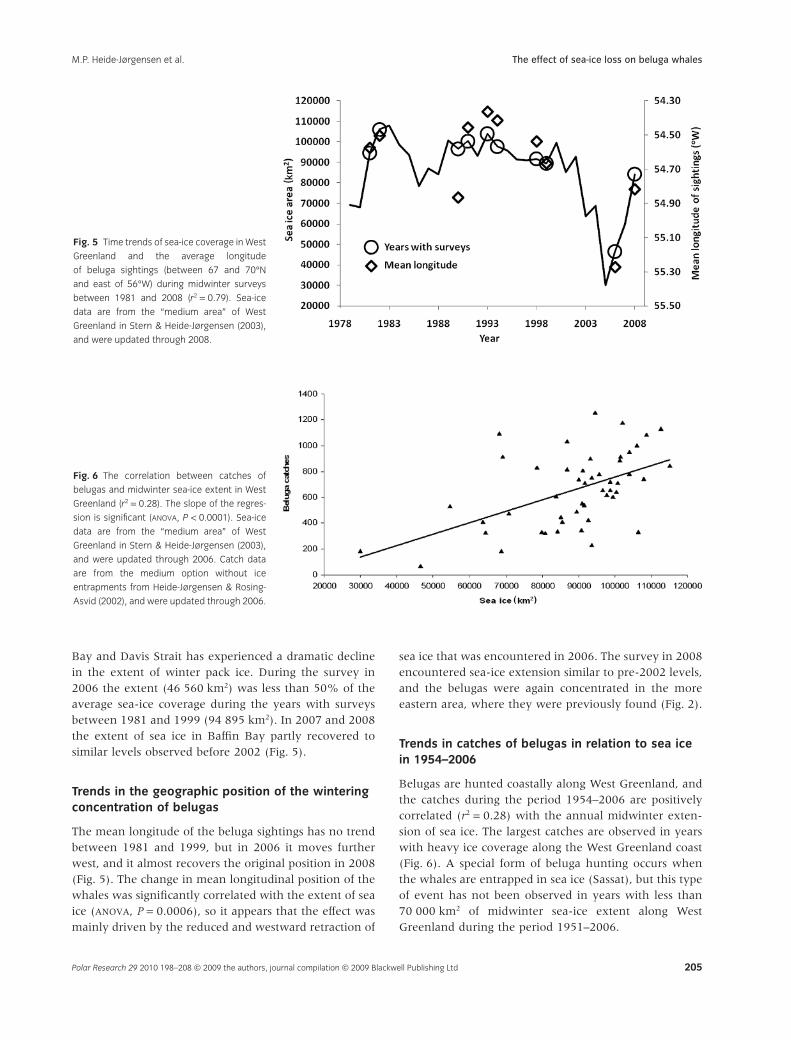
Bay and Davis Strait has experienced a dramatic declinein the extent of winter pack ice. During the survey in2006 the extent (46 560 km2) was less than 50% of theaverage sea-ice coverage during the years with surveysbetween 1981 and 1999 (94 895 km2). In 2007 and 2008the extent of sea ice in Baffin Bay partly recovered tosimilar levels observed before 2002 (Fig. 5).
Trends in the geographic position of the winteringconcentration of belugas
The mean longitude of the beluga sightings has no trendbetween 1981 and 1999, but in 2006 it moves furtherwest, and it almost recovers the original position in 2008(Fig. 5). The change in mean longitudinal position of thewhales was significantly correlated with the extent of seaice (ANOVA, P = 0.0006), so it appears that the effect wasmainly driven by the reduced and westward retraction of
sea ice that was encountered in 2006. The survey in 2008encountered sea-ice extension similar to pre-2002 levels,and the belugas were again concentrated in the moreeastern area, where they were previously found (Fig. 2).
Trends in catches of belugas in relation to sea icein 1954–2006
Belugas are hunted coastally along West Greenland, andthe catches during the period 1954–2006 are positivelycorrelated (r2 = 0.28) with the annual midwinter exten-sion of sea ice. The largest catches are observed in yearswith heavy ice coverage along the West Greenland coast(Fig. 6). A special form of beluga hunting occurs whenthe whales are entrapped in sea ice (Sassat), but this typeof event has not been observed in years with less than70 000 km2 of midwinter sea-ice extent along WestGreenland during the period 1951–2006.
Fig. 5 Time trends of sea-ice coverage in West
Greenland and the average longitude
of beluga sightings (between 67 and 70°N
and east of 56°W) during midwinter surveys
between 1981 and 2008 (r2 = 0.79). Sea-ice
data are from the “medium area” of West
Greenland in Stern & Heide-Jørgensen (2003),
and were updated through 2008.
Fig. 6 The correlation between catches of
belugas and midwinter sea-ice extent in West
Greenland (r2 = 0.28). The slope of the regres-
sion is significant (ANOVA, P < 0.0001). Sea-ice
data are from the “medium area” of West
Greenland in Stern & Heide-Jørgensen (2003),
and were updated through 2006. Catch data
are from the medium option without ice
entrapments from Heide-Jørgensen & Rosing-
Asvid (2002), and were updated through 2006.
The effect of sea-ice loss on beluga whalesM.P. Heide-Jørgensen et al.
Polar Research 29 2010 198–208 © 2009 the authors, journal compilation © 2009 Blackwell Publishing Ltd 205
Discussion
Changes in distribution and the effect of sea ice
The distribution of beluga whales based on sightings fromthe survey in 2006 shares three characteristics with pre-vious surveys. First, the stratum on Store Hellefiske Bankwas clearly the most important area for belugas in WestGreenland. In 2006, approximately 50% of the totalabundance was found in this area, compared with theaverage between 1981 and 1999 of 41% (range 15–51%).Second, no belugas were found inside Disko Bay, agree-ing well with the distribution from past surveys. Third,belugas found in the northern part of Vaigat confirm thatthis is an important wintering area, agreeing well withpast survey results.
There are important differences between the distribu-tion of belugas in the 2006 survey and previous years.The area south of Store Hellefiske Bank had no sightingsof belugas in 2006, and contributed nothing to the overallabundance estimate. In contrast, all eight surveys con-ducted in the period 1981 to 1999 had sightings in thisarea (Heide-Jørgensen et al. 1993; Heide-Jørgensen &Reeves 1996; Heide-Jørgensen & Acquarone 2002), sug-gesting that the distribution of belugas in West Greenlandhas shifted northward. The average contribution to thetotal abundance from this area in the previous surveyswas 38% (range 14–67%). In contrast, about 43% of thetotal abundance estimate in 2006 came from areaslocated north of Disko Island. The surveys in 1982 and1990 attempted to survey parts of these northern areas;however, searches north of Disko Bay were abandonedbecause of a lack of sightings north of Vaigat, and becauseof heavy sea-ice coverage.
The decline in sea-ice coverage of the eastern part ofBaffin Bay between 2002 and 2006 probably providedbelugas access to a larger area, and allowed the winteringstock to be more widely dispersed over the banks of WestGreenland. In the surveys before 2006, extensive sea-icecoverage only provided open water for the belugas alongthe coast south of Disko Island and in the polynya inVaigat, and restricted both the areas belugas could use aswell as the areas that were considered important tosurvey for belugas. In 2008 it could be observed that thewestward transition of the belugas was reversible withthe recovery of sea-ice extension in 2007 and 2008.
The changes in sea-ice conditions in West Greenlandhave been dramatic, especially after 2002, when abouthalf the midwinter ice disappeared compared with the icecoverage between 1981 and 2002. This change in spring-time physical conditions happened directly over thewintering ground for belugas in Baffin Bay, and has evi-dently affected the distribution of the whales. The
formation of sea ice forces the whales closer to the coastin more restricted areas, where they can be targeted bylocal Inuit hunters and where they are picked up by thesurveys. With the loss and westward retraction of sea ice,belugas have followed the ice over deeper water towardsthe edge of the banks. Local observations have noted theabsence of whales in coastal areas during 2002–06, and itis also evident that there is a reduced availability for thecoastal hunt of belugas. The opening of sea ice along thecoast has also allowed a large number of belugas to travelnorth in spring towards Upernavik, to an area inaccessibleto hunters, where they are not known to be found earlyin spring.
Trends and abundance estimates
The declining abundance of belugas in West Greenlandhas been observed from 1981 to 1999 (Heide-Jørgensen& Acquarone 2002). The population in 2000 was esti-mated to number only 22% of its size in 1954, and thedecline was attributed to overharvesting (Alvarez-Flores& Heide-Jørgensen 2004). The period from 1979 to 2001,when the decline was detected, had a slightly increasingsea-ice concentration in eastern Baffin Bay/West Green-land, of 3.5% per decade (Stern and Heide-Jørgensen2003). During this period a smaller area of open waterwas available for belugas wintering in West Greenland,restricting the whales to the coastal areas captured by thesurveys. This was demonstrated in the survey in March1981, when no belugas were detected in the offshoreareas of Baffin Bay (Heide-Jørgensen et al. 1993). Also,satellite tracking of belugas fitted with transmitters in2001 showed their fidelity to coastal areas in West Green-land (Heide-Jørgensen et al. 2003). During the period ofpopulation decline the ice coverage was relatively con-stant or slightly increasing. The beluga decline is thereforeunlikely to be linked to sea-ice changes. In 2006 the iceconditions had changed dramatically, with the conse-quence being that the belugas were spread out over alarger area, seeking the edge of the offshore banks. Thedecline in ice coverage in 2006 also left an area almosttwice as large as previous years to be surveyed. Interest-ingly, in 2008 ice coverage again increased, and thebelugas were more coastal in their central distributionthan in 2006, although their abundance could not beestimated.
The total abundance corrected for both perception andavailability bias was 10 595 belugas (95% CI 5260–26 400). The latest survey of belugas in West Greenlandwas conducted in 1998 and 1999, and the similarly fullycorrected abundance estimate was 7941 belugas (95% CI3650–17 278) (Heide-Jørgensen & Acquarone 2002).This value is not statistically different from the result from
The effect of sea-ice loss on beluga whales M.P. Heide-Jørgensen et al.
Polar Research 29 2010 198–208 © 2009 the authors, journal compilation © 2009 Blackwell Publishing Ltd206
the current survey, despite the fully corrected point esti-mate being higher.
Factors that might have contributed to the recentincrease in the abundance of belugas in West Greenlandinclude a decline in catches since the mid-1990s. Catcheshave been below 500 per year since 1999, and a newquota installed in 2004 limited the catches to 160 whalesper year, considerably less than the average catch level off688 belugas per year in the 1990s. Furthermore, no iceentrapments of belugas have been observed since 1990,which suggests a reduction in large-scale natural mortal-ity events.
Conclusion
The time series on beluga locations in winter in WestGreenland presented here was not collected with thepurpose of observing the effects of climate change onbeluga habitat selection. Nevertheless, it is one of the fewtime series of winter occurrence of Arctic whales thatgoes sufficiently far back in time to assess the situationbefore the dramatic sea-ice recession. The migratorypattern of the belugas seems to be shaped by the annualcycle in freeze-up and sea-ice retraction over longer timeperiods.
It is clear that the belugas that winter in West Green-land prefer to stay close to the edge of the pack ice, andthat they utilize any loosening in the pack ice to movefurther north or further west to more offshore areas. It isnevertheless difficult to predict what will happen in thefuture given that sea-ice coverage increased slightly until2002, after which time it showed a dramatic declinethrough 2006, but partially recovered in 2008. So there iscurrently no monotonic trend on which to base predic-tions. If the recovery in sea ice continues then thesituation will return to “normal”, i.e., the situationobserved in the1980s. If a decline in sea-ice distributioncontinues the whales are expected to be more widespreadin the offshore areas of Davis Strait–Baffin Bay in thefuture. Belugas seem to be able to respond well to large-scale habitat changes. Global warming and sea-icedeclines may pose less of a problem for belugas than toother Arctic marine mammals.
Acknowledgements
The observers Fernando Ugarte, Karolina Platou Larsen,Arne Geisler and Aili Labansen are gratefully acknowl-edged for their contribution. Air Greenland and severalskilled crews operated the Twin Otter. The survey in2006 was funded by the Greenland Institute of NaturalResources. The aerial survey in 2008 was funded by theUS National Aeronautics and Space Administration, and
funding for the Red Hen recording system was obtainedfrom the Vetlessen Foundation. HS acknowledges supportfrom the US National Science Foundation.
References
Alvarez-Flores C. & Heide-Jørgensen M.P. 2004. Riskassessment of the beluga (Delphinapterus leucas) harvestin West Greenland. ICES Journal of Marine Science 61,774–786.
Borchers D.L., Laake J.L., Southwell C. & Paxton C.G.M.2006. Accommodating unmodelled heterogeneity indouble-observer distance sampling surveys. Biometrics 62,372–378.
Buckland S.T., Anderson D.R., Burnham K.P., Laake J.L.,Borchers D.L. & Thomas L. 2001. Introduction to distancesampling: estimating abundance of biological populations. NewYork: Oxford University Press.
Comiso J.C. 1995. SSM/I sea ice concentrations using thebootstrap algorithm. NASA Reference Publication 1380.Greenbelt, MD: Goddard Space Flight Center.
Comiso J. 2006. Abrupt decline in the Arctic winter sea icecover. Geophysical Research Letters 33, L18594, doi: 10.1029/2006GL027341.
Heide-Jørgensen M.P. & Acquarone M. 2002. Size and trendsof the bowhead, beluga and narwhal stocks wintering offWest Greenland. Scientific Publications of the North AtlanticMarine Mammal Commission 4, 191–210.
Heide-Jørgensen M.P. & Laidre K.L. 2004. Declining extentof open water refugia for top predators in Baffin Bay andadjacent waters. Ambio 33, 488–495.
Heide-Jørgensen M.-P., Lassen H., Teilmann J. & Davis R.A.1993. An index of the relative abundance of winteringbelugas, Delphinapterus leucas, and narwhals, Monodonmonoceros, off West Greenland. Canadian Journal of Fisheriesand Aquatic Sciences 50, 2323–2335.
Heide-Jørgensen M.P. & Reeves R.R. 1996. Evidence of adecline in beluga abundance (Delphinapterus leucas) offWest Greenland. ICES Journal of Marine Science 53,61–72.
Heide-Jørgensen M.P., Richard P., Dietz R., Laidre K.L. & OrrJ. 2003. An estimate of the fraction of belugas(Delphinapterus leucas) in the Canadian High Arcticthat winter in West Greenland. Polar Biology 23,318–326.
Heide-Jørgensen M.P. & Rosing-Asvid A. 2002. Catchstatistics for belugas in West Greenland 1862 to 1999.Scientific Publications of the North Atlantic Marine MammalCommission 4, 127–142.
Heide-Jørgensen M.P., Stern H. & Laidre K. 2007. Dynamicsof the sea ice edge in Davis Strait. Journal of Marine Systems67, 170–178, doi: 10.1016/j.jmarsys.2006.10.011.
Innes S., Heide-Jørgensen M.P., Laake J., Laidre K.L., CleatorH., Richard P. & Stewart R.E.A. 2002. Surveys of belugasand narwhals in the Canadian High Arctic in 1996.Scientific Publications of the North Atlantic Marine MammalCommission 4, 169–190.
The effect of sea-ice loss on beluga whalesM.P. Heide-Jørgensen et al.
Polar Research 29 2010 198–208 © 2009 the authors, journal compilation © 2009 Blackwell Publishing Ltd 207
Laake J.L. & Borchers D.L. 2004. Methods for incompletedetection at distance zero. In S.T. Buckland et al. (eds.):Advanced distance sampling. Pp. 108–189. Oxford: OxfordUniversity Press.
Laake J., Calambokidis J., Osmek S.D. & Rugh D.J. 1997.Probability of detecting harbour porpoise from aerialsurveys: estimating g(0). Journal of Wildlife Management 61,63–75.
Laidre K.L., Stirling I., Lowry L.F., Wiig Ø., Heide-JørgensenM.P. & Ferguson S.H. 2008. Quantifying the sensitivity ofArctic marine mammals to climate-induced habitat change.Ecological Applications 18, S97–S125.
McLaren I.A. 1961. Methods for determining the numbersand availability of ringed seals in the eastern CanadianArctic. Arctic 14, 162–175.
Pollock K.H., Marsh H.D., Lawler I.R. & Alldredge M.W.2006. Estimating animal abundance in heterogeneous
environments: an application to aerial surveys fordugongs. Journal of Wildlife Management 70, 225–262.
Richard P.R., Hobbs R.C., Laake J.L., Heide-Jørgensen M.P.,Asseli N. & Cleator H. In press. Baffin Bay narwhalpopulation distribution and numbers: aerial surveys in theCanadian High Arctic, 2002–2004. Arctic.
Serreze M.C. & Francis J.A. 2006. The Arctic amplificationdebate. Climate Change 76, 241–264, doi: 10.1007/s10584-005-9017-y.
Stern H.L. & Heide-Jørgensen M.P. 2003. Variability of seaice in Baffin Bay and Davis Strait. Polar Research 22, 11–18.
Thomas L., Laake J.L., Strindberg S., Marques F.F.C.,Buckland S.T., Borchers D.L., Anderson D.R., BurnhamK.P., Hedley S.L., Pollard J.H., Bishop J.R.B. & MarquesT.A. 2006. Distance 5.0. St. Andrews: Research Unit forWildlife Population Assessment, University of St. Andrews.
The effect of sea-ice loss on beluga whales M.P. Heide-Jørgensen et al.
Polar Research 29 2010 198–208 © 2009 the authors, journal compilation © 2009 Blackwell Publishing Ltd208